 filings.tools
Jack Henry & Associates (JKHY) 10-K risk factor changes: FY2012 vs FY2011
The 2012-06-30 10-K against the 2011-06-30 one, compared heading by heading and sentence by sentence. One of these filings carries no fiscal year tag, so its year is the calendar year of the period end.
Item 1A19 rewritten20 added14 removed57 unchanged
All filing items974 rewritten742 added705 removed730 unchanged
Summary
counted, not written
- Item 1A headings could not be compared: only 0 carried over between the two years, which usually means one filing was read wrongly, so none is reported as new or removed.
- Sentence by sentence, 742 added, 705 removed, 974 rewritten and 730 unchanged across 18 items that differ.
- New this year: Item 4. MINE SAFETY DISCLOSURES.
Sentences by item
21 items, with every count and a link to each item that changed
Underlined words on a shaded ground are new in FY2012; struck-through words were in FY2011. Sentences that are wholly new or wholly gone are labelled rather than marked.
Item 1A. RISK FACTORS
19 rewritten, 20 added, 14 removed, 57 unchanged
[removed: Our business may be adversely impacted by U.S. and global market and economic conditions.] We derive most of our revenue from products and services we provide to the financial services industry.
[removed: Changes] [added: Changes] in the banking and credit union industry could reduce demand for our [removed: products.][added: products.]
[removed: Competition] [added: Competition] or general economic conditions may result in decreased demand or require price reductions or other concessions to customers which could result in lower margins and reduce [removed: income. We vigorously compete with a variety of software vendors in all of our major product lines.][added: income.]
[removed: Security problems could damage our reputation and business.] We rely on industry-standard encryption, network and Internet security systems, most of which we license from third parties, to provide the security and authentication necessary to effect secure transmission of data.
Computer networks and the Internet are vulnerable to unauthorized access, computer viruses and other disruptive [removed: problems.][added: problems such as denial of service attacks and other forms of cyber-terrorism.]
[removed: If we fail to adapt our products and services to changes in technology, we could lose existing customers and be unable to attract new business.] The markets for our software and hardware products and services are characterized by changing customer requirements and rapid technological changes.
[removed: Consolidation] [added: Consolidation] and failures of financial institutions will continue to reduce the number of our customers and potential [removed: customers. Our primary market consists of approximately 7,600 commercial and savings banks and 7,600 credit unions.][added: customers.]
[removed: The] [added: The] services we provide to our customers are subject to government regulation that could hinder the development of portions of our business or impose constraints on the way we conduct our [removed: operations. The financial services industry is subject to extensive and complex federal and state regulation.][added: operations.]
[removed: The software we provide to our customers is also affected by government regulation.] We are generally obligated to our customers to provide software solutions that comply with applicable federal and state regulations.
[removed: Failures] [added: Failures] associated with payment transactions could result in a financial [removed: loss. The volume and dollar amount of payment transactions that we process is very large and continues to grow.][added: loss.]
[removed: An operational failure in our outsourcing facilities could cause us to lose customers.] Damage or destruction that interrupts our outsourcing operations could damage our relationship with customers and may cause us to incur substantial additional expense to repair or replace damaged equipment.
[removed: We may not be able to manage growth.] We have grown both internally and through acquisitions.
[removed: Our growth may be affected if we are unable to find or complete suitable acquisitions.] We have augmented the growth of our business with a number of acquisitions and we plan to continue to acquire appropriate businesses, products and services.
Substantial recent merger and acquisition activity in our industry has affected the availability and pricing of such [removed: acquisitions.]
[removed: Acquisitions may be costly and difficult to integrate.] We have acquired a number of businesses in the last several years and will continue to explore acquisitions in the future.
[removed: The] [added: The] loss of key employees could adversely affect our [removed: business. We depend on the contributions and abilities of our senior management.][added: business.]
[removed: If others claim that we have infringed their intellectual property rights, we could be liable for significant damages.] We have agreed to indemnify many of our customers against claims that our products and services infringe on the proprietary rights of others.
[removed: Expansion of services to non-traditional customers could expose us to new risks.] Some of our recent acquisitions include business lines that are marketed outside our traditional, regulated, and litigation-averse base of financial institution customers.
[removed: Failure] [added: Failure] to achieve favorable renewals of service contracts could negatively affect our outsourcing [removed: business. Our contracts with our customers for outsourced data processing services generally run for a period of 3-5 years.][added: business.]
Our business may be adversely impacted by U.S. and global market and economic conditions.
We vigorously compete with a variety of software vendors in all of our major product lines.
Security problems could damage our reputation and business.
Our services and infrastructure are increasingly reliant on the Internet.
The volume and dollar amount
of payment transactions that we process is very large and continues to grow.
If we fail to adapt our products and services to changes in technology, we could lose existing customers and be unable to attract new business.
Our primary market consists of approximately 7,300 commercial and savings banks and 7,300 credit unions.
The financial services industry is subject to extensive and complex federal and state regulation.
The software we provide to our customers is also affected by government regulation.
In particular, numerous new regulations have been proposed and are still being written to implement the Dodd-Frank Wall Street Reform and Consumer Protection Act of 2010.
An operational failure in our outsourcing facilities could cause us to lose customers.
Our growth may be affected if we are unable to find or complete suitable acquisitions.
acquisitions.
Acquisitions may be costly and difficult to integrate.
We depend on the contributions and abilities of our senior management.
If others claim that we have infringed their intellectual property rights, we could be liable for significant damages.
We may not be able to manage growth.
Expansion of services to non-traditional customers could expose us to new risks.
Our contracts with our customers for outsourced data processing services generally run for a period of five or more years.
The Dodd-Frank Act and related regulations may have an adverse impact on our clients and our business.
The Dodd-Frank Wall Street Reform and Consumer Protection Act of 2010 (the “Dodd-Frank Act”) represents a comprehensive overhaul of the financial services industry within the United States, establishes the new federal Consumer Financial Protection Bureau (the “CFPB”) and requires the CFPB and other federal agencies to implement numerous new regulations.
At this time, it is difficult to predict the extent to which the Dodd-Frank Act or the resulting regulations will impact our business or the businesses of our current and potential clients.
To the extent the regulations negatively impact the business, operations or financial condition of our customers, our business and results of operations could be materially and adversely affected because, among other matters, our customers could have less capacity to purchase products and services from us.
We could be required to invest a significant amount of time and resources to comply with additional regulations or to modify the manner in which we provide products and services to our customers.
We may not be able to update our existing products and services, or develop new ones, to satisfy our customers’ needs.
Any of these events, if realized, could have a material adverse effect on our business, results of operations and financial condition.
If our strategic relationship with IBM were terminated, it could have a negative impact on the continuing success of our business. We market and sell IBM hardware and equipment to our customers under an IBM Business Partner Agreement and resell maintenance on IBM hardware products to our customers.
Much of our software is designed to be compatible with the IBM hardware that is run by a majority of our customers.
If IBM were to terminate or fundamentally modify our strategic relationship, our relationship with our customers and our revenues and earnings could suffer.
We could also lose software market share or be required to redesign existing products or develop new products for new hardware platforms.
ITEM 1B.
UNRESOLVED STAFF COMMENTS
None.
Item 7. MANAGEMENT’S DISCUSSION AND ANALYSIS OF FINANCIAL CONDITION AND RESULTS OF OPERATIONS
190 rewritten, 184 added, 183 removed, 169 unchanged
The following [removed: discussion] [added: section provides management's view of the financial condition] and [removed: analysis] [added: results of operations and] should be read in conjunction with the [removed: “Selected] [added: Selected] Financial [removed: Data” and] [added: Data,] the [removed: consolidated financial statements] [added: audited Consolidated Financial Statements,] and related notes included elsewhere in this report.
[removed: OVERVIEW][added: OVERVIEW]
[removed: JHA provides] [added: The Company is a provider of] integrated computer systems [added: that perform data processing (available] for in-house [removed: and] [added: installations or] outsourced [removed: data processing to commercial banks, credit unions] [added: services) for banks] and [removed: other financial institutions.][added: credit unions.]
[removed: Over] [added: During] the last five fiscal years, our revenues have grown from [removed: $666,467] [added: $742,926] in fiscal [removed: 2007] [added: 2008] to [removed: $966,897] [added: $1,027,109] in fiscal [removed: 2011.][added: 2012.]
Income from continuing operations has grown from [removed: $105,644] [added: $105,287] in fiscal [removed: 2007] [added: 2008] to [removed: $137,471] [added: $154,984] in fiscal [removed: 2011.][added: 2012.]
We have two [removed: business] [added: reportable] segments: bank systems and services and credit union systems and services.
All dollar amounts are in thousands and discussions compare fiscal [removed: 2011] [added: 2012] to fiscal [removed: 2010] [added: 2011] and compare fiscal [removed: 2010] [added: 2011] to fiscal [removed: 2009.][added: 2010.]
[removed: RESULTS] [added: RESULTS] OF [removed: OPERATIONS][added: OPERATIONS]
[removed: FISCAL] [added: FISCAL] 2011 COMPARED TO FISCAL [removed: 2010][added: 2010]
Our customers [removed: will] continue to face regulatory and operational challenges which our products and services address, and in these times they have an even greater need for [removed: some of] our solutions that directly address institutional profitability and efficiency.
[removed: REVENUE][added: REVENUE]
| [removed: License Revenue] [added: License Revenue] | [added: Year Ended] | | | | | | [added: | | % | |]
| | [removed: |] Year [removed: ended] [added: Ended] June 30, | | | | [removed: % Change] | [added: | | | | | |]
| | [added: 2011] | [removed: 2011] | | [added: |] 2010 | | | [added: | | |]
| License | [added: $] | [removed: $ 53,067] [added: 53,067] | | [added: |] $ [added: |] 52,225 | | [removed: 2%] | [added: 2 | % |]
| Percentage of total revenue | [added: 5] | [removed: 6%] | [added: %] | [removed: 6%] | [added: 6] | | [added: % | | | |]
We license our proprietary software products under standard license agreements that typically provide the customer with a non-exclusive, non-transferable right to use the software on a single computer and for a single financial [removed: institution location.][added: institution.]
In addition, our customers are increasingly electing to contract for our products via outsourced delivery rather than a traditional license [removed: agreement.]
| [removed: Support] [added: Support] and Service [removed: Revenue] [added: Revenue] | [added: Year Ended] | | | | | | [added: | | % | |]
| | [removed: |] Year [removed: ended June 30,] [added: Ended] | | | | [added: | | | |] % [removed: Change] | [added: |]
| | [added: 2011] | [removed: 2011] | | [added: |] 2010 | | | [added: | | |]
| Support and service | [added: $] | [removed: $ 852,253] [added: 852,253] | | [added: |] $ [added: |] 720,504 | | [removed: 18%] | [added: 18 | % |]
| Percentage of total revenue | [added: 89] | [removed: 88%] | [added: %] | [removed: 86%] | [added: 88] | | [added: % | | | |]
| | [removed: |] Year [removed: Over] [added: over] Year Change | | | | | [added: | | |]
| | [removed: |] $ Change | | [added: | |] % Change | | | [added: |]
| In-House Support & Other Services | [removed: |] $ [added: |] 16,286 | | [removed: 6%] | [added: 6] | [added: %] | [added: | |]
| Electronic Payment Services | [removed: |] 93,870 | | [removed: 43%] | | [added: 43] | [added: % | | |]
| Outsourcing Services | [removed: |] 15,574 | | [removed: 10%] | | [added: 10] | [added: % | | |]
| Implementation Services | [removed: |] 6,019 | | [removed: 9%] | | [added: 9] | [added: % | | |]
| [removed: Total Increase] [added: Total Increase] | [added: $] | [removed: $ 131,749] [added: 131,749] | | | | | [added: | |]
Outsourcing services for banks and credit unions continue to drive revenue growth as customers continue to [removed: choose outsourcing] [added: show a preference] for [removed: the] [added: outsourced] delivery of our solutions.
| [removed: Hardware Revenue] [added: Hardware Revenue] | [added: Year Ended] | | | | | | [added: | | % | |]
| | [removed: | Year ended] June 30, | | | | [removed: %] [added: | | | |] Change | [added: |]
| | [added: 2011] | [removed: 2011] | | [added: |] 2010 | | | [added: | | |]
| Hardware | [added: $] | [removed: $ 61,577] [added: 61,577] | | [added: |] $ [added: |] 63,857 | | [removed: \-4%] | [added: (4 | )% |]
| Percentage of total revenue | [added: 6] | [removed: 6%] | [added: %] | [removed: 8%] | [added: 6] | | [added: % | | | |]
[removed: COST] [added: COST] OF SALES AND GROSS [removed: PROFIT][added: PROFIT]
[removed: | Cost of Sales and Gross Profit | | | | | | |][added: COST OF SALES AND GROSS PROFIT]
| | [removed: | Year ended] June 30, | | | | [removed: %] [added: | | | |] Change | [added: |]
| | [added: 2011] | [removed: 2011] | | [added: |] 2010 | | | [added: | | |]
Jack Henry & Associates, Inc. (JHA) is headquartered in Monett, Missouri, employs approximately 4,900 associates nationwide, and is a leading provider of technology solutions and payment processing services primarily for financial services organizations.
Its solutions serve more than 11,900 customers and are marketed and supported through three primary brands.
Jack Henry Banking® supports banks ranging from community to mid-tier, multi-billion dollar institutions with information and transaction processing solutions.
Symitar® is a leading provider of information and transaction processing solutions for credit unions of all sizes.
ProfitStars® provides specialized products and services that enable financial institutions of every asset size and charter, and diverse corporate entities outside the financial services industry to mitigate and control risks, optimize revenue and growth opportunities, and contain costs.
JHA's integrated solutions are available for in-house installation and outsourced and hosted delivery.
Each of our brands share the fundamental commitment to provide high quality business solutions, service levels that consistently exceed customer expectations, integration of solutions and practical new technologies.
The quality of our solutions, our high service standards, and the fundamental way we do business typically foster long-term customer relationships, attract prospective customers, and have enabled us to capture substantial market share.
Through internal product development, disciplined acquisitions, and alliances with companies offering niche solutions that complement our proprietary solutions, we regularly introduce new products and services and generate new cross-sales opportunities across our three marketed brands.
We provide compatible computer hardware for our in-house installations and secure processing environments for our outsourced and hosted solutions.
We perform data conversions, software implementations, initial and ongoing customer training, and ongoing customer support services.
Our primary competitive advantage is customer service.
Our support infrastructure and strict standards provide service levels we believe to be the highest in the markets we serve and generate high levels of customer satisfaction and
retention.
We consistently measure customer satisfaction using comprehensive annual surveys and random surveys we receive in our everyday business.
Dedicated surveys are also used to grade specific aspects of our customer experience, including product implementation, education, and consulting services.
The majority of our revenue is derived from recurring outsourcing fees, transaction processing fees, and support and service fees that generally have contract terms of five years or greater.
Less predictable software license fees and hardware sales complement our primary revenue sources.
We continually seek opportunities to increase revenue while at the same time containing costs to expand margins.
This growth has resulted primarily from internal expansion supplemented by strategic acquisitions.
We are cautiously optimistic regarding ongoing economic improvement and expect to continue investing in the products and services our clients need to improve their operating efficiencies and performance.
We anticipate consolidation within the financial services industry to continue, including bank failures and increased merger and acquisition activity.
Regulatory conditions and legislation such as the Dodd-Frank Wall Street Reform Act and Consumer Protection Act will continue to impact the financial services industry and potentially motivate some financial institutions to postpone discretionary spending.
FISCAL 2012 COMPARED TO FISCAL 2011
In fiscal 2012, revenues increased 6% or $60,212 compared to the prior year due primarily to strong growth in our electronic payment services and our outsourcing services, as well as continued revenue growth in all three of our components of revenue (license, support and service, and hardware).
During fiscal 2012, the Company continued to focus on cost management and also reduced interest cost through our sustained repayment of long-term debt.
These changes have resulted in a 13% increase in net income.
The current condition of the U.S. financial markets continues to impact the overall demand and spending for new products and services by some of our customers.
During the past four years, a number of financial institutions have closed or merged due to regulatory action.
We believe that regulatory closings will continue to decline through fiscal 2013, absent a significant downturn in the economy.
Furthermore, the increase in bank failures and forced consolidations has been, to some extent, offset by a general decline in the level of acquisition activity among financial institutions.
We move into fiscal 2013 with cautious optimism following strong fourth quarter fiscal 2012 results.
Our strong balance sheet, access to extensive lines of credit, the strength of our existing product line and an unwavering commitment to superior customer service position us well to address current and future opportunities to extend our customer base and produce returns for our stockholders.
| | 2012 | | | | 2011 | | | | | |
| License | $ | 54,811 | | | $ | 53,067 | | | 3 | % |
The increase in license revenue is due to strong results from our Silverlake® and Episys® core systems and related complementary products including 4|Sight™ Item Imaging and our ProfitStar® financial management and budgeting solutions.
The increase was partially offset by reduced revenue from our Alogent® products (our suite of deposit and image capture products targeted at large financial institutions) and our Argo products (our suite of retail solutions, including branch sales automation) which have both reduced slightly from a particularly strong prior year.
We expect this trend to continue in the long term.
| | 2012 | | | | 2011 | | | | | |
| Support and service | $ | 909,176 | | | $ | 852,253 | | | 7 | % |
We have developed and acquired banking and credit union application software systems that we market, together with compatible computer hardware, to these financial institutions.
We also perform data conversion and software implementation services for our systems and provide continuing customer support services after the systems are implemented.
For our customers who prefer not to make an up-front capital investment in software and hardware, we provide our full range of products and services on an outsourced basis through our six data centers in five physical locations and six item-processing centers located throughout the United States.
We derive revenues from three primary sources:
software license fees;
ongoing outsourcing fees, transaction processing fees, and support and service fees, which include implementation services; and
hardware sales, which include all non-software remarketed products.
This growth has resulted primarily from internal expansion supplemented by strategic acquisitions, allowing us to develop and acquire new products and services for approximately 11,300 customers who utilize our software systems or services as of June 30, 2011.
| | | | | | | |
| --- | --- | --- | --- | --- | --- | --- |
| | | | | | | |
| | | | | | | |
| --- | --- | --- | --- | --- | --- | --- |
| | | | | | | |
| | | | | | | |
| | | | | | | |
| | | | | | | |
| | | | | | | |
| --- | --- | --- | --- | --- | --- | --- |
| | | | | | | |
| | | | | | | |
| --- | --- | --- | --- | --- | --- | --- |
| | | | | | | |
| | | | | | | |
| | | | | | | |
| | | | | | | |
| | | | | | | |
| | | | | | | |
| | | | | | | |
| | | | | | | |
| | | | | | | |
| --- | --- | --- | --- | --- | --- | --- |
| | | | | | | |
| | | | | | | |
| --- | --- | --- | --- | --- | --- | --- |
| | | | | | | |
| | | | | | | |
| --- | --- | --- | --- | --- | --- | --- |
| | | | | | | |
FISCAL 2010 COMPARED TO FISCAL 2009
An excerpt. Shown here: 40 of 190 rewritten, 40 of 184 added and 40 of 183 removed. The counts are complete. For every sentence, read Item 7. MANAGEMENT’S DISCUSSION AND ANALYSIS OF FINANCIAL CONDITION AND RESULTS OF OPERATIONS in the FY2012 filing and the FY2011 filing.
Item 7A. QUANTITATIVE AND QUALITATIVE DISCLOSURES ABOUT MARKET RISK
2 rewritten, 0 added, 0 removed, 4 unchanged
Based on the controls in place and the credit worthiness of the customer base, we believe the credit risk associated with the extension of credit to our customers will not have a material adverse effect on our consolidated financial [removed: position or] [added: position,] results of [removed: operations.][added: operations or cash flows.]
Based on our outstanding debt with variable interest rates as of June 30, [removed: 2011,] [added: 2012,] a 1% increase in our borrowing rate would increase annual interest expense in fiscal [removed: 2012] [added: 2013] by [removed: approximately $1,500.][added: less than $1,300.]
Item 1. BUSINESS
105 rewritten, 105 added, 52 removed, 136 unchanged
Today, the Company’s extensive array of products and services includes processing transactions, automating business processes, and managing information for more than [removed: 11,300] [added: 11,900] financial institutions and diverse corporate entities.
JHA provides its products and services through [removed: four] [added: three] marketed brands:
[removed: Jack] [added: | • | Jack] Henry [removed: Banking] [added: Banking] is a leading provider of integrated data processing systems to [removed: nearly 1,400] [added: more than 1,330] banks ranging from de novo or start-up institutions to mid-tier banks with assets of up to $30 billion. [added: Our banking solutions support both in-house and outsourced operating environments with three functionally distinct core processing platforms and more than 100 integrated complementary solutions. |]
[removed: Our banking] [added: | • | Symitar is a leading provider of core data processing] solutions [removed: support both in-house and outsourced operating environments] [added: for credit unions of all sizes,] with [removed: three] [added: over 750 credit union customers. Symitar markets two] functionally distinct core processing platforms and more than [removed: 100] [added: 50] integrated complementary [removed: solutions.][added: solutions that support both in-house and outsourced operating environments. |]
ProfitStars [removed: offers] [added: currently supports nearly 11,000 institutions with specialized] solutions for generating [added: additional] revenue and [removed: growth opportunities,] [added: growth,] increasing [removed: security and] [added: security,] mitigating operational risks, and controlling operating [removed: costs, that can be used with a wide variety of information technology platforms and operating environments.][added: costs.]
[removed: ProfitStars’ products and services enhance the performance of] [added: ProfitStars serves] financial services organizations of all asset sizes and [removed: charters,] [added: charters] and [added: other] diverse corporate [removed: entities with nearly 8,000 domestic and international customers.][added: entities.]
We are committed to [removed: meet and exceed] [added: exceeding] our customers’ service-related expectations.
Hardware sales [removed: that] [added: support our software systems and] include [removed: all non-software] [added: non-JHA] products that we [removed: re-market in order to support our software systems.][added: re-market.]
[removed: JHA’s gross revenue has grown from $666.5 million in fiscal 2007 to $966.9 million in fiscal 2011, representing a compound annual growth rate during this five-year period of 8 percent_._ Net income from continuing operations has grown from $105.6 million to $137.5 million during this same five-year period, representing a compound annual growth rate of 5 percent_._] Information regarding the classification of our business into separate segments serving the banking and credit union industries is set forth in Note 13 to the Consolidated Financial Statements (see Item 8).
JHA’s progress and performance have been guided by the focused work ethic and fundamental ideals fostered by the Company’s founders [added: over] three decades ago:
[added: | • |] Do the right thing, [added: |]
[added: | • |] Do whatever it takes, and [added: |]
[added: | • |] Have fun. [added: |]
[removed: Industry Background][added: Industry Background]
According to the Federal Deposit Insurance Corporation (“FDIC”), there were more than [removed: 7,600] [added: 7,300] commercial banks and savings institutions in this asset range as of December 31, [removed: 2010.][added: 2011.]
Jack Henry Banking currently supports [removed: nearly 1,400] [added: over 1,330] of these banks with its core information processing platforms and complementary products and services.
According to the Credit Union National Association (“CUNA”), there were more than [removed: 7,600] [added: 7,300] domestic credit unions as of December 31, [removed: 2010.][added: 2011.]
The FDIC reports the number of commercial banks and savings institutions declined [removed: 13] [added: 15] percent from the beginning of calendar year [removed: 2006] [added: 2008] to the end of calendar year [removed: 2010.][added: 2011.]
Although the number of banks declined at a 3 percent compound annual rate during this period, aggregate assets increased at a compound annual rate of [removed: 6] [added: 5] percent and totaled [removed: $12.1] [added: $12.6] trillion as of December 31, [removed: 2010.][added: 2011.]
Comparing calendar years [removed: 2010] [added: 2011] to [removed: 2009,] [added: 2010,] new bank charters decreased [removed: 65] [added: 73] percent and mergers increased [removed: 10] [added: 1] percent.
CUNA reports the number of credit unions [added: also] declined [removed: 16] [added: 15] percent from the beginning of calendar year [removed: 2006] [added: 2008] to the end of calendar year [removed: 2010.][added: 2011.]
Although the number of credit unions declined at a 3 percent compound annual rate during this period, aggregate assets increased at a compound annual rate of [removed: 7] [added: 6] percent and totaled [removed: $934.1] [added: $982.1] billion as of December 31, [removed: 2010.][added: 2011.]
[added: | • |] Maximize performance with accessible, accurate, and timely [removed: decision support and] business intelligence information; [added: |]
[added: | • |] Offer the high-demand products and services needed to successfully compete with traditional competitors and non-traditional competitors created by convergence within the financial services industry; [added: |]
[added: | • |] Enhance the customer/member experience at varied points of contact; [added: |]
[added: | • |] Expand existing customer/member relationships and strengthen exit barriers by cross selling additional products and services; [added: |]
[added: | • |] Capitalize on new revenue and deposit growth opportunities; [added: |]
[added: | • |] Increase operating efficiencies and reduce operating costs; [added: |]
[added: | • |] Implement e-commerce strategies that provide the convenience-driven services required in today’s financial services industry; [added: |]
[added: | • |] Protect mission-critical information assets and operational infrastructure; [added: |]
[added: | • |] Protect customers/members from fraud and related financial losses; [added: |]
[added: | • |] Maximize the day-to-day use of technology and [removed: the] return on technology investments; and [added: |]
[added: | • |] Ensure full regulatory compliance. [added: |]
JHA’s extensive product and service offering enables diverse financial institutions to capitalize on these business [removed: opportunities and respond to these business challenges.]
[removed: Mission Statement][added: Mission Statement]
[added: | • |] Concentrating our activities on what we know best - information systems and services for financial institutions; [added: |]
[added: | • |] Providing outstanding commitment and service to our customers so that the perceived value of our products and services is consistent with the real value; and [added: |]
[added: | • |] Maintaining a work environment that is personally, professionally, and financially rewarding to our employees. [added: |]
[removed: Business Strategy][added: Business Strategy]
[added: | • |] Providing commercial banks and credit unions with core software systems that provide excellent functionality, and support in-house and outsourced operating environments with identical functionality. [added: |]
| | |
| --- | --- |
| | |
| --- | --- |
| | |
| --- | --- |
The majority of our revenue is derived from recurring outsourcing fees, transaction processing fees, and support and service fees that generally have contract terms of five years or greater.
JHA’s gross revenue has grown from $742.9 million in fiscal 2008 to $1,027.1 million in fiscal 2012, representing a compound annual growth rate during this challenging five-year period of 7 percent.
Net income from continuing operations has grown from $105.3 million to $155.0 million during this same five-year period, representing a compound
annual growth rate of 8 percent.
| | |
| --- | --- |
| | |
| --- | --- |
| | |
| --- | --- |
| | |
| --- | --- |
| | |
| --- | --- |
| | |
| --- | --- |
| | |
| --- | --- |
| | |
| --- | --- |
| | |
| --- | --- |
| | |
| --- | --- |
| | |
| --- | --- |
| | |
| --- | --- |
| | |
| --- | --- |
| | |
| --- | --- |
opportunities and respond to these business challenges.
| | |
§
§
Symitar is a leading provider of core data processing solutions for credit unions of all sizes, with nearly 750 credit union customers.
Symitar markets two functionally distinct core processing platforms and more than 50 integrated complementary solutions that support both in-house and outsourced operating environments.
§
ProfitStars is a leading provider of highly specialized products and services to financial institutions that are primarily not core customers of the Company.
§
iPay Technologies is a leading provider of electronic bill pay services.
iPay Technologies’ bill pay engine integrates with online banking platforms and provides individuals and small businesses with bill payment solutions.
Through strategic partnerships with more than 50 providers of information processing and online banking solutions, iPay’s electronic payments platform is supporting approximately 3,700 financial institutions.
We have three primary revenue sources:
Software license fees paid by customers implementing our software solutions in-house;
Ongoing outsourcing fees paid by customers that outsource their information processing to us, recurring transaction processing fees, annual maintenance and support fees, and service fees including software implementation; and
ProfitStars serves financial services organizations of all asset sizes and charters.
ProfitStars currently supports nearly 8,000 institutions with specialized solutions for generating additional revenue and growth, increasing security, mitigating operational risks, and controlling operating costs.
iPay Technologies serves financial institutions of all sizes and currently supports approximately 3,700 institutions with electronic payment platform and online bill payment solutions.
According to _Automation in Banking 2011,_ approximately 56 percent of all financial institutions currently utilize in-house core information processing solutions and approximately 44 percent outsource information processing to third-party providers.
According to the _2011 Credit Union Technology Survey_ published by Callahan & Associates_,_ approximately 67 percent of all credit unions utilize in-house core information processing solutions and approximately 30 percent outsource information processing to third-party providers.
| 2007 | Margin Maximizer | Loan and Deposit Pricing Solutions |
§
Jack Henry Banking supports commercial banks with information and transaction processing platforms that provide enterprise-wide automation.
Our banking solutions have state-of-the-art functional capabilities, and we can provide the hardware required by each software system.
Our banking solutions can be delivered in-house or through outsourced implementation, and are backed by a company-wide commitment to provide exceptional personal service.
Jack Henry Banking is a recognized market leader, currently supporting nearly 1,400 banks with its technology platforms.
§
Symitar supports credit unions of all sizes with information and transaction processing platforms that provide enterprise-wide automation.
Our credit union solutions also have state-of-the-art functional capabilities, and we can provide the hardware required by each software system.
Our credit union solutions can be delivered in-house or through outsourced implementation, and are also backed by our company-wide commitment to provide exceptional personal service.
§
ProfitStars is a leading provider of specialized products and services assembled through our focused diversification acquisition strategy.
These solutions are compatible with a wide variety of information technology platforms and operating environments, and include proven solutions for generating additional revenue and growth, increasing security and mitigating operational risks, and/or controlling operating costs.
These distinct products and services can be implemented individually or as solution suites to address specific business problems and enable effective responses to dynamic industry trends.
§
iPay Technologies is a leading provider of a configurable electronic payments platform and turnkey online bill payment solutions.
These solutions integrate with any online banking platform, aiding financial institutions with the attraction and retention of customers.
Through strategic processing and online banking solutions, iPay Technologies is supporting more than 3,700 financial institutions.
§
However, an increasing number of progressive smaller banks, including de novo, or recently chartered start-up banks, are now selecting SilverLake.
This system has been implemented by nearly 430 banks, and now automates approximately 6 percent of the domestic banks with assets less than $30 billion.
§
An excerpt. Shown here: 40 of 105 rewritten, 40 of 105 added and 40 of 52 removed. The counts are complete. For every sentence, read Item 1. BUSINESS in the FY2012 filing and the FY2011 filing.
Item 3. LEGAL PROCEEDINGS
0 rewritten, 0 added, 1 removed, 2 unchanged
PART II
Cover and table of contents
26 rewritten, 69 added, 5 removed, 28 unchanged
10-K 1 [removed: jkhy2011q4.htm] [added: jkhy-2012630x10k.htm] FORM 10K FOR FISCAL YEAR ENDED JUNE 30, [removed: 2011][added: 2012]
[removed: UNITED STATES][added: UNITED STATES]
[removed: SECURITIES] [added: SECURITIES] AND EXCHANGE [removed: COMMISSION][added: COMMISSION]
[removed: Washington,] [added: WASHINGTON,] D.C. [removed: 20549][added: 20549]
[removed: FORM 10-K][added: FORM 10-K]
[removed: ANNUAL REPORT][added: ANNUAL REPORT]
[removed: PURSUANT] [added: PURSUANT] TO SECTION 13 OR [removed: 15(d)][added: 15(d)]
[removed: OF] [added: OF] THE SECURITIES EXCHANGE ACT OF [removed: 1934][added: 1934]
[removed: (Mark One)][added: (Mark One)]
[removed: \[X\]] [added: | (X) |] ANNUAL REPORT PURSUANT TO SECTION 13 OR 15(d) OF THE SECURITIES EXCHANGE ACT OF [removed: 1934][added: 1934 |]
[added: | |] For the fiscal year ended June 30, [removed: 2011][added: 2012 |]
[removed: \[ \]] [added: | ( ) |] TRANSITION REPORT PURSUANT TO SECTION 13 OR 15(d) OF THE SECURITIES EXCHANGE ACT OF [removed: 1934][added: 1934 |]
[added: | |] For the transition period from [removed: _______________] [added: ______________] to [removed: _______________][added: ________________ |]
[removed: JACK] [added: JACK] HENRY [removed: AND] [added: &] ASSOCIATES, [removed: INC.][added: INC.]
| [removed: Delaware] (State or [removed: other jurisdiction] [added: Other Jurisdiction] of [removed: incorporation or organization)] [added: Incorporation)] | | [removed: 43-1128385 (I.R.S.] [added: (I.R.S] Employer Identification No.) |
(Address of [removed: principal executive offices)][added: Principle Executive Offices)]
[removed: Registrant’s] [added: (Registrant’s] telephone number, including area [removed: code: (417) 235-6652][added: code)]
| [removed: Title of each class] Common Stock ($0.01 par value) | | [removed: Name of each exchange on which registered] NASDAQ Global Select Market |
[added: |] Large [removed: Accelerated Filer \[ X \]] [added: accelerated filer \[X\] | |] Accelerated [removed: Filer \[ \] Non-Accelerated Filer] [added: filer] \[ \] [added: |]
As of August 22, [removed: 2011,] [added: 2012,] the Registrant had [removed: 86,397,007] [added: 86,151,011] shares of Common Stock outstanding ($0.01 par value).
On December 31, [removed: 2010,] [added: 2011,] the aggregate market value of the Common Stock held by persons other than those who may be deemed affiliates of Registrant was [removed: $2,363,957,956] [added: $2,766,705,073] (based on the average of the reported high and low sales prices on NASDAQ on December 31, [removed: 2010).][added: 2011).]
[removed: DOCUMENTS] [added: DOCUMENTS] INCORPORATED BY [removed: REFERENCE][added: REFERENCE]
Portions of the Company's Notice of Annual Meeting of Stockholders and Proxy Statement for its [removed: 2011] [added: 2012] Annual Meeting of Stockholders (the "Proxy Statement"), to the Table of Contents below, are incorporated by reference into Part II, Item 5 and into Part III of this Report.
[removed: | TABLE] [added: TABLE] OF [removed: CONTENTS | | |][added: CONTENTS]
| [removed: PART I] [added: PART I] | | Page Reference |
[removed: Item] [added: | ITEM] 1A. [added: | RISK FACTORS | [12](#sCD7A0AC6E176575A2AA25744C184B031) |]
| | |
| --- | --- |
| | |
| | |
| OR | |
| | |
| Delaware | | 43-1128385 |
(Zip Code)
417-235-6652
| Title of each class | | Name of each exchange on which registered |
| | | |
| Non-accelerated filer \[ \] | (Do not check if a smaller reporting company) | Smaller reporting company \[ \] |
| | | |
| --- | --- | --- |
| | | |
| | | |
| ITEM 1. | BUSINESS | [4](#s32D920D990DB3E17D4E6573E3C8DABA6) |
| | | |
| | | |
| ITEM 1B. | UNRESOLVED STAFF COMMENTS | [14](#s4194C5D4675689F636CA5745383C3750) |
| | | |
| ITEM 2. | PROPERTIES | [14](#s3A4B5EB2E6D38281C0465745EB317B04) |
| | | |
| ITEM 3. | LEGAL PROCEEDINGS | [15](#s1C2202B30AFF94F4B841574717B4F786) |
| | | |
| ITEM 4. | MINE SAFETY DISCLOSURES | [15](#s1888AA5E361510490EDB576814BAE748) |
| | | |
| PART II | | |
| | | |
| ITEM 5. | MARKET FOR REGISTRANT'S COMMON EQUITY, RELATED STOCKHOLDER MATTERS AND ISSUER PURCHASES OF EQUITY SECURITIES | [15](#s59AAC66D7D477B22B8CA576D03E33B47) |
| | | |
| ITEM 6. | SELECTED FINANCIAL DATA | [17](#s985BD9DB2F265D5C188A576D9015B1D7) |
| | | |
| ITEM 7. | MANAGEMENT'S DISCUSSION AND ANALYSIS OF FINANCIAL CONDITION AND RESULTS OF OPERATIONS | [17](#sF521317626899B8FCC8956849ADBD5B4) |
| | | |
| ITEM 7A. | QUANTITATIVE AND QUALITATIVE DISCLOSURES ABOUT MARKET RISK | [30](#sE1A927487CC4AF1FBC9C56849C7F178B) |
| | | |
| ITEM 8. | FINANCIAL STATEMENTS AND SUPPLEMENTARY DATA | [31](#s6635D69AEB094D11F38A56849883CD34) |
| | | |
| ITEM 9. | CHANGES IN AND DISAGREEMENTS WITH ACCOUNTANTS ON ACCOUNTING AND FINANCIAL DISCLOSURE | [58](#sA052A77306349BC8EBD6576C74019321) |
OR
Smaller reporting Company \[ \]
Item 1.
BUSINESS 4
RISK FACTORS 14
An excerpt. Shown here: all 26 rewritten, 40 of 69 added and all 5 removed. The counts are complete. For every sentence, read Cover and table of contents in the FY2012 filing and the FY2011 filing.
Item 1B. UNRESOLVED STAFF COMMENTS
0 rewritten, 1 added, 25 removed, 0 unchanged
None.
| | | |
Item 2.
PROPERTIES 17
| | | |
Item 3.
LEGAL PROCEEDINGS 17
| | | |
| PART II | | |
Item 5.
MARKET FOR REGISTRANT'S COMMON EQUITY, RELATED STOCKHOLDER 18
| | MATTERS AND ISSUER PURCHASES OF EQUITY SECURITIES | |
| | | |
Item 6.
SELECTED FINANCIAL DATA 19
| | | |
Item 7.
MANAGEMENT'S DISCUSSION AND ANALYSIS OF FINANCIAL 20
| | CONDITION AND RESULTS OF OPERATIONS | |
| | | |
Item 7A.
QUANTITATIVE AND QUALITATIVE DISCLOSURES ABOUT MARKET RISK 35
| | | |
Item 8.
FINANCIAL STATEMENTS AND SUPPLEMENTARY DATA 36
| | | |
Item 2. PROPERTIES
7 rewritten, 1 added, 0 removed, 6 unchanged
We own 154 acres located in Monett, Missouri on which we maintain nine office buildings, [added: plus] shipping & receiving and maintenance buildings.
We have [removed: 43] [added: 39] leased office facilities in 21 states, which total approximately [removed: 412,000] [added: 374,000] square feet.
Of our facilities, the credit union [removed: business] segment uses office space totaling approximately [removed: 147,000] [added: 151,000] square feet in ten facilities.
The majority of our San Diego, California offices are used in the credit union [removed: business] segment, as are portions of nine other office facilities.
The remainder of our leased and owned facilities, approximately [removed: 1,250,000] [added: 1,223,000] square feet of office space, is primarily devoted to serving our bank [removed: business] segment or supports our whole business.
We own [removed: five] [added: four] aircraft.
We primarily use our airplanes in connection with implementation, sales of systems and internal [removed: requirements for day-to-day operations.]
requirements for day-to-day operations.
Item 4. MINE SAFETY DISCLOSURES
0 rewritten, 2 added, 0 removed, 0 unchanged
New section this year
None.
PART II
Item 5. MARKET FOR REGISTRANT'S COMMON EQUITY, RELATED STOCKHOLDER MATTERS AND ISSUER PURCHASES OF EQUITY SECURITIES
16 rewritten, 30 added, 6 removed, 11 unchanged
| | | [removed: Fiscal 2011] [added: Fiscal 2012] | | | | [added: | | | |] Fiscal [removed: 2010] [added: 2011] | | | [added: | | | |]
| | | [removed: High] [added: High] | | [removed: Low] | | [added: Low | | | |] High | | [added: | |] Low | [added: | |]
| [removed: Third Quarter] [added: Third Quarter] | | [removed: 33.94] [added: 35.37] | | [removed: 28.96] | | [removed: 24.88] [added: 32.11] | | [removed: 21.01] | [added: | 33.94 | | | | 28.96 | | |]
| [removed: Second Quarter] [added: Second Quarter] | | [removed: 29.97] [added: 34.50] | | [removed: 25.35] | | [removed: 24.75] [added: 27.33] | | [removed: 22.22] | [added: | 29.97 | | | | 25.35 | | |]
| [removed: First Quarter] [added: First Quarter] | | [removed: 26.30] [added: 31.15] | | [removed: 23.19] | | [removed: 24.66] [added: 24.41] | | [removed: 19.56] | [added: | 26.30 | | | | 23.19 | | |]
Quarterly dividends per share paid on the common stock for the two most recent fiscal years ended June 30, [removed: 2011] [added: 2012] and [removed: 2010] [added: 2011] are as follows:
| | | [removed: Fiscal 2011] [added: Fiscal 2012] | | | | Fiscal [removed: 2010] [added: 2011] | [added: | |]
| [removed: Third Quarter] [added: Third Quarter] | | [removed: 0.105] [added: 0.115] | | | | [removed: 0.095] [added: 0.105] | [added: | |]
| [removed: Second Quarter] [added: Second Quarter] | | [removed: 0.095] [added: 0.105] | | | | [removed: 0.085] [added: 0.095] | [added: | |]
| [removed: First Quarter] [added: First Quarter] | | [removed: 0.095] [added: 0.105] | | | | [removed: 0.085] [added: 0.095] | [added: | |]
On August [removed: 19, 2011,] [added: 22, 2012,] there were approximately [removed: 42,000] [added: 43,000] holders of the Company’s common stock.
On that same date the last sale price of the common shares as reported on NASDAQ was [removed: $25.88] [added: $37.13] per share.
[removed: Performance Graph][added: Performance Graph]
The following chart presents a comparison for the five-year period ended June 30, [removed: 2011,] [added: 2012,] of the market performance of the Company’s common stock with the S & P 500 Index and an index of peer companies selected by the Company:
This comparison assumes $100 was invested on June 30, [removed: 2006,] [added: 2007,] and assumes reinvestments of dividends.
Companies in the [removed: peer group] [added: Old Peer Group] are Bottomline Technology, Inc., Cerner Corp., DST Systems, Inc., Euronet Worldwide, Inc., Fair Isaac Corp., Fidelity National Financial, Inc., Fiserv, Inc., Online Resources Corp., S1 Corp., SEI Investments Company, Telecommunications Systems, Inc., and Tyler Technologies Corp.
| | | | | | | | | | | | | | | | | |
| --- | --- | --- | --- | --- | --- | --- | --- | --- | --- | --- | --- | --- | --- | --- | --- | --- |
| | | | | | | | | | | | | | | | | |
| Fourth Quarter | | $ | 34.76 | | | $ | 32.17 | | | $ | 34.17 | | | $ | 28.45 | |
| Fourth Quarter | | $ | 0.115 | | | $ | 0.105 | |
Issuer Purchases of Equity Securities
The following shares of the Company were repurchased during the quarter ended June 30, 2012:
| | | | | | | | | | | | | |
| --- | --- | --- | --- | --- | --- | --- | --- | --- | --- | --- | --- | --- |
| | | | | | | | | | | | | |
| | Total Number of Shares Purchased | | | Average Price of Share | | | | Total Number of Shares Purchased as Part of Publicly Announced Plans | | | Maximum Number of Shares that May Yet Be Purchased Under the Plans (1) | |
| April 1 - April 30, 2012 | — | | | $ | — | | | — | | | 5,583,981 | |
| May 1 - May 31, 2012 | 717,099 | | | 32.92 | | | | 717,099 | | | 4,866,882 | |
| June 1 - June 30, 2012 | 328,330 | | | 32.78 | | | | 328,330 | | | 4,538,552 | |
| Total | 1,045,429 | | | 32.88 | | | | 1,045,429 | | | 4,538,552 | |
(1) Purchases made under the stock repurchase authorization approved by the Company's Board of Directors on October 4, 2002 with respect to 3.0 million shares, increased by 2.0 million shares on April 29, 2005, by 5.0 million shares on August 28, 2006, by 5.0 million shares on February 4, 2008, and by 5.0 million shares on August 25, 2008.
These authorizations have no specific dollar or share price targets and no expiration dates.
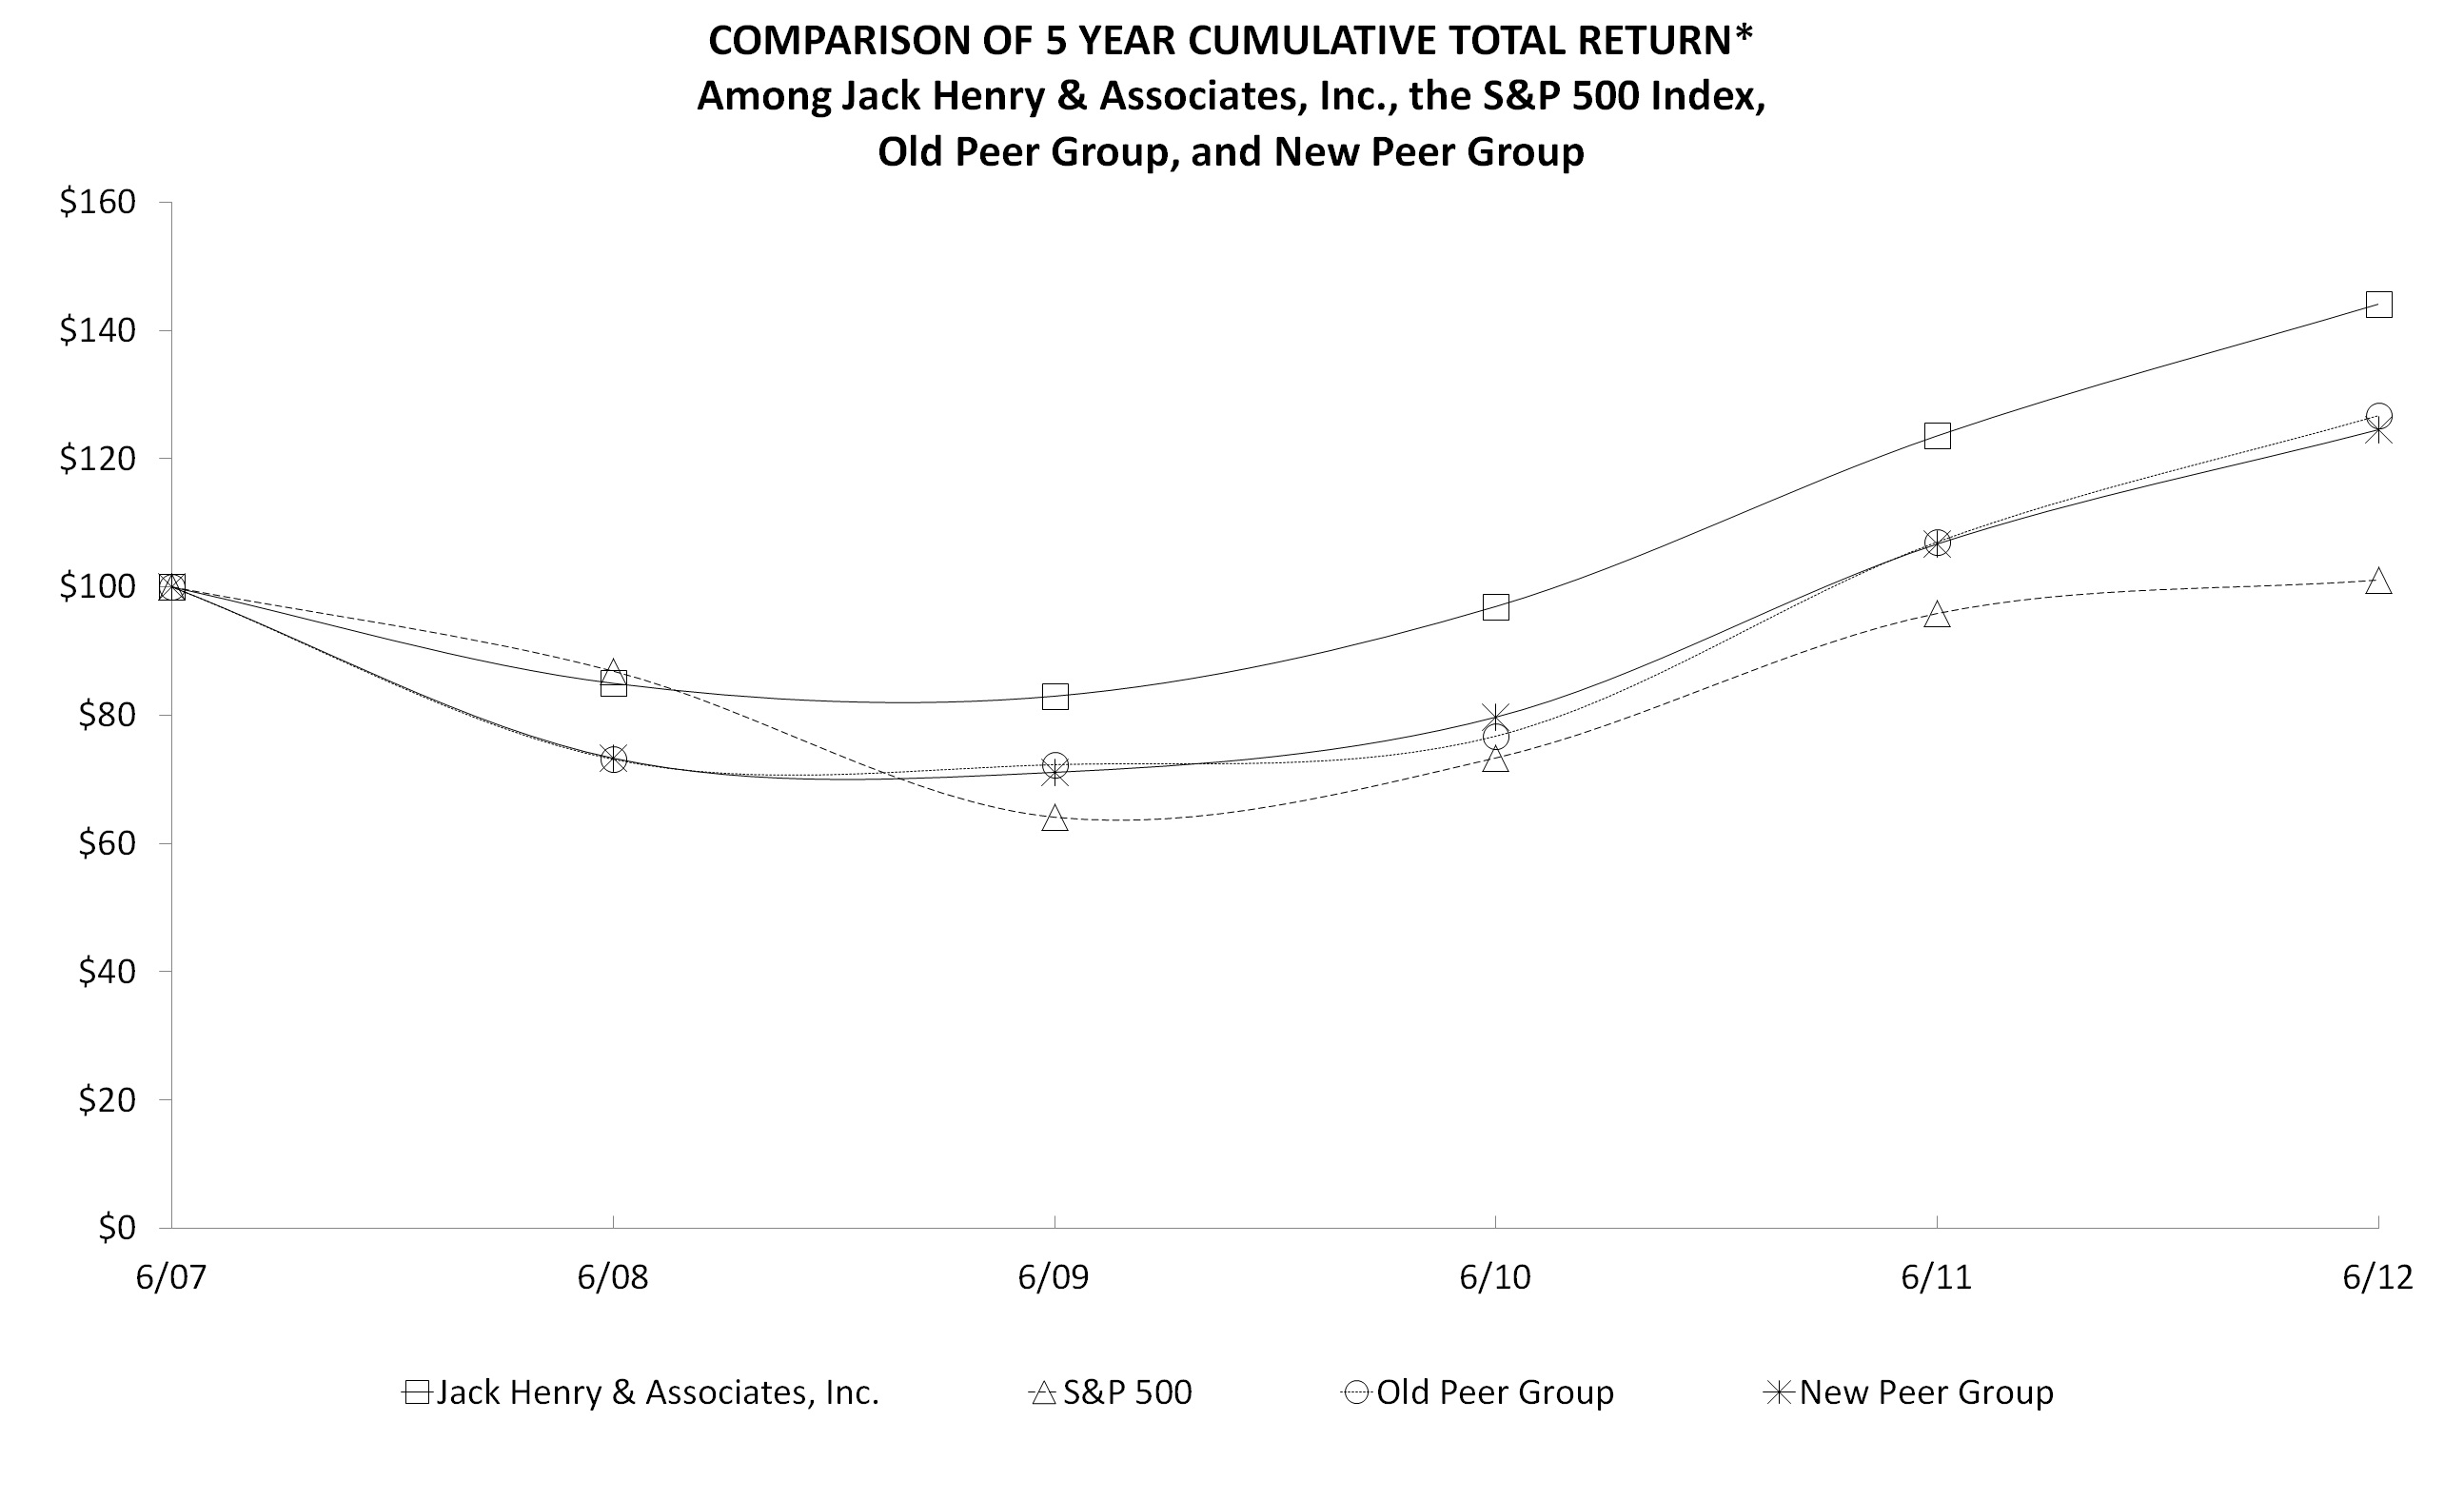
The following information depicts a line graph with the following values:
| | | | | | | | | | | | | |
| --- | --- | --- | --- | --- | --- | --- | --- | --- | --- | --- | --- | --- |
| | | | | | | | | | | | | |
| | 2007 | | 2008 | | 2009 | | 2010 | | 2011 | | 2012 | |
| JKHY | 100.00 | | 84.98 | | 82.97 | | 96.96 | | 123.57 | | 144.10 | |
| Old Peer Group | 100.00 | | 73.12 | | 72.29 | | 76.75 | | 107.02 | | 126.72 | |
| New Peer Group | 100.00 | | 73.30 | | 71.10 | | 79.71 | | 106.69 | | 124.52 | |
| S & P 500 | 100.00 | | 86.88 | | 64.10 | | 73.35 | | 95.87 | | 101.09 | |
In fiscal year 2012, we changed our peer group of companies used for this analysis to maintain alignment with peer companies selected by our Compensation Committee for use in determining compensation for executive management.
Companies in the New Peer Group are Bottomline Technology, Inc., Cerner
Corp., DST Systems, Inc., Euronet Worldwide, Inc., Fair Isaac Corp., Fidelity National Information Services, Inc., Fiserv, Inc., Online Resources Corp., SEI Investments Company, Telecommunications Systems, Inc., and Tyler Technologies Corp.
| Fourth Quarter | | $34.17 | | $28.45 | | $26.50 | | $22.55 |
| | | | | | | |
| --- | --- | --- | --- | --- | --- | --- |
| | | | | | | |
| Fourth Quarter | | $0.105 | | | | $0.095 |

Item 6. SELECTED FINANCIAL DATA
14 rewritten, 3 added, 8 removed, 1 unchanged
| [removed: Selected] [added: Selected] Financial [removed: Data] [added: Data] | | | | | | [added: | | | | | | | | | | | | | | |]
| (In Thousands, Except Per Share Data) | | | | | | [added: | | | | | | | | | | | | | | |]
| | [removed: YEAR] [added: | YEAR] ENDED JUNE [removed: 30,] [added: 30,] | | | | | [added: | | | | | | | | | | | | | |]
| [removed: Income] [added: Income] Statement [removed: Data] [added: Data] | [removed: 2011] | [added: 2012 | | | | 2011 | | | |] 2010 | [added: | | |] 2009 | [added: | | |] 2008 | [removed: 2007] | [added: |]
| Revenue (1) | [removed: $ 966,897] | $ [added: | 1,027,109 | | | $ | 966,897 | | | $ |] 836,586 | [added: | |] $ [added: |] 745,593 | [added: | |] $ [added: |] 742,926 | [removed: $ 666,467] |
| Income from continuing operations | [removed: $ 137,471] | $ [added: | 154,984 | | | $ | 137,471 | | | $ |] 117,870 | [added: | |] $ [added: |] 103,102 | [added: | |] $ [added: |] 105,287 | [removed: $ 105,644] |
| Basic net income per share, continuing operations | [removed: $ 1.60] | $ [added: | 1.79 | | | $ | 1.60 | | | $ |] 1.39 | [added: | |] $ [added: |] 1.23 | [added: | |] $ [added: |] 1.19 | [removed: $ 1.17] |
| Diluted net income per share, continuing operations | [removed: $ 1.59] | $ [added: | 1.78 | | | $ | 1.59 | | | $ |] 1.38 | [added: | |] $ [added: |] 1.22 | [added: | |] $ [added: |] 1.17 | [removed: $ 1.15] |
| Dividends declared per share | [removed: $ 0.40] | $ [added: | 0.44 | | | $ | 0.40 | | | $ |] 0.36 | [added: | |] $ [added: |] 0.32 | [added: | |] $ [added: |] 0.28 | [removed: $ 0.24] |
| [removed: Balance] [added: Balance] Sheet [removed: Data] [added: Data] | | | | | | [added: | | | | | | | | | | | | | | |]
| Working capital | [removed: $ (26,561)] | $ [removed: (51,283)] | [added: 66,406 | | |] $ [removed: 15,239] | [added: (26,561 | ) | |] $ [removed: (11,418)] | [added: (51,283 | ) | |] $ [removed: 19,908] | [added: 15,239 | | | $ | (11,418 | ) |]
| Total assets | [removed: $ 1,505,797] | $ [added: | 1,619,492 | | | $ | 1,505,797 | | | $ |] 1,560,560 | [added: | |] $ [added: |] 1,050,700 | [added: | |] $ [added: |] 1,021,044 | [removed: $ 999,340] |
| Long-term debt | [removed: $ 127,939] | $ [added: | 106,166 | | | $ | 127,939 | | | $ |] 272,732 | [added: | |] $ [removed: -] | [added: — | | |] $ [added: |] 24 | [removed: $ 128] |
| Stockholders’ equity | [removed: $ 879,776] | $ [added: | 983,056 | | | $ | 879,776 | | | $ |] 750,372 | [added: | |] $ [added: |] 626,506 | [added: | |] $ [added: |] 601,451 | [removed: $ 598,365] |
| | | | | | | | | | | | | | | | | | | | | |
| --- | --- | --- | --- | --- | --- | --- | --- | --- | --- | --- | --- | --- | --- | --- | --- | --- | --- | --- | --- | --- |
| | | | | | | | | | | | | | | | | | | | | |
| | | | | | |
| --- | --- | --- | --- | --- | --- |
| | | | | | |
| | | | | | |
| | | | | | |
| | | | | | |
| | | | | | |
| | | | | | |
Item 8. FINANCIAL STATEMENTS AND SUPPLEMENTARY DATA
539 rewritten, 252 added, 328 removed, 283 unchanged
[removed: | |] Index to Financial Statements [removed: | | |]
[removed: | | Report of Independent Registered Public Accounting Firm | | 37 |][added: REPORT OF INDEPENDENT REGISTERED PUBLIC ACCOUNTING FIRM]
[removed: | | Management's Annual Report on Internal Control over Financial Reporting | | 38 |][added: MANAGEMENT’S ANNUAL REPORT ON INTERNAL CONTROL OVER FINANCIAL REPORTING]
[removed: | | Report of Independent Registered Public Accounting Firm | | 39 |][added: REPORT OF INDEPENDENT REGISTERED PUBLIC ACCOUNTING FIRM]
| [added: CONSOLIDATED STATEMENTS OF INCOME] | | [removed: Consolidated Statements of Income,] | | [added: | | | | | | | |]
| | | [removed: Years] [added: [Years] Ended June 30, [added: 2012,] 2011, [removed: 2010,] and [removed: 2009] [added: 20](#s4A12679135723D489BC15684921B6FA3)10] | [removed: 40] [added: [35](#s4A12679135723D489BC15684921B6FA3)] |
| [added: CONSOLIDATED BALANCE SHEETS] | | [removed: Consolidated Balance Sheets, June 30, 2011 and 2010] | [removed: 41] | [added: | | | |]
| [added: CONSOLIDATED STATEMENTS OF CHANGES IN STOCKHOLDERS' EQUITY] | | [removed: Consolidated Statements of Changes in Stockholders' Equity,] | | [added: | | | | | | | |]
| | | [removed: Years] [added: [Years] Ended June 30, [added: 2012,] 2011, [removed: 2010,] and [removed: 2009] [added: 20](#s525B42D19EE8DDD2043C5AFF00BFF6F3)10] | [removed: 42] [added: [37](#s525B42D19EE8DDD2043C5AFF00BFF6F3)] |
| [added: CONSOLIDATED STATEMENTS OF CASH FLOWS] | | [removed: Consolidated Statements of Cash Flows,] | | [added: | | | | | | | |]
| | | [removed: Years] [added: [Years] Ended June 30, [removed: 2011, 2010] [added: 2012, 2011] and [removed: 2009] [added: 20](#s48C608EAED7D757E0008568491F34C5F)10] | [removed: 43] [added: [38](#s48C608EAED7D757E0008568491F34C5F)] |
[removed: | | | Notes to Consolidated Financial Statements | 44 |][added: NOTES TO CONSOLIDATED FINANCIAL STATEMENTS]
[removed: REPORT OF INDEPENDENT REGISTERED PUBLIC ACCOUNTING FIRM][added: | | [Report of Independent Registered Public Accounting Firm](#s716EF57CB29113D3AA665AFD9558B1C2) | | [32](#s716EF57CB29113D3AA665AFD9558B1C2) |]
We have audited the accompanying consolidated balance sheets of Jack Henry & Associates, Inc. and subsidiaries (the “Company”) as of June 30, [removed: 2011] [added: 2012] and [removed: 2010,] [added: 2011,] and the related consolidated statements of income, changes in stockholders' equity, and cash flows for each of the three years in the period ended June 30, [removed: 2011.][added: 2012.]
In our opinion, such consolidated financial statements present fairly, in all material respects, the financial position of Jack Henry & Associates, Inc. and subsidiaries as of June 30, [removed: 2011] [added: 2012] and [removed: 2010,] [added: 2011,] and the results of their operations and their cash flows for each of the three years in the period June 30, [removed: 2011,] [added: 2012,] in conformity with accounting principles generally accepted in the United States of America.
We have also audited, in accordance with the standards of the Public Company Accounting Oversight Board (United States), the Company’s internal control over financial reporting as of June 30, [removed: 2011,] [added: 2012,] based on the criteria established in [removed: _Internal] [added: Internal] Control—Integrated [removed: Framework_] [added: Framework] issued by the Committee of Sponsoring Organizations of the Treadway Commission and our report dated August [removed: 29, 2011] [added: 27, 2012] expressed an unqualified opinion on the Company’s internal control over financial reporting.
[removed: _/s/] [added: /s/] DELOITTE & TOUCHE [removed: LLP_][added: LLP]
[removed: MANAGEMENT’S ANNUAL REPORT ON INTERNAL CONTROL OVER FINANCIAL REPORTING][added: | | [Management's Annual Report on Internal Control over Financial Reporting](#s916CB1C93B87D91D2D3B5AFDE3B4416A) | | [33](#s916CB1C93B87D91D2D3B5AFDE3B4416A) |]
As of the end of the Company’s [removed: 2011] [added: 2012] fiscal year, management conducted an assessment of the effectiveness of the Company’s internal control over financial reporting based on the framework established in [removed: _Internal] [added: Internal] Control—Integrated [removed: Framework_] [added: Framework] issued by the Committee of Sponsoring Organizations of the Treadway Commission (COSO).
Based on this assessment, management has determined the Company’s internal control over financial reporting as of June 30, [removed: 2011] [added: 2012] was effective.
The Company’s internal control over financial reporting as of June 30, [removed: 2011] [added: 2012] has been audited by the Company’s independent registered public accounting firm, as stated in their report appearing on the next page.
[removed: REPORT OF INDEPENDENT REGISTERED PUBLIC ACCOUNTING FIRM][added: | | [Report of Independent Registered Public Accounting Firm](#sED212B32D63762486F985AFE203732FD) | | [34](#sED212B32D63762486F985AFE203732FD) |]
We have audited the internal control over financial reporting of Jack Henry & Associates, Inc. and subsidiaries (the “Company”) as of June 30, [removed: 2011,] [added: 2012,] based on criteria established in [removed: _Internal] [added: Internal] Control—Integrated [removed: Framework_] [added: Framework] issued by the Committee of Sponsoring Organizations of the Treadway Commission.
In our opinion, the Company maintained, in all material respects, effective internal control over financial reporting as of June 30, [removed: 2011,] [added: 2012,] based on the criteria established in [removed: _Internal] [added: Internal] Control—Integrated [removed: Framework_] [added: Framework] issued by the Committee of Sponsoring Organizations of the Treadway Commission.
We have also audited, in accordance with the standards of the Public Company Accounting Oversight Board (United States), the consolidated financial statements as of and for the year ended June 30, [removed: 2011] [added: 2012] of the Company and our report dated August [removed: 29, 2011] [added: 27, 2012] expressed an unqualified opinion on those financial statements.
[removed: _/s/] [added: /s/] DELOITTE & TOUCHE [removed: LLP_][added: LLP]
| [removed: | JACK] [added: JACK] HENRY & ASSOCIATES, INC. AND [removed: SUBSIDIARIES] [added: SUBSIDIARIES] | | | | | | | [added: | | | | |]
| | [removed: CONSOLIDATED STATEMENTS OF INCOME] | [removed: | | | |] [added: [Consolidated Statements of Income,](#s4A12679135723D489BC15684921B6FA3)] | |
| [removed: |] (In Thousands, Except Per Share Data) | | | | | | | [added: | | | | |]
| | [added: Year Ended June 30,] | | [removed: YEAR ENDED JUNE 30,] | | | | | [added: | | | |]
| | [added: 2012] | | [removed: 2011] | | [added: 2011 | | | |] 2010 | | [removed: 2009] |
| [added: REVENUE] | [removed: REVENUE] | | | | | | | [added: | | | |]
| [removed: |] License | [added: $] | [removed: $ 53,067] [added: 54,811] | | [added: |] $ [removed: 52,225] | [added: 53,067] | [added: | |] $ [removed: 58,434] | [added: 52,225 | |]
| [removed: |] Support and service | [added: 909,176] | [removed: 852,253] | | [added: | 852,253 | | | |] 720,504 | | [removed: 614,242] |
| [removed: |] Hardware | [added: 63,122] | [removed: 61,577] | | [added: | 61,577 | | | |] 63,857 | | [removed: 72,917] |
| [added: Total revenue] | [removed: Total revenue] [added: 1,027,109] | | [removed: 966,897] | | [added: 966,897 | | | |] 836,586 | | [removed: 745,593] |
| [removed: | COST] [added: COST] OF [removed: SALES] [added: SALES] | | | | | | | [added: | | | | |]
| [removed: |] Cost of license | [added: 6,111] | [removed: 6,285] | | [added: | 6,285 | | | |] 5,827 | | [removed: 6,885] |
| [removed: |] Cost of support and service | [added: 551,285] | [removed: 515,917] | | [added: | 515,917 | | | |] 438,476 | | [removed: 385,837] |
| [removed: |] Cost of hardware | [added: 45,983] | [removed: 45,361] | | [added: | 45,361 | | | |] 47,163 | | [removed: 53,472] |
| | | [June 30, 2012 and 201](#s0AE1C5944F5705C5F90956849207EABE)1 | [36](#s0AE1C5944F5705C5F90956849207EABE) |
August 27, 2012
August 27, 2012
| | | | | | | | | | | | |
| --- | --- | --- | --- | --- | --- | --- | --- | --- | --- | --- | --- |
| | | | | | | | | | | | |
| | | | | | | | | | | | |
| | | | | | | | | | | | |
| | | | | | | | | | | | |
| | | | | | | | | | | | |
| | | | | | | | | | | | |
| | | | | | | | | | | | |
| | | | | | | | | | | | |
| | | | | | | | | | | | |
| | | | | | | | | | | | |
| | | | | | | | | | | | |
| | | | | | | | | | | | |
| | | | | | | | | | | | |
| Cash dividends paid per share | $ | 0.440 | | | $ | 0.400 | | | $ | 0.360 | |
| | June 30, 2012 | | | | June 30, 2011 | | |
| Receivables, net | 218,305 | | | | 207,510 | | |
| Less treasury stock at cost 15,452,064 shares at 06/30/12, 14,406,635 shares at 06/30/11 | (343,956 | | ) | | (309,585 | | ) |
| | | | | | | | | | | | |
| --- | --- | --- | --- | --- | --- | --- | --- | --- | --- | --- | --- |
| | | | | | | | | | | | |
| | | | | | | | | | | | |
| | | | | | | | | | | | |
| | | | | | | | | | | | |
| | | | | | | | | | | | |
| | | | | | | | | | | | |
| | | | | | | | | | | | |
| Dividends | (38,128 | | ) | | (34,391 | | ) | | (30,461 | | ) |
| | | | | | | | | | | | |
| | | | | | | | | | | | |
| | | | | | | | | | | | |
| --- | --- | --- | --- | --- | --- | --- | --- | --- | --- | --- | --- |
| | | | | | | | | | | | |
| Customer contracts acquired | (720 | | ) | | — | | | | — | | |
To the extent hardware revenue is part of such an
Revenue-based taxes collected from customers and remitted to governmental authorities are presented on a net basis (i.e. excluded from revenues).
August 29, 2011
Management’s annual report on internal control over financial reporting now includes an assessment of the internal control over financial reporting of iPay Technologies Holding Company, LLC, acquired on June 4, 2010, which was excluded from the fiscal 2010 annual report on internal control over financial reporting.
Integration of the wholly-owned subsidiary was completed during the fourth quarter of the year ended June 30, 2011 and is not considered to have materially affected, or is reasonably likely to materially affect, the internal control over financial reporting.
August 29, 2011
| | | | | | | | |
| | | | | | | | |
| | | | | | | | |
| | | | | | | | |
| | | | | | | | |
| | | | | | | | |
| | | | | | | | |
| | | | | | | | |
| | Total | | (8,805) | | (1,457) | | (576) |
| | | | | | | | |
| | | | | | | | |
| | | | | | | | |
| | | | | | | | |
| | | | | | |
| --- | --- | --- | --- | --- | --- |
| | | | | | |
| | Receivables | | 207,510 | | 208,450 |
| | | | | | |
| | | | | | |
| | | | | | |
| | | | | | |
| | | | | | |
| | | | | | |
| | | | | | |
| | | | | | |
| | | | | | |
| | | | | | |
| | | | | | |
| | Shares issued at 06/30/11 were 100,766,173 | | | | |
| | Shares issued at 06/30/10 were 99,808,367 | | 1,008 | | 998 |
| | 14,406,635 shares at 06/30/11 and at 06/30/10 | | (309,585) | | (309,585) |
| | | | | | |
| | | | | | |
| | | | | | | |
| --- | --- | --- | --- | --- | --- | --- |
| | | | | | | |
An excerpt. Shown here: 40 of 539 rewritten, 40 of 252 added and 40 of 328 removed. The counts are complete. For every sentence, read Item 8. FINANCIAL STATEMENTS AND SUPPLEMENTARY DATA in the FY2012 filing and the FY2011 filing.
Item 9. CHANGES IN AND DISAGREEMENTS WITH ACCOUNTANTS ON ACCOUNTING AND FINANCIAL DISCLOSURES
0 rewritten, 1 added, 5 removed, 0 unchanged
None.
| | ACCOUNTING AND FINANCIAL DISCLOSURE | |
| | | |
Item 9A.
CONTROLS AND PROCEDURES 65
| | | |
Item 9A. CONTROLS AND PROCEDURES
2 rewritten, 0 added, 4 removed, 5 unchanged
The Management’s Report on Internal Control over Financial Reporting required by this Item 9A is in Item 8, “Financial Statements and Supplementary Data.” Deloitte & Touche LLP has audited our internal control over financial reporting as of June 30, [removed: 2011;] [added: 2012;] their report is included in Item 8 of this Form 10K.
During the fiscal quarter ending June 30, [removed: 2011,] [added: 2012,] there has been no change in internal control over financial reporting that has materially affected, or is reasonably likely to affect, the Company’s internal control over financial [removed: reporting, except for the integration of iPay which was completed during the fourth quarter of the year ended June 30, 2011 (see Note 12 to the Consolidated Financial Statements in Item 8).][added: reporting.]
ITEM 9B.
OTHER INFORMATION
None.
PART III
Item 9B. OTHER INFORMATION
1 rewritten, 1 added, 30 removed, 0 unchanged
[removed: | PART III | | |][added: PART III]
None.
| | | |
Item 10.
DIRECTORS, EXECUTIVE OFFICERS AND CORPORATE GOVERNANCE 66
| | | |
Item 11.
EXECUTIVE COMPENSATION 66
| | | |
Item 12.
SECURITY OWNERSHIP OF CERTAIN BENEFICIAL OWNERS AND 66
| | MANAGEMENT AND RELATED STOCKHOLDER MATTERS | |
| | | |
Item 13.
CERTAIN RELATIONSHIPS AND RELATED TRANSACTIONS, AND DIRECTOR 66
| | INDEPENDENCE | |
| | | |
Item 14.
PRINCIPAL ACCOUNTANT FEES AND SERVICES 66
| | | |
| PART IV | | |
Item 15.
EXHIBITS AND FINANCIAL STATEMENT SCHEDULES 66
In this report, all references to “JHA”, the “Company”, “we”, “us”, and “our”, refer to Jack Henry & Associates, Inc., and its consolidated subsidiaries.
FORWARD LOOKING STATEMENTS
Certain statements in this report, other than purely historical information, including estimates, projections, statements relating to our business plans, objectives and expected operating results, and the assumptions upon which those statements are based, are “forward-looking statements” within the meaning of the Private Securities Litigation Reform Act of 1995, Section 27A of the Securities Act of 1933 and Section 21E of the Securities Exchange Act of 1934.
Forward-looking statements may appear throughout this report, including without limitation, in Management's Discussion and Analysis of Financial Condition and Results of Operations.
Forward-looking statements generally are identified by the words “believe,” “project,” “expect,” “anticipate,” “estimate,” and similar expressions.
Forward-looking statements are based on current expectations and assumptions that are subject to risks and uncertainties which may cause actual results to differ materially from the forward-looking statements.
A detailed discussion of risks and uncertainties that could cause actual results and events to differ materially from such forward-looking statements is included in the section titled “Risk Factors” (Part I, Item 1A of this Form 10-K).
We undertake no obligation to update or revise publicly any forward-looking statements, whether as a result of new information, future events, or otherwise.
PART I
Item 10. DIRECTORS, EXECUTIVE OFFICERS AND CORPORATE GOVERNANCE
1 rewritten, 0 added, 0 removed, 0 unchanged
See the information under the captions “Election of Directors”, “Corporate Governance”, “Audit Committee Report”, “Executive Officers and Significant Employees” and “Section 16(a) Beneficial Ownership Reporting Compliance” in the Company’s definitive Proxy Statement for our [removed: 2011] [added: 2012] Annual Meeting of Stockholders which is incorporated herein by reference.
Item 14. PRINCIPAL ACCOUNTANT FEES AND SERVICES
1 rewritten, 0 added, 0 removed, 1 unchanged
[removed: PART IV][added: PART IV]
Item 15. EXHIBITS AND FINANCIAL STATEMENT SCHEDULES
51 rewritten, 73 added, 44 removed, 24 unchanged
[removed: (a)] [added: (a)] The following documents are filed as part of this [removed: Report:][added: Report:]
[added: \-] Reports of Independent Registered Public Accounting Firm
[added: \-] Consolidated Statements of Income for the [removed: Years Ended] [added: years ended] June 30, [removed: 2011, 2010] [added: 2012, 2011] and [removed: 2009][added: 2010]
[added: \-] Consolidated Balance Sheets as of June 30, [removed: 2011] [added: 2012] and [removed: 2010][added: 2011]
[added: \-] Consolidated Statements of Changes in Stockholders’ Equity for the [removed: Years Ended] [added: years ended] June 30, [removed: 2011, 2010] [added: 2012, 2011] and [removed: 2009][added: 2010]
[added: \-] Consolidated Statements of Cash Flows for the [removed: Years Ended] [added: years ended] June 30, [removed: 2011, 2010] [added: 2012, 2011] and [removed: 2009][added: 2010]
[added: \-] Notes to the Consolidated Financial Statements
Exhibit No. [added: Description]
[added: | 3.1.7 |] Restated Certificate of Incorporation, attached as Exhibit 3.1.7 to the Company’s Annual Report on Form 10-K for the Year ended June 30, 2003. [added: |]
[added: | 3.2.2 |] Restated and Amended Bylaws, attached as Exhibit 3.2.2 to the Company’s Current Report on Form 8-K filed November 13, 2008. [added: |]
[added: | 10.3 |] The Company’s 1995 Non-Qualified Stock Option Plan, attached as Exhibit 10.3 to the Company’s Annual Report on Form 10-K for the Year Ended June 30, 1996. [added: |]
[added: | 10.8 |] Form of Indemnity Agreement which has been entered into as of August 27, 1996, between the Company and each of its Directors and Executive Officers, attached as Exhibit 10.8 to the Company’s Annual Report on Form 10-K for the Year Ended June 30, 1996. [added: |]
[added: | 10.9 |] The Company’s 1996 Stock Option Plan, attached as Exhibit 10.9 to the Company’s Annual Report on Form 10-K for the Year Ended June 30, 1997. [added: |]
[added: | 10.21 |] Amendment to the Company’s 1996 Stock Option Plan, attached as Exhibit 10.1 to the Company’s Current Report on Form 8-K filed July 5, 2005. [added: |]
[added: | 10.27 |] The Company’s Restricted Stock Plan, attached as Exhibit 10.27 to the Company’s Annual Report on Form 10-K filed September 12, 2006. [added: |]
[added: | 10.28 |] The Company’s 2005 Non-Qualified Stock Option Plan, attached as Exhibit 10.28 to the Company’s Annual Report on Form 10-K filed September 12, 2006. [added: |]
[added: | 10.29 |] Jack Henry & Associates, Inc. 2006 Employee Stock Purchase Plan, attached as Exhibit 10.29 to the Company’s Current Report on Form 8-K filed November 6, 2006. [added: |]
[added: | 10.31 |] Form of Termination Benefits Agreement, attached as Exhibit 10.31 to the Company’s Current Report on Form 8-K filed September 10, 2007. [added: |]
[added: | 10.32 |] Form of Restricted Stock Agreement (executives), attached as Exhibit 10.32 to the Company’s Current Report on Form 8-K filed September 10, 2007. [added: |]
[added: | 10.33 |] Form of Restricted Stock Agreement (Vice presidents and certain other managers), attached as Exhibit 10.33 to the Company’s Current Report on Form 8-K filed September 10, 2007. [added: |]
[added: | 10.34 |] Amendment No. 2 to Jack Henry & Associates, Inc. 2006 Employee Stock Purchase Plan, attached as Exhibit 10.34 to the Company’s Current Report on Form 8-K filed November 1, 2007. [added: |]
[added: | 10.35 |] Jack Henry & Associates, Inc. 2007 Annual Incentive Plan, attached as Exhibit 10.35 to the Company’s Current Report on Form 8-K filed November 1, 2007. [added: |]
[added: | 10.36 |] Jack Henry & Associates, Inc. 1995 Non-Qualified Stock Option Plan, as amended May 9, 2008, attached as Exhibit 10.36 to the Company’s Annual Report on Form 10-K filed August 29, 2008. [added: |]
[added: | 10.37 |] Jack Henry & Associates, Inc. 1996 Stock Option Plan, as amended May 9, 2008, attached as Exhibit 10.37 to the Company’s Annual Report on Form 10-K filed August 29, 2008. [added: |]
[added: | 10.38 |] Jack Henry & Associates, Inc. 2005 Non-Qualified Stock Option Plan, as amended and restated May 9, 2008, attached as Exhibit 10.38 to the Company’s Annual Report on Form 10-K filed August 29, 2008. [added: |]
[added: | 10.39 |] Revised Form of Restricted Stock Agreement (executives), attached as Exhibit 10.39 to the Company’s Quarterly Report on Form 10-Q filed November 6, 2009. [added: |]
[added: | 10.40 |] Amended and Restated Credit Agreement among Jack Henry & Associates, Inc., Wells Fargo Bank, National Association, Bank of America, N.A., regions Bank and U.S. Bank National Association, attached as Exhibit 10.1 to the Company’s Current Report on Form 8-K filed June 9, 2010. [added: |]
[added: | 10.41 |] Amendment to Jack Henry & Associates Inc. Restricted Stock Plan dated August 20, 2010, attached as Exhibit 10.1 to the Company’s Current Report on Form 8-K filed August 24, 2010. [added: |]
[added: | 10.42 |] Form of Restricted Stock Unit Award Agreement, attached as Exhibit 10.2 to the Company’s Current Report on Form 8-K filed August 24, 2010. [added: |]
[added: | 10.43 |] Jack Henry & Associates Inc. Restricted Stock Plan, as amended and restated effective November 9, 2010, attached as Exhibit 10.1 to the Company’s Current Report on Form 8-K filed November 12, 2010. [added: |]
[added: | 21.1 |] List of the Company’s subsidiaries. [added: |]
[added: | 23.1 |] Consent of Independent Registered Public Accounting Firm. [added: |]
[added: | 31.1 |] Certification of [added: the] Chief Executive Officer. [added: |]
[added: | 31.2 |] Certification of [added: the] Chief Financial Officer. [added: |]
[added: | 32.1 |] Written Statement of the Chief Executive Officer Pursuant to 18 U.S.C. Section 1350. [added: |]
[added: | 32.2 |] Written Statement of the Chief Financial Officer Pursuant to 18 U.S.C. Section 1350. [added: |]
[added: | 101.INS* |] XBRL Instance Document [added: |]
[added: | 101.SCH* |] XBRL Taxonomy Extension Schema Document [added: |]
[added: | 101.CAL* |] XBRL Taxonomy Extension Calculation Linkbase Document [added: |]
[added: | 101.DEF* |] XBRL Taxonomy Extension Definition Linkbase Document [added: |]
| | |
| --- | --- |
| | |
| --- | --- |
| | |
| --- | --- |
| | |
| --- | --- |
| | |
| --- | --- |
| | |
| --- | --- |
| | |
| --- | --- |
| | |
| --- | --- |
| | |
| --- | --- |
| | |
| --- | --- |
| | |
| --- | --- |
| | |
| --- | --- |
| | |
| --- | --- |
| | |
| --- | --- |
| | |
| --- | --- |
| | |
| --- | --- |
| | |
| --- | --- |
| | |
| --- | --- |
| | |
| --- | --- |
| | |
| --- | --- |
\-
\-
\-
\-
\-
\-
Description
3.1.7
3.2.2
10.3
10.8
10.9
10.21
10.27
10.28
10.29
10.31
10.32
10.33
10.34
10.35
10.36
10.37
10.38
10.39
10.40
10.41
10.42
10.43
21.1
23.1
31.1
31.2
32.1
32.2
101.INS*
101.SCH*
101.CAL*
101.DEF*
101.LAB*
An excerpt. Shown here: 40 of 51 rewritten, 40 of 73 added and 40 of 44 removed. The counts are complete. For every sentence, read Item 15. EXHIBITS AND FINANCIAL STATEMENT SCHEDULES in the FY2012 filing and the FY2011 filing.