 filings.tools
Item 7. MANAGEMENT’S DISCUSSION AND ANALYSIS OF RESULTS OF OPERATIONS AND FINANCIAL CONDITION
86K characters. Original on sec.gov · Markdown
Item 7. MANAGEMENT’S DISCUSSION AND ANALYSIS OF RESULTS OF OPERATIONS AND FINANCIAL CONDITION
Organization and Business Segments
Description of the Company and Business Segments
Johnson & Johnson and its subsidiaries (the Company) have approximately 135,100 employees worldwide engaged in the research and development, manufacture and sale of a broad range of products in the health care field. The Company conducts business in virtually all countries of the world with the primary focus on products related to human health and well-being.
The Company is organized into three business segments: Consumer, Pharmaceutical and Medical Devices. The Consumer segment includes a broad range of products used in the baby care, oral care, beauty, over-the-counter pharmaceutical, women’s health and wound care markets. These products are marketed to the general public and sold both to retail outlets and distributors throughout the world. The Pharmaceutical segment is focused on six therapeutic areas, including immunology, infectious diseases, neuroscience, oncology, pulmonary hypertension, and cardiovascular and metabolic diseases. Products in this segment are distributed directly to retailers, wholesalers, hospitals and health care professionals for prescription use. The Medical Devices segment includes a broad range of products used in the orthopaedic, surgery, interventional solutions (cardiovascular and neurovascular), diabetes care (divested in the fiscal fourth quarter of 2018) and vision fields which are distributed to wholesalers, hospitals and retailers, and used principally in the professional fields by physicians, nurses, hospitals, eye care professionals and clinics.
The Executive Committee of Johnson & Johnson is the principal management group responsible for the strategic operations and allocation of the resources of the Company. This Committee oversees and coordinates the activities of the Consumer, Pharmaceutical and Medical Devices business segments.
In all of its product lines, the Company competes with companies both locally and globally, throughout the world. Competition exists in all product lines without regard to the number and size of the competing companies involved. Competition in research, involving the development and the improvement of new and existing products and processes, is particularly significant. The development of new and innovative products, as well as protecting the underlying intellectual property of the Company's product portfolio, is important to the Company’s success in all areas of its business. The competitive environment requires substantial investments in continuing research. In addition, the development and maintenance of customer demand for the Company’s consumer products involves significant expenditures for advertising and promotion.
Management’s Objectives
With “Our Credo” as the foundation, the Company’s purpose is to blend heart, science and ingenuity to profoundly change the trajectory of health for humanity. The Company is committed to bringing its full breadth and depth to ensure health for people today and for future generations. United around this common ambition, the Company is poised to fulfill its purpose and successfully meet the demands of the rapidly evolving markets in which it competes.
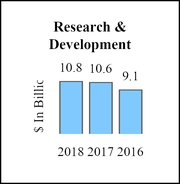
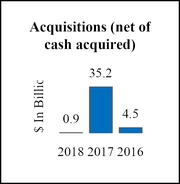
The Company is broadly based in human healthcare, and is committed to creating value by developing accessible, high quality, innovative products and services. New products introduced within the past five years accounted for approximately 25% of 2018 sales. In 2018, $10.8 billion was invested in research and development and $0.9 billion spent on acquisitions, reflecting management’s commitment to create life-enhancing innovations and to create value through partnerships that will profoundly change the trajectory of health for humanity.
A critical driver of the Company’s success, is the 135,100 diverse employees that work across more than 260 operating companies, which are located in more than 60 countries. Employees are empowered and inspired to lead with the Company’s Our Credo and purpose as guides. This allows every employee to use the Company’s reach and size to advance the Company's purpose, and to also lead with agility and urgency. Leveraging the extensive resources across the enterprise, enables the Company to innovate and execute with excellence. This ensures the Company can remain focused on addressing the unmet needs of society every day and invest for an enduring impact, ultimately delivering value to its patients, consumers and healthcare professionals, employees, communities and shareholders.
| 16 |
Results of Operations
Analysis of Consolidated Sales
In 2018, worldwide sales increased 6.7% to $81.6 billion, compared to an increases of 6.3% and 2.6% in 2017 and 2016, respectively. These sales changes consisted of the following:
| Sales increase/(decrease) due to: | 2018 | 2017 | 2016 | ||||||
| Volume | 8.5 | % | 8.0 | % | 3.2 | % | |||
| Price | (2.2 | ) | (2.0 | ) | 0.7 | ||||
| Currency | 0.4 | 0.3 | (1.3 | ) | |||||
| Total | 6.7 | % | 6.3 | % | 2.6 | % |
In 2018, the net impact of acquisitions and divestitures on the worldwide sales growth was a positive impact of 0.8%. In 2017, acquisitions and divestitures had a positive impact of 3.6% on the worldwide sales growth. In 2016, acquisitions and divestitures had a negative impact of 1.1% on the worldwide sales growth and competitive products to the Company's Hepatitis C products, OLYSIO®/SOVRIAD® (simeprevir) and INCIVO® (telaprevir), had a negative impact of 0.8% on the worldwide sales growth. Operations in Venezuela negatively impacted the worldwide sales growth 0.3%.
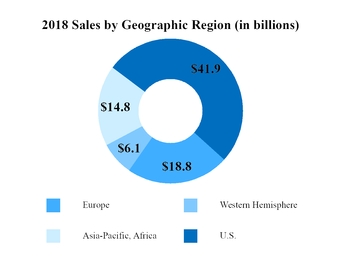
Sales by U.S. companies were $41.9 billion in 2018, $39.9 billion in 2017 and $37.8 billion in 2016. This represents increases of 5.1% in 2018, 5.4% in 2017 and 6.0% in 2016. Sales by international companies were $39.7 billion in 2018, $36.6 billion in 2017 and $34.1 billion in 2016. This represents an increase of 8.5% in 2018, 7.4% in 2017, and a decrease of 0.9% in 2016.
The five-year compound annual growth rates for worldwide, U.S. and international sales were 2.7%, 5.6% and 0.1%, respectively. The ten-year compound annual growth rates for worldwide, U.S. and international sales were 2.5%, 2.6% and 2.4%, respectively.
In 2018, sales by companies in Europe achieved growth of 9.5% as compared to the prior year, including operational growth of 6.2% and a positive currency impact of 3.3%. Sales by companies in the Western Hemisphere (excluding the U.S.) achieved growth of 1.2% as compared to the prior year, including operational growth of 8.2% and a negative currency impact of 7.0%. Sales by companies in the Asia-Pacific, Africa region achieved growth of 10.5% as compared to the prior year, including operational growth of 9.4% and a positive currency impact of 1.1%.
In 2018, the Company had three wholesalers distributing products for all three segments that represented approximately 14.0%, 11.0% and 11.0% of the total consolidated revenues. In 2017, the Company had two wholesalers distributing products for all three segments that represented approximately 14.0% and 10.0% of the total consolidated revenues. In 2016, the Company had two wholesalers distributing products for all three segments that represented approximately 13.5% and 10.7% of the total consolidated revenues.
| 17 |
Analysis of Sales by Business Segments
Consumer Segment
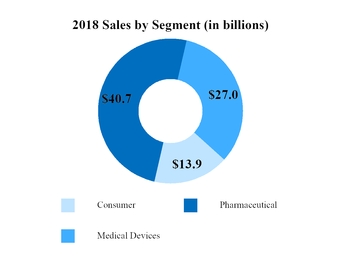
Consumer segment sales in 2018 were $13.9 billion, an increase of 1.8% from 2017, which included 2.2% operational growth and a negative currency impact of 0.4%. U.S. Consumer segment sales were $5.8 billion, an increase of 3.5%. International sales were $8.1 billion, an increase of 0.7%, which included 1.4% operational growth and a negative currency impact of 0.7%. In 2018, acquisitions and divestitures had a net negative impact of 1.0% on the operational sales growth of the worldwide Consumer segment.
Major Consumer Franchise Sales:
| % Change | ||||||||||||||||
| (Dollars in Millions) | 2018 | 2017 | 2016 | ’18 vs. ’17 | ’17 vs. ’16 | |||||||||||
| Beauty | $ | 4,382 | 4,200 | 3,897 | 4.3 | % | 7.8 | |||||||||
| OTC | 4,334 | 4,126 | 3,977 | 5.0 | 3.7 | |||||||||||
| Baby Care | 1,858 | 1,916 | 2,001 | (3.0 | ) | (4.2 | ) | |||||||||
| Oral Care | 1,555 | 1,531 | 1,568 | 1.6 | (2.4 | ) | ||||||||||
| Women’s Health | 1,049 | 1,050 | 1,067 | (0.1 | ) | (1.6 | ) | |||||||||
| Wound Care/Other | 675 | 779 | 797 | (13.4 | ) | (2.3 | ) | |||||||||
| Total Consumer Sales | $ | 13,853 | 13,602 | 13,307 | 1.8 | % | 2.2 |
The Beauty franchise sales of $4.4 billion increased 4.3% as compared to the prior year. Growth was primarily driven by NEUTROGENA®, OGX® and AVEENO® products as well as strength of DR. CI: LABO and DABAO® products outside the U.S. Growth was partially offset by the divestiture of NIZORAL®.
The Over-the-Counter (OTC) franchise sales of $4.3 billion increased 5.0% as compared to the prior year. Growth was primarily driven by share, consumption and market growth across multiple brands including ZYRTEC® , TYLENOL® and Children's MOTRIN®, as well as digestive health products and anti-smoking aids. Additionally, sales from the recent U.S. acquisition of Zarbee's Inc. contributed approximately 0.9% to growth.
The Baby Care franchise sales were $1.9 billion in 2018, a decrease of 3.0% compared to the prior year, primarily due to JOHNSON's® share decline and increased trade promotions due to the JOHNSON's® baby relaunch and the negative impact of currency. This was partially offset by strong growth of AVEENO® baby driven by geographic expansion.
The Oral Care franchise sales of $1.6 billion increased 1.6% as compared to the prior year, primarily driven by strong marketing campaigns and new product launches.
The Women’s Health franchise sales were $1.0 billion in 2018, a decrease of 0.1% as compared to the prior year. Growth in Latin America was offset by the negative impact of currency.
The Wound Care/Other franchise sales were $0.7 billion in 2018, a decrease of 13.4% as compared to the prior year, primarily due to the divestiture of COMPEED®.
Consumer segment sales in 2017 were $13.6 billion, an increase of 2.2% from 2016, which included 1.3% operational growth and a positive currency impact of 0.9%. U.S. Consumer segment sales were $5.6 billion, an increase of 2.7%. International sales were $8.0 billion, an increase of 1.9%, which included 0.4% operational growth and a positive currency impact of 1.5%. In 2017, acquisitions and divestitures had a net positive impact of 1.8% on the operational sales growth of the worldwide Consumer segment.
| 18 |
Pharmaceutical Segment
Pharmaceutical segment sales in 2018 were $40.7 billion, an increase of 12.4% from 2017, which included operational growth of 11.8% and a positive currency impact of 0.6%. U.S. sales were $23.3 billion, an increase of 8.4%. International sales were $17.4 billion, an increase of 18.0%, which included 16.5% operational growth and a positive currency impact of 1.5%. In 2018, acquisitions and divestitures had a net positive impact of 3.4% on the operational sales growth of the worldwide Pharmaceutical segment.
Major Pharmaceutical Therapeutic Area Sales:*
| % Change | ||||||||||||||||
| (Dollars in Millions) | 2018 | 2017 | 2016 | ’18 vs. ’17 | ’17 vs. ’16 | |||||||||||
| Total Immunology | $ | 13,120 | 12,244 | 11,968 | 7.2 | % | 2.3 | |||||||||
| REMICADE® | 5,326 | 6,315 | 6,966 | (15.7 | ) | (9.3 | ) | |||||||||
| SIMPONI®/SIMPONI ARIA® | 2,084 | 1,833 | 1,745 | 13.7 | 5.0 | |||||||||||
| STELARA® | 5,156 | 4,011 | 3,232 | 28.5 | 24.1 | |||||||||||
| TREMFYA® | 544 | 63 | — | ** | ** | |||||||||||
| Other Immunology | 10 | 22 | 25 | (54.5 | ) | (12.0 | ) | |||||||||
| Total Infectious Diseases | 3,304 | 3,154 | 3,208 | 4.8 | (1.7 | ) | ||||||||||
| EDURANT®/rilpivirine | 816 | 714 | 573 | 14.3 | 24.6 | |||||||||||
| PREZISTA®/ PREZCOBIX®/REZOLSTA®/SYMTUZA® | 1,955 | 1,821 | 1,851 | 7.4 | (1.6 | ) | ||||||||||
| Other Infectious Diseases | 533 | 619 | 784 | (13.9 | ) | (21.0 | ) | |||||||||
| Total Neuroscience | 6,077 | 5,986 | 6,085 | 1.5 | (1.6 | ) | ||||||||||
| CONCERTA®/methylphenidate | 663 | 791 | 863 | (16.2 | ) | (8.3 | ) | |||||||||
| INVEGA SUSTENNA®/XEPLION®/INVEGA TRINZA®/TREVICTA® | 2,928 | 2,569 | 2,214 | 14.0 | 16.0 | |||||||||||
| RISPERDAL CONSTA® | 737 | 805 | 893 | (8.4 | ) | (9.9 | ) | |||||||||
| Other Neuroscience | 1,749 | 1,821 | 2,115 | (4.0 | ) | (13.9 | ) | |||||||||
| Total Oncology | 9,844 | 7,258 | 5,807 | 35.6 | 25.0 | |||||||||||
| DARZALEX® | 2,025 | 1,242 | 572 | 63.0 | ** | |||||||||||
| IMBRUVICA® | 2,615 | 1,893 | 1,251 | 38.1 | 51.3 | |||||||||||
| VELCADE® | 1,116 | 1,114 | 1,224 | 0.2 | (9.0 | ) | ||||||||||
| ZYTIGA® /abiraterone acetate | 3,498 | 2,505 | 2,260 | 39.6 | 10.8 | |||||||||||
| Other Oncology | 590 | 504 | 500 | 17.1 | 0.8 | |||||||||||
| Pulmonary Hypertension | 2,573 | 1,327 | — | 93.9 | *** | |||||||||||
| OPSUMIT® | 1,215 | 573 | — | ** | *** | |||||||||||
| TRACLEER® | 546 | 403 | — | 35.5 | *** | |||||||||||
| UPTRAVI® | 663 | 263 | — | ** | *** | |||||||||||
| Other | 149 | 88 | — | 69.3 | *** | |||||||||||
| Cardiovascular / Metabolism / Other | 5,816 | 6,287 | 6,396 | (7.5 | ) | (1.7 | ) | |||||||||
| XARELTO® | 2,477 | 2,500 | 2,288 | (0.9 | ) | 9.3 | ||||||||||
| INVOKANA®/ INVOKAMET® | 881 | 1,111 | 1,407 | (20.7 | ) | (21.0 | ) | |||||||||
| PROCRIT®/EPREX® | 988 | 972 | 1,105 | 1.6 | (12.0 | ) | ||||||||||
| Other | 1,470 | 1,704 | 1,596 | (13.7 | ) | 6.8 | ||||||||||
| Total Pharmaceutical Sales | $ | 40,734 | 36,256 | 33,464 | 12.4 | % | 8.3 |
- Prior year amounts have been reclassified to conform to current year presentation
** Percentage greater than 100% or not meaningful
***Products acquired from Actelion on June 16, 2017
| 19 |
Immunology products sales were $13.1 billion in 2018, representing an increase of 7.2% as compared to the prior year. Growth was driven by strong uptake of STELARA® (ustekinumab) in Crohn's disease, strong launch uptake of TREMFYA® (guselkumab), expanded indications of SIMPONI®/SIMPONI ARIA® (golimumab), and the U.S. immunology market growth. Immunology was negatively impacted by lower sales of REMICADE® (infliximab) due to increased discounts/rebates and biosimilar competition.
The patents for REMICADE® (infliximab) in certain countries in Europe expired in February 2015. Biosimilar versions of REMICADE® have been introduced in certain markets outside the U.S., resulting in a reduction in sales of REMICADE® in those markets. Additional biosimilar competition will likely result in a further reduction in REMICADE® sales in markets outside the United States. In the U.S., a biosimilar version of REMICADE® was introduced in 2016, and additional competitors continue to enter the market. Continued infliximab biosimilar competition in the U.S. market will result in a further reduction in U.S. sales of REMICADE®. See Note 21 to the Consolidated Financial Statements for a description of legal matters regarding the REMICADE® patents.
Infectious disease products sales were $3.3 billion in 2018, representing an increase of 4.8% as compared to the prior year. Sales growth of PREZCOBIX®/REZOLSTA® (darunavir/cobicistat), EDURANT®/rilpivirine, and the launch of SYMTUZA® and JULUCA® (dolutegravir/rilpivirine) was partially offset by lower sales of PREZISTA®(darunavir).
Neuroscience products sales were $6.1 billion, representing an increase of 1.5% as compared to the prior year. Strong sales of long-acting injectables INVEGA TRINZA®/TREVICTA®(paliperidone palmitate) and INVEGA SUSTENNA®/XEPLION® were partially offset by cannibalization of RISPERDAL CONSTA® (risperidone) and generic competition for CONCERTA®/methylphenidate.
Oncology products achieved sales of $9.8 billion in 2018, representing an increase of 35.6% as compared to the prior year. Contributors to the growth were strong sales of DARZALEX® (daratumumab) with continued market growth and share gain, IMBRUVICA® (ibrutinib) due to increased patient uptake globally and sales of ZYTIGA® (abiraterone acetate) driven by LATITUDE data and market growth. Additionally, sales from the launch of ERLEADA™ (apalutamide) contributed to the growth. A number of companies marketing generic pharmaceuticals have filed Abbreviated New Drug Applications (ANDAs) with the FDA, or undertaken similar regulatory processes outside of the U.S., seeking to market generic forms of ZYTIGA® prior to expiration of its applicable patents. These ANDAs include allegations of non-infringement and invalidity of the applicable patents. In October 2018, the Court issued a ruling invalidating all asserted claims of the applicable patent. Janssen has appealed the Court’s decision. In November 2018, the U.S. Court of Appeals for the Federal Circuit denied Janssen’s request for an injunction pending appeal. As a result, several generic versions of ZYTIGA® have entered the market, resulting in a decline in sales of ZYTIGA® in the United States. In 2018, the Company reported U.S. sales of $1.8 billion for ZYTIGA®. See Note 21 to the Consolidated Financial Statements for a description of legal matters regarding ZYTIGA®.
The Pulmonary Hypertension therapeutic area was established with the acquisition of Actelion Ltd on June 16, 2017. Sales in 2018 represented a full year as compared to half a year in 2017. Sales of OPSUMIT® (macitentan) and UPTRAVI® (selexipag) were positively impacted by market growth and share gains while sales of TRACLEER® (bosetan) were negatively impacted by increased use of OPSUMIT® and generics.
Cardiovascular/Metabolism/Other products sales were $5.8 billion, a decline of 7.5% as compared to the prior year. Lower sales of INVOKANA®/INVOKAMET® (canagliflozin) in the U.S. was primarily due to an increase in price discounts, higher rebates and market share decline driven by competitive pressure. Lower sales of XARELTO® (rivaroxaban) were driven by an increase in discounts and rebates, partially offset by an increase in market share.
| 20 |
During 2018, the Company advanced its pipeline with several regulatory submissions and approvals for new drugs and additional indications for existing drugs as follows:
| Product Name (Chemical Name) | Indication | US Approval | EU Approval | US Filing | EU Filing |
| DARZALEX® (daratumumab) | Frontline multiple myeloma transplant ineligible patients in combination with bortezomib, melphalan, and prednisone | Ÿ | Ÿ | ||
| erdafitinib | Treatment of locally advanced or metastatic urothelial cancer | Ÿ | |||
| ERLEADA™ (apalutamide) | Treatment of non-metastatic castration-resistant prostate cancer | Ÿ | Ÿ | ||
| esketamine | Antidepressant for treatment-resistant depression in adults | Ÿ | Ÿ | ||
| IMBRUVICA® (ibrutinib) | Treatment of Waldenstrom's macroglobulinemia used in combination with rituximab | Ÿ | Ÿ | ||
| Treatment for previously untreated Chronic Lymphocytic Leukemia in combination with obinutuzumab | Ÿ | Ÿ | |||
| INVOKANA® (canagliflozin) | Reduce the risk of death in type 2 diabetes with established, or risk for, cardiovascular disease. (CANVAS/CANVAS-R ) | Ÿ | Ÿ | ||
| JULUCA® (rilpivirine and dolutegravir) | Single-tablet, once-daily, two-drug regimen for the treatment of HIV-1 infection | Ÿ | |||
| OPSUMIT® (macitentan) | Treatment of adults with inoperable chronic thromboembolic pulmonary hypertension to improve exercise capacity and pulmonary vascular resistance | Ÿ | Ÿ | ||
| STELARA® (ustekinumab) | Treatment of adults with moderately to severely active ulcerative colitis | Ÿ | Ÿ | ||
| SYMTUZA® (darunavir/cobicistat/ emtricitabine/tenofovir alafenamide) | A complete darunavir-based single-tablet regimen for the treatment of HIV-1 infection | Ÿ | |||
| TREMFYA® (guselkumab) | Patient controlled injector for the treatment of adults living with moderate to severe plaque psoriasis | Ÿ | Ÿ | ||
| XARELTO® (rivaroxaban) | Treatment to reduce the risk of major cardiovascular events in people with chronic coronary or peripheral artery disease | Ÿ | |||
| For the prevention of venous thromboembolism for medically ill patients | Ÿ | ||||
| ZYTIGA® (abiraterone acetate) | Treatment of Hormone Naïve Metastatic Prostate Cancer | Ÿ |
Pharmaceutical segment sales in 2017 were $36.3 billion, an increase of 8.3% from 2016, which included operational growth of 8.0% and a positive currency impact of 0.3%. U.S. sales were $21.5 billion, an increase of 6.7%. International sales were $14.8 billion, an increase of 10.8%, which included 10.1% operational growth and a positive currency impact of 0.7%. In 2017, acquisitions and divestitures had a net positive impact of 3.8% on the operational sales growth of the worldwide Pharmaceutical segment. Adjustments to previous reserve estimates, as compared to the prior year, negatively impacted the reported Pharmaceutical segment operational growth by approximately 1.8%, primarily in the Immunology and Cardiovascular/Metabolism/Other therapeutic areas.
| 21 |
Medical Devices Segment
The Medical Devices segment sales in 2018 were $27.0 billion, an increase of 1.5% from 2017, which included an operational increase of 1.1% and a positive currency impact of 0.4%. U.S. sales were $12.8 billion, an increase of 0.1% as compared to the prior year. International sales were $14.2 billion, an increase of 2.8% as compared to the prior year, with an operational increase of 1.9% and a positive currency impact of 0.9%. In 2018, acquisitions and divestitures had a net negative impact of 1.5% on the worldwide operational sales growth of the Medical Devices segment as compared to 2017.
Major Medical Devices Franchise Sales:*
| % Change | ||||||||||||||||
| (Dollars in Millions) | 2018 | 2017 | 2016 | ’18 vs. ’17 | ’17 vs. ’16 | |||||||||||
| Surgery | $ | 9,901 | 9,559 | 9,296 | 3.6 | % | 2.8 | |||||||||
| Advanced | 4,002 | 3,756 | 3,517 | 6.5 | 6.8 | |||||||||||
| General | 4,557 | 4,463 | 4,362 | 2.1 | 2.3 | |||||||||||
| Specialty | 1,342 | 1,340 | 1,417 | 0.1 | (5.4 | ) | ||||||||||
| Orthopaedics | 8,885 | 9,058 | 9,128 | (1.9 | ) | (0.8 | ) | |||||||||
| Hips | 1,418 | 1,394 | 1,361 | 1.7 | 2.4 | |||||||||||
| Knees | 1,502 | 1,523 | 1,524 | (1.4 | ) | (0.1 | ) | |||||||||
| Trauma | 2,699 | 2,616 | 2,569 | 3.2 | 1.8 | |||||||||||
| Spine & Other | 3,266 | 3,525 | 3,674 | (7.3 | ) | (4.1 | ) | |||||||||
| Vision | 4,553 | 4,063 | 2,785 | 12.1 | 45.9 | |||||||||||
| Contact Lenses/Other | 3,302 | 3,036 | 2,785 | 8.8 | 9.0 | |||||||||||
| Surgical | 1,251 | 1,027 | — | 21.8 | ** | |||||||||||
| Interventional Solutions (1) | 2,646 | 2,296 | 2,055 | 15.2 | 11.7 | |||||||||||
| Diabetes Care | 1,009 | 1,615 | 1,789 | (37.5 | ) | (9.7 | ) | |||||||||
| Diagnostics (2) | — | 1 | 66 | *** | *** | |||||||||||
| Total Medical Devices Sales | $ | 26,994 | 26,592 | 25,119 | 1.5 | % | 5.9 |
(1)Previously referred to as Cardiovascular
(2)On June 30, 2014, the Company divested the Ortho-Clinical Diagnostics business (the Diagnostics Franchise) and amounts represent transitional service agreement that concluded in 2017.
- Prior year amounts have been reclassified to conform to current year presentation
**Products acquired from Abbott Medical Optics (AMO) on February 27, 2017
*** Percentage greater than 100% or not meaningful
The Surgery franchise sales were $9.9 billion in 2018, an increase of 3.6% from 2017. Growth in Advanced Surgery was primarily driven by endocutter, biosurgery and energy products. Growth in General Surgery was primarily driven by wound care products. Growth in Specialty Surgery was primarily driven by Advanced Sterilization Products.
The Orthopaedics franchise sales were $8.9 billion in 2018, a decrease of 1.9% from 2017. The decline in Spine & Other was primarily due to the Codman Neurosurgery divestiture and share loss in Spine partially offset by new product launches. The decline in knees was primarily due to competitive pressure in the U.S. partially offset by growth in Asia Pacific. Growth in hips and trauma was due to continued uptake of new products.
The Vision franchise achieved sales of $4.6 billion in 2018, an increase of 12.1% from 2017. Growth was primarily driven by strength of the astigmatism and daily disposable lenses in the OASYS® contact lenses category. Surgical growth was driven by cataract performance primarily outside the U.S.
The Interventional Solutions franchise (includes the Cerenovus business previously included in Spine and Other in Orthopaedics) sales were $2.6 billion, an increase of 15.2% from 2017. Strong growth in the electrophysiology business was driven by Atrial Fibrillation procedure growth and continued uptake of the THERMOCOOL SMARTTOUCH® Contact Force Sensing Catheter.
The Diabetes Care franchise sales were $1.0 billion, a decrease of 37.5% from 2017. The decline was primarily due to divestiture of its LifeScan business in the fiscal fourth quarter of 2018 and the Company's decision to exit the Animas insulin pump business in the fiscal fourth quarter of 2017.
The Medical Devices segment sales in 2017 were $26.6 billion, an increase of 5.9% from 2016, which included an operational increase of 5.7% and a positive currency impact of 0.2%. U.S. sales were $12.8 billion, an increase of 4.5% as compared to the prior year. International sales were $13.8 billion, an increase of 7.1% as compared to the prior year, with an
| 22 |
operational increase of 6.7% and a positive currency impact of 0.4%. In 2017, acquisitions and divestitures had a net positive impact of 4.2% on the worldwide operational sales growth of the Medical Devices segment as compared to 2016.
Analysis of Consolidated Earnings Before Provision for Taxes on Income
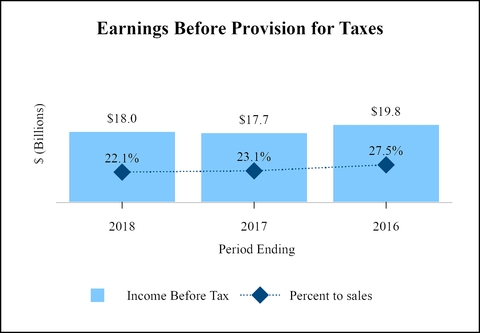
Consolidated earnings before provision for taxes on income was $18.0 billion, $17.7 billion and $19.8 billion for the fiscal years ended 2018, 2017 and 2016, respectively. As a percent to sales, consolidated earnings before provision for taxes on income was 22.1%, 23.1%, and 27.5% in 2018, 2017 and 2016, respectively.
Cost of Products Sold and Selling, Marketing and Administrative Expenses: Cost of products sold and selling, marketing and administrative expenses as a percent to sales were as follows:*
| % of Sales | 2018 | 2017 | 2016 | ||||||
| Cost of products sold* | 33.2 | % | 33.3 | 30.3 | |||||
| Percent point increase/(decrease) over the prior year | (0.1 | ) | 3.0 | (0.3 | ) | ||||
| Selling, marketing and administrative expenses* | 27.6 | % | 28.1 | 27.9 | |||||
| Percent point increase/(decrease) over the prior year | (0.5 | ) | 0.2 | (2.2 | ) |
*Prior years amounts were reclassified to conform to current year presentation (adoption of ASU 2017-07)
In 2018, cost of products sold as a percent to sales decreased to 33.2% from 33.3% as compared to the same period a year ago primarily due to lower inventory step-up costs related to the Actelion acquisition and favorable product and segment mix driven by a higher percentage of sales from the Pharmaceutical segment. This was mostly offset by higher amortization expense primarily related to the Actelion acquisition on June 16, 2017. Intangible asset amortization expense of $4.4 billion was included in cost of products sold for 2018 as compared to $3.0 billion in 2017. There was a decrease in the percent to sales of selling, marketing and administrative expenses in 2018 as compared to the prior year, primarily due to lower costs relative to sales growth in the Pharmaceutical business and favorable segment mix.
In 2017, cost of products sold as a percent to sales increased to 33.3% from 30.3% as compared to the same period a year ago. The unfavorable increase was primarily driven by $2.3 billion of higher amortization expense and charges for inventory step-up related to the recent acquisitions, primarily Actelion. Intangible asset amortization expense of $3.0 billion was included in cost of products sold for 2017 as compared to $1.2 billion in 2016. There was an increase in the percent to sales of selling, marketing and administrative expenses in 2017 as compared to the prior year, primarily due to investments in new product launches partially offset by favorable mix.
| 23 |
Research and Development Expense: Research and development expense by segment of business was as follows:*
| 2018 | 2017 | 2016 | |||||||||||||||||
| (Dollars in Millions) | Amount | % of Sales** | Amount | % of Sales** | Amount | % of Sales** | |||||||||||||
| Consumer | $ | 565 | 4.1 | % | 586 | 4.3 | 585 | 4.4 | |||||||||||
| Pharmaceutical | 8,446 | 20.7 | 8,392 | 23.1 | 7,001 | 20.9 | |||||||||||||
| Medical Devices | 1,764 | 6.5 | 1,616 | 6.1 | 1,557 | 6.2 | |||||||||||||
| Total research and development expense | $ | 10,775 | 13.2 | % | 10,594 | 13.9 | 9,143 | 12.7 | |||||||||||
| Percent increase/(decrease) over the prior year | 1.7 | % | 15.9 | 1.6 |
| *Prior years amounts were reclassified to conform to current year presentation (adoption of ASU 2017-07) **As a percent to segment sales |
Research and development activities represent a significant part of the Company's business. These expenditures relate to the processes of discovering, testing and developing new products, upfront payments and milestones, improving existing products, as well as ensuring product efficacy and regulatory compliance prior to launch. The Company remains committed to investing in research and development with the aim of delivering high quality and innovative products. In 2018, worldwide costs of research and development activities increased by 1.7% compared to 2017 but decreased as a percent of sales. The decrease as a percent of sales in the Pharmaceutical segment was attributable to lower costs relative to sales growth. The increased dollar spend in the Medical Devices and Pharmaceutical segments was for investment spending to advance the pipeline. In 2017, worldwide costs of research and development activities increased by 15.9% compared to 2016. The increase as a percent of sales was primarily in the Pharmaceutical segment due to general portfolio progression as well as collaborative agreements entered into with Idorsia Ltd. and Legend Biotech. Research facilities are located in the U.S., Belgium, Brazil, China, France, Germany, India, Israel, the Netherlands, Poland, Singapore, Sweden, Switzerland and the United Kingdom with additional R&D support in over 30 other countries.
In-Process Research and Development (IPR&D): In 2018, the Company recorded an IPR&D charge of $1.1 billion. Of the $1.1 billion, a partial impairment charge of $0.8 billion related to the development program of AL-8176, an investigational drug for the treatment of Respiratory Syncytial Virus (RSV) and human metapneumovirus (hMPV) acquired with the 2014 acquisition of Alios Biopharma Inc. The impairment charge was calculated based on updated cash flow projections discounted for the inherent risk in the asset development and reflects the impact of the phase 2b clinical trial suspension, a decrease in the probability of success factors and the ongoing analysis of asset development activities. The Company continues to evaluate information with respect to the development program and will monitor the remaining $0.9 billion intangible asset for further impairment. In addition, an impairment charge of $0.3 billion was recorded for the discontinuation of the development project for an anti-thrombin antibody associated with the 2015 acquisition of XO1 Limited.
In 2017, the Company recorded an IPR&D charge of $0.4 billion primarily for the discontinuation of certain development projects related to Novira which was acquired in 2015. The product development was canceled due to safety concerns. In 2016, the Company recorded an IPR&D charge of $29 million for the discontinuation of a development program related to Crucell.
Other (Income) Expense, Net: Other (income) expense, net is the account where the Company records gains and losses related to the sale and write-down of certain investments in equity securities held by Johnson & Johnson Innovation - JJDC, Inc. (JJDC), unrealized gains and losses on investments, gains and losses on divestitures, certain transactional currency gains and losses, acquisition-related costs, litigation accruals and settlements, as well as royalty income.
The change in other (income) expense, net for the fiscal year 2018 was an unfavorable change of $1.4 billion primarily due to litigation expense of $2.0 billion in 2018 as compared to $1.3 billion in 2017. Additionally, 2018 included unrealized losses on securities of $0.2 billion and lower realized gains of $0.4 billion related to investments in equity securities as compared to the prior year. This was partially offset by a reversal of a contingent liability of $0.2 billion and lower costs of $0.1 billion related to the Actelion and AMO acquisitions in 2018 as compared to 2017. The fiscal year of 2017 included a gain of $0.2 billion related to monetization of future royalty receivables offset by an asset impairment charge of $0.2 billion primarily related to the insulin pump business. Divestiture gains were approximately $1.2 billion in 2018 and included the LifeScan business, NIZORAL®, RoC® and certain non-strategic Pharmaceutical products. Divestiture gains were approximately $1.3 billion in 2017 and primarily included the Codman Neurosurgery and COMPEED® divestitures. Additionally, restructuring related expense in 2018 was $0.3 billion as compared to $0.4 billion 2017.
The change in other (income) expense, net for the fiscal year 2017 was a favorable change of $0.3 billion due to higher gains of $0.7 billion on the sale of assets/businesses, primarily the Codman Neurosurgery and COMPEED® divestitures, a gain of $0.2 billion related to monetization of future royalty receivables and a higher gain of $0.3 billion related to the sale of certain investments in equity securities as compared to the prior year. This was partially offset by higher litigation expense of $0.4 billion, $0.3 billion of acquisition costs related to Actelion and AMO, an asset impairment charge of $0.2 billion primarily
| 24 |
related to the insulin pump business and a higher restructuring related charge of $0.2 billion as compared to the fiscal year 2016.
Interest (Income) Expense: Interest income was higher in 2018 as compared to 2017 due to a higher average interest rate and a benefit from net investment hedging partially offset by a lower average cash, cash equivalents and marketable securities balance during the period. Cash, cash equivalents and marketable securities totaled $19.7 billion at the end of 2018, and averaged $19.0 billion as compared to the cash, cash equivalents and marketable securities total of $18.3 billion and $30.1 billion average cash balance in 2017. The decrease in the average balance of cash, cash equivalents and marketable securities was due to the use of cash for general corporate purposes, primarily the Actelion acquisition for $29.6 billion, net of cash acquired late in the fiscal second quarter of 2017.
Interest expense in 2018 was higher as compared to 2017 due to a higher average debt balance. The average debt balance was $32.5 billion in 2018 versus $30.9 billion in 2017. The total debt balance at the end of 2018 was $30.5 billion as compared to $34.6 billion at the end of 2017.
Interest income in 2017 increased slightly as compared to 2016 due to higher average interest rates partially offset by lower cash, cash equivalents and marketable securities balances during the period. Cash, cash equivalents and marketable securities totaled $18.3 billion at the end of 2017, and averaged $30.1 billion as compared to the $40.1 billion average cash balance in 2016. The decrease in the balance of cash, cash equivalents and marketable securities was due to the use of cash for general corporate purposes including acquisitions, primarily the Actelion acquisition for $29.6 billion, net of cash acquired.
Interest expense in 2017 was higher as compared to 2016. The average debt balance was $30.9 billion in 2017 versus $23.5 billion in 2016. The total debt balance at the end of 2017 was $34.6 billion as compared to $27.1 billion at the end of 2016. The higher debt balance of approximately $7.5 billion was primarily due to increased borrowings. The Company increased borrowings in February and November of 2017, capitalizing on favorable terms in the capital markets. The proceeds of the borrowings were used for general corporate purposes, including the completion of the stock repurchase program.
Income Before Tax by Segment
Income before tax by segment of business were as follows:
| Income Before Tax | Segment Sales | Percent of Segment Sales | ||||||||||||||||
| (Dollars in Millions) | 2018 | 2017 | 2018 | 2017 | 2018 | 2017 | ||||||||||||
| Consumer | $ | 2,320 | 2,524 | 13,853 | 13,602 | 16.7 | % | 18.6 | ||||||||||
| Pharmaceutical | 12,568 | 11,083 | 40,734 | 36,256 | 30.9 | 30.6 | ||||||||||||
| Medical Devices | 4,397 | 5,392 | 26,994 | 26,592 | 16.3 | 20.3 | ||||||||||||
| Total (1) | 19,285 | 18,999 | 81,581 | 76,450 | 23.6 | 24.9 | ||||||||||||
| Less: Expenses not allocated to segments (2) | 1,286 | 1,326 | ||||||||||||||||
| Earnings before provision for taxes on income | $ | 17,999 | 17,673 | 81,581 | 76,450 | 22.1 | % | 23.1 |
| (1) | See Note 18 to the Consolidated Financial Statements for more details. |
| (2) | Amounts not allocated to segments include interest (income) expense and general corporate (income) expense. |
Consumer Segment: In 2018, the Consumer segment income before tax as a percent to sales was 16.7%, versus 18.6% in 2017. The decrease in the income before tax as a percent of sales in 2018 as compared to 2017 was primarily attributable to higher litigation expense of $0.3 billion in 2018 partially offset by slower increases in expenses relative to the increase in sales. Divestiture gains for the fiscal year of 2018, which included the divestitures of NIZORAL® and RoC® were comparable to fiscal year of 2017. A gain of $0.3 billion was recognized from the divestiture of NIZORAL®.
In 2017, the Consumer segment income before tax as a percent to sales was 18.6%, versus 18.3% in 2016. The increase in the income before tax as a percent of sales in 2017 as compared to 2016 was attributable to higher gains on divestitures, primarily the divestiture of COMPEED® in 2017. This was partially offset by higher selling, marketing and administrative expenses as compared to the prior year due to increased advertising and promotional spending and slightly higher amortization expense in 2017 related to acquisitions. Additionally, the fiscal year 2016 was negatively impacted by operations in Venezuela.
Pharmaceutical Segment: In 2018, the Pharmaceutical segment income before tax as a percent to sales was 30.9% versus 30.6% in 2017. The increase in the income before tax as a percent of sales was primarily due to lower inventory step-up costs related to Actelion of $0.6 billion, favorable product mix and slower increases in expenses relative to the increase in sales, a contingent liability reversal of $0.2 billion and higher divestiture gains of $0.2 billion from divestitures of certain non-strategic Pharmaceutical products. This was partially offset by higher amortization expense of $1.3 billion primarily related to the Actelion acquisition, a higher IPR&D charge of $0.7 billion and an unrealized loss on securities of $0.2 billion as compared to
| 25 |
the prior year. Additionally, 2017 included a gain of $0.2 billion related to monetization of future royalty receivables and a higher gain of $0.3 billion related to the sale of certain investments in equity securities.
In 2017, the Pharmaceutical segment income before tax as a percent to sales was 30.6% versus 38.3% in 2016. The decrease in the income before tax as a percent of sales was primarily due to $2.3 billion of higher amortization expense and other costs related to the Actelion acquisition, higher research and development expense, a higher IPR&D charge of $0.4 billion related to Novira and lower gains on divestitures as compared to the prior year. Additionally, the fiscal year 2016 included a positive adjustment of $0.5 billion to previous reserve estimates. This was partially offset by a gain of $0.2 billion related to monetization of future royalty receivables, a higher gain of $0.2 billion related to the sale of certain investments in equity securities and favorable product mix in 2017.
Medical Devices Segment: In 2018, the Medical Devices segment income before tax as a percent to sales was 16.3% versus 20.3% in 2017. The decrease in the income before tax as a percent to sales was primarily due higher litigation expense of $1.7 billion in 2018 as compared to $1.1 billion in 2017 and higher investments in the business in 2018. Additionally, 2018 had lower divestiture gains of approximately $0.3 billion as compared to divestiture gains in 2017. In 2018 the Company recorded a gain of $0.5 billion related to the LifeScan divestiture. This was partially offset by lower restructuring expense of $0.2 billion in 2018 as compared to 2017. Additionally, 2017 included an asset impairment charge of $0.2 billion primarily related to the insulin pump business.
In 2017, the Medical Devices segment income before tax as a percent to sales was 20.3% versus 22.2% in 2016. The decrease in the income before tax as a percent to sales was primarily due to $0.3 billion of higher amortization expense and other acquisition costs related to AMO, $0.3 billion of higher litigation, an asset impairment charge of $0.2 billion primarily related to the insulin pump business, $0.1 billion of higher restructuring and investments in new product launches as compared to the fiscal year 2016. This was partially offset by $0.8 billion higher gains in 2017 related to divestitures, primarily the divestiture of Codman Neurosurgery.
Restructuring: In the first quarter of 2016, the Company announced restructuring actions in its Medical Devices segment. The Company has achieved approximately $0.7 billion of annualized pre-tax cost saving in 2018 and is on track to achieve the annualized pre-tax cost savings of $0.8 billion to $1.0 billion as outlined in the restructuring actions. The savings will provide the Company with added flexibility and resources to fund investment in new growth opportunities and innovative solutions for customers and patients. In 2018, the Company recorded a pre-tax charge of $462 million, of which $46 million is included in cost of products sold and $227 million is included in other (income) expense. Total project costs of approximately $2.5 billion have been recorded since the restructuring was announced. This restructuring program was completed in the fiscal fourth quarter of 2018.
In the second quarter of 2018, the Company announced plans to implement actions across its global supply chain that are intended to enable the Company to focus resources and increase investments in critical capabilities, technologies and solutions necessary to manufacture and supply its product portfolio of the future, enhance agility and drive growth. The Company expects these supply chain actions will include expanding its use of strategic collaborations, and bolstering its initiatives to reduce complexity, improving cost-competitiveness, enhancing capabilities and optimizing its network. Discussions regarding specific future actions are ongoing and are subject to all relevant consultation requirements before they are finalized. In total, the Company expects these actions to generate approximately $0.6 to $0.8 billion in annual pre-tax cost savings that will be substantially delivered by 2022. The Company expects to record pre-tax restructuring charges of approximately $1.9 to $2.3 billion. The Company estimates that approximately 70% of the cumulative pre-tax costs will result in cash outlays. In 2018, the Company recorded a pre-tax charge of $238 million, of which $59 million is included in cost of products sold and $117 million is included in other (income) expense.
See Note 22 to the Consolidated Financial Statements for additional details related to the restructuring programs.
Provision for Taxes on Income: The worldwide effective income tax rate was 15.0% in 2018, 92.6% in 2017 and 16.5% in 2016. The 2018 effective tax rate decreased by 77.6% as compared to 2017. The 2017 effective tax rate was primarily driven by a provisional tax charge of approximately $13.0 billion as a result of the Tax Cuts and Jobs Act (TCJA) recorded in the fourth quarter of 2017 and the impact of a Belgian statutory tax rate change which increased the 2017 effective rate by 3.4%. The Company also received a benefit in 2018 from a lower U.S. statutory tax rate vs. 2017 as well as favorable adjustments to the 2017 provisional TCJA tax charge partially offset by unfavorable income tax mix and the U.S. tax on global intangible low-taxed income (GILTI).
The 2017 effective tax rate increased by 76.1% as compared to 2016, primarily driven by the enactment of the Tax Cuts and Jobs Act (TCJA) in the United States in December 2017. The enactment of the TCJA resulted in a provisional tax charge in the fourth quarter of 2017, of approximately $13.0 billion or approximately 73.3 percentage point increase to the effective tax rate. See Note 8 to the Consolidated Financial Statements for additional details related to the TCJA.
| 26 |
The remainder of the increase in the tax rate for 2017 was related to the remeasurement of the Company’s deferred tax assets in Belgium, as a result of changes in the Belgian statutory corporate tax rate, enacted in December 2017, offset by a tax benefit for the closure of the Company’s Animas insulin pump business.
The government in Switzerland is currently considering tax reform legislation, which could have a material impact on the Company’s effective tax rate if enacted into law.
See Note 8 to the Consolidated Financial Statements for additional details related to the TCJA and income taxes.
Liquidity and Capital Resources
Liquidity & Cash Flows
Cash and cash equivalents were $18.1 billion at the end of 2018 as compared to $17.8 billion at the end of 2017. The primary sources and uses of cash that contributed to the $0.3 billion increase were approximately $22.2 billion of cash generated from operating activities. This was partially offset by $3.2 billion net cash used by investing activities, $18.5 billion net cash used by financing activities and $0.2 billion due to the effect on exchange rate changes on cash and cash equivalents. In addition, the Company had $1.6 billion in marketable securities at the end of 2018 and $0.5 billion at the end of 2017. See Note 1 to the Consolidated Financial Statements for additional details on cash, cash equivalents and marketable securities.
Cash flow from operations of $22.2 billion was the result of $15.3 billion of net earnings and $9.2 billion of non-cash expenses and other adjustments for depreciation and amortization, stock-based compensation and assets write-downs, offset by $2.3 billion from net gains on sale of assets/businesses, deferred tax provision and accounts receivable allowances, $3.9 billion related to an increase in accounts receivable, inventories and other current and non-current assets and a decrease in other current and non-current liabilities. Additional sources of operating cash flow of $4.0 billion resulted from an increase in accounts payable and accrued liabilities. The decrease in current and non-current liabilities is primarily due to the 2018 tax payment related to TCJA.
Investing activities use of $3.2 billion was for additions to property, plant and equipment of $3.7 billion, the net purchase of investments primarily marketable securities of $1.3 billion, acquisitions, net of cash acquired of $0.9 billion (primarily the acquisitions of Zarbee's) and other uses of $0.5 billion. This was partially offset by $3.2 billion of proceeds from the disposal of assets/businesses (primarily the divestiture of LifeScan).
Financing activities use of $18.5 billion was primarily for dividends to shareholders of $9.5 billion, $5.9 billion for the repurchase of common stock, $3.9 billion for the net retirement of short and long-term debt and $0.2 billion of other financing. Financing activities also included sources of $1.0 billion of proceeds from stock options exercised/employee withholding tax on stock awards, net.
On December 17, 2018, the Company announced that its Board of Directors approved a share repurchase program, authorizing the Company to purchase up to $5.0 billion of the Company's shares of common stock. The repurchase program has no time limit and may be suspended for periods or discontinued at any time. Any shares acquired will be available for general corporate purposes. The Company intends to finance the share repurchase program through available cash. As of December 30, 2018, $0.9 billion has been repurchased under the program.
As of December 30, 2018, the Company's notes payable and long-term debt was in excess of cash, cash equivalents and marketable securities. As of December 30, 2018, the net debt position was $10.8 billion as compared to the prior year of $16.3 billion. There was a decrease in the net debt position due to retirement of debt. The debt balance at the end of 2018 was $30.5 billion as compared to $34.6 billion in 2017. Additionally there was a higher cash, cash equivalents and marketable securities balance at the end of 2018. In 2018, the Company continued to have access to liquidity through the commercial paper market. Additionally, as a result of the TCJA, the Company has access to its cash outside the U.S. at a significantly reduced cost. The Company anticipates that operating cash flows, the ability to raise funds from external sources, borrowing capacity from existing committed credit facilities and access to the commercial paper markets will continue to provide sufficient resources to fund operating needs for the next twelve months. The Company monitors the global capital markets on an ongoing basis and from time to time may raise capital when market conditions are favorable. The Company filed a new shelf registration on February 27, 2017 which will enable it to issue debt securities on a timely basis. For additional details on borrowings, see Note 7 to the Consolidated Financial Statements.
Financing and Market Risk
The Company uses financial instruments to manage the impact of foreign exchange rate changes on cash flows. Accordingly, the Company enters into forward foreign exchange contracts to protect the value of certain foreign currency assets and liabilities and to hedge future foreign currency transactions primarily related to product costs. Gains or losses on these contracts are offset by the gains or losses on the underlying transactions. A 10% appreciation of the U.S. Dollar from the December 30, 2018 market rates would increase the unrealized value of the Company’s forward contracts by $57 million. Conversely, a 10% depreciation of the U.S. Dollar from the December 30, 2018 market rates would decrease the unrealized value of the Company’s forward contracts by $69 million. In either scenario, the gain or loss on the forward contract would be offset by the gain or loss on the underlying transaction, and therefore, would have no impact on future anticipated earnings and cash flows.
| 27 |
The Company hedges the exposure to fluctuations in currency exchange rates, and the effect on certain assets and liabilities in foreign currency, by entering into currency swap contracts. A 1% change in the spread between U.S. and foreign interest rates on the Company’s interest rate sensitive financial instruments would either increase or decrease the unrealized value of the Company’s swap contracts by approximately $226 million. In either scenario, at maturity, the gain or loss on the swap contract would be offset by the gain or loss on the underlying transaction, and therefore, would have no impact on future anticipated cash flows.
The Company does not enter into financial instruments for trading or speculative purposes. Further, the Company has a policy of only entering into contracts with parties that have at least an investment grade credit rating. The counter-parties to these contracts are major financial institutions and there is no significant concentration of exposure with any one counter-party. Management believes the risk of loss is remote. During the fiscal second quarter of 2017, the Company entered into credit support agreements (CSA) with certain derivative counterparties establishing collateral thresholds based on respective credit ratings and netting agreements.
The Company invests in both fixed rate and floating rate interest earning securities which carry a degree of interest rate risk. The fair market value of fixed rate securities may be adversely impacted due to a rise in interest rates, while floating rate securities may produce less income than predicted if interest rates fall. A 1% (100 basis points) change in spread on the Company’s interest rate sensitive investments would either increase or decrease the unrealized value of cash equivalents and current marketable securities by approximately $8 million.
The Company has access to substantial sources of funds at numerous banks worldwide. In September 2018, the Company secured a new 364-day Credit Facility. Total credit available to the Company approximates $10 billion, which expires on September 12, 2019. Interest charged on borrowings under the credit line agreement is based on either bids provided by banks, the prime rate or London Interbank Offered Rates (LIBOR), plus applicable margins. Commitment fees under the agreement are not material.
Total borrowings at the end of 2018 and 2017 were $30.5 billion and $34.6 billion, respectively. The decrease in borrowings was due to the retirement of debt in 2018. In 2018, net debt (cash and current marketable securities, net of debt) was $10.8 billion compared to net debt of $16.3 billion in 2017. Total debt represented 33.8% of total capital (shareholders’ equity and total debt) in 2018 and 36.5% of total capital in 2017. Shareholders’ equity per share at the end of 2018 was $22.44 compared to $22.43 at year-end 2017.
A summary of borrowings can be found in Note 7 to the Consolidated Financial Statements.
Contractual Obligations and Commitments
The Company’s contractual obligations are primarily for the recently enacted tax legislation, leases, debt and unfunded retirement plans. There are no other significant obligations. To satisfy these obligations, the Company will use cash from operations. The following table summarizes the Company’s contractual obligations and their aggregate maturities as of December 30, 2018 (see Notes 7, 8, 10 and 16 to the Consolidated Financial Statements for further details):
| (Dollars in Millions) | Tax Legislation (TCJA) | Debt Obligations | Interest on Debt Obligations | Unfunded Retirement Plans | Operating Leases | Total | |||||||||||||
| 2019 | $ | — | 2,636 | 949 | 92 | 223 | 3,900 | ||||||||||||
| 2020 | 531 | 1,098 | 886 | 95 | 188 | 2,798 | |||||||||||||
| 2021 | 812 | 1,796 | 841 | 101 | 154 | 3,704 | |||||||||||||
| 2022 | 812 | 2,134 | 796 | 108 | 116 | 3,966 | |||||||||||||
| 2023 | 1,522 | 1,553 | 764 | 115 | 76 | 4,030 | |||||||||||||
| After 2023 | 4,565 | 21,103 | 8,850 | 697 | 139 | 35,354 | |||||||||||||
| Total | $ | 8,242 | 30,320 | 13,086 | 1,208 | 896 | 53,752 |
For tax matters, see Note 8 to the Consolidated Financial Statements. For other retirement plan and post-employment medical benefit information, see Note 10 to the Consolidated Financial Statements. The table does not include activity related to business combinations.
Dividends
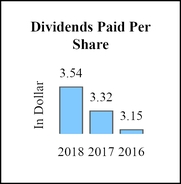
The Company increased its dividend in 2018 for the 56th consecutive year. Cash dividends paid were $3.54 per share in 2018 compared with dividends of $3.32 per share in 2017, and $3.15 per share in 2016.
| 28 |
Other Information
Critical Accounting Policies and Estimates
Management’s discussion and analysis of results of operations and financial condition are based on the Company’s consolidated financial statements that have been prepared in accordance with accounting principles generally accepted in the U.S. (GAAP). The preparation of these financial statements requires that management make estimates and assumptions that affect the amounts reported for revenues, expenses, assets, liabilities and other related disclosures. Actual results may or may not differ from these estimates. The Company believes that the understanding of certain key accounting policies and estimates are essential in achieving more insight into the Company’s operating results and financial condition. These key accounting policies include revenue recognition, income taxes, legal and self-insurance contingencies, valuation of long-lived assets, assumptions used to determine the amounts recorded for pensions and other employee benefit plans and accounting for stock based awards.
Revenue Recognition: The Company recognizes revenue from product sales when obligations under the terms of a contract with the customer are satisfied; generally, this occurs with the transfer of control of the goods to customers. The Company's global payment terms are typically between 30 to 90 days. Provisions for certain rebates, sales incentives, trade promotions, coupons, product returns and discounts to customers are accounted for as variable consideration and recorded as a reduction in sales. See Note 1 to the Consolidated Financial Statements for the Accounting Standards Update related to revenue which was adopted in 2018.
Product discounts granted are based on the terms of arrangements with direct, indirect and other market participants, as well as market conditions, including consideration of competitor pricing. Rebates are estimated based on contractual terms, historical experience, patient outcomes, trend analysis and projected market conditions in the various markets served. The Company evaluates market conditions for products or groups of products primarily through the analysis of wholesaler and other third-party sell-through and market research data, as well as internally generated information.
Sales returns are estimated and recorded based on historical sales and returns information. Products that exhibit unusual sales or return patterns due to dating, competition or other marketing matters are specifically investigated and analyzed as part of the accounting for sales return accruals.
Sales returns allowances represent a reserve for products that may be returned due to expiration, destruction in the field, or in specific areas, product recall. The sales returns reserve is based on historical return trends by product and by market as a percent to gross sales. In accordance with the Company’s accounting policies, the Company generally issues credit to customers for returned goods. The Company’s sales returns reserves are accounted for in accordance with the U.S. GAAP guidance for revenue recognition when right of return exists. Sales returns reserves are recorded at full sales value. Sales returns in the Consumer and Pharmaceutical segments are almost exclusively not resalable. Sales returns for certain franchises in the Medical Devices segment are typically resalable but are not material. The Company infrequently exchanges products from inventory for returned products. The sales returns reserve for the total Company has been approximately 1.0% of annual net trade sales during the fiscal reporting years 2018, 2017 and 2016.
Promotional programs, such as product listing allowances and cooperative advertising arrangements, are recorded in the same period as related sales. Continuing promotional programs include coupons and volume-based sales incentive programs. The redemption cost of consumer coupons is based on historical redemption experience by product and value. Volume-based incentive programs are based on the estimated sales volumes for the incentive period and are recorded as products are sold. These arrangements are evaluated to determine the appropriate amounts to be deferred or recorded as a reduction of revenue. The Company also earns profit-share payments through collaborative arrangements of certain products, which are included in sales to customers. For all years presented, profit-share payments were less than 2.0% of the total revenues and are included in sales to customers.
In addition, the Company enters into collaboration arrangements that contain multiple revenue generating activities. Amounts due from collaborative partners for these arrangements are recognized as each activity is performed or delivered, based on the relative selling price. Upfront fees received as part of these arrangements are deferred and recognized over the performance period. See Note 1 to the Consolidated Financial Statements for additional disclosures on collaborations.
Reasonably likely changes to assumptions used to calculate the accruals for rebates, returns and promotions are not anticipated to have a material effect on the financial statements. The Company currently discloses the impact of changes to assumptions in the quarterly or annual filing in which there is a material financial statement impact.
| 29 |
Below are tables that show the progression of accrued rebates, returns, promotions, reserve for doubtful accounts and reserve for cash discounts by segment of business for the fiscal years ended December 30, 2018 and December 31, 2017.
Consumer Segment
| (Dollars in Millions) | Balance at Beginning of Period | Accruals | Payments/Credits | Balance at End of Period | |||||||||
| 2018 | |||||||||||||
| Accrued rebates (1) | $ | 186 | 836 | (751 | ) | 271 | |||||||
| Accrued returns | 68 | 98 | (109 | ) | 57 | ||||||||
| Accrued promotions | 481 | 2,233 | (2,217 | ) | 497 | ||||||||
| Subtotal | $ | 735 | 3,167 | (3,077 | ) | 825 | |||||||
| Reserve for doubtful accounts | 31 | 10 | (9 | ) | 32 | ||||||||
| Reserve for cash discounts | 23 | 204 | (204 | ) | 23 | ||||||||
| Total | $ | 789 | 3,381 | (3,290 | ) | 880 | |||||||
| 2017 | |||||||||||||
| Accrued rebates(1) | $ | 136 | 638 | (588 | ) | 186 | |||||||
| Accrued returns | 65 | 128 | (125 | ) | 68 | ||||||||
| Accrued promotions | 358 | 2,148 | (2,025 | ) | 481 | ||||||||
| Subtotal | $ | 559 | 2,914 | (2,738 | ) | 735 | |||||||
| Reserve for doubtful accounts | 24 | 10 | (3 | ) | 31 | ||||||||
| Reserve for cash discounts | 25 | 205 | (207 | ) | 23 | ||||||||
| Total | $ | 608 | 3,129 | (2,948 | ) | 789 |
| (1) | Includes reserve for customer rebates of $57 million at December 30, 2018 and $48 million at December 31, 2017, recorded as a contra asset. |
Pharmaceutical Segment
| (Dollars in Millions) | Balance at Beginning of Period | Accruals | Payments/Credits(2) | Balance at End of Period | |||||||||
| 2018 | |||||||||||||
| Accrued rebates (1) | $ | 4,862 | 22,644 | (19,996 | ) | 7,510 | |||||||
| Accrued returns | 362 | 385 | (311 | ) | 436 | ||||||||
| Accrued promotions | 35 | 46 | (68 | ) | 13 | ||||||||
| Subtotal | $ | 5,259 | 23,075 | (20,375 | ) | 7,959 | |||||||
| Reserve for doubtful accounts | 77 | 37 | (67 | ) | 47 | ||||||||
| Reserve for cash discounts | 55 | 860 | (862 | ) | 53 | ||||||||
| Total | $ | 5,391 | 23,972 | (21,304 | ) | 8,059 | |||||||
| 2017 | |||||||||||||
| Accrued rebates (1) | $ | 3,420 | 16,447 | (15,005 | ) | 4,862 | |||||||
| Accrued returns | 334 | 256 | (228 | ) | 362 | ||||||||
| Accrued promotions | — | 69 | (34 | ) | 35 | ||||||||
| Subtotal | $ | 3,754 | 16,772 | (15,267 | ) | 5,259 | |||||||
| Reserve for doubtful accounts | 38 | 40 | (1 | ) | 77 | ||||||||
| Reserve for cash discounts | 58 | 714 | (717 | ) | 55 | ||||||||
| Total | $ | 3,850 | 17,526 | (15,985 | ) | 5,391 |
| (1) | Includes reserve for customer rebates of $89 million at December 30, 2018 and $90 million at December 31, 2017, recorded as a contra asset. |
| (2) | Includes adjustments |
| 30 |
Medical Devices Segment
| (Dollars in Millions) | Balance at Beginning of Period | Accruals | Payments/Credits | Balance at End of Period | |||||||||
| 2018 | |||||||||||||
| Accrued rebates(1) | $ | 1,620 | 6,344 | (6,746 | ) | 1,218 | |||||||
| Accrued returns | 152 | 362 | (400 | ) | 114 | ||||||||
| Accrued promotions | 83 | 116 | (157 | ) | 42 | ||||||||
| Subtotal | $ | 1,855 | 6,822 | (7,303 | ) | 1,374 | |||||||
| Reserve for doubtful accounts | 183 | 29 | (43 | ) | 169 | ||||||||
| Reserve for cash discounts | 15 | 372 | (387 | ) | — | ||||||||
| Total | $ | 2,053 | 7,223 | (7,733 | ) | 1,543 | |||||||
| 2017 | |||||||||||||
| Accrued rebates(1) | $ | 1,500 | 6,407 | (6,287 | ) | 1,620 | |||||||
| Accrued returns | 127 | 729 | (704 | ) | 152 | ||||||||
| Accrued promotions | 32 | 135 | (84 | ) | 83 | ||||||||
| Subtotal | $ | 1,659 | 7,271 | (7,075 | ) | 1,855 | |||||||
| Reserve for doubtful accounts | 190 | 27 | (34 | ) | 183 | ||||||||
| Reserve for cash discounts | 16 | 389 | (390 | ) | 15 | ||||||||
| Total | $ | 1,865 | 7,687 | (7,499 | ) | 2,053 |
| (1) | Includes reserve for customer rebates of $632 million at December 30, 2018 and $501 million at December 31, 2017, recorded as a contra asset. |
Income Taxes: Income taxes are recorded based on amounts refundable or payable for the current year and include the results of any difference between U.S. GAAP accounting and tax reporting, recorded as deferred tax assets or liabilities. The Company estimates deferred tax assets and liabilities based on enacted tax regulations and rates. Future changes in tax laws and rates may affect recorded deferred tax assets and liabilities.
The Company has unrecognized tax benefits for uncertain tax positions. The Company follows U.S. GAAP, which prescribes a recognition threshold and measurement attribute for the financial statement recognition and measurement of a tax position taken or expected to be taken in a tax return. Management believes that changes in these estimates would not have a material effect on the Company's results of operations, cash flows or financial position.
The Company has recorded deferred tax liabilities on all undistributed earnings prior to December 31, 2017 from its international subsidiaries. The Company has not provided deferred taxes on the undistributed earnings subsequent to January 1, 2018 from certain international subsidiaries where the earnings are considered to be indefinitely reinvested. The Company intends to continue to reinvest these earnings in those international operations. If the Company decides at a later date to repatriate these earnings to the U.S., the Company would be required to provide for the net tax effects on these amounts. The Company estimates that the total tax effect of this repatriation would be approximately $0.7 billion under current enacted tax laws and regulations and at current currency exchange rates.
See Note 8 to the Consolidated Financial Statements for further information regarding income taxes.
Legal and Self Insurance Contingencies: The Company records accruals for various contingencies, including legal proceedings and product liability claims as these arise in the normal course of business. The accruals are based on management’s judgment as to the probability of losses and, where applicable, actuarially determined estimates. The Company has self insurance through a wholly-owned captive insurance company. In addition to accruals in the self insurance program, claims that exceed the insurance coverage are accrued when losses are probable and amounts can be reasonably estimated.
The Company follows the provisions of U.S. GAAP when recording litigation related contingencies. A liability is recorded when a loss is probable and can be reasonably estimated. The best estimate of a loss within a range is accrued; however, if no estimate in the range is better than any other, the minimum amount is accrued.
See Notes 1 and 21 to the Consolidated Financial Statements for further information regarding product liability and legal proceedings.
| 31 |
Long-Lived and Intangible Assets: The Company assesses changes in economic conditions and makes assumptions regarding estimated future cash flows in evaluating the value of the Company’s property, plant and equipment, goodwill and intangible assets. As these assumptions and estimates may change over time, it may or may not be necessary for the Company to record impairment charges.
Employee Benefit Plans: The Company sponsors various retirement and pension plans, including defined benefit, defined contribution and termination indemnity plans, which cover most employees worldwide. These plans are based on assumptions for the discount rate, expected return on plan assets, mortality rates, expected salary increases, health care cost trend rates and attrition rates. See Note 10 to the Consolidated Financial Statements for further details on these rates and the effect a rate change to the health care cost trend would have on the Company’s results of operations.
Stock Based Compensation: The Company recognizes compensation expense associated with the issuance of equity instruments to employees for their services. Based on the type of equity instrument, the fair value is estimated on the date of grant using either the Black-Scholes option valuation model or a combination of both the Black-Scholes option valuation model and Monte Carlo valuation model, and is expensed in the financial statements over the service period. The input assumptions used in determining fair value are the expected life, expected volatility, risk-free rate and expected dividend yield. For performance share units the fair market value is calculated for each of the three component goals at the date of grant. The fair values for the sales and earnings per share goals of each performance share unit were estimated on the date of grant using the fair market value of the shares at the time of the award, discounted for dividends, which are not paid on the performance share units during the vesting period. The fair value for the relative total shareholder return goal of each performance share unit was estimated on the date of grant using the Monte Carlo valuation model. See Note 17 to the Consolidated Financial Statements for additional information.
New Accounting Pronouncements
Refer to Note 1 to the Consolidated Financial Statements for recently adopted accounting pronouncements and recently issued accounting pronouncements not yet adopted as of December 30, 2018.
Economic and Market Factors
The Company is aware that its products are used in an environment where, for more than a decade, policymakers, consumers and businesses have expressed concerns about the rising cost of health care. In response to these concerns, the Company has a long-standing policy of pricing products responsibly. For the period 2008 - 2018, in the U.S., the weighted average compound annual growth rate of the Company’s net price increases for health care products (prescription and over-the-counter drugs, hospital and professional products) was below the U.S. Consumer Price Index (CPI).
The Company operates in certain countries where the economic conditions continue to present significant challenges. The Company continues to monitor these situations and take appropriate actions. Inflation rates continue to have an effect on worldwide economies and, consequently, on the way companies operate. The Company has accounted for operations in Argentina (beginning in the fiscal third quarter of 2018) and Venezuela as highly inflationary, as the prior three-year cumulative inflation rate surpassed 100%. This did not have a material impact to the Company's results in the period. In the face of increasing costs, the Company strives to maintain its profit margins through cost reduction programs, productivity improvements and periodic price increases.
In June 2016, the United Kingdom (U.K.) held a referendum in which voters approved an exit from the European Union (E.U.), commonly referred to as “Brexit” and in March 2017 the U.K. formally started the process for the U.K. to leave the E.U. Given the lack of comparable precedent, it is unclear what financial, trade, regulatory and legal implications the withdrawal of the U.K. from the E.U. will have. Brexit creates global political and economic uncertainty, which may cause, among other consequences, volatility in exchange rates and interest rates, additional cost containment by third-party payors and changes in regulations. However, the Company currently does not believe that these and other related effects will have a material impact on the Company’s consolidated financial position or operating results. As of December 30, 2018, the business of the Company’s U.K. subsidiaries represented less than 3% of both the Company’s consolidated assets and fiscal twelve months revenues, respectively.
The Company is exposed to fluctuations in currency exchange rates. A 1% change in the value of the U.S. Dollar as compared to all foreign currencies in which the Company had sales, income or expense in 2018 would have increased or decreased the translation of foreign sales by approximately $390 million and net income by approximately $100 million.
Governments around the world consider various proposals to make changes to tax laws, which may include increasing or decreasing existing statutory tax rates. A change in statutory tax rate in any country would result in the revaluation of the Company’s deferred tax assets and liabilities related to that particular jurisdiction in the period in which the new tax law is enacted. This change would result in an expense or benefit recorded to the Company’s Consolidated Statement of Earnings. The Company closely monitors these proposals as they arise in the countries where it operates. Changes to the statutory tax rate may occur at any time, and any related expense or benefit recorded may be material to the fiscal quarter and year in which the law change is enacted. On September 28, 2018 the Swiss Parliament approved the Federal Act on Tax Reform and AHV Financing (Swiss Tax Reform). However, a referendum has been called and, as a result, a public vote on the Swiss Tax Reform
| 32 |
will take place on May 19th, 2019. If the Swiss Tax Reform passes, then the measures are expected to come into force in either January 2020 or January 2021. Prior to approval in the referendum and its subsequent cantonal implementation, the proposed Swiss Tax Reform is not enacted and therefore the Company has not reflected any of the potential impacts in its fiscal results. The Company is currently assessing the impact of the proposed Swiss Tax Reform, and when enacted, the law may have a material impact on the Company’s operating results.
The Company faces various worldwide health care changes that may continue to result in pricing pressures that include health care cost containment and government legislation relating to sales, promotions and reimbursement of health care products.
Changes in the behavior and spending patterns of purchasers of health care products and services, including delaying medical procedures, rationing prescription medications, reducing the frequency of physician visits and foregoing health care insurance coverage, as a result of the current global economic downturn, may continue to impact the Company’s businesses.
The Company also operates in an environment increasingly hostile to intellectual property rights. Firms have filed Abbreviated New Drug Applications or Biosimilar Biological Product Applications with the FDA or otherwise challenged the coverage and/or validity of the Company's patents, seeking to market generic or biosimilar forms of many of the Company’s key pharmaceutical products prior to expiration of the applicable patents covering those products. In the event the Company is not successful in defending the patent claims challenged in the resulting lawsuits, generic or biosimilar versions of the products at issue will be introduced to the market, resulting in the potential for substantial market share and revenue losses for those products, and which may result in a non-cash impairment charge in any associated intangible asset. There is also a risk that one or more competitors could launch a generic or biosimilar version of the product at issue following regulatory approval even though one or more valid patents are in place. For further information, see the discussion on “REMICADE® Related Cases” and “Litigation Against Filers of Abbreviated New Drug Applications” in Note 21 to the Consolidated Financial Statements.
Legal Proceedings
Johnson & Johnson and certain of its subsidiaries are involved in various lawsuits and claims regarding product liability, intellectual property, commercial and other matters; governmental investigations; and other legal proceedings that arise from time to time in the ordinary course of business.
The Company records accruals for loss contingencies associated with these legal matters when it is probable that a liability will be incurred and the amount of the loss can be reasonably estimated. The Company has accrued for certain litigation matters and continues to monitor each related legal issue and adjust accruals for new information and further developments in accordance with Accounting Standards Codification (ASC) 450-20-25. For these and other litigation and regulatory matters currently disclosed for which a loss is probable or reasonably possible, the Company is unable to estimate the possible loss or range of loss beyond the amounts already accrued. Amounts accrued for legal contingencies often result from a complex series of judgments about future events and uncertainties that rely heavily on estimates and assumptions. The ability to make such estimates and judgments can be affected by various factors, including whether damages sought in the proceedings are unsubstantiated or indeterminate; scientific and legal discovery has not commenced or is not complete; proceedings are in early stages; matters present legal uncertainties; there are significant facts in dispute; or there are numerous parties involved.
In the Company's opinion, based on its examination of these matters, its experience to date and discussions with counsel, the ultimate outcome of legal proceedings, net of liabilities accrued in the Company's balance sheet, is not expected to have a material adverse effect on the Company's financial position. However, the resolution of, or increase in accruals for, one or more of these matters in any reporting period may have a material adverse effect on the Company's results of operations and cash flows for that period.
See Note 21 to the Consolidated Financial Statements for further information regarding legal proceedings.
Common Stock
The Company’s Common Stock is listed on the New York Stock Exchange under the symbol JNJ. As of February 15, 2019, there were 142,029 record holders of Common Stock of the Company.
Previous: Item 6. SELECTED FINANCIAL DATA · Next: Item 7A. QUANTITATIVE AND QUALITATIVE DISCLOSURES ABOUT MARKET RISK