 filings.tools
Item 8. FINANCIAL STATEMENTS AND SUPPLEMENTARY DATA
290K characters. Original on sec.gov · Markdown
Item 8. FINANCIAL STATEMENTS AND SUPPLEMENTARY DATA
| 34 |
JOHNSON & JOHNSON AND SUBSIDIARIES
CONSOLIDATED BALANCE SHEETS
At December 30, 2018 and December 31, 2017
(Dollars in Millions Except Share and Per Share Amounts) (Note 1)
| 2018 | 2017 | |||||
| Assets | ||||||
| Current assets | ||||||
| Cash and cash equivalents (Notes 1 and 2) | $ | 18,107 | 17,824 | |||
| Marketable securities (Notes 1 and 2) | 1,580 | 472 | ||||
| Accounts receivable trade, less allowances for doubtful accounts $248 (2017, $291) | 14,098 | 13,490 | ||||
| Inventories (Notes 1 and 3) | 8,599 | 8,765 | ||||
| Prepaid expenses and other receivables | 2,699 | 2,537 | ||||
| Assets held for sale (Note 20) | 950 | — | ||||
| Total current assets | 46,033 | 43,088 | ||||
| Property, plant and equipment, net (Notes 1 and 4) | 17,035 | 17,005 | ||||
| Intangible assets, net (Notes 1 and 5) | 47,611 | 53,228 | ||||
| Goodwill (Notes 1 and 5) | 30,453 | 31,906 | ||||
| Deferred taxes on income (Note 8) | 7,640 | 7,105 | ||||
| Other assets | 4,182 | 4,971 | ||||
| Total assets | $ | 152,954 | 157,303 | |||
| Liabilities and Shareholders’ Equity | ||||||
| Current liabilities | ||||||
| Loans and notes payable (Note 7) | $ | 2,796 | 3,906 | |||
| Accounts payable | 7,537 | 7,310 | ||||
| Accrued liabilities | 7,601 | 7,304 | ||||
| Accrued rebates, returns and promotions | 9,380 | 7,210 | ||||
| Accrued compensation and employee related obligations | 3,098 | 2,953 | ||||
| Accrued taxes on income (Note 8) | 818 | 1,854 | ||||
| Total current liabilities | 31,230 | 30,537 | ||||
| Long-term debt (Note 7) | 27,684 | 30,675 | ||||
| Deferred taxes on income (Note 8) | 7,506 | 8,368 | ||||
| Employee related obligations (Notes 9 and 10) | 9,951 | 10,074 | ||||
| Long-term taxes payable (Note 8) | 8,242 | 8,472 | ||||
| Other liabilities | 8,589 | 9,017 | ||||
| Total liabilities | 93,202 | 97,143 | ||||
| Shareholders’ equity | ||||||
| Preferred stock — without par value (authorized and unissued 2,000,000 shares) | — | — | ||||
| Common stock — par value $1.00 per share (Note 12) (authorized 4,320,000,000 shares; issued 3,119,843,000 shares) | 3,120 | 3,120 | ||||
| Accumulated other comprehensive income (loss) (Note 13) | (15,222 | ) | (13,199 | ) | ||
| Retained earnings | 106,216 | 101,793 | ||||
| 94,114 | 91,714 | |||||
| Less: common stock held in treasury, at cost (Note 12) (457,519,000 shares and 437,318,000 shares) | 34,362 | 31,554 | ||||
| Total shareholders’ equity | 59,752 | 60,160 | ||||
| Total liabilities and shareholders’ equity | $ | 152,954 | 157,303 |
See Notes to Consolidated Financial Statements
| 35 |
JOHNSON & JOHNSON AND SUBSIDIARIES
CONSOLIDATED STATEMENTS OF EARNINGS
(Dollars and Shares in Millions Except Per Share Amounts) (Note 1)*
| 2018 | 2017 | 2016 | |||||||
| Sales to customers | $ | 81,581 | 76,450 | 71,890 | |||||
| Cost of products sold | 27,091 | 25,439 | 21,789 | ||||||
| Gross profit | 54,490 | 51,011 | 50,101 | ||||||
| Selling, marketing and administrative expenses | 22,540 | 21,520 | 20,067 | ||||||
| Research and development expense | 10,775 | 10,594 | 9,143 | ||||||
| In-process research and development | 1,126 | 408 | 29 | ||||||
| Interest income | (611 | ) | (385 | ) | (368 | ) | |||
| Interest expense, net of portion capitalized (Note 4) | 1,005 | 934 | 726 | ||||||
| Other (income) expense, net | 1,405 | (42 | ) | 210 | |||||
| Restructuring (Note 22) | 251 | 309 | 491 | ||||||
| Earnings before provision for taxes on income | 17,999 | 17,673 | 19,803 | ||||||
| Provision for taxes on income (Note 8) | 2,702 | 16,373 | 3,263 | ||||||
| Net earnings | $ | 15,297 | 1,300 | 16,540 | |||||
| Net earnings per share (Notes 1 and 15) | |||||||||
| Basic | $ | 5.70 | 0.48 | 6.04 | |||||
| Diluted | $ | 5.61 | 0.47 | 5.93 | |||||
| Average shares outstanding (Notes 1 and 15) | |||||||||
| Basic | 2,681.5 | 2,692.0 | 2,737.3 | ||||||
| Diluted | 2,728.7 | 2,745.3 | 2,788.9 |
*Prior years amounts were reclassified to conform to current year presentation (adoption of ASU 2017-07)
See Notes to Consolidated Financial Statements
| 36 |
JOHNSON & JOHNSON AND SUBSIDIARIES
CONSOLIDATED STATEMENTS OF COMPREHENSIVE INCOME
(Dollars in Millions) (Note 1)
| 2018 | 2017 | 2016 | |||||||
| Net earnings | $ | 15,297 | 1,300 | 16,540 | |||||
| Other comprehensive income (loss), net of tax | |||||||||
| Foreign currency translation | (1,518 | ) | 1,696 | (612 | ) | ||||
| Securities: (1) | |||||||||
| Unrealized holding gain (loss) arising during period | (1 | ) | 159 | (52 | ) | ||||
| Reclassifications to earnings | 1 | (338 | ) | (141 | ) | ||||
| Net change | — | (179 | ) | (193 | ) | ||||
| Employee benefit plans: | |||||||||
| Prior service credit (cost), net of amortization | (44 | ) | 2 | 21 | |||||
| Gain (loss), net of amortization | (56 | ) | 29 | (862 | ) | ||||
| Effect of exchange rates | 92 | (201 | ) | 159 | |||||
| Net change | (8 | ) | (170 | ) | (682 | ) | |||
| Derivatives & hedges: | |||||||||
| Unrealized gain (loss) arising during period | (73 | ) | (4 | ) | (359 | ) | |||
| Reclassifications to earnings | (192 | ) | 359 | 110 | |||||
| Net change | (265 | ) | 355 | (249 | ) | ||||
| Other comprehensive income (loss) | (1,791 | ) | 1,702 | (1,736 | ) | ||||
| Comprehensive income | $ | 13,506 | 3,002 | 14,804 | |||||
| (1) 2018 includes the impact from adoption of ASU 2016-01. For further details see Note 1 to the Consolidated Financial Statements |
| The tax effects in other comprehensive income for the fiscal years ended 2018, 2017 and 2016 respectively: Foreign Currency Translation $236 million in 2018 due to the enactment of the U.S. Tax Cuts and Jobs Act; Securities: $0 million, $96 million and $104 million, Employee Benefit Plans: $4 million, $83 million and $346 million, Derivatives & Hedges: $70 million, $191 million and $134 million. |
See Notes to Consolidated Financial Statements
| 37 |
JOHNSON & JOHNSON AND SUBSIDIARIES
CONSOLIDATED STATEMENTS OF EQUITY
(Dollars in Millions) (Note 1)
| Total | Retained Earnings | Accumulated Other Comprehensive Income | Common Stock Issued Amount | Treasury Stock Amount | ||||||||||||
| Balance, January 3, 2016 | $ | 71,150 | 103,879 | (13,165 | ) | 3,120 | (22,684 | ) | ||||||||
| Net earnings | 16,540 | 16,540 | ||||||||||||||
| Cash dividends paid ($3.15 per share) | (8,621 | ) | (8,621 | ) | ||||||||||||
| Employee compensation and stock option plans | 2,130 | (1,181 | ) | 3,311 | ||||||||||||
| Repurchase of common stock | (8,979 | ) | (8,979 | ) | ||||||||||||
| Other | (66 | ) | (66 | ) | ||||||||||||
| Other comprehensive income (loss), net of tax | (1,736 | ) | (1,736 | ) | ||||||||||||
| Balance, January 1, 2017 | 70,418 | 110,551 | (14,901 | ) | 3,120 | (28,352 | ) | |||||||||
| Net earnings | 1,300 | 1,300 | ||||||||||||||
| Cash dividends paid ($3.32 per share) | (8,943 | ) | (8,943 | ) | ||||||||||||
| Employee compensation and stock option plans | 2,077 | (1,079 | ) | 3,156 | ||||||||||||
| Repurchase of common stock | (6,358 | ) | (6,358 | ) | ||||||||||||
| Other | (36 | ) | (36 | ) | ||||||||||||
| Other comprehensive income (loss), net of tax | 1,702 | 1,702 | ||||||||||||||
| Balance, December 31, 2017 | 60,160 | 101,793 | (13,199 | ) | 3,120 | (31,554 | ) | |||||||||
| Cumulative adjustment | (486 | ) | (254 | ) | (1 | ) | (232 | ) | ||||||||
| Net earnings | 15,297 | 15,297 | ||||||||||||||
| Cash dividends paid ($3.54 per share) | (9,494 | ) | (9,494 | ) | ||||||||||||
| Employee compensation and stock option plans | 1,949 | (1,111 | ) | 3,060 | ||||||||||||
| Repurchase of common stock | (5,868 | ) | (5,868 | ) | ||||||||||||
| Other | (15 | ) | (15 | ) | ||||||||||||
| Other comprehensive income (loss), net of tax | (1,791 | ) | (1,791 | ) | ||||||||||||
| Balance, December 30, 2018 | $ | 59,752 | 106,216 | (15,222 | ) | 3,120 | (34,362 | ) |
(1) See Note 1 to Consolidated Financial Statements for additional details on the effect of cumulative adjustments to retained earnings.
See Notes to Consolidated Financial Statements
| 38 |
JOHNSON & JOHNSON AND SUBSIDIARIES CONSOLIDATED STATEMENTS OF CASH FLOWS
(Dollars in Millions) (Note 1)
| 2018 | 2017 | 2016 | |||||||
| Cash flows from operating activities | |||||||||
| Net earnings | $ | 15,297 | 1,300 | 16,540 | |||||
| Adjustments to reconcile net earnings to cash flows from operating activities: | |||||||||
| Depreciation and amortization of property and intangibles | 6,929 | 5,642 | 3,754 | ||||||
| Stock based compensation | 978 | 962 | 878 | ||||||
| Asset write-downs | 1,258 | 795 | 283 | ||||||
| Gain on sale of assets/businesses | (1,217 | ) | (1,307 | ) | (563 | ) | |||
| Deferred tax provision | (1,016 | ) | 2,406 | (341 | ) | ||||
| Accounts receivable allowances | (31 | ) | 17 | (11 | ) | ||||
| Changes in assets and liabilities, net of effects from acquisitions and divestitures: | |||||||||
| Increase in accounts receivable | (1,185 | ) | (633 | ) | (1,065 | ) | |||
| (Increase)/Decrease in inventories | (644 | ) | 581 | (249 | ) | ||||
| Increase in accounts payable and accrued liabilities | 3,951 | 2,725 | 656 | ||||||
| Increase in other current and non-current assets | (275 | ) | (411 | ) | (529 | ) | |||
| (Decrease)/Increase in other current and non-current liabilities | (1,844 | ) | 8,979 | (586 | ) | ||||
| Net cash flows from operating activities | 22,201 | 21,056 | 18,767 | ||||||
| Cash flows from investing activities | |||||||||
| Additions to property, plant and equipment | (3,670 | ) | (3,279 | ) | (3,226 | ) | |||
| Proceeds from the disposal of assets/businesses, net | 3,203 | 1,832 | 1,267 | ||||||
| Acquisitions, net of cash acquired (Note 20) | (899 | ) | (35,151 | ) | (4,509 | ) | |||
| Purchases of investments | (5,626 | ) | (6,153 | ) | (33,950 | ) | |||
| Sales of investments | 4,289 | 28,117 | 35,780 | ||||||
| Other (primarily intangibles) | (464 | ) | (234 | ) | (123 | ) | |||
| Net cash used by investing activities | (3,167 | ) | (14,868 | ) | (4,761 | ) | |||
| Cash flows from financing activities | |||||||||
| Dividends to shareholders | (9,494 | ) | (8,943 | ) | (8,621 | ) | |||
| Repurchase of common stock | (5,868 | ) | (6,358 | ) | (8,979 | ) | |||
| Proceeds from short-term debt | 80 | 869 | 111 | ||||||
| Retirement of short-term debt | (2,479 | ) | (1,330 | ) | (2,017 | ) | |||
| Proceeds from long-term debt, net of issuance costs | 5 | 8,992 | 12,004 | ||||||
| Retirement of long-term debt | (1,555 | ) | (1,777 | ) | (2,223 | ) | |||
| Proceeds from the exercise of stock options/employee withholding tax on stock awards, net | 949 | 1,062 | 1,189 | ||||||
| Other | (148 | ) | (188 | ) | (15 | ) | |||
| Net cash used by financing activities | (18,510 | ) | (7,673 | ) | (8,551 | ) | |||
| Effect of exchange rate changes on cash and cash equivalents | (241 | ) | 337 | (215 | ) | ||||
| Increase/(Decrease) in cash and cash equivalents | 283 | (1,148 | ) | 5,240 | |||||
| Cash and cash equivalents, beginning of year (Note 1) | 17,824 | 18,972 | 13,732 | ||||||
| Cash and cash equivalents, end of year (Note 1) | $ | 18,107 | 17,824 | 18,972 | |||||
| Supplemental cash flow data | |||||||||
| Cash paid during the year for: | |||||||||
| Interest | $ | 1,049 | 960 | 730 | |||||
| Interest, net of amount capitalized | 963 | 866 | 628 | ||||||
| Income taxes | 4,570 | 3,312 | 2,843 | ||||||
| 39 |
| Supplemental schedule of non-cash investing and financing activities | |||||||||
| Treasury stock issued for employee compensation and stock option plans, net of cash proceeds/ employee withholding tax on stock awards | $ | 2,095 | 2,062 | 2,043 | |||||
| Conversion of debt | 6 | 16 | 35 | ||||||
| Acquisitions | |||||||||
| Fair value of assets acquired | $ | 1,047 | 36,937 | 4,586 | |||||
| Fair value of liabilities assumed and noncontrolling interests | (148 | ) | (1,786 | ) | (77 | ) | |||
| Net cash paid for acquisitions | $ | 899 | 35,151 | 4,509 |
See Notes to Consolidated Financial Statements
| 40 |
NOTES TO CONSOLIDATED FINANCIAL STATEMENTS
| 1. | Summary of Significant Accounting Policies |
Principles of Consolidation
The consolidated financial statements include the accounts of Johnson & Johnson and its subsidiaries (the Company). Intercompany accounts and transactions are eliminated.
Description of the Company and Business Segments
The Company has approximately 135,100 employees worldwide engaged in the research and development, manufacture and sale of a broad range of products in the health care field. The Company conducts business in virtually all countries of the world and its primary focus is on products related to human health and well-being.
The Company is organized into three business segments: Consumer, Pharmaceutical and Medical Devices. The Consumer segment includes a broad range of products used in the baby care, oral care, beauty, over-the-counter pharmaceutical, women’s health and wound care markets. These products are marketed to the general public and sold both to retail outlets and distributors throughout the world. The Pharmaceutical segment is focused on six therapeutic areas, including immunology, infectious diseases, neuroscience, oncology, pulmonary hypertension, and cardiovascular and metabolic diseases. Products in this segment are distributed directly to retailers, wholesalers, hospitals and health care professionals for prescription use. The Medical Devices segment includes a broad range of products used in the orthopaedic, surgery, interventional solutions (cardiovascular and neurovascular), diabetes care (divested in the fiscal fourth quarter of 2018) and vision fields, which are distributed to wholesalers, hospitals and retailers, and used principally in the professional fields by physicians, nurses, hospitals, eye care professionals and clinics.
New Accounting Standards
Recently Adopted Accounting Standards
ASU 2014-09: Revenue from Contracts with Customers
On January 1, 2018, the Company adopted the new accounting standard, ASC 606, Revenue from Contracts with Customers and all the related amendments (new revenue standard) to all contracts using the modified retrospective method. The cumulative effect of initially applying the new revenue standard was recognized as an adjustment to the opening balance of retained earnings. The comparative information has not been restated and continues to be reported under the accounting standards in effect for those periods. The adoption of the new revenue standard has not had a material impact to either reported Sales to customers or Net earnings. Additionally, the Company will continue to recognize revenue from product sales as goods are shipped or delivered to the customer, as control of goods transfers at the same time.
In accordance with the new revenue standard requirements, the disclosure of the impact of adoption on the Company's Consolidated Statement of Earnings and Balance Sheet was as follows:
| Statement of Earnings - For the fiscal year ended December 30, 2018 | |||||||||
| (Dollars in millions) | As Reported | Effect of change | Balance without adoption of ASC 606 | ||||||
| Sales to customers | $ | 81,581 | (35 | ) | 81,546 | ||||
| Net earnings | 15,297 | (28 | ) | 15,269 | |||||
| Balance Sheet - As of December 30, 2018 | |||||||||
| As Reported | Effect of change | Balance without adoption of ASC 606 | |||||||
| Assets | 152,954 | 23 | 152,977 | ||||||
| Liabilities | 93,202 | 4 | 93,206 | ||||||
| Equity | $ | 59,752 | 19 | 59,771 | |||||
The Company made a cumulative effect adjustment to the 2018 opening balance of retained earnings upon adoption of ASU 2014-09, which decreased beginning retained earnings by $47 million.
As part of the adoption of ASC 606 see Note 18 to the Consolidated Financial Statements for further disaggregation of revenue.
| 41 |
ASU 2016-01: Financial Instruments: Recognition and Measurement of Financial Assets and Financial Liabilities
The Company adopted this standard as of the beginning of the fiscal year 2018 on a modified retrospective basis. The amendments in this update supersede the guidance to classify equity securities with readily determinable fair values into different categories (that is, trading or available-for-sale) and require equity securities to be measured at fair value with changes in the fair value recognized through net earnings. The standard amends financial reporting by providing relevant information about an entity’s equity investments and reducing the number of items that are recognized in other comprehensive income.
The Company made a cumulative effect adjustment to the opening balance of retained earnings upon adoption of ASU 2016-01 that increased retained earnings by $232 million net of tax and decreased accumulated other comprehensive income for previously unrealized gains from equity investments. For additional details see Note 6 to the Consolidated Financial Statements.
ASU 2016-16: Income Taxes: Intra-Entity Transfers of Assets Other Than Inventory
The Company adopted this standard as of the beginning of the fiscal year 2018. This update removes the current exception in U.S. GAAP prohibiting entities from recognizing current and deferred income tax expenses or benefits related to transfer of assets, other than inventory, within the consolidated entity. The current exception to defer the recognition of any tax impact on the transfer of inventory within the consolidated entity until it is sold to a third party remains unaffected. As discussed further in Note 8 to the Consolidated Financial Statements, in the fourth fiscal quarter of 2018 the Company elected an accounting policy to treat the tax on global intangible low-taxed income (GILTI) under the deferred tax accounting model. As a result, the Company is required to record an additional deferred tax liability related to the basis difference of these intra-entity asset transfers. The Company recorded net adjustments including an increase to deferred tax assets of approximately $2.0 billion, an increase to deferred tax liabilities of approximately $1.7 billion, related to the GILTI accounting policy election in the fourth fiscal quarter of 2018, a decrease to Other Assets of approximately $0.7 billion and a decrease to retained earnings of approximately $0.4 billion. The adoption of this standard did not have a material impact on the Company's consolidated financial statements.
ASU 2017-01: Clarifying the Definition of a Business
The Company adopted this standard as of the beginning of the fiscal year 2018. This update narrows the definition of a business by providing a screen to determine when an integrated set of assets and activities is not a business. The screen specifies that an integrated set of assets and activities is not a business if substantially all of the fair value of the gross assets acquired or disposed of is concentrated in a single or a group of similar identifiable assets. This update was applied prospectively. The adoption of this standard did not have a material impact on the Company's consolidated financial statements.
ASU 2017-07: Improving the Presentation of Net Periodic Pension Cost and Net Periodic Postretirement Benefit Cost
The Company adopted this standard as of the beginning of the fiscal year 2018. This update requires that an employer disaggregate the service cost component from the other components of net periodic benefit cost (NPBC). In addition, only the service cost component will be eligible for capitalization. The amendments in this update are required to be applied retrospectively for the presentation of the service cost component and the other components of NPBC in the Consolidated Statement of Earnings and prospectively, on and after the adoption date, for the capitalization of the service cost component of NPBC in assets. As required by the transition provisions of this update, the following table shows the impact of the adoption on the respective line items in the Consolidated Statement of Earnings for 2018 and the reclassifications to the 2017 and 2016 fiscal year Consolidated Statement of Earnings to retroactively apply classification of the service cost component and the other components of NPBC:
| (Dollars In millions) | Increase (Decrease) to Net Expense | ||||||||
| 2018 | 2017 | 2016 | |||||||
| Cost of products sold | $ | 51 | 85 | 104 | |||||
| Selling, marketing and administrative expenses | 55 | 100 | 122 | ||||||
| Research and development expense | 21 | 40 | 48 | ||||||
| Other (income) expense, net | (127 | ) | (225 | ) | (274 | ) | |||
| Earnings before provision for taxes on income | $ | — | — | — |
| 42 |
The following table summarizes the cumulative effect adjustments made to the 2018 opening balance of retained earnings upon adoption of the new accounting standards mentioned above:
| (Dollars in Millions) | Cumulative Effect Adjustment Increase (Decrease) to Retained Earnings | |||
| ASU 2014-09 - Revenue from Contracts with Customers | $ | (47 | ) | |
| ASU 2016-01 - Financial Instruments | 232 | |||
| ASU 2016-16 - Income Taxes: Intra-Entity Transfers | (439 | ) | ||
| Total | $ | (254 | ) |
ASU 2017-12: Targeted Improvements to Accounting for Hedging Activities
The Company elected to early adopt this standard as of the beginning of the fiscal second quarter of 2018. This update makes more financial and nonfinancial hedging strategies eligible for hedge accounting. It also amends the presentation and disclosure requirements and changes how companies assess effectiveness. The adoption of this standard did not have a material impact on the Company's consolidated financial statements. For additional required disclosures see Note 6 to the Consolidated Financial Statements.
Recently Issued Accounting Standards
Not Adopted as of December 30, 2018
ASU 2018-18: Collaborative Arrangements
This update clarifies the interaction between ASC 808, Collaborative Arrangements and ASC 606, Revenue from Contracts with Customers. The update clarifies that certain transactions between participants in a collaborative arrangement should be accounted for under ASC 606 when the counterparty is a customer. In addition, the update precludes an entity from presenting consideration from a transaction in a collaborative arrangement as revenue if the counterparty is not a customer for that transaction. This update will be effective for the Company for fiscal years beginning after December 15, 2019, and interim periods within those fiscal years. ASU 2018-18 should be applied retrospectively to the date of initial application of ASC 606 and early adoption is permitted. The Company is currently assessing the impact of this update on the Company’s consolidated financial statements and related disclosures.
ASU 2018-16: Derivatives and Hedging (Topic ASC 815)
This update adds the Overnight Index Swap (OIS) rate based on the Secured Overnight Financing Rate (SOFR) as an eligible benchmark interest rate permitted in the application of hedge accounting. This update will be effective for the Company for fiscal years beginning after December 15, 2018 and interim periods within those fiscal years. Early adoption is permitted if an entity has adopted ASU 2017-12. The Company is currently assessing the impact of this update on the Company’s consolidated financial statements and related disclosures.
ASU 2018-02: Reclassification of Certain Tax Effects from Accumulated Other Comprehensive Income
This update allows a reclassification from accumulated other comprehensive income to retained earnings for stranded tax effects resulting from the Tax Cuts and Job Act enacted in December 2017. This update will be effective for the Company for fiscal years beginning after December 15, 2018 and interim periods within those fiscal years. The Company does not expect this standard to have a material impact on the Company's consolidated financial statements.
ASU 2016-13: Financial Instruments - Credit Losses
This update introduces the current expected credit loss (CECL) model, which will require an entity to measure credit losses for certain financial instruments and financial assets, including trade receivables. Under this update, on initial recognition and at each reporting period, an entity will be required to recognize an allowance that reflects the entity’s current estimate of credit losses expected to be incurred over the life of the financial instrument. This update will be effective for the Company for fiscal years beginning after December 15, 2019 and interim periods within those fiscal years. Early adoption is permitted. The Company is currently assessing the impact of this update on the Company’s consolidated financial statements and related disclosures.
ASU 2016-02: Leases
This update requires the recognition of lease assets and lease liabilities on the balance sheet for all lease obligations and disclosing key information about leasing arrangements. This update requires the recognition of lease assets and lease liabilities by lessees for those leases classified as operating leases under current generally accepted accounting principles. This update will be effective for the Company for all annual periods beginning after December 15, 2018, including interim periods within those fiscal years. The Company will apply the new standard at its adoption date rather than at the earliest comparative period
| 43 |
presented in the financial statements. The Company’s operating leases will result in the recognition of additional assets and the corresponding liabilities on its Consolidated Balance Sheets. The adoption of this standard will not have a material impact on the Company's consolidated financial statements.
Cash Equivalents
The Company classifies all highly liquid investments with stated maturities of three months or less from date of purchase as cash equivalents and all highly liquid investments with stated maturities of greater than three months from the date of purchase as current marketable securities. The Company has a policy of making investments only with commercial institutions that have at least an investment grade credit rating. The Company invests its cash primarily in government securities and obligations, corporate debt securities, money market funds and reverse repurchase agreements (RRAs).
RRAs are collateralized by deposits in the form of Government Securities and Obligations for an amount not less than 102% of their value. The Company does not record an asset or liability as the Company is not permitted to sell or repledge the associated collateral. The Company has a policy that the collateral has at least an A (or equivalent) credit rating. The Company utilizes a third party custodian to manage the exchange of funds and ensure that collateral received is maintained at 102% of the value of the RRAs on a daily basis. RRAs with stated maturities of greater than three months from the date of purchase are classified as marketable securities.
Investments
Investments classified as held to maturity investments are reported at amortized cost and realized gains or losses are reported in earnings. Investments classified as available-for-sale are carried at estimated fair value with unrealized gains and losses recorded as a component of accumulated other comprehensive income. Available-for-sale securities available for current operations are classified as current assets otherwise, they are classified as long term. Management determines the appropriate classification of its investment in debt and equity securities at the time of purchase and re-evaluates such determination at each balance sheet date. The Company reviews its investments in equity securities for impairment and adjusts these investments to fair value through earnings, as required.
Property, Plant and Equipment and Depreciation
Property, plant and equipment are stated at cost. The Company utilizes the straight-line method of depreciation over the estimated useful lives of the assets:
| Building and building equipment | 20 - 30 years |
| Land and leasehold improvements | 10 - 20 years |
| Machinery and equipment | 2 - 13 years |
The Company capitalizes certain computer software and development costs, included in machinery and equipment, when incurred in connection with developing or obtaining computer software for internal use. Capitalized software costs are amortized over the estimated useful lives of the software, which generally range from 3 to 8 years.
The Company reviews long-lived assets to assess recoverability using undiscounted cash flows. When certain events or changes in operating or economic conditions occur, an impairment assessment may be performed on the recoverability of the carrying value of these assets. If the asset is determined to be impaired, the loss is measured based on the difference between the asset’s fair value and its carrying value. If quoted market prices are not available, the Company will estimate fair value using a discounted value of estimated future cash flows.
Revenue Recognition
The Company recognizes revenue from product sales when obligations under the terms of a contract with the customer are satisfied; generally, this occurs with the transfer of control of the goods to customers. The Company's global payment terms are typically between 30 to 90 days. Provisions for certain rebates, sales incentives, trade promotions, coupons, product returns and discounts to customers are accounted for as variable consideration and recorded as a reduction in sales.
Product discounts granted are based on the terms of arrangements with direct, indirect and other market participants, as well as market conditions, including consideration of competitor pricing. Rebates are estimated based on contractual terms, historical experience, patient outcomes, trend analysis and projected market conditions in the various markets served. The Company evaluates market conditions for products or groups of products primarily through the analysis of wholesaler and other third-party sell-through and market research data, as well as internally generated information.
Sales returns are estimated and recorded based on historical sales and returns information. Products that exhibit unusual sales or return patterns due to dating, competition or other marketing matters are specifically investigated and analyzed as part of the accounting for sales return accruals.
Sales returns allowances represent a reserve for products that may be returned due to expiration, destruction in the field, or in specific areas, product recall. The sales returns reserve is based on historical return trends by product and by market as a percent to gross sales. In accordance with the Company’s accounting policies, the Company generally issues credit to
| 44 |
customers for returned goods. The Company’s sales returns reserves are accounted for in accordance with the U.S. GAAP guidance for revenue recognition when right of return exists. Sales returns reserves are recorded at full sales value. Sales returns in the Consumer and Pharmaceutical segments are almost exclusively not resalable. Sales returns for certain franchises in the Medical Devices segment are typically resalable but are not material. The Company infrequently exchanges products from inventory for returned products. The sales returns reserve for the total Company has been approximately 1.0% of annual net trade sales during the fiscal reporting years 2018, 2017 and 2016.
Promotional programs, such as product listing allowances and cooperative advertising arrangements, are recorded in the same period as related sales. Continuing promotional programs include coupons and volume-based sales incentive programs. The redemption cost of consumer coupons is based on historical redemption experience by product and value. Volume-based incentive programs are based on the estimated sales volumes for the incentive period and are recorded as products are sold. These arrangements are evaluated to determine the appropriate amounts to be deferred or recorded as a reduction of revenue. The Company also earns profit-share payments through collaborative arrangements for certain products, which are included in sales to customers. For all years presented, profit-share payments were less than 2.0% of the total revenues and are included in sales to customers.
Shipping and Handling
Shipping and handling costs incurred were $1,090 million, $1,042 million and $974 million in 2018, 2017 and 2016, respectively, and are included in selling, marketing and administrative expense. The amount of revenue received for shipping and handling is less than 0.5% of sales to customers for all periods presented.
Inventories
Inventories are stated at the lower of cost or net realizable value determined by the first-in, first-out method.
Intangible Assets and Goodwill
The authoritative literature on U.S. GAAP requires that goodwill and intangible assets with indefinite lives be assessed annually for impairment. The Company completed the annual impairment test for 2018 in the fiscal fourth quarter. Future impairment tests will be performed annually in the fiscal fourth quarter, or sooner if warranted. Purchased in-process research and development is accounted for as an indefinite lived intangible asset until the underlying project is completed, at which point the intangible asset will be accounted for as a definite lived intangible asset, or abandoned, at which point the intangible asset will be written off or partially impaired.
Intangible assets that have finite useful lives continue to be amortized over their useful lives, and are reviewed for impairment when warranted by economic conditions. See Note 5 for further details on Intangible Assets and Goodwill.
Financial Instruments
As required by U.S. GAAP, all derivative instruments are recorded on the balance sheet at fair value. Fair value is the exit price that would be received to sell an asset or paid to transfer a liability. Fair value is a market-based measurement determined using assumptions that market participants would use in pricing an asset or liability. The authoritative literature establishes a three-level hierarchy to prioritize the inputs used in measuring fair value, with Level 1 having the highest priority and Level 3 having the lowest. Changes in the fair value of derivatives are recorded each period in current earnings or other comprehensive income, depending on whether the derivative is designated as part of a hedge transaction, and if so, the type of hedge transaction.
The Company documents all relationships between hedged items and derivatives. The overall risk management strategy includes reasons for undertaking hedge transactions and entering into derivatives. The objectives of this strategy are: (1) minimize foreign currency exposure’s impact on the Company’s financial performance; (2) protect the Company’s cash flow from adverse movements in foreign exchange rates; (3) ensure the appropriateness of financial instruments; and (4) manage the enterprise risk associated with financial institutions. See Note 6 for additional information on Financial Instruments.
Product Liability
Accruals for product liability claims are recorded, on an undiscounted basis, when it is probable that a liability has been incurred and the amount of the liability can be reasonably estimated based on existing information and actuarially determined estimates where applicable. The accruals are adjusted periodically as additional information becomes available. The Company accrues an estimate of the legal defense costs needed to defend each matter when those costs are probable and can be reasonably estimated. To the extent adverse verdicts have been rendered against the Company, the Company does not record an accrual until a loss is determined to be probable and can be reasonably estimated.
As a result of cost and availability factors, effective November 1, 2005, the Company ceased purchasing third-party product liability insurance. The Company has self insurance through a wholly-owned captive insurance company. In addition to accruals in the self insurance program, claims that exceed the insurance coverage are accrued when losses are probable and amounts can be reasonably estimated.
| 45 |
Research and Development
Research and development expenses are expensed as incurred in accordance with ASC 730, Research and Development. Upfront and milestone payments made to third parties in connection with research and development collaborations are expensed as incurred up to the point of regulatory approval. Payments made to third parties subsequent to regulatory approval are capitalized and amortized over the remaining useful life of the related product. Amounts capitalized for such payments are included in other intangibles, net of accumulated amortization.
The Company enters into collaborative arrangements, typically with other pharmaceutical or biotechnology companies, to develop and commercialize drug candidates or intellectual property. These arrangements typically involve two (or more) parties who are active participants in the collaboration and are exposed to significant risks and rewards dependent on the commercial success of the activities. These collaborations usually involve various activities by one or more parties, including research and development, marketing and selling and distribution. Often, these collaborations require upfront, milestone and royalty or profit share payments, contingent upon the occurrence of certain future events linked to the success of the asset in development. Amounts due from collaborative partners related to development activities are generally reflected as a reduction of research and development expense because the performance of contract development services is not central to the Company’s operations. In general, the income statement presentation for these collaborations is as follows:
| Nature/Type of Collaboration | Statement of Earnings Presentation | |
| Third-party sale of product & profit share payments received | Sales to customers | |
| Royalties/milestones paid to collaborative partner (post-regulatory approval)* | Cost of products sold | |
| Royalties received from collaborative partner | Other income (expense), net | |
| Upfront payments & milestones paid to collaborative partner (pre-regulatory approval) | Research and development expense | |
| Research and development payments to collaborative partner | Research and development expense | |
| Research and development payments received from collaborative partner | Reduction of Research and development expense |
| * | Milestones are capitalized as intangible assets and amortized to cost of products sold over the useful life. |
For all years presented, there was no individual project that represented greater than 5% of the total annual consolidated research and development expense.
The Company has a number of products and compounds developed in collaboration with strategic partners including XARELTO®, co-developed with Bayer HealthCare AG and IMBRUVICA®, developed in collaboration and co-marketed with Pharmacyclics LLC, an AbbVie company.
The Company has a number of licensing arrangements for products and compounds including DARZALEX®, licensed from Genmab A/S.
Advertising
Costs associated with advertising are expensed in the year incurred and are included in selling, marketing and administrative expenses. Advertising expenses worldwide, which comprised television, radio, print media and Internet advertising, were $2.6 billion, $2.5 billion and $2.4 billion in 2018, 2017 and 2016, respectively.
Income Taxes
Income taxes are recorded based on amounts refundable or payable for the current year and include the results of any difference between U.S. GAAP accounting and tax reporting, recorded as deferred tax assets or liabilities. The Company estimates deferred tax assets and liabilities based on enacted tax regulations and rates. Future changes in tax laws and rates may affect recorded deferred tax assets and liabilities in the future.
The Company has unrecognized tax benefits for uncertain tax positions. The Company follows U.S. GAAP which prescribes a recognition threshold and measurement attribute for the financial statement recognition and measurement of a tax position taken or expected to be taken in a tax return. Management believes that changes in these estimates would not have a material effect on the Company's results of operations, cash flows or financial position.
In the fourth fiscal quarter of 2018, the Company has elected to account for the GILTI tax under the deferred method. The deferred tax amounts recorded are based on the evaluation of temporary differences that are expected to reverse as GILTI is incurred.
The Company has recorded deferred tax liabilities on all undistributed earnings prior to December 31, 2017 from its international subsidiaries. The Company has not provided deferred taxes on the undistributed earnings subsequent to January 1, 2018 from certain international subsidiaries where the earnings are considered to be indefinitely reinvested. The Company intends to continue to reinvest these earnings in those international operations. If the Company decides at a later date to
| 46 |
repatriate these earnings to the U.S., the Company would be required to provide for the net tax effects on these amounts. The Company estimates that the total tax effect of this repatriation would be approximately $0.7 billion under current enacted tax laws and regulations and at current currency exchange rates.
See Note 8 for further information regarding income taxes.
Net Earnings Per Share
Basic earnings per share is computed by dividing net earnings available to common shareholders by the weighted average number of common shares outstanding for the period. Diluted earnings per share reflects the potential dilution that could occur if securities were exercised or converted into common stock using the treasury stock method.
Use of Estimates
The preparation of consolidated financial statements in conformity with accounting principles generally accepted in the U.S. requires management to make estimates and assumptions that affect the amounts reported. Estimates are used when accounting for sales discounts, rebates, allowances and incentives, product liabilities, income taxes, withholding taxes, depreciation, amortization, employee benefits, contingencies and intangible asset and liability valuations. Actual results may or may not differ from those estimates.
The Company follows the provisions of U.S. GAAP when recording litigation related contingencies. A liability is recorded when a loss is probable and can be reasonably estimated. The best estimate of a loss within a range is accrued; however, if no estimate in the range is better than any other, the minimum amount is accrued.
Annual Closing Date
The Company follows the concept of a fiscal year, which ends on the Sunday nearest to the end of the month of December. Normally each fiscal year consists of 52 weeks, but every five or six years the fiscal year consists of 53 weeks, and therefore includes additional shipping days, as was the case in 2015, and will be the case again in 2020.
Reclassification
Certain prior period amounts have been reclassified to conform to current year presentation.
| 2. | Cash, Cash Equivalents and Current Marketable Securities |
At the end of 2018 and 2017, cash, cash equivalents and current marketable securities were comprised of:
| (Dollars in Millions) | 2018 | ||||||||||||||
| Carrying Amount | Estimated Fair Value | Cash & Cash Equivalents | Current Marketable Securities | ||||||||||||
| Cash | $ | 2,619 | 2,619 | 2,619 | — | ||||||||||
| U.S. Reverse repurchase agreements | 3,009 | 3,009 | 3,009 | — | |||||||||||
| Other Reverse repurchase agreements | 443 | 443 | 443 | — | |||||||||||
| Money market funds | 3,397 | 3,397 | 3,397 | — | |||||||||||
| Time deposits(1) | 485 | 485 | 485 | — | |||||||||||
| Subtotal | $ | 9,953 | 9,953 | 9,953 | — | ||||||||||
| Gov't Securities | $ | 9,474 | 9,474 | 8,144 | 1,330 | ||||||||||
| Corporate debt securities | 260 | 260 | 10 | 250 | |||||||||||
| Subtotal available for sale(2) | $ | 9,734 | 9,734 | 8,154 | 1,580 | ||||||||||
| Total cash, cash equivalents and current marketable securities | $ | 18,107 | 1,580 |
In 2018, the carrying amount was the same as the estimated fair value.
In 2017, the carrying amount was the same as the estimated fair value.
| 47 |
| (Dollars in Millions) | 2017 | ||||||||||||||
| Carrying Amount | Estimated Fair Value | Cash & Cash Equivalents | Current Marketable Securities | ||||||||||||
| Cash | $ | 2,929 | 2,929 | 2,929 | — | ||||||||||
| Other Sovereign Securities(1) | 279 | 279 | 219 | 60 | |||||||||||
| U.S. Reverse repurchase agreements | 4,025 | 4,025 | 4,025 | — | |||||||||||
| Corporate debt securities(1) | 289 | 289 | 244 | 45 | |||||||||||
| Money market funds | 4,288 | 4,288 | 4,288 | — | |||||||||||
| Time deposits(1) | 1,176 | 1,176 | 1,175 | 1 | |||||||||||
| Subtotal | $ | 12,986 | 12,986 | 12,880 | 106 | ||||||||||
| Gov't Securities | $ | 4,864 | 4,864 | 4,833 | 31 | ||||||||||
| Other Sovereign Securities | 186 | 186 | 80 | 106 | |||||||||||
| Corporate debt securities | 260 | 260 | 31 | 229 | |||||||||||
| Subtotal available for sale(2) | $ | 5,310 | 5,310 | 4,944 | 366 | ||||||||||
| Total cash, cash equivalents and current marketable securities | $ | 17,824 | 472 |
(1) Held to maturity investments are reported at amortized cost and realized gains or losses are reported in earnings.
(2) Available for sale debt securities are reported at fair value with unrealized gains and losses reported net of taxes in other comprehensive income.
Fair value of government securities and obligations and corporate debt securities were estimated using quoted broker prices and significant other observable inputs.
The contractual maturities of the available for sale debt securities at December 30, 2018 are as follows:
| (Dollars in Millions) | Cost Basis | Fair Value | |||||
| Due within one year | $ | 9,670 | 9,670 | ||||
| Due after one year through five years | 64 | 64 | |||||
| Due after five years through ten years | — | — | |||||
| Total debt securities | $ | 9,734 | 9,734 |
The Company invests its excess cash in both deposits with major banks throughout the world and other high-quality money market instruments. The Company has a policy of making investments only with commercial institutions that have at least an investment grade credit rating.
| 3. | Inventories |
At the end of 2018 and 2017, inventories were comprised of:
| (Dollars in Millions) | 2018 | 2017 | |||||
| Raw materials and supplies | $ | 1,114 | 1,140 | ||||
| Goods in process | 2,109 | 2,317 | |||||
| Finished goods | 5,376 | 5,308 | |||||
| Total inventories | $ | 8,599 | (1) | 8,765 |
(1) Net of assets held for sale on the Consolidated Balance Sheet for approximately $0.2 billion related to the divestiture of the Advanced Sterilization Products business and $0.3 billion related to the strategic collaboration with Jabil Inc., both of which were pending as of December 30, 2018.
| 48 |
| 4. | Property, Plant and Equipment |
At the end of 2018 and 2017, property, plant and equipment at cost and accumulated depreciation were:
| (Dollars in Millions) | 2018 | 2017 | |||||
| Land and land improvements | $ | 807 | 829 | ||||
| Buildings and building equipment | 11,176 | 11,240 | |||||
| Machinery and equipment | 25,992 | 25,949 | |||||
| Construction in progress | 3,876 | 3,448 | |||||
| Total property, plant and equipment, gross | $ | 41,851 | 41,466 | ||||
| Less accumulated depreciation | 24,816 | 24,461 | |||||
| Total property, plant and equipment, net | $ | 17,035 | (1) | 17,005 |
(1) Net of assets held for sale on the Consolidated Balance Sheet for approximately $0.1 billion related to the divestiture of the Advanced Sterilization Products business and $0.1 billion related to the strategic collaboration with Jabil Inc., both of which were pending as of December 30, 2018.
The Company capitalizes interest expense as part of the cost of construction of facilities and equipment. Interest expense capitalized in 2018, 2017 and 2016 was $86 million, $94 million and $102 million, respectively.
Depreciation expense, including the amortization of capitalized interest in 2018, 2017 and 2016 was $2.6 billion, $2.6 billion and $2.5 billion, respectively.
Upon retirement or other disposal of property, plant and equipment, the costs and related amounts of accumulated depreciation or amortization are eliminated from the asset and accumulated depreciation accounts, respectively. The difference, if any, between the net asset value and the proceeds are recorded in earnings.
| 5. | Intangible Assets and Goodwill |
At the end of 2018 and 2017, the gross and net amounts of intangible assets were:
| (Dollars in Millions) | 2018 | 2017 | |||||
| Intangible assets with definite lives: | |||||||
| Patents and trademarks — gross | $ | 35,194 | 36,427 | ||||
| Less accumulated amortization | 9,784 | 7,223 | |||||
| Patents and trademarks — net | $ | 25,410 | 29,204 | ||||
| Customer relationships and other intangibles — gross | $ | 21,334 | 20,204 | ||||
| Less accumulated amortization | 8,323 | 7,463 | |||||
| Customer relationships and other intangibles — net | $ | 13,011 | 12,741 | ||||
| Intangible assets with indefinite lives: | |||||||
| Trademarks | $ | 6,937 | 7,082 | ||||
| Purchased in-process research and development(1) | 2,253 | 4,201 | |||||
| Total intangible assets with indefinite lives | $ | 9,190 | 11,283 | ||||
| Total intangible assets — net | $ | 47,611 | 53,228 |
(1) The decrease was primarily attributable to the write-down of $1.1 billion related to the assets acquired in the acquisitions of Alios Biopharma Inc. (Alios) and XO1 Limited (XO1). Of the $1.1 billion, the Company recorded a partial impairment charge of $0.8 billion related to the development program of AL-8176, an investigational drug for the treatment of Respiratory Syncytial Virus (RSV) and human metapneumovirus (hMPV) acquired with the 2014 acquisition of Alios. The impairment charge was calculated based on updated cash flow projections discounted for the inherent risk in the asset development and reflects the impact of the phase 2b clinical trial suspension, a decrease in the probability of success factors and the ongoing analysis of asset development activities. In addition, an impairment charge of $0.3 billion was recorded for the discontinuation of the development project for an anti-thrombin antibody associated with the 2015 acquisition of XO1. Additionally, $0.8 billion of IPR&D related to ERLEADA™ was reclassified to definite lived intangible assets upon commercialization.
| 49 |
Goodwill as of December 30, 2018 and December 31, 2017, as allocated by segment of business, was as follows:
| (Dollars in Millions) | Consumer | Pharmaceutical | Medical Devices | Total | |||||||||
| Goodwill at January 1, 2017 | $ | 8,263 | 2,840 | 11,702 | 22,805 | ||||||||
| Goodwill, related to acquisitions (1) | 102 | 6,161 | 2,200 | 8,463 | |||||||||
| Goodwill, related to divestitures | (74 | ) | (1 | ) | (102 | ) | (177 | ) | |||||
| Currency translation/other | 584 | 109 | 122 | 815 | |||||||||
| Goodwill at December 31, 2017 | $ | 8,875 | 9,109 | 13,922 | 31,906 | ||||||||
| Goodwill, related to acquisitions | 168 | 51 | 184 | 403 | |||||||||
| Goodwill, related to divestitures | — | — | (1,348 | ) | (2) | (1,348 | ) | ||||||
| Currency translation/other | (373 | ) | (97 | ) | (38 | ) | (508 | ) | |||||
| Goodwill at December 30, 2018 | $ | 8,670 | 9,063 | 12,720 | 30,453 |
(1) Goodwill of $6.2 billion related to the Actelion acquisition acquired in the fiscal second quarter of 2017, within the Pharmaceutical segment and $1.7 billion related to the AMO acquisition acquired in the fiscal first quarter of 2017, within the Medical Devices segment.
(2) Goodwill of $1.0 billion is related to the divestiture of the LifeScan business. Goodwill of $0.3 billion is related to the divestiture of the Advanced Sterilization Products business, which was pending and classified as assets held for sale on the Consolidated Balance Sheet as of December 30, 2018.
The weighted average amortization periods for patents and trademarks and customer relationships and other intangible assets are 11 years and 22 years, respectively. The amortization expense of amortizable assets included in cost of products sold was $4.4 billion, $3.0 billion and $1.2 billion before tax, for the fiscal years ended December 30, 2018, December 31, 2017 and January 1, 2017, respectively. The estimated amortization expense for the five succeeding years approximates $4.3 billion before tax, per year. Intangible asset write-downs are included in Other (income) expense, net.
See Note 20 to the Consolidated Financial Statements for additional details related to acquisitions and divestitures.
| 6. | Fair Value Measurements |
The Company uses forward foreign exchange contracts to manage its exposure to the variability of cash flows, primarily related to the foreign exchange rate changes of future intercompany products and third-party purchases of materials denominated in a foreign currency. The Company uses cross currency interest rate swaps to manage currency risk primarily related to borrowings. Both types of derivatives are designated as cash flow hedges.
Additionally, the Company uses interest rate swaps as an instrument to manage interest rate risk related to fixed rate borrowings. These derivatives are designated as fair value hedges. The Company uses cross currency interest rate swaps and forward foreign exchange contracts designated as net investment hedges. Additionally, the Company uses forward foreign exchange contracts to offset its exposure to certain foreign currency assets and liabilities. These forward foreign exchange contracts are not designated as hedges and therefore, changes in the fair values of these derivatives are recognized in earnings, thereby offsetting the current earnings effect of the related foreign currency assets and liabilities.
The Company early adopted ASU 2017-12: Targeted Improvements to Accounting for Hedge Activities effective as of the beginning of fiscal second quarter of 2018.
The Company does not enter into derivative financial instruments for trading or speculative purposes, or that contain credit risk related contingent features. During the fiscal second quarter of 2017, the Company entered into credit support agreements (CSA) with certain derivative counterparties establishing collateral thresholds based on respective credit ratings and netting agreements. As of December 30, 2018, the total amount of collateral paid under the credit support agreements (CSA) amounted to $182 million net. On an ongoing basis, the Company monitors counter-party credit ratings. The Company considers credit non-performance risk to be low, because the Company primarily enters into agreements with commercial institutions that have at least an investment grade credit rating. Refer to the table on significant financial assets and liabilities measured at fair value contained in this footnote for receivables and payables with these commercial institutions. As of December 30, 2018, the Company had notional amounts outstanding for forward foreign exchange contracts, cross currency interest rate swaps and interest rate swaps of $41.1 billion, $7.3 billion, and $0.5 billion respectively. As of December 31, 2017, the Company had notional amounts outstanding for forward foreign exchange contracts, cross currency interest rate swaps and interest rate swaps of $34.5 billion, $2.3 billion, and $1.1 billion respectively.
| 50 |
All derivative instruments are recorded on the balance sheet at fair value. Changes in the fair value of derivatives are recorded each period in current earnings or other comprehensive income, depending on whether the derivative is designated as part of a hedge transaction, and if so, the type of hedge transaction.
The designation as a cash flow hedge is made at the entrance date of the derivative contract. At inception, all derivatives are expected to be highly effective. Foreign exchange contracts designated as cash flow hedges are accounted for under the forward method and all gains/losses associated with these contracts will be recognized in the income statement when the hedged item impacts earnings. Changes in the fair value of these derivatives are recorded in accumulated other comprehensive income until the underlying transaction affects earnings, and are then reclassified to earnings in the same account as the hedged transaction.
Gains and losses associated with interest rate swaps and changes in fair value of hedged debt attributable to changes in interest rates are recorded to interest expense in the period in which they occur. Gains and losses on net investment hedge are accounted through the currency translation account within accumulated other comprehensive income. The portion excluded from effectiveness testing is recorded through interest (income) expense using the spot method. On an ongoing basis, the Company assesses whether each derivative continues to be highly effective in offsetting changes of hedged items. If and when a derivative is no longer expected to be highly effective, hedge accounting is discontinued.
During the fiscal second quarter of 2016, the Company designated its Euro denominated notes issued in May 2016 with due dates ranging from 2022 to 2035 as a net investment hedge of the Company's investments in certain of its international subsidiaries that use the Euro as their functional currency in order to reduce the volatility caused by changes in exchange rates.
As of December 30, 2018, the balance of deferred net loss on derivatives included in accumulated other comprehensive income was $195 million after-tax. For additional information, see the Consolidated Statements of Comprehensive Income and Note 13. The Company expects that substantially all of the amounts related to forward foreign exchange contracts will be reclassified into earnings over the next 12 months as a result of transactions that are expected to occur over that period. The maximum length of time over which the Company is hedging transaction exposure is 18 months, excluding interest rate contracts, net investment hedges and equity collar contracts. The amount ultimately realized in earnings may differ as foreign exchange rates change. Realized gains and losses are ultimately determined by actual exchange rates at maturity of the derivative.
| 51 |
The following table is a summary of the activity related to derivatives and hedges for the fiscal years ended December 30, 2018 and December 31, 2017:
| December 30, 2018 | December 31, 2017 | ||||||||||||||||||||
| (Dollars in Millions) | Sales | Cost of Products Sold | R&D Expense | Interest (Income) Expense | Other (Income) Expense | Sales | Cost of Products Sold | R&D Expense | Interest (Income) Expense | Other (Income) Expense | |||||||||||
| The effects of fair value, net investment and cash flow hedging: | |||||||||||||||||||||
| Gain (Loss) on fair value hedging relationship: | |||||||||||||||||||||
| Interest rate swaps contracts: | |||||||||||||||||||||
| Hedged items | $ | — | — | — | 5 | — | — | — | — | 5 | — | ||||||||||
| Derivatives designated as hedging instruments | — | — | — | (5 | ) | — | — | — | — | (5 | ) | — | |||||||||
| Gain (Loss) on net investment hedging relationship: | |||||||||||||||||||||
| Cross currency interest rate swaps contracts: | |||||||||||||||||||||
| Amount of gain or (loss) recognized in income on derivative amount excluded from effectiveness testing | — | — | — | 56 | — | — | — | — | — | — | |||||||||||
| Amount of gain or (loss) recognized in AOCI | — | — | — | 56 | — | — | — | — | — | — | |||||||||||
| Gain (Loss) on cash flow hedging relationship: | |||||||||||||||||||||
| Forward foreign exchange contracts: | |||||||||||||||||||||
| Amount of gain or (loss) reclassified from AOCI into income (1) | 47 | 200 | (220 | ) | — | (24 | ) | (31 | ) | (159 | ) | (165 | ) | — | (87 | ) | |||||
| Amount of gain or (loss) recognized in AOCI (1) | (32 | ) | (17 | ) | (193 | ) | — | (4 | ) | 49 | 96 | (199 | ) | — | (60 | ) | |||||
| Cross currency interest rate swaps contracts: | |||||||||||||||||||||
| Amount of gain or (loss) reclassified from AOCI into income | — | — | — | 133 | — | — | — | — | 83 | — | |||||||||||
| Amount of gain or (loss) recognized in AOCI | $ | — | — | — | 117 | — | — | — | — | 110 | — |
(1) Includes equity collar contracts. The equity collar contracts expired in December of 2017.
For the fiscal years ended December 30, 2018 and December 31, 2017, the following amounts were recorded on the Consolidated Balance Sheet
| Line item in the Consolidated Balance Sheet in which the hedged item is included | Carrying Amount of the Hedged Liability | Cumulative Amount of Fair Value Hedging Adjustment Included in the Carrying Amount of the Hedged Liability | |||||||||||
| (Dollars in Millions) | December 30, 2018 | December 31, 2017 | December 30, 2018 | December 31, 2017 | |||||||||
| Current Portion of Long-term Debt | $ | 494 | 597 | 5 | 2 | ||||||||
| Long-term Debt | — | 496 | — | 3 |
| 52 |
| The following table is the effect of derivatives not designated as hedging instrument for the fiscal years ended December 30, 2018 and December 31, 2017: | |||||||||||
| (Dollars in Millions) | Location of Gain /(Loss) Recognized in Income on Derivative | Gain/(Loss) Recognized In Income on Derivative | |||||||||
| Derivatives Not Designated as Hedging Instruments | December 30, 2018 | December 31, 2017 | |||||||||
| Foreign Exchange Contracts | Other (income) expense | (68 | ) | (5 | ) |
| The following table is the effect of net investment hedges for the fiscal years ended December 30, 2018 and December 31, 2017: | |||||||||||||||
| Gain/(Loss) Recognized In Accumulated OCI | Location of Gain or (Loss) Reclassified from Accumulated Other Comprehensive Income Into Income | Gain/(Loss) Reclassified From Accumulated OCI Into Income | |||||||||||||
| (Dollars in Millions) | Fiscal Nine Months Ended | ||||||||||||||
| December 30, 2018 | December 31, 2017 | December 30, 2018 | December 31, 2017 | ||||||||||||
| Debt | $ | 218 | (597 | ) | Other (income) expense | — | — | ||||||||
| Cross Currency interest rate swaps | $ | 150 | — | Other (income) expense | — | — |
The Company adopted ASU 2016-01: Financial Instruments: Recognition and Measurement of Financial Assets and Financial Liabilities as of the beginning of the fiscal year 2018. This ASU amends prior guidance to classify equity investments with readily determinable market values into different categories (that is, trading or available-for-sale) and require equity investments to be measured at fair value with changes in fair value recognized through net earnings. The Company made a cumulative effect adjustment to the opening balance of retained earnings upon adoption of ASU 2016-01 which increased retained earnings by $232 million, net of tax, and decreased accumulated other comprehensive income for previously net unrealized gains from equity investments.
The Company holds equity investments with readily determinable fair values and equity investments without readily determinable fair values. The Company has elected to measure equity investments that do not have readily determinable fair values at cost minus impairment, if any, plus or minus changes resulting from observable price changes in orderly transactions for the identical or a similar investment of the same issuer.
The following table is a summary of the activity related to equity investments as of December 30, 2018:
| (Dollars in Millions) | December 31, 2017 | December 30, 2018 | ||||||||||||||
| Carrying Value | Changes in Fair Value Reflected in Net Income (1) | Sales/ Purchases/Other (2) | Carrying Value | Non Current Other Assets | ||||||||||||
| Equity Investments with readily determinable value | $ | 751 | (247 | ) | 7 | 511 | 511 | |||||||||
| Equity Investments without readily determinable value | $ | 510 | 13 | 158 | 681 | 681 |
(1) Recorded in Other Income/Expense
(2) Other includes impact of currency
For equity investments without readily determinable market values, $54 million of the changes in fair value reflected in net income were the result of impairments. There were $67 million of changes in fair value reflected in net income due to changes in observable prices.
| 53 |
For the fiscal years ended December 31, 2017, changes in fair value reflected within other comprehensive income due to previously unrealized gains on equity investments with readily determinable fair values net of tax was a net gain of $232 million.
Fair value is the exit price that would be received to sell an asset or paid to transfer a liability. Fair value is a market-based measurement determined using assumptions that market participants would use in pricing an asset or liability. The authoritative literature establishes a three-level hierarchy to prioritize the inputs used in measuring fair value. The levels within the hierarchy are described below with Level 1 having the highest priority and Level 3 having the lowest.
The fair value of a derivative financial instrument (i.e., forward foreign exchange contracts, interest rate contracts) is the aggregation by currency of all future cash flows discounted to its present value at the prevailing market interest rates and subsequently converted to the U.S. Dollar at the current spot foreign exchange rate. The Company does not believe that fair values of these derivative instruments materially differ from the amounts that could be realized upon settlement or maturity, or that the changes in fair value will have a material effect on the Company’s results of operations, cash flows or financial position. The Company also holds equity investments which are classified as Level 1 and debt securities which are classified as Level 2. The Company did not have any other significant financial assets or liabilities which would require revised valuations under this standard that are recognized at fair value.
The following three levels of inputs are used to measure fair value:
Level 1 — Quoted prices in active markets for identical assets and liabilities.
Level 2 — Significant other observable inputs.
Level 3 — Significant unobservable inputs.
The Company’s significant financial assets and liabilities measured at fair value as of December 30, 2018 and December 31, 2017 were as follows:
| 2018 | 2017 | |||||||||||||||
| (Dollars in Millions) | Level 1 | Level 2 | Level 3 | Total | Total (1) | |||||||||||
| Derivatives designated as hedging instruments: | ||||||||||||||||
| Assets: | ||||||||||||||||
| Forward foreign exchange contracts | $ | — | 501 | — | 501 | 418 | ||||||||||
| Interest rate contracts (2)(4) | — | 161 | — | 161 | 7 | |||||||||||
| Total | — | 662 | — | 662 | 425 | |||||||||||
| Liabilities: | ||||||||||||||||
| Forward foreign exchange contracts | — | 548 | — | 548 | 402 | |||||||||||
| Interest rate contracts (3)(4) | — | 292 | — | 292 | 165 | |||||||||||
| Total | — | 840 | — | 840 | 567 | |||||||||||
| Derivatives not designated as hedging instruments: | ||||||||||||||||
| Assets: | ||||||||||||||||
| Forward foreign exchange contracts | — | 32 | — | 32 | 38 | |||||||||||
| Liabilities: | ||||||||||||||||
| Forward foreign exchange contracts | — | 32 | — | 32 | 38 | |||||||||||
| Available For Sale Other Investments: | ||||||||||||||||
| Equity investments(5) | 511 | — | — | 511 | 751 | |||||||||||
| Debt securities(6) | $ | — | 9,734 | — | 9,734 | 5,310 |
| 54 |
| Gross to Net Derivative Reconciliation | 2018 | 2017 | |||||
| (Dollars in Millions) | |||||||
| Total Gross Assets | $ | 694 | 463 | ||||
| Credit Support Agreement (CSA) | (423 | ) | (76 | ) | |||
| Total Net Asset | 271 | 387 | |||||
| Total Gross Liabilities | 872 | 605 | |||||
| Credit Support Agreement (CSA) | (605 | ) | (238 | ) | |||
| Total Net Liabilities | $ | 267 | 367 | ||||
| (1) | 2017 assets and liabilities are all classified as Level 2 with the exception of equity investments of $751 million, which are classified as Level 1. |
| (2) | Includes $6 million and $7 million of non-current assets for the fiscal years ending December 30, 2018 and December 31, 2017, respectively. |
| (3) | Includes $3 million and $9 million of non-current liabilities for the fiscal years ending December 30, 2018 and December 31, 2017, respectively. |
| (4) | Includes cross currency interest rate swaps and interest rate swaps. |
| (5) | Classified as non-current other assets. The carrying amount of the equity investments were $511 million and $751 million as of December 30, 2018 and December 31, 2017, respectively. |
| (6) | Classified as cash equivalents and current marketable securities. |
See Notes 2 and 7 for financial assets and liabilities held at carrying amount on the Consolidated Balance Sheet.
| 55 |
| 7. | Borrowings |
The components of long-term debt are as follows:
| (Dollars in Millions) | 2018 | Effective Rate % | 2017 | Effective Rate % | ||||||||||
| 5.15% Debentures due 2018 | $ | — | 900 | 5.18 | ||||||||||
| 1.65% Notes due 2018 | — | 597 | 1.70 | |||||||||||
| 4.75% Notes due 2019 (1B Euro 1.14)(2)/(1B Euro 1.1947)(3) | 1,139 | (2) | 5.83 | 1,192 | (3) | 5.83 | ||||||||
| 1.875% Notes due 2019 | 494 | 1.93 | 496 | 1.93 | ||||||||||
| 0.89% Notes due 2019 | 300 | 1.32 | 300 | 1.75 | ||||||||||
| 1.125% Notes due 2019 | 699 | 1.13 | 699 | 1.13 | ||||||||||
| 3% Zero Coupon Convertible Subordinated Debentures due 2020 | 51 | 3.00 | 60 | 3.00 | ||||||||||
| 2.95% Debentures due 2020 | 548 | 3.15 | 547 | 3.15 | ||||||||||
| 1.950% Notes due 2020 | 499 | 1.99 | 499 | 1.99 | ||||||||||
| 3.55% Notes due 2021 | 449 | 3.67 | 448 | 3.67 | ||||||||||
| 2.45% Notes due 2021 | 349 | 2.48 | 349 | 2.48 | ||||||||||
| 1.65% Notes due 2021 | 998 | 1.65 | 998 | 1.65 | ||||||||||
| 0.250% Notes due 2022 (1B Euro 1.14)(2)/(1B Euro 1.1947)(3) | 1,137 | (2) | 0.26 | 1,191 | (3) | 0.26 | ||||||||
| 2.25% Notes due 2022 | 996 | 2.31 | 995 | 2.31 | ||||||||||
| 6.73% Debentures due 2023 | 250 | 6.73 | 250 | 6.73 | ||||||||||
| 3.375% Notes due 2023 | 805 | 3.17 | 806 | 3.17 | ||||||||||
| 2.05% Notes due 2023 | 498 | 2.09 | 498 | 2.09 | ||||||||||
| 0.650% Notes due 2024 (750MM Euro 1.14)(2)/(750MM Euro 1.1947)(3) | 851 | (2) | 0.68 | 891 | (3) | 0.68 | ||||||||
| 5.50% Notes due 2024 (500MM GBP 1.2636)(2)/(500MM GBP 1.3444)(3) | 627 | (2) | 6.75 | 666 | (3) | 6.75 | ||||||||
| 2.625% Notes due 2025 | 748 | 2.63 | 747 | 2.63 | ||||||||||
| 2.45% Notes due 2026 | 1,992 | 2.47 | 1,990 | 2.47 | ||||||||||
| 2.95% Notes due 2027 | 996 | 2.96 | 995 | 2.96 | ||||||||||
| 1.150% Notes due 2028 (750MM Euro 1.14)(2)/(750MM Euro 1.1947)(3) | 847 | (2) | 1.21 | 887 | (3) | 1.21 | ||||||||
| 2.900% Notes due 2028 | 1,493 | 2.91 | 1,492 | 2.91 | ||||||||||
| 6.95% Notes due 2029 | 297 | 7.14 | 296 | 7.14 | ||||||||||
| 4.95% Debentures due 2033 | 498 | 4.95 | 498 | 4.95 | ||||||||||
| 4.375% Notes due 2033 | 856 | 4.24 | 856 | 4.24 | ||||||||||
| 1.650% Notes due 2035 (1.5B Euro 1.14)(2)/(1.5B Euro 1.1947)(3) | 1,693 | (2) | 1.68 | 1,774 | (3) | 1.68 | ||||||||
| 3.55% Notes due 2036 | 988 | 3.59 | 987 | 3.59 | ||||||||||
| 5.95% Notes due 2037 | 991 | 5.99 | 991 | 5.99 | ||||||||||
| 3.625% Notes due 2037 | 1,486 | 3.64 | 1,486 | 3.64 | ||||||||||
| 5.85% Debentures due 2038 | 696 | 5.85 | 696 | 5.85 | ||||||||||
| 3.400% Notes due 2038 | 990 | 3.42 | 990 | 3.42 | ||||||||||
| 4.50% Debentures due 2040 | 538 | 4.63 | 538 | 4.63 | ||||||||||
| 4.85% Notes due 2041 | 297 | 4.89 | 296 | 4.89 | ||||||||||
| 4.50% Notes due 2043 | 495 | 4.52 | 495 | 4.52 | ||||||||||
| 3.70% Notes due 2046 | 1,972 | 3.74 | 1,971 | 3.74 | ||||||||||
| 3.75% Notes due 2047 | 991 | 3.76 | 990 | 3.76 |
| 56 |
| 3.500% Notes due 2048 | 742 | 3.52 | 742 | 3.52 | ||||||||||
| Other | 24 | — | 75 | — | ||||||||||
| Subtotal | 30,320 | (4) | 3.19 | % | (1) | 32,174 | (4) | 3.19 | (1 | ) | ||||
| Less current portion | 2,636 | 1,499 | ||||||||||||
| Total long-term debt | $ | 27,684 | 30,675 |
| (1) | Weighted average effective rate. |
| (2) | Translation rate at December 30, 2018. |
| (3) | Translation rate at December 31, 2017. |
| (4) | The excess of the fair value over the carrying value of debt was $0.3 billion in 2018 and $2.0 billion in 2017. |
Fair value of the long-term debt was estimated using market prices, which were corroborated by quoted broker prices and significant other observable inputs.(Level 2)
The Company has access to substantial sources of funds at numerous banks worldwide. In September 2018, the Company secured a new 364-day Credit Facility. Total credit available to the Company approximates $10 billion, which expires on September 12, 2019. Interest charged on borrowings under the credit line agreements is based on either bids provided by banks, the prime rate or London Interbank Offered Rates (LIBOR), plus applicable margins. Commitment fees under the agreements are not material.
Throughout 2018, the Company continued to have access to liquidity through the commercial paper market. Short-term borrowings and the current portion of long-term debt amounted to approximately $2.8 billion at the end of 2018, of which $2.6 billion is the current portion of the long term debt, and the remainder principally represents local borrowing by international subsidiaries.
Throughout 2017, the Company continued to have access to liquidity through the commercial paper market. Short-term borrowings and the current portion of long-term debt amounted to approximately $3.9 billion at the end of 2017, of which $2.3 billion was borrowed under the Commercial Paper Program, $1.5 billion is the current portion of the long-term debt, and the remainder principally represents local borrowing by international subsidiaries.
Aggregate maturities of long-term obligations commencing in 2019 are:
| (Dollars in Millions) | ||||||||||
| 2019 | 2020 | 2021 | 2022 | 2023 | After 2023 | |||||
| $2,636 | 1,098 | 1,796 | 2,134 | 1,553 | 21,103 |
| 8. | Income Taxes |
The provision for taxes on income consists of:
| (Dollars in Millions) | 2018 | 2017 | 2016 | |||||||
| Currently payable: | ||||||||||
| U.S. taxes | $ | 1,081 | 11,969 | 1,896 | ||||||
| U.S. taxes on international operations | 203 | 126 | 49 | |||||||
| International taxes | 2,434 | 1,872 | 1,659 | |||||||
| Total currently payable | 3,718 | 13,967 | 3,604 | |||||||
| Deferred: | ||||||||||
| U.S. taxes | (148 | ) | (1,956 | ) | 294 | |||||
| U.S. taxes on international operations | 1,358 | |||||||||
| International taxes | (2,226 | ) | 4,362 | (635 | ) | |||||
| Total deferred | (1,016 | ) | 2,406 | (341 | ) | |||||
| Provision for taxes on income | $ | 2,702 | 16,373 | 3,263 |
A comparison of income tax expense at the U.S. statutory rate of 21% in 2018 and 35% in 2017 and 2016, to the Company’s effective tax rate is as follows:
| 57 |
| (Dollars in Millions) | 2018 | 2017 | 2016 | |||||||
| U.S. | $ | 5,575 | 4,865 | 7,457 | ||||||
| International | 12,424 | 12,808 | 12,346 | |||||||
| Earnings before taxes on income: | $ | 17,999 | 17,673 | 19,803 | ||||||
| Tax rates: | ||||||||||
| U.S. statutory rate | 21.0 | % | 35.0 | 35.0 | ||||||
| International operations (1) | (3.7 | ) | (12.8 | ) | (17.2 | ) | ||||
| Research and orphan drug tax credits | (1.0 | ) | (0.4 | ) | (0.4 | ) | ||||
| U.S. state and local | 0.8 | 0.6 | (0.1 | ) | ||||||
| U.S. manufacturing deduction | — | (0.8 | ) | (0.6 | ) | |||||
| U.S. tax on international income (2) | 1.4 | 0.7 | 1.3 | |||||||
| Tax benefits on share-based compensation | (1.5 | ) | (2.1 | ) | (1.8 | ) | ||||
| U.S. tax benefit on asset/business disposals | 0.5 | (0.8 | ) | — | ||||||
| All other | (0.6 | ) | (0.1 | ) | 0.3 | |||||
| TCJA and related impacts (3) | (1.9 | ) | (3) | 73.3 | (4) | — | ||||
| Effective Rate | 15.0 | % | 92.6 | 16.5 |
(1) For all periods presented the Company has subsidiaries operating in Puerto Rico under various tax incentives. International operations reflects the impacts of operations in jurisdictions with statutory tax rates different than the U.S., particularly Ireland, Switzerland and Puerto Rico, which is a favorable impact on the effective tax rate as compared with the U.S. statutory rate. The 2017 amount also includes tax cost related to the revaluation of deferred tax balances related to the change in the Belgian statutory tax rate increasing the tax provision by approximately 3.4%.
(2) Includes the impact of the GILTI tax, the Foreign-Derived Intangible Income deduction and other foreign income that is taxable under the U.S. tax code.
(3) Represents impact of adjustments to the 2017 TCJA provisional tax charge. This also includes a net tax benefit from the reduction of a deferred tax liability related to foreign withholding taxes originally accrued as part of the provisional charge. This benefit reduced the Company’s effective tax rate by approximately 11%. Further description is included below.
(4) Includes U.S. state and local taxes provisionally recorded as part TCJA provisional charge which was approximately 0.6% of the total effective tax rate.
On December 22, 2017, the United States enacted into law new U.S. tax legislation, the Tax Cuts and Jobs Act (TCJA).
This law included provisions for a comprehensive overhaul of the corporate income tax code, including a reduction of the statutory corporate tax rate from 35% to 21%, effective on January 1, 2018. This legislation also eliminated or reduced certain corporate income tax deductions as well as introduced new provisions that taxed certain foreign income not previously taxed by the United States. The TCJA also included a provision for a tax on all previously undistributed earnings of U.S. companies located in foreign jurisdictions. Undistributed earnings in the form of cash and cash equivalents were taxed at a rate of 15.5% and all other earnings are taxed at a rate of 8.0%. This tax is payable over 8 years and will not accrue interest and these payments began in 2018 and will continue through 2025. The remaining balance at the end of the fiscal year 2018 was approximately $8.2 billion.
In December 2017, the SEC provided regulatory guidance for accounting of the impacts of the TCJA, referred to as SAB 118. Under the guidance in SAB 118, the income tax effects, which the accounting under ASC 740 is incomplete, are reported as a provisional amount based on a reasonable estimate. The reasonable estimate is subject to adjustment during a "measurement period", not to exceed one year, until the accounting is complete. The estimate is also subject to the finalization of management’s analysis related to certain matters, such as developing interpretations of the provision of the TCJA, changes to certain estimates and amounts related to the earnings and profits of certain subsidiaries and the filing of tax returns.
In the fourth quarter of 2017, the Company recorded a provisional tax cost of approximately $13.0 billion which consisted primarily of the following components:
| • | a $10.1 billion charge on previously undistributed foreign earnings as of December 31, 2017 |
| • | a $4.5 billion deferred tax liability for foreign local and withholding taxes, offset by a $1.1 billion deferred tax asset for U.S. foreign tax credits, for repatriation of substantially all those earnings |
| • | a $0.6 billion tax benefit relating to the remeasurement of U.S. deferred tax assets and liabilities and the impact of the TCJA on unrecognized tax benefits |
| • | a $0.1 billion charge for U.S. state and local taxes on the repatriation of these foreign earnings |
During the fourth quarter of 2018, the Company completed its full assessment and finalized the accounting for the impact of TCJA. The Company recorded net adjustments to the above components of the provisional charge of approximately $0.2 billion. These revisions were based on updated estimates and additional analysis by management as well as applying
| 58 |
interpretative guidance issued by the U.S. Department of Treasury to the facts and circumstances that existed as of the TCJA enactment date. This charge was primarily related to additional deferred tax liabilities for foreign local and withholding taxes for the remaining balance of undistributed foreign earnings as of December 31, 2017 that were not provided for in the provisional charge in the fourth quarter of 2017.
The TCJA also includes provisions for a tax on global intangible low-taxed income (GILTI). GILTI is described as the excess of a U.S. shareholder’s total net foreign income over a deemed return on tangible assets, as provided by the TCJA. In January 2018, the FASB issued guidance that allows companies to elect as an accounting policy whether to record the tax effects of GILTI in the period the tax liability is generated (i.e., “period cost”) or provide for deferred tax assets and liabilities related to basis differences that exist and are expected to effect the amount of GILTI inclusion in future years upon reversal (i.e., “deferred method”). Through the third fiscal quarter of 2018, the Company had provisionally elected to treat GILTI as a period expense. Upon further analysis of this new tax provision, the Company has elected to account for GILTI under the deferred method. The deferred tax amounts recorded are based on the evaluation of temporary differences that are expected to reverse as GILTI is incurred. As a result of this election, the Company recorded a deferred tax cost related to GILTI of approximately $1.4 billion in the fourth fiscal quarter of 2018 related to facts and circumstances that existed on the date of TCJA enactment.
As a result of the GILTI deferred tax charge and the other adjustments to the provisional amount, the Company recorded a total of $1.6 billion of adjustments to the 2017 provisional charge increasing the Company’s annual effective tax rate by approximately 9%.
During 2018, the Company reorganized the ownership structure of certain foreign subsidiaries which resulted in a reduction of certain foreign withholding taxes that it had recognized as part of the provisional TCJA tax charge in the fourth quarter of 2017. Following the completion of this restructuring in the fourth quarter 2018, and as a result of clarification by Swiss tax authorities regarding the applicability of withholding tax to repatriation of certain earnings, the Company reversed a deferred tax liability of $2.8 billion and a related deferred tax asset of $0.9 billion for U.S. foreign tax credits, for a net deferred tax benefit of $1.9 billion. As this restructuring occurred after the TCJA enactment date, the benefit is not considered an adjustment to the provisional amount recorded in 2017 under SAB118. This benefit with the SAB 118 adjustments has been reflected as “TCJA and related impacts” on the Company’s effective tax rate reconciliation.
As described in Note 1 to the Consolidated Financial Statements, in 2018 the Company adopted ASU 2016-16: Income Taxes: Intra-Entity Transfers of Assets Other Than Inventory. This standard requires entities to recognize deferred tax assets and liabilities related to transfer of assets, other than inventory, within the consolidated entity. At the beginning of fiscal 2018, the Company recorded a net adjustment to deferred tax assets of approximately $2.0 billion. In the fourth quarter of 2018, as a result of the election to record GILTI on the deferred method, the Company recorded a GILTI deferred tax liability of $1.7 billion related to the adoption provisions of ASU 2016-16 as an adjustment to retained earnings.
The 2018 effective tax rate decreased by 77.6% compared to 2017. The 2017 effective tax rate was primarily driven by the approximately $13 billion provisional tax charge recorded in the fourth quarter of 2017 and the impact of a Belgian statutory tax rate change which increased the 2017 effective rate by 3.4%. Additional drivers of the 2018 annual effective tax were:
| • | the reduction of the U.S. statutory corporate tax rate including the effects of tax elections which resulted in the acceleration of certain deductions into the 2017 tax return. The impact of these accelerated deductions decreased the annual effective tax rate by approximately 1.7% |
| • | the impact of the adjustments to the 2017 provisional TCJA charge, including both SAB 118 adjustments and the internal restructuring, decreased the effective tax rate by approximately 1.9% |
| • | GILTI tax which increased the annual effective tax rate by approximately 1.6%, which excludes the impact of the SAB 118 adjustment for the adoption of the deferred method for GILTI |
| • | tax benefits received from stock-based compensation during fiscal 2018 and 2017, reduced the effective tax rate by 1.5% and 2.0%, respectively |
| • | in the fourth quarter of 2018, the Company completed the divestiture of its LifeScan business (Note 20), which increased the Company annual effective tax rate by approximately 0.8% |
| • | more income in higher tax jurisdictions relative to lower tax jurisdictions as compared to 2017 |
The 2017 effective tax rate increased by 76.1% as compared to 2016, primarily driven by the enactment of the TCJA in the U.S. in December 2017. The enactment of the TCJA resulted in a provisional tax charge in the fourth quarter of 2017, of approximately $13.0 billion or approximately 73.3 percentage point increase to the effective tax rate.
The remainder of the increase in the tax rate for 2017 was related to the remeasurement of the Company’s deferred tax assets in Belgium, as a result of changes in the Belgian statutory corporate tax rate enacted in December 2017, offset by a tax benefit for the closure of the Company’s Animas insulin pump business.
| 59 |
Temporary differences and carryforwards for 2018 and 2017 were as follows:
| 2018 Deferred Tax | 2017 Deferred Tax | ||||||||||||
| (Dollars in Millions) | Asset | Liability | Asset | Liability | |||||||||
| Employee related obligations | $ | 2,398 | 2,259 | ||||||||||
| Stock based compensation | 639 | 507 | |||||||||||
| Depreciation & amortization | 1,784 | (9 | ) | ||||||||||
| Non-deductible intangibles | (5,967 | ) | (6,506 | ) | |||||||||
| International R&D capitalized for tax | 1,282 | 1,307 | |||||||||||
| Reserves & liabilities | 1,647 | 1,718 | |||||||||||
| Income reported for tax purposes | 1,104 | 1,316 | |||||||||||
| Net operating loss carryforward international | 786 | 762 | |||||||||||
| Undistributed foreign earnings | 693 | (2,240 | ) | 1,101 | (4,457 | ) | |||||||
| Global intangible low-taxed income | (2,971 | ) | |||||||||||
| Miscellaneous international | 603 | (93 | ) | 755 | (194 | ) | |||||||
| Miscellaneous U.S. | 469 | 177 | |||||||||||
| Total deferred income taxes | $ | 11,405 | (11,271 | ) | 9,902 | (11,166 | ) |
The Company has wholly-owned international subsidiaries that have cumulative net losses. The Company believes that it is more likely than not that these subsidiaries will generate future taxable income sufficient to utilize these deferred tax assets.
The following table summarizes the activity related to unrecognized tax benefits:
| (Dollars in Millions) | 2018 | 2017 | 2016 | |||||||
| Beginning of year | $ | 3,151 | 3,041 | 3,080 | ||||||
| Increases related to current year tax positions | 242 | 332 | 348 | |||||||
| Increases related to prior period tax positions | 145 | 232 | 11 | |||||||
| Decreases related to prior period tax positions | (137 | ) | (416 | ) | (1) | (338 | ) | |||
| Settlements | (40 | ) | (2 | ) | (37 | ) | ||||
| Lapse of statute of limitations | (35 | ) | (36 | ) | (23 | ) | ||||
| End of year | $ | 3,326 | 3,151 | 3,041 |
(1) In 2017, $347 million of this decrease is related to the TCJA
The unrecognized tax benefits of $3.3 billion at December 30, 2018, if recognized, would affect the Company’s annual effective tax rate. The Company conducts business and files tax returns in numerous countries and currently has tax audits in progress with a number of tax authorities. The IRS has completed its audit for the tax years through 2009 and is currently auditing the tax years 2010-2012. The Company currently expects completion of this audit during 2019. Final conclusion of the tax audit may result in an outcome that is different than the Company’s estimates and may result in a material impact on the Company’s current and future operating results or cash flows in the period that the audit is concluded. In other major jurisdictions where the Company conducts business, the years that remain open to tax audit go back to the year 2006. The Company believes it is possible that audits may be completed by tax authorities in some jurisdictions over the next twelve months. However, the Company is not able to provide a reasonably reliable estimate of the timing of any other future tax payments relating to uncertain tax positions.
The Company classifies liabilities for unrecognized tax benefits and related interest and penalties as long-term liabilities. Interest expense and penalties related to unrecognized tax benefits are classified as income tax expense. The Company recognized after tax interest expense of $53 million, $60 million and $7 million in 2018, 2017 and 2016, respectively. The total amount of accrued interest was $503 million and $436 million in 2018 and 2017, respectively.
| 60 |
| 9. | Employee Related Obligations |
At the end of 2018 and 2017, employee related obligations recorded on the Consolidated Balance Sheets were:
| (Dollars in Millions) | 2018 | 2017 | |||||
| Pension benefits | $ | 5,327 | 5,343 | ||||
| Postretirement benefits | 2,283 | 2,331 | |||||
| Postemployment benefits | 2,330 | 2,250 | |||||
| Deferred compensation | 410 | 475 | |||||
| Total employee obligations | 10,350 | 10,399 | |||||
| Less current benefits payable | 399 | 325 | |||||
| Employee related obligations — non-current | $ | 9,951 | 10,074 |
Prepaid employee related obligations of $475 million and $526 million for 2018 and 2017, respectively, are included in Other assets on the Consolidated Balance Sheets.
| 10. | Pensions and Other Benefit Plans |
The Company sponsors various retirement and pension plans, including defined benefit, defined contribution and termination indemnity plans, which cover most employees worldwide. The Company also provides post-retirement benefits, primarily health care, to all eligible U.S. retired employees and their dependents.
Many international employees are covered by government-sponsored programs and the cost to the Company is not significant.
Retirement plan benefits for employees hired before January 1, 2015 are primarily based on the employee’s compensation during the last three to five years before retirement and the number of years of service. In 2014, the Company announced that the U.S. Defined Benefit Plan was amended to adopt a new benefit formula, effective for employees hired on or after January 1, 2015. The benefits are calculated using a new formula based on employee compensation over total years of service.
International subsidiaries have plans under which funds are deposited with trustees, annuities are purchased under group contracts, or reserves are provided.
The Company does not typically fund retiree health care benefits in advance, but may do so at its discretion. The Company also has the right to modify these plans in the future.
In 2018 and 2017 the Company used December 31, 2018 and December 31, 2017, respectively, as the measurement date for all U.S. and international retirement and other benefit plans.
Net periodic benefit costs for the Company’s defined benefit retirement plans and other benefit plans for 2018, 2017 and 2016 include the following components:
| Retirement Plans | Other Benefit Plans | ||||||||||||||||||
| (Dollars in Millions) | 2018 | 2017 | 2016 | 2018 | 2017 | 2016 | |||||||||||||
| Service cost | $ | 1,283 | 1,080 | 949 | 269 | 247 | 224 | ||||||||||||
| Interest cost | 996 | 927 | 927 | 148 | 159 | 158 | |||||||||||||
| Expected return on plan assets | (2,212 | ) | (2,041 | ) | (1,962 | ) | (7 | ) | (6 | ) | (6 | ) | |||||||
| Amortization of prior service cost (credit) | 3 | 2 | 1 | (31 | ) | (30 | ) | (34 | ) | ||||||||||
| Recognized actuarial losses | 852 | 609 | 496 | 123 | 138 | 135 | |||||||||||||
| Curtailments and settlements | 1 | 17 | 11 | — | — | — | |||||||||||||
| Net periodic benefit cost | $ | 923 | 594 | 422 | 502 | 508 | 477 |
In 2018, as per the adoption of ASU 2017-07, the service cost component of net periodic benefit cost was presented in the same line items on the Consolidated Statement of Earnings where other employee compensation costs are reported. All other components of net periodic benefit cost are presented as part of Other (income) expense, net on the Consolidated Statement of Earnings.
| 61 |
Amounts expected to be recognized in net periodic benefit cost in the coming year for the Company’s defined benefit retirement plans and other post-retirement plans:
| (Dollars in Millions) | |||
| Amortization of net transition obligation | $ | — | |
| Amortization of net actuarial losses | 656 | ||
| Amortization of prior service credit | 27 |
Unrecognized gains and losses for the U.S. pension plans are amortized over the average remaining future service for each plan. For plans with no active employees, they are amortized over the average life expectancy. The amortization of gains and losses for the other U.S. benefit plans is determined by using a 10% corridor of the greater of the market value of assets or the accumulated postretirement benefit obligation. Total unamortized gains and losses in excess of the corridor are amortized over the average remaining future service.
Prior service costs/benefits for the U.S. pension plans are amortized over the average remaining future service of plan participants at the time of the plan amendment. Prior service cost/benefit for the other U.S. benefit plans is amortized over the average remaining service to full eligibility age of plan participants at the time of the plan amendment.
The following table represents the weighted-average actuarial assumptions:
| Retirement Plans | Other Benefit Plans | ||||||||||||
| Worldwide Benefit Plans | 2018 | 2017 | 2016 | 2018 | 2017 | 2016 | |||||||
| Net Periodic Benefit Cost | |||||||||||||
| Service cost discount rate | 3.20 | % | 3.59 | 3.98 | 3.85 | 4.63 | 4.77 | ||||||
| Interest cost discount rate | 3.60 | % | 3.98 | 4.24 | 3.62 | 3.94 | 4.10 | ||||||
| Rate of increase in compensation levels | 3.98 | % | 4.01 | 4.02 | 4.29 | 4.31 | 4.32 | ||||||
| Expected long-term rate of return on plan assets | 8.46 | % | 8.43 | 8.55 | |||||||||
| Benefit Obligation | |||||||||||||
| Discount rate | 3.76 | % | 3.30 | 3.78 | 4.40 | 3.78 | 4.42 | ||||||
| Rate of increase in compensation levels | 3.97 | % | 3.99 | 4.02 | 4.29 | 4.30 | 4.29 |
The Company’s discount rates are determined by considering current yield curves representing high quality, long-term fixed income instruments. The resulting discount rates are consistent with the duration of plan liabilities. In the fiscal year 2016, the Company changed its methodology in determining service and interest cost from the single weighted average discount rate approach to duration specific spot rates along that yield curve to the plans’ liability cash flows, which management has concluded is a more precise estimate. Prior to this change in methodology, the Company measured service and interest costs utilizing a single weighted-average discount rate derived from the yield curve used to measure the plan obligations. The Company has accounted for this change as a change in accounting estimate and, accordingly, has accounted for it on a prospective basis. This change does not impact the benefit obligation and did not have a material impact to the 2016 full year results.
The expected rates of return on plan asset assumptions represent the Company's assessment of long-term returns on diversified investment portfolios globally. The assessment is determined using projections from external financial sources, long-term historical averages, actual returns by asset class and the various asset class allocations by market.
| 62 |
The following table displays the assumed health care cost trend rates, for all individuals:
| Health Care Plans | 2018 | 2017 | ||||
| Health care cost trend rate assumed for next year | 6.12 | % | 6.33 | % | ||
| Rate to which the cost trend rate is assumed to decline (ultimate trend) | 4.55 | % | 4.55 | % | ||
| Year the rate reaches the ultimate trend rate | 2038 | 2038 |
A one-percentage-point change in assumed health care cost trend rates would have the following effect:
| One-Percentage- | One-Percentage- | ||||||
| (Dollars in Millions) | Point Increase | Point Decrease | |||||
| Health Care Plans | |||||||
| Total interest and service cost | $ | 28 | (22 | ) | |||
| Post-retirement benefit obligation | $ | 340 | (280 | ) |
| 63 |
The following table sets forth information related to the benefit obligation and the fair value of plan assets at year-end 2018 and 2017 for the Company’s defined benefit retirement plans and other post-retirement plans:
| Retirement Plans | Other Benefit Plans | ||||||||||||
| (Dollars in Millions) | 2018 | 2017 | 2018 | 2017 | |||||||||
| Change in Benefit Obligation | |||||||||||||
| Projected benefit obligation — beginning of year | $ | 33,221 | 28,116 | 4,582 | 4,605 | ||||||||
| Service cost | 1,283 | 1,080 | 269 | 247 | |||||||||
| Interest cost | 996 | 927 | 148 | 159 | |||||||||
| Plan participant contributions | 66 | 60 | — | — | |||||||||
| Amendments | 26 | (7 | ) | — | (17 | ) | |||||||
| Actuarial (gains) losses | (2,326 | ) | 2,996 | (119 | ) | (166 | ) | ||||||
| Divestitures & acquisitions | (29 | ) | 201 | — | 88 | ||||||||
| Curtailments, settlements & restructuring | (21 | ) | (35 | ) | — | 2 | |||||||
| Benefits paid from plan | (1,018 | ) | (1,050 | ) | (383 | ) | (351 | ) | |||||
| Effect of exchange rates | (528 | ) | 933 | (17 | ) | 15 | |||||||
| Projected benefit obligation — end of year | $ | 31,670 | 33,221 | 4,480 | 4,582 | ||||||||
| Change in Plan Assets | |||||||||||||
| Plan assets at fair value — beginning of year | $ | 28,404 | 23,633 | 281 | 75 | ||||||||
| Actual return on plan assets | (1,269 | ) | 4,274 | — | 12 | ||||||||
| Company contributions | 1,140 | 664 | 282 | 545 | |||||||||
| Plan participant contributions | 66 | 60 | — | — | |||||||||
| Settlements | (13 | ) | (32 | ) | — | — | |||||||
| Divestitures & acquisitions | (17 | ) | 173 | — | — | ||||||||
| Benefits paid from plan assets | (1,018 | ) | (1,050 | ) | (383 | ) | (351 | ) | |||||
| Effect of exchange rates | (475 | ) | 682 | — | — | ||||||||
| Plan assets at fair value — end of year | $ | 26,818 | 28,404 | 180 | 281 | ||||||||
| Funded status — end of year | $ | (4,852 | ) | (4,817 | ) | (4,300 | ) | (4,301 | ) | ||||
| Amounts Recognized in the Company’s Balance Sheet consist of the following: | |||||||||||||
| Non-current assets | $ | 475 | 526 | — | — | ||||||||
| Current liabilities | (98 | ) | (92 | ) | (281 | ) | (228 | ) | |||||
| Non-current liabilities | (5,229 | ) | (5,251 | ) | (4,019 | ) | (4,073 | ) | |||||
| Total recognized in the consolidated balance sheet — end of year | $ | (4,852 | ) | (4,817 | ) | (4,300 | ) | (4,301 | ) | ||||
| Amounts Recognized in Accumulated Other Comprehensive Income consist of the following: | |||||||||||||
| Net actuarial loss | $ | 8,323 | 8,140 | 1,263 | 1,500 | ||||||||
| Prior service cost (credit) | 2 | (25 | ) | (106 | ) | (137 | ) | ||||||
| Unrecognized net transition obligation | — | — | — | — | |||||||||
| Total before tax effects | $ | 8,325 | 8,115 | 1,157 | 1,363 | ||||||||
| Accumulated Benefit Obligations — end of year | $ | 28,533 | 29,793 | ||||||||||
| 64 |
| Retirement Plans | Other Benefit Plans | ||||||||||||
| (Dollars in Millions) | 2018 | 2017 | 2018 | 2017 | |||||||||
| Amounts Recognized in Net Periodic Benefit Cost and Other Comprehensive Income | |||||||||||||
| Net periodic benefit cost | $ | 923 | 594 | 502 | 508 | ||||||||
| Net actuarial (gain) loss | 1,153 | 740 | (111 | ) | (169 | ) | |||||||
| Amortization of net actuarial loss | (852 | ) | (609 | ) | (123 | ) | (138 | ) | |||||
| Prior service cost (credit) | 26 | (7 | ) | — | (17 | ) | |||||||
| Amortization of prior service (cost) credit | (3 | ) | (2 | ) | 31 | 30 | |||||||
| Effect of exchange rates | (114 | ) | 256 | (3 | ) | 3 | |||||||
| Total loss/(income) recognized in other comprehensive income, before tax | $ | 210 | 378 | (206 | ) | (291 | ) | ||||||
| Total recognized in net periodic benefit cost and other comprehensive income | $ | 1,133 | 972 | 296 | 217 |
The Company plans to continue to fund its U.S. Qualified Plans to comply with the Pension Protection Act of 2006. International Plans are funded in accordance with local regulations. Additional discretionary contributions are made when deemed appropriate to meet the long-term obligations of the plans. For certain plans, funding is not a common practice, as funding provides no economic benefit. Consequently, the Company has several pension plans that are not funded.
In 2018, the Company contributed $679 million and $461 million to its U.S. and international pension plans, respectively.
The following table displays the funded status of the Company's U.S. Qualified & Non-Qualified pension plans and international funded and unfunded pension plans at December 31, 2018 and December 31, 2017, respectively:
| U.S. Plans | International Plans | ||||||||||||||||
| Qualified Plans | Non-Qualified Plans | Funded Plans | Unfunded Plans | ||||||||||||||
| (Dollars in Millions) | 2018 | 2017 | 2018 | 2017 | 2018 | 2017 | 2018 | 2017 | |||||||||
| Plan Assets | $ | 17,725 | 18,681 | — | — | 9,093 | 9,723 | — | — | ||||||||
| Projected Benefit Obligation | 18,609 | 19,652 | 2,176 | 2,257 | 10,467 | 10,863 | 418 | 449 | |||||||||
| Accumulated Benefit Obligation | 16,851 | 17,654 | 1,793 | 1,849 | 9,510 | 9,893 | 379 | 397 | |||||||||
| Over (Under) Funded Status | |||||||||||||||||
| Projected Benefit Obligation | $ | (884 | ) | (971 | ) | (2,176 | ) | (2,257 | ) | (1,374 | ) | (1,140 | ) | (418 | ) | (449 | ) |
| Accumulated Benefit Obligation | 874 | 1,027 | (1,793 | ) | (1,849 | ) | (417 | ) | (170 | ) | (379 | ) | (397 | ) |
Plans with accumulated benefit obligations in excess of plan assets have an accumulated benefit obligation, projected benefit obligation and plan assets of $7.5 billion, $8.8 billion and $4.3 billion, respectively, at the end of 2018, and $3.8 billion, $4.6 billion and $0.7 billion, respectively, at the end of 2017.
The following table displays the projected future benefit payments from the Company’s retirement and other benefit plans:
| (Dollars in Millions) | 2019 | 2020 | 2021 | 2022 | 2023 | 2024-2028 | |||||||||||||
| Projected future benefit payments | |||||||||||||||||||
| Retirement plans | $ | 1,062 | 1,104 | 1,182 | 1,257 | 1,332 | 7,679 | ||||||||||||
| Other benefit plans | $ | 375 | 397 | 411 | 428 | 413 | 2,273 |
The following table displays the projected future minimum contributions to the unfunded retirement plans. These amounts do not include any discretionary contributions that the Company may elect to make in the future.
| (Dollars in Millions) | 2019 | 2020 | 2021 | 2022 | 2023 | 2024-2028 | |||||||||||||
| Projected future contributions | $ | 92 | 95 | 101 | 108 | 115 | 697 |
| 65 |
Each pension plan is overseen by a local committee or board that is responsible for the overall administration and investment of the pension plans. In determining investment policies, strategies and goals, each committee or board considers factors including, local pension rules and regulations; local tax regulations; availability of investment vehicles (separate accounts, commingled accounts, insurance funds, etc.); funded status of the plans; ratio of actives to retirees; duration of liabilities; and other relevant factors including: diversification, liquidity of local markets and liquidity of base currency. A majority of the Company’s pension funds are open to new entrants and are expected to be on-going plans. Permitted investments are primarily liquid and/or listed, with little reliance on illiquid and non-traditional investments such as hedge funds.
The Company’s retirement plan asset allocation at the end of 2018 and 2017 and target allocations for 2019 are as follows:
| Percent of Plan Assets | Target Allocation | ||||||||
| 2018 | 2017 | 2019 | |||||||
| Worldwide Retirement Plans | |||||||||
| Equity securities | 71 | % | 76 | % | 70 | % | |||
| Debt securities | 29 | 24 | 30 | ||||||
| Total plan assets | 100 | % | 100 | % | 100 | % |
Determination of Fair Value of Plan Assets
The Plan has an established and well-documented process for determining fair values. Fair value is based upon quoted market prices, where available. If listed prices or quotes are not available, fair value is based upon models that primarily use, as inputs, market-based or independently sourced market parameters, including yield curves, interest rates, volatilities, equity or debt prices, foreign exchange rates and credit curves.
While the Plan believes its valuation methods are appropriate and consistent with other market participants, the use of different methodologies or assumptions to determine the fair value of certain financial instruments could result in a different estimate of fair value at the reporting date.
Valuation Hierarchy
The authoritative literature establishes a three-level hierarchy to prioritize the inputs used in measuring fair value. The levels within the hierarchy are described in the table below with Level 1 having the highest priority and Level 3 having the lowest.
A financial instrument’s categorization within the valuation hierarchy is based upon the lowest level of input that is significant to the fair value measurement.
Following is a description of the valuation methodologies used for the investments measured at fair value.
| • | Short-term investment funds — Cash and quoted short-term instruments are valued at the closing price or the amount held on deposit by the custodian bank. Other investments are through investment vehicles valued using the Net Asset Value (NAV) provided by the administrator of the fund. The NAV is based on the value of the underlying assets owned by the fund, minus its liabilities, and then divided by the number of shares outstanding. The NAV is a quoted price in a market that is not active and classified as Level 2. |
| • | Government and agency securities — A limited number of these investments are valued at the closing price reported on the major market on which the individual securities are traded. Where quoted prices are available in an active market, the investments are classified within Level 1 of the valuation hierarchy. If quoted market prices are not available for the specific security, then fair values are estimated by using pricing models, quoted prices of securities with similar characteristics or discounted cash flows. When quoted market prices for a security are not available in an active market, they are classified as Level 2. |
| • | Debt instruments — A limited number of these investments are valued at the closing price reported on the major market on which the individual securities are traded. Where quoted prices are available in an active market, the investments are classified as Level 1. If quoted market prices are not available for the specific security, then fair values are estimated by using pricing models, quoted prices of securities with similar characteristics or discounted cash flows and are classified as Level 2. Level 3 debt instruments are priced based on unobservable inputs. |
| • | Equity securities — Equity securities are valued at the closing price reported on the major market on which the individual securities are traded. Substantially all common stock is classified within Level 1 of the valuation hierarchy. |
| • | Commingled funds — These investment vehicles are valued using the NAV provided by the fund administrator. The NAV is based on the value of the underlying assets owned by the fund, minus its liabilities, and then divided by the number of shares outstanding. Assets in the Level 2 category have a quoted market price. |
| 66 |
| • | Insurance contracts — The instruments are issued by insurance companies. The fair value is based on negotiated value and the underlying investments held in separate account portfolios as well as considering the credit worthiness of the issuer. The underlying investments are government, asset-backed and fixed income securities. In general, insurance contracts are classified as Level 3 as there are no quoted prices nor other observable inputs for pricing. |
| • | Other assets — Other assets are represented primarily by limited partnerships and real estate investments, as well as commercial loans and commercial mortgages that are not classified as corporate debt. Other assets that are exchange listed and actively traded are classified as Level 1, while inactively traded assets are classified as Level 2. |
The following table sets forth the Retirement Plans' investments measured at fair value as of December 31, 2018 and December 31, 2017:
| Quoted Prices in Active Markets for Identical Assets | Significant Other Observable Inputs | Significant Unobservable Inputs(a) | Investments Measured at Net Asset Value | ||||||||||||||||||||||||||||
| (Level 1) | (Level 2) | (Level 3) | Total Assets | ||||||||||||||||||||||||||||
| (Dollars in Millions) | 2018 | 2017 | 2018 | 2017 | 2018 | 2017 | 2018 | 2017 | 2018 | 2017 | |||||||||||||||||||||
| Short-term investment funds | $ | 122 | 429 | 529 | 427 | — | — | — | — | 651 | 856 | ||||||||||||||||||||
| Government and agency securities | — | — | 3,595 | 3,094 | — | — | — | — | 3,595 | 3,094 | |||||||||||||||||||||
| Debt instruments | — | — | 3,105 | 2,013 | — | — | — | — | 3,105 | 2,013 | |||||||||||||||||||||
| Equity securities | 11,298 | 13,848 | 4 | — | — | — | — | — | 11,302 | 13,848 | |||||||||||||||||||||
| Commingled funds | — | — | 2,304 | 1,780 | 133 | 57 | 5,201 | 6,158 | 7,638 | 7,995 | |||||||||||||||||||||
| Insurance contracts | — | — | — | — | 193 | 199 | — | — | 193 | 199 | |||||||||||||||||||||
| Other assets | — | — | 33 | 121 | — | — | 301 | 278 | 334 | 399 | |||||||||||||||||||||
| Investments at fair value | $ | 11,420 | 14,277 | 9,570 | 7,435 | 326 | 256 | 5,502 | 6,436 | 26,818 | 28,404 |
(a) The activity for the Level 3 assets is not significant for all years presented.
The Company's Other Benefit Plans are unfunded except for U.S. commingled funds (Level 2) of $72 million and $81 million and U.S. short-term investment funds (Level 2) of $108 million and $200 million at December 31, 2018 and December 31, 2017, respectively.
The fair value of Johnson & Johnson Common Stock directly held in plan assets was $876 million (3.3% of total plan assets) at December 31, 2018 and $938 million (3.3% of total plan assets) at December 31, 2017.
| 11. | Savings Plan |
The Company has voluntary 401(k) savings plans designed to enhance the existing retirement programs covering eligible employees. The Company matches a percentage of each employee’s contributions consistent with the provisions of the plan for which he/she is eligible. Total Company matching contributions to the plans were $242 million, $214 million and $191 million in 2018, 2017 and 2016, respectively.
| 67 |
| 12. | Capital and Treasury Stock |
Changes in treasury stock were:
| Treasury Stock | |||||||
| (Amounts in Millions Except Treasury Stock Shares in Thousands) | Shares | Amount | |||||
| Balance at January 3, 2016 | 364,681 | $ | 22,684 | ||||
| Employee compensation and stock option plans | (30,839 | ) | (3,311 | ) | |||
| Repurchase of common stock | 79,490 | 8,979 | |||||
| Balance at January 1, 2017 | 413,332 | 28,352 | |||||
| Employee compensation and stock option plans | (25,508 | ) | (3,156 | ) | |||
| Repurchase of common stock | 49,494 | 6,358 | |||||
| Balance at December 31, 2017 | 437,318 | 31,554 | |||||
| Employee compensation and stock option plans | (22,082 | ) | (3,060 | ) | |||
| Repurchase of common stock | 42,283 | 5,868 | |||||
| Balance at December 30, 2018 | 457,519 | $ | 34,362 |
Aggregate shares of common stock issued were approximately 3,119,843,000 shares at the end of 2018, 2017 and 2016.
Cash dividends paid were $3.54 per share in 2018, compared with dividends of $3.32 per share in 2017, and $3.15 per share in 2016.
On December 17, 2018, the Company announced that its Board of Directors approved a share repurchase program, authorizing the Company to purchase up to $5.0 billion of the Company's shares of common stock. The repurchase program has no time limit and may be suspended for periods or discontinued at any time. Any shares acquired will be available for general corporate purposes. The Company intends to finance the share repurchase program through available cash. As of December 30, 2018, $0.9 billion has been repurchased under the program.
On October 13, 2015, the Company announced that its Board of Directors approved a share repurchase program, authorizing the Company to purchase up to $10.0 billion of the Company's shares of common stock. This share repurchase program was completed as of July 2, 2017.
| 13. | Accumulated Other Comprehensive Income (Loss) |
Components of other comprehensive income (loss) consist of the following:
| (Dollars in Millions) | Foreign Currency Translation | Gain/(Loss) On Securities | Employee Benefit Plans | Gain/ (Loss) On Derivatives & Hedges | Total Accumulated Other Comprehensive Income (Loss) | |||||||||||
| January 3, 2016 | $ | (8,435 | ) | 604 | (5,298 | ) | (36 | ) | (13,165 | ) | ||||||
| Net 2016 changes | (612 | ) | (193 | ) | (682 | ) | (249 | ) | (1,736 | ) | ||||||
| January 1, 2017 | (9,047 | ) | 411 | (5,980 | ) | (285 | ) | (14,901 | ) | |||||||
| Net 2017 changes | 1,696 | (179 | ) | (170 | ) | 355 | 1,702 | |||||||||
| December 31, 2017 | (7,351 | ) | 232 | (6,150 | ) | 70 | (13,199 | ) | ||||||||
| Cumulative adjustment to retained earnings | (232 | ) | (1) | (232 | ) | |||||||||||
| Net 2018 changes | (1,518 | ) | — | (8 | ) | (265 | ) | (1,791 | ) | |||||||
| December 30, 2018 | $ | (8,869 | ) | — | (6,158 | ) | (195 | ) | (15,222 | ) |
(1) See Note 1 to Consolidated Financial Statements for additional details on the adoption of ASU 2016-01
Amounts in accumulated other comprehensive income are presented net of the related tax impact. Foreign currency translation is not adjusted for income taxes where it relates to permanent investments in international subsidiaries. For additional details on comprehensive income see the Consolidated Statements of Comprehensive Income.
Details on reclassifications out of Accumulated Other Comprehensive Income:
Gain/(Loss) On Securities - reclassifications released to Other (income) expense, net.
| 68 |
Employee Benefit Plans - reclassifications are included in net periodic benefit cost. See Note 10 for additional details.
Gain/(Loss) On Derivatives & Hedges - reclassifications to earnings are recorded in the same account as the hedged transaction. See Note 6 for additional details.
| 14. | International Currency Translation |
For translation of its subsidiaries operating in non-U.S. Dollar currencies, the Company has determined that the local currencies of its international subsidiaries are the functional currencies except those in highly inflationary economies, which are defined as those which have had compound cumulative rates of inflation of 100% or more during the past three years, or where a substantial portion of its cash flows are not in the local currency. Beginning in the fiscal third quarter of 2018, the Company accounted for operations in Argentina as highly inflationary. For the majority of the Company's subsidiaries the local currency is the functional currency.
In consolidating international subsidiaries, balance sheet currency effects are recorded as a component of accumulated other comprehensive income. This equity account includes the results of translating certain balance sheet assets and liabilities at current exchange rates and some accounts at historical rates, except for those located in highly inflationary economies. The translation of balance sheet accounts for highly inflationary economies are reflected in the operating results.
A rollforward of the changes during 2018, 2017 and 2016 for foreign currency translation adjustments is included in Note 13.
Net currency transaction gains and losses included in Other (income) expense were losses of $265 million, $216 million and $289 million in 2018, 2017 and 2016, respectively.
| 15. | Earnings Per Share |
The following is a reconciliation of basic net earnings per share to diluted net earnings per share for the fiscal years ended December 30, 2018, December 31, 2017 and January 1, 2017:
| (In Millions Except Per Share Amounts) | 2018 | 2017 | 2016 | |||||||
| Basic net earnings per share | $ | 5.70 | 0.48 | 6.04 | ||||||
| Average shares outstanding — basic | 2,681.5 | 2,692.0 | 2,737.3 | |||||||
| Potential shares exercisable under stock option plans | 139.0 | 139.7 | 142.4 | |||||||
| Less: shares repurchased under treasury stock method | (92.5 | ) | (87.3 | ) | (92.1 | ) | ||||
| Convertible debt shares | 0.7 | 0.9 | 1.3 | |||||||
| Adjusted average shares outstanding — diluted | 2,728.7 | 2,745.3 | 2,788.9 | |||||||
| Diluted net earnings per share | $ | 5.61 | 0.47 | 5.93 |
The diluted net earnings per share calculation included the dilutive effect of convertible debt that is offset by the related reduction in interest expense of $1 million after-tax for 2018 and 2017, and $2 million for 2016.
The diluted net earnings per share calculation for 2018, 2017 and 2016 included all shares related to stock options, as the exercise price of all options was less than the average market value of the Company's stock.
| 16. | Rental Expense and Lease Commitments |
Rentals of space, vehicles, manufacturing equipment and office and data processing equipment under operating leases were approximately $332 million, $372 million and $330 million in 2018, 2017 and 2016, respectively.
The approximate minimum rental payments required under operating leases that have initial or remaining non-cancelable lease terms in excess of one year at December 30, 2018 are:
(Dollars in Millions)
| 2019 | 2020 | 2021 | 2022 | 2023 | After 2023 | Total | ||||||
| $223 | 188 | 154 | 116 | 76 | 139 | 896 |
Commitments under capital leases are not significant.
| 69 |
| 17. | Common Stock, Stock Option Plans and Stock Compensation Agreements |
At December 30, 2018, the Company had 2 stock-based compensation plans. The shares outstanding are for contracts under the Company's 2005 Long-Term Incentive Plan and the 2012 Long-Term Incentive Plan. The 2005 Long-Term Incentive Plan expired April 26, 2012. All options and restricted shares granted subsequent to that date were under the 2012 Long-Term Incentive Plan. Under the 2012 Long-Term Incentive Plan, the Company may issue up to 650 million shares of common stock, plus any shares canceled, expired, forfeited, or not issued from the 2005 Long-Term Incentive Plan subsequent to April 26, 2012. Shares available for future grants under the 2012 Long-Term Incentive Plan were 351 million at the end of 2018.
The compensation cost that has been charged against income for these plans was $978 million, $962 million and $878 million for 2018, 2017 and 2016, respectively. The total income tax benefit recognized in the income statement for share-based compensation costs was $192 million, $275 million and $256 million for 2018, 2017 and 2016, respectively. An additional tax benefit of $353 million was recognized in 2016 due to the adoption of a new accounting standard for the reporting of additional tax benefits on share-based compensation. The total unrecognized compensation cost was $827 million, $798 million and $749 million for 2018, 2017 and 2016, respectively. The weighted average period for this cost to be recognized was 1.73 years, 1.76 years and 1.09 years for 2018, 2017, and 2016, respectively. Share-based compensation costs capitalized as part of inventory were insignificant in all periods.
The Company settles employee benefit equity issuances with treasury shares. Treasury shares are replenished throughout the year for the number of shares used to settle employee benefit equity issuances.
Stock Options
Stock options expire 10 years from the date of grant and vest over service periods that range from 6 months to 4 years. All options are granted at the average of the high and low prices of the Company’s Common Stock on the New York Stock Exchange on the date of grant.
The fair value of each option award was estimated on the date of grant using the Black-Scholes option valuation model that uses the assumptions noted in the following table. For 2018, 2017 and 2016 grants, expected volatility represents a blended rate of 10-year weekly historical overall volatility rate, and a 5-week average implied volatility rate based on at-the-money traded Johnson & Johnson options with a life of 2 years. For all grants, historical data is used to determine the expected life of the option. The risk-free rate was based on the U.S. Treasury yield curve in effect at the time of grant.
The average fair value of options granted was $17.98, $13.38 and $10.01, in 2018, 2017 and 2016, respectively. The fair value was estimated based on the weighted average assumptions of:
| 2018 | 2017 | 2016 | ||||||
| Risk-free rate | 2.77 | % | 2.25 | % | 1.51 | % | ||
| Expected volatility | 15.77 | % | 15.30 | % | 15.76 | % | ||
| Expected life (in years) | 7.0 | 7.0 | 7.0 | |||||
| Expected dividend yield | 2.70 | % | 2.90 | % | 3.10 | % |
A summary of option activity under the Plan as of December 30, 2018, December 31, 2017 and January 1, 2017, and changes during the years ending on those dates is presented below:
| 70 |
| (Shares in Thousands) | Outstanding Shares | Weighted Average Exercise Price | Aggregate Intrinsic Value (Dollars in Millions) | ||||||||
| Shares at January 3, 2016 | 116,517 | $ | 76.41 | $ | 3,065 | ||||||
| Options granted | 22,491 | 101.87 | |||||||||
| Options exercised | (22,547 | ) | 65.66 | ||||||||
| Options canceled/forfeited | (3,006 | ) | 92.83 | ||||||||
| Shares at January 1, 2017 | 113,455 | 83.16 | 3,636 | ||||||||
| Options granted | 19,287 | 115.67 | |||||||||
| Options exercised | (18,975 | ) | 70.87 | ||||||||
| Options canceled/forfeited | (2,461 | ) | 101.40 | ||||||||
| Shares at December 31, 2017 | 111,306 | 90.48 | 5,480 | ||||||||
| Options granted | 17,115 | 129.51 | |||||||||
| Options exercised | (16,228 | ) | 75.44 | ||||||||
| Options canceled/forfeited | (2,541 | ) | 112.90 | ||||||||
| Shares at December 30, 2018 | 109,652 | $ | 98.29 | $ | 3,214 |
The total intrinsic value of options exercised was $1,028 million, $1,060 million and $980 million in 2018, 2017 and 2016, respectively.
The following table summarizes stock options outstanding and exercisable at December 30, 2018:
| (Shares in Thousands) | Outstanding | Exercisable | ||||||||||
| Exercise Price Range | Options | Average Life(1) | Average Exercise Price | Options | Average Exercise Price | |||||||
| $52.13-$65.62 | 13,466 | 1.8 | $62.67 | 13,466 | $62.67 | |||||||
| $66.07-$72.54 | 12,710 | 4.0 | $72.53 | 12,710 | $72.53 | |||||||
| $90.44-$100.48 | 29,162 | 5.6 | $95.34 | 28,537 | $95.23 | |||||||
| $101.87-$115.67 | 37,877 | 7.6 | $108.33 | 111 | $108.04 | |||||||
| $115.68-$129.51 | 16,437 | 9.1 | $129.51 | 38 | $129.51 | |||||||
| 109,652 | 6.2 | $98.29 | 54,862 | $82.03 |
(1) Average contractual life remaining in years.
Stock options outstanding at December 31, 2017 and January 1, 2017 were 111,306 and an average life of 6.3 years and 113,455 and an average life of 6.2 years, respectively. Stock options exercisable at December 31, 2017 and January 1, 2017 were 52,421 at an average price of $73.61 and 50,414 at an average price of $65.77, respectively.
Restricted Share Units and Performance Share Units
The Company grants restricted share units which vest over service periods that range from 6 months to 3 years. The Company also grants performance share units, which are paid in shares of Johnson & Johnson Common Stock after the end of a three-year performance period. Whether any performance share units vest, and the amount that does vest, is tied to the completion of service periods that range from 6 months to 3 years and the achievement, over a three-year period, of three equally-weighted goals that directly align with or help drive long-term total shareholder return: operational sales, adjusted operational earnings per share, and relative total shareholder return. The number of shares actually earned at the end of the three-year period will vary, based only on actual performance, from 0% to 200% of the target number of performance share units granted. In the fourth quarter of 2017, the Company modified the restricted share units that are scheduled to vest between January 1, 2018 and March 15, 2018. This modification guaranteed a minimum aggregate value, below the market value of the total expected payout amount, for all awards expected to vest during this period. The amount that was committed was not material to the Company’s overall financial position.
| 71 |
A summary of the restricted share units and performance share units activity under the Plans as of December 30, 2018 is presented below:
| (Shares in Thousands) | Outstanding Restricted Share Units | Outstanding Performance Share Units | ||||
| Shares at December 31, 2017 | 20,161 | 2,625 | ||||
| Granted | 6,074 | 1,142 | ||||
| Issued | (6,684 | ) | (1,151 | ) | ||
| Canceled/forfeited/adjusted | (1,091 | ) | (122 | ) | ||
| Shares at December 30, 2018 | 18,460 | 2,494 |
The average fair value of the restricted share units granted was $119.67, $107.69 and $92.45 in 2018, 2017 and 2016, respectively, using the fair market value at the date of grant. The fair value of restricted share units was discounted for dividends, which are not paid on the restricted share units during the vesting period. The fair value of restricted share units issued was $613.7 million, $596.5 million and $587.7 million in 2018, 2017 and 2016, respectively.
The weighted average fair value of the performance share units granted was $120.64, $114.13 and $105.30 in 2018, 2017 and 2016, calculated using the weighted average fair market value for each of the three component goals at the date of grant.
The fair values for the sales and earnings per share goals of each performance share unit were estimated on the date of grant using the fair market value of the shares at the time of the award discounted for dividends, which are not paid on the performance share units during the vesting period. The fair value for the relative total shareholder return goal of each performance share unit was estimated on the date of grant using the Monte Carlo valuation model. The fair value of performance share units issued was $128.8 million, $132.5 million and $127.7 million in 2018, 2017 and 2016, respectively.
| 72 |
| 18. | Segments of Business and Geographic Areas |
| Sales to Customers | % Change | |||||||||||||||
| (Dollars in Millions) | 2018 | 2017 | 2016 | ’18 vs. ’17 | ’17 vs. ’16 | |||||||||||
| CONSUMER | ||||||||||||||||
| Baby Care | ||||||||||||||||
| U.S. | $ | 422 | 449 | 488 | (6.0 | )% | (8.0 | ) | ||||||||
| International | 1,436 | 1,467 | 1,513 | (2.1 | ) | (3.0 | ) | |||||||||
| Worldwide | 1,858 | 1,916 | 2,001 | (3.0 | ) | (4.2 | ) | |||||||||
| Beauty | ||||||||||||||||
| U.S. | 2,403 | 2,335 | 2,135 | 2.9 | 9.4 | |||||||||||
| International | 1,979 | 1,865 | 1,762 | 6.1 | 5.8 | |||||||||||
| Worldwide | 4,382 | 4,200 | 3,897 | 4.3 | 7.8 | |||||||||||
| Oral Care | ||||||||||||||||
| U.S. | 637 | 616 | 648 | 3.4 | (4.9 | ) | ||||||||||
| International | 918 | 915 | 920 | 0.3 | (0.5 | ) | ||||||||||
| Worldwide | 1,555 | 1,531 | 1,568 | 1.6 | (2.4 | ) | ||||||||||
| OTC | ||||||||||||||||
| U.S. | 1,850 | 1,716 | 1,675 | 7.8 | 2.4 | |||||||||||
| International | 2,484 | 2,410 | 2,302 | 3.1 | 4.7 | |||||||||||
| Worldwide | 4,334 | 4,126 | 3,977 | 5.0 | 3.7 | |||||||||||
| Women's Health | ||||||||||||||||
| U.S. | 13 | 12 | 19 | 8.3 | (36.8 | ) | ||||||||||
| International | 1,036 | 1,038 | 1,048 | (0.2 | ) | (1.0 | ) | |||||||||
| Worldwide | 1,049 | 1,050 | 1,067 | (0.1 | ) | (1.6 | ) | |||||||||
| Wound Care/Other | ||||||||||||||||
| U.S. | 436 | 437 | 455 | (0.2 | ) | (4.0 | ) | |||||||||
| International | 239 | 342 | 342 | (30.1 | ) | 0.0 | ||||||||||
| Worldwide | 675 | 779 | 797 | (13.4 | ) | (2.3 | ) | |||||||||
| TOTAL CONSUMER | ||||||||||||||||
| U.S. | 5,761 | 5,565 | 5,420 | 3.5 | 2.7 | |||||||||||
| International | 8,092 | 8,037 | 7,887 | 0.7 | 1.9 | |||||||||||
| Worldwide | 13,853 | 13,602 | 13,307 | 1.8 | 2.2 | |||||||||||
| PHARMACEUTICAL | ||||||||||||||||
| Immunology | ||||||||||||||||
| U.S. | 9,073 | 8,871 | 8,846 | 2.3 | 0.3 | |||||||||||
| International | 4,047 | 3,373 | 3,122 | 20.0 | 8.0 | |||||||||||
| Worldwide | 13,120 | 12,244 | 11,968 | 7.2 | 2.3 | |||||||||||
| REMICADE® | ||||||||||||||||
| U.S. | 3,664 | 4,525 | 4,842 | (19.0 | ) | (6.5 | ) | |||||||||
| U.S. Exports | 436 | 563 | 782 | (22.6 | ) | (28.0 | ) | |||||||||
| International | 1,226 | 1,227 | 1,342 | (0.1 | ) | (8.6 | ) | |||||||||
| Worldwide | 5,326 | 6,315 | 6,966 | (15.7 | ) | (9.3 | ) | |||||||||
| 73 |
| SIMPONI / SIMPONI ARIA® | ||||||||||||||||
| U.S. | 1,051 | 954 | 959 | 10.2 | (0.5 | ) | ||||||||||
| International | 1,033 | 879 | 786 | 17.5 | 11.8 | |||||||||||
| Worldwide | 2,084 | 1,833 | 1,745 | 13.7 | 5.0 | |||||||||||
| STELARA® | ||||||||||||||||
| U.S. | 3,469 | 2,767 | 2,263 | 25.4 | 22.3 | |||||||||||
| International | 1,687 | 1,244 | 969 | 35.6 | 28.4 | |||||||||||
| Worldwide | 5,156 | 4,011 | 3,232 | 28.5 | 24.1 | |||||||||||
| TREMFAYA® | ||||||||||||||||
| U.S. | 453 | 62 | — | * | * | |||||||||||
| International | 91 | 1 | — | * | * | |||||||||||
| Worldwide | 544 | 63 | — | * | * | |||||||||||
| OTHER IMMUNOLOGY | ||||||||||||||||
| U.S. | — | — | — | — | — | |||||||||||
| International | 10 | 22 | 25 | (54.5 | ) | (12.0 | ) | |||||||||
| Worldwide | 10 | 22 | 25 | (54.5 | ) | (12.0 | ) | |||||||||
| Infectious Diseases | ||||||||||||||||
| U.S. | 1,378 | 1,358 | 1,461 | 1.5 | (7.0 | ) | ||||||||||
| International | 1,926 | 1,796 | 1,747 | 7.2 | 2.8 | |||||||||||
| Worldwide | 3,304 | 3,154 | 3,208 | 4.8 | (1.7 | ) | ||||||||||
| EDURANT® / rilpivirine | ||||||||||||||||
| U.S. | 58 | 58 | 52 | 0.0 | 11.5 | |||||||||||
| International | 758 | 656 | 521 | 15.5 | 25.9 | |||||||||||
| Worldwide | 816 | 714 | 573 | 14.3 | 24.6 | |||||||||||
| PREZISTA® / PREZCOBIX® / REZOLSTA® / SYMTUZA® | ||||||||||||||||
| U.S. | 1,169 | 1,109 | 1,143 | 5.4 | (3.0 | ) | ||||||||||
| International | 786 | 712 | 708 | 10.4 | 0.6 | |||||||||||
| Worldwide | 1,955 | 1,821 | 1,851 | 7.4 | (1.6 | ) | ||||||||||
| OTHER INFECTIOUS DISEASES | ||||||||||||||||
| U.S. | 151 | 191 | 266 | (20.9 | ) | (28.2 | ) | |||||||||
| International | 382 | 428 | 518 | (10.7 | ) | (17.4 | ) | |||||||||
| Worldwide | 533 | 619 | 784 | (13.9 | ) | (21.0 | ) | |||||||||
| Neuroscience | ||||||||||||||||
| U.S. | 2,574 | 2,630 | 2,628 | (2.1 | ) | 0.1 | ||||||||||
| International | 3,503 | 3,356 | 3,457 | 4.4 | (2.9 | ) | ||||||||||
| Worldwide | 6,077 | 5,986 | 6,085 | 1.5 | (1.6 | ) | ||||||||||
| CONCERTA® / Methylphenidate | ||||||||||||||||
| U.S. | 229 | 384 | 468 | (40.4 | ) | (17.9 | ) | |||||||||
| International | 434 | 407 | 395 | 6.6 | 3.0 | |||||||||||
| Worldwide | 663 | 791 | 863 | (16.2 | ) | (8.3 | ) | |||||||||
| INVEGA SUSTENNA® / XEPLION® / INVEGA TRINZA® / TREVICTA® | ||||||||||||||||
| U.S. | 1,791 | 1,590 | 1,343 | 12.6 | 18.4 | |||||||||||
| International | 1,137 | 979 | 871 | 16.1 | 12.4 | |||||||||||
| Worldwide | 2,928 | 2,569 | 2,214 | 14.0 | 16.0 |
| 74 |
| RISPERDAL CONSTA® | ||||||||||||||||
| U.S. | 315 | 360 | 381 | (12.5 | ) | (5.5 | ) | |||||||||
| International | 422 | 445 | 512 | (5.2 | ) | (13.1 | ) | |||||||||
| Worldwide | 737 | 805 | 893 | (8.4 | ) | (9.9 | ) | |||||||||
| OTHER NEUROSCIENCE | ||||||||||||||||
| U.S. | 239 | 296 | 436 | (19.3 | ) | (32.1 | ) | |||||||||
| International | 1,510 | 1,525 | 1,679 | (1.0 | ) | (9.2 | ) | |||||||||
| Worldwide | 1,749 | 1,821 | 2,115 | (4.0 | ) | (13.9 | ) | |||||||||
| Oncology | ||||||||||||||||
| U.S. | 4,331 | 3,098 | 2,335 | 39.8 | 32.7 | |||||||||||
| International | 5,513 | 4,160 | 3,472 | 32.5 | 19.8 | |||||||||||
| Worldwide | 9,844 | 7,258 | 5,807 | 35.6 | 25.0 | |||||||||||
| DARZALEX® | ||||||||||||||||
| U.S. | 1,203 | 884 | 471 | 36.1 | 87.7 | |||||||||||
| International | 822 | 358 | 101 | * | * | |||||||||||
| Worldwide | 2,025 | 1,242 | 572 | 63.0 | * | |||||||||||
| IMBRUVICA® | ||||||||||||||||
| U.S. | 1,129 | 841 | 613 | 34.2 | 37.2 | |||||||||||
| International | 1,486 | 1,052 | 638 | 41.3 | 64.9 | |||||||||||
| Worldwide | 2,615 | 1,893 | 1,251 | 38.1 | 51.3 | |||||||||||
| VELCADE® | ||||||||||||||||
| U.S. | — | — | — | — | — | |||||||||||
| International | 1,116 | 1,114 | 1,224 | 0.2 | (9.0 | ) | ||||||||||
| Worldwide | 1,116 | 1,114 | 1,224 | 0.2 | (9.0 | ) | ||||||||||
| ZYTIGA® /abiraterone acetate | ||||||||||||||||
| U.S. | 1,771 | 1,228 | 1,089 | 44.2 | 12.8 | |||||||||||
| International | 1,727 | 1,277 | 1,171 | 35.2 | 9.1 | |||||||||||
| Worldwide | 3,498 | 2,505 | 2,260 | 39.6 | 10.8 | |||||||||||
| OTHER ONCOLOGY | ||||||||||||||||
| U.S. | 228 | 145 | 162 | 57.2 | (10.5 | ) | ||||||||||
| International | 362 | 359 | 338 | 0.8 | 6.2 | |||||||||||
| Worldwide | 590 | 504 | 500 | 17.1 | 0.8 | |||||||||||
| Pulmonary Hypertension | ||||||||||||||||
| U.S. | 1,651 | 773 | — | * | * | |||||||||||
| International | 922 | 554 | — | 66.4 | * | |||||||||||
| Worldwide | 2,573 | 1,327 | — | 93.9 | * | |||||||||||
| OPSUMIT® | ||||||||||||||||
| U.S. | 700 | 320 | — | * | * | |||||||||||
| International | 515 | 253 | — | * | * | |||||||||||
| Worldwide | 1,215 | 573 | — | * | * | |||||||||||
| TRACLEER® | ||||||||||||||||
| U.S. | 268 | 161 | — | 66.5 | * | |||||||||||
| International | 278 | 242 | — | 14.9 | * | |||||||||||
| Worldwide | 546 | 403 | — | 35.5 | * | |||||||||||
| 75 |
| UPTRAVI® | ||||||||||||||||
| U.S. | 598 | 238 | — | * | * | |||||||||||
| International | 65 | 25 | — | * | * | |||||||||||
| Worldwide | 663 | 263 | — | * | * | |||||||||||
| OTHER | ||||||||||||||||
| U.S. | 85 | 54 | — | 57.4 | * | |||||||||||
| International | 64 | 34 | — | 88.2 | * | |||||||||||
| Worldwide | 149 | 88 | — | 69.3 | * | |||||||||||
| Cardiovascular / Metabolism / Other | ||||||||||||||||
| U.S. | 4,279 | 4,744 | 4,855 | (9.8 | ) | (2.3 | ) | |||||||||
| International | 1,537 | 1,543 | 1,541 | (0.4 | ) | 0.1 | ||||||||||
| Worldwide | 5,816 | 6,287 | 6,396 | (7.5 | ) | (1.7 | ) | |||||||||
| XARELTO® | ||||||||||||||||
| U.S. | 2,477 | 2,500 | 2,288 | (0.9 | ) | 9.3 | ||||||||||
| International | — | — | — | — | — | |||||||||||
| Worldwide | 2,477 | 2,500 | 2,288 | (0.9 | ) | 9.3 | ||||||||||
| INVOKANA® / INVOKAMET® | ||||||||||||||||
| U.S. | 711 | 944 | 1,273 | (24.7 | ) | (25.8 | ) | |||||||||
| International | 170 | 167 | 134 | 1.8 | 24.6 | |||||||||||
| Worldwide | 881 | 1,111 | 1,407 | (20.7 | ) | (21.0 | ) | |||||||||
| PROCRIT® / EPREX® | ||||||||||||||||
| U.S. | 674 | 675 | 767 | (0.1 | ) | (12.0 | ) | |||||||||
| International | 314 | 297 | 338 | 5.7 | (12.1 | ) | ||||||||||
| Worldwide | 988 | 972 | 1,105 | 1.6 | (12.0 | ) | ||||||||||
| OTHER | ||||||||||||||||
| U.S. | 417 | 625 | 527 | (33.3 | ) | 18.6 | ||||||||||
| International | 1,053 | 1,079 | 1,069 | (2.4 | ) | 0.9 | ||||||||||
| Worldwide | 1,470 | 1,704 | 1,596 | (13.7 | ) | 6.8 | ||||||||||
| TOTAL PHARMACEUTICAL | ||||||||||||||||
| U.S. | 23,286 | 21,474 | 20,125 | 8.4 | 6.7 | |||||||||||
| International | 17,448 | 14,782 | 13,339 | 18.0 | 10.8 | |||||||||||
| Worldwide | 40,734 | 36,256 | 33,464 | 12.4 | 8.3 | |||||||||||
| MEDICAL DEVICES | ||||||||||||||||
| Diabetes Care | ||||||||||||||||
| U.S. | 371 | 612 | 739 | (39.4 | ) | (17.2 | ) | |||||||||
| International | 638 | 1,003 | 1,050 | (36.4 | ) | (4.5 | ) | |||||||||
| Worldwide | 1,009 | 1,615 | 1,789 | (37.5 | ) | (9.7 | ) | |||||||||
| Diagnostics | ||||||||||||||||
| U.S. | — | — | — | — | — | |||||||||||
| International | — | 1 | 66 | * | * | |||||||||||
| Worldwide | — | 1 | 66 | * | * | |||||||||||
| Interventional Solutions | ||||||||||||||||
| U.S. | 1,283 | 1,148 | 1,031 | 11.8 | 11.3 | |||||||||||
| International | 1,363 | 1,148 | 1,024 | 18.7 | 12.1 | |||||||||||
| Worldwide | 2,646 | 2,296 | 2,055 | 15.2 | 11.7 |
| 76 |
| Orthopaedics | ||||||||||||||||
| U.S. | 5,281 | 5,404 | 5,438 | (2.3 | ) | (0.6 | ) | |||||||||
| International | 3,604 | 3,654 | 3,690 | (1.4 | ) | (1.0 | ) | |||||||||
| Worldwide | 8,885 | 9,058 | 9,128 | (1.9 | ) | (0.8 | ) | |||||||||
| HIPS | ||||||||||||||||
| U.S. | 841 | 827 | 798 | 1.7 | 3.6 | |||||||||||
| International | 577 | 567 | 563 | 1.8 | 0.7 | |||||||||||
| Worldwide | 1,418 | 1,394 | 1,361 | 1.7 | 2.4 | |||||||||||
| KNEES | ||||||||||||||||
| U.S. | 911 | 948 | 943 | (3.9 | ) | 0.5 | ||||||||||
| International | 591 | 575 | 581 | 2.8 | (1.0 | ) | ||||||||||
| Worldwide | 1,502 | 1,523 | 1,524 | (1.4 | ) | (0.1 | ) | |||||||||
| TRAUMA | ||||||||||||||||
| U.S. | 1,599 | 1,576 | 1,545 | 1.5 | 2.0 | |||||||||||
| International | 1,100 | 1,040 | 1,024 | 5.8 | 1.6 | |||||||||||
| Worldwide | 2,699 | 2,616 | 2,569 | 3.2 | 1.8 | |||||||||||
| SPINE & OTHER | ||||||||||||||||
| U.S. | 1,930 | 2,053 | 2,152 | (6.0 | ) | (4.6 | ) | |||||||||
| International | 1,336 | 1,472 | 1,522 | (9.2 | ) | (3.3 | ) | |||||||||
| Worldwide | 3,266 | 3,525 | 3,674 | (7.3 | ) | (4.1 | ) | |||||||||
| Surgery | ||||||||||||||||
| U.S. | 4,125 | 4,085 | 4,026 | 1.0 | 1.5 | |||||||||||
| International | 5,776 | 5,474 | 5,270 | 5.5 | 3.9 | |||||||||||
| Worldwide | 9,901 | 9,559 | 9,296 | 3.6 | 2.8 | |||||||||||
| ADVANCED | ||||||||||||||||
| U.S. | 1,657 | 1,620 | 1,524 | 2.3 | 6.3 | |||||||||||
| International | 2,345 | 2,136 | 1,993 | 9.8 | 7.2 | |||||||||||
| Worldwide | 4,002 | 3,756 | 3,517 | 6.5 | 6.8 | |||||||||||
| GENERAL | ||||||||||||||||
| U.S. | 1,751 | 1,728 | 1,669 | 1.3 | 3.5 | |||||||||||
| International | 2,806 | 2,735 | 2,693 | 2.6 | 1.6 | |||||||||||
| Worldwide | 4,557 | 4,463 | 4,362 | 2.1 | 2.3 | |||||||||||
| SPECIALTY | ||||||||||||||||
| U.S. | 717 | 737 | 833 | (2.7 | ) | (11.5 | ) | |||||||||
| International | 625 | 603 | 584 | 3.6 | 3.3 | |||||||||||
| Worldwide | 1,342 | 1,340 | 1,417 | 0.1 | (5.4 | ) | ||||||||||
| Vision | ||||||||||||||||
| U.S. | 1,777 | 1,575 | 1,032 | 12.8 | 52.6 | |||||||||||
| International | 2,776 | 2,488 | 1,753 | 11.6 | 41.9 | |||||||||||
| Worldwide | 4,553 | 4,063 | 2,785 | 12.1 | 45.9 | |||||||||||
| CONTACT LENSES / OTHER | ||||||||||||||||
| U.S. | 1,237 | 1,122 | 1,032 | 10.2 | 8.7 | |||||||||||
| International | 2,065 | 1,914 | 1,753 | 7.9 | 9.2 | |||||||||||
| Worldwide | 3,302 | 3,036 | 2,785 | 8.8 | 9.0 | |||||||||||
| 77 |
| SURGICAL | ||||||||||||||||
| U.S. | 540 | 453 | — | 19.2 | * | |||||||||||
| International | 711 | 574 | — | 23.9 | * | |||||||||||
| Worldwide | 1,251 | 1,027 | — | 21.8 | * | |||||||||||
| TOTAL MEDICAL DEVICES | ||||||||||||||||
| U.S. | 12,837 | 12,824 | 12,266 | 0.1 | 4.5 | |||||||||||
| International | 14,157 | 13,768 | 12,853 | 2.8 | 7.1 | |||||||||||
| Worldwide | 26,994 | 26,592 | 25,119 | 1.5 | 5.9 | |||||||||||
| WORLDWIDE | ||||||||||||||||
| U.S. | 41,884 | 39,863 | 37,811 | 5.1 | 5.4 | |||||||||||
| International | 39,697 | 36,587 | 34,079 | 8.5 | 7.4 | |||||||||||
| Worldwide | $ | 81,581 | 76,450 | 71,890 | 6.7 | % | 6.3 |
*Percentage greater than 100% or not meaningful
| Income Before Tax | Identifiable Assets | ||||||||||||||||
| (Dollars in Millions) | 2018 (3) | 2017 (4) | 2016 (5) | 2018 | 2017 | ||||||||||||
| Consumer | $ | 2,320 | 2,524 | 2,441 | $ | 25,877 | 25,030 | ||||||||||
| Pharmaceutical | 12,568 | 11,083 | 12,827 | 56,636 | 59,450 | ||||||||||||
| Medical Devices | 4,397 | 5,392 | 5,578 | 46,254 | 45,413 | ||||||||||||
| Total | 19,285 | 18,999 | 20,846 | 128,767 | 129,893 | ||||||||||||
| Less: Expense not allocated to segments (1) | 1,286 | 1,326 | 1,043 | ||||||||||||||
| General corporate (2) | 24,187 | 27,410 | |||||||||||||||
| Worldwide total | $ | 17,999 | 17,673 | 19,803 | $ | 152,954 | 157,303 |
| Additions to Property, Plant & Equipment | Depreciation and Amortization | |||||||||||||||||||
| (Dollars in Millions) | 2018 | 2017 | 2016 | 2018 | 2017 | 2016 | ||||||||||||||
| Consumer | $ | 438 | 485 | 486 | $ | 688 | 674 | 608 | ||||||||||||
| Pharmaceutical | 1,012 | 936 | 927 | 3,802 | 2,416 | 886 | ||||||||||||||
| Medical Devices | 1,843 | 1,566 | 1,472 | 2,103 | 2,216 | 1,928 | ||||||||||||||
| Segments total | 3,293 | 2,987 | 2,885 | 6,593 | 5,306 | 3,422 | ||||||||||||||
| General corporate | 377 | 292 | 341 | 336 | 336 | 332 | ||||||||||||||
| Worldwide total | $ | 3,670 | 3,279 | 3,226 | $ | 6,929 | 5,642 | 3,754 |
| Sales to Customers | Long-Lived Assets (6) | ||||||||||||||||
| (Dollars in Millions) | 2018 | 2017 | 2016 | 2018 | 2017 | ||||||||||||
| United States | $ | 41,884 | 39,863 | 37,811 | $ | 37,117 | 38,556 | ||||||||||
| Europe | 18,753 | 17,126 | 15,770 | 51,433 | 56,677 | ||||||||||||
| Western Hemisphere excluding U.S. | 6,113 | 6,041 | 5,734 | 2,752 | 2,990 | ||||||||||||
| Asia-Pacific, Africa | 14,831 | 13,420 | 12,575 | 2,733 | 2,773 | ||||||||||||
| Segments total | 81,581 | 76,450 | 71,890 | 94,035 | 100,996 | ||||||||||||
| General corporate | 1,064 | 1,143 | |||||||||||||||
| Other non long-lived assets | 57,855 | 55,164 | |||||||||||||||
| Worldwide total | $ | 81,581 | 76,450 | 71,890 | $ | 152,954 | 157,303 |
See Note 1 for a description of the segments in which the Company operates.
| 78 |
Export sales are not significant. In 2018, the Company had three wholesalers distributing products for all three segments that represented approximately 14.0%, 11.0% and 11.0% of the total consolidated revenues. In 2017, the Company had two wholesalers distributing products for all three segments that represented approximately 14.0% and 10.0% of the total consolidated revenues. In 2016, the Company had two wholesalers distributing products for all three segments that represented approximately 13.5% and 10.7% of the total consolidated revenues.
| (1) | Amounts not allocated to segments include interest (income) expense and general corporate (income) expense. |
| (2) | General corporate includes cash, cash equivalents and marketable securities. |
| (3) | The Consumer segment includes a gain of $0.3 billion from the divestiture of NIZORAL® and litigation expense of $0.3 billion. The Pharmaceutical segment includes an in-process research and development charge of $1.1 billion related to the Alios and XO1 assets and the corresponding XO1 contingent liability reversal of $0.2 billion, Actelion acquisition related costs of $0.2 billion, unrealized loss on securities of $0.2 billion and a gain of $0.2 billion from the divestiture of certain non-strategic Pharmaceutical products. The Medical Devices segment includes net litigation expense of $1.7 billion, a restructuring related charge of $0.6 billion, AMO acquisition related costs of $0.1 billion and a gain of $0.5 billion from the divestiture of the LifeScan business in the fiscal fourth quarter. |
| (4) | The Pharmaceutical segment includes $0.8 billion for Actelion acquisition related costs, an in-process research and development expense of $0.4 billion and litigation expense of $0.1 billion. The Medical Devices segment includes litigation expense of $1.1 billion, a restructuring related charge of $0.8 billion, an asset impairment of $0.2 billion primarily related to the insulin pump business and $0.1 billion for AMO acquisition related costs. The Medical Devices segment includes a gain of $0.7 billion from the divestiture of Codman Neurosurgery. The Consumer segment includes a gain of $0.5 billion from the divestiture of COMPEED®. |
| (5) | Includes net litigation expense of $0.8 billion and a restructuring related charge of $0.7 billion in the Medical Devices segment. The Pharmaceutical segment includes a positive adjustment of $0.5 billion to previous reserve estimates and gains from the divestitures of the controlled substance raw material and active pharmaceutical ingredient (API) business and certain anesthetic products in Europe. |
| (6) | Long-lived assets include property, plant and equipment, net for 2018, and 2017 of $17,035 and $17,005, respectively, and intangible assets and goodwill, net for 2018 and 2017 of $78,064 and $85,134, respectively. |
| 79 |
| 19. | Selected Quarterly Financial Data (unaudited) |
Selected unaudited quarterly financial data for the years 2018 and 2017 are summarized below:
| 2018 | 2017 | ||||||||||||||||||||||||
| (Dollars in Millions Except Per Share Data) | First Quarter (1) | Second Quarter (2) | Third Quarter (3) | Fourth Quarter (4) | First Quarter (5) | Second Quarter (6) | Third Quarter (7) | Fourth Quarter (8) | |||||||||||||||||
| Segment sales to customers | |||||||||||||||||||||||||
| Consumer | $ | 3,398 | 3,504 | 3,415 | 3,536 | 3,228 | 3,478 | 3,356 | 3,540 | ||||||||||||||||
| Pharmaceutical | 9,844 | 10,354 | 10,346 | 10,190 | 8,245 | 8,635 | 9,695 | 9,681 | |||||||||||||||||
| Medical Devices | 6,767 | 6,972 | 6,587 | 6,668 | 6,293 | 6,726 | 6,599 | 6,974 | |||||||||||||||||
| Total sales | 20,009 | 20,830 | 20,348 | 20,394 | 17,766 | 18,839 | 19,650 | 20,195 | |||||||||||||||||
| Gross profit | 13,395 | 13,903 | 13,759 | 13,433 | 12,357 | 12,993 | 12,725 | 12,936 | |||||||||||||||||
| Earnings before provision for taxes on income | 5,481 | 4,973 | 4,423 | 3,122 | 5,575 | 4,748 | 4,790 | 2,560 | |||||||||||||||||
| Net earnings (loss) | 4,367 | 3,954 | 3,934 | 3,042 | 4,422 | 3,827 | 3,764 | (10,713 | ) | ||||||||||||||||
| Basic net earnings (loss) per share | $ | 1.63 | 1.47 | 1.47 | 1.14 | 1.63 | 1.42 | 1.40 | (3.99 | ) | |||||||||||||||
| Diluted net earnings (loss) per share | $ | 1.60 | 1.45 | 1.44 | 1.12 | 1.61 | 1.40 | 1.37 | (3.99 | ) |
| (1) | The first quarter of 2018 includes an Actelion acquisition related cost of $92 million after-tax ($96 million before-tax) and a restructuring related charge of $81 million after-tax ($107 million before-tax). |
| (2) | The second quarter of 2018 includes a litigation expense of $609 million after-tax ($703 million before-tax) and a restructuring related charge of $152 million after-tax ($176 million before-tax). |
| (3) | The third quarter of 2018 includes an in-process research and development expense of $859 million after-tax ($1,126 million before-tax) related to the Alios and XO1 assets and the corresponding XO1 contingent liability reversal of $184 million after and before tax, a restructuring related charge of $162 million after-tax ($190 million before-tax) and a $265 million benefit after-tax from the impact of tax legislation. |
| (4) | The fourth quarter of 2018 includes a litigation expense of $1,113 million after-tax ($1,288 million before-tax), a restructuring related charge of $190 million after-tax ($227 million before-tax) and a $137 million benefit after-tax from the impact of tax legislation. |
| (5) | The first quarter of 2017 includes a restructuring charge of $121 million after-tax ($161 million before-tax) and an AMO acquisition related cost of $251 million after-tax ($38 million before-tax). |
| (6) | The second quarter of 2017 includes a litigation expense of $352 million after-tax ($493 million before-tax), Actelion acquisition related costs of $199 million after-tax ($213 million before-tax) a restructuring charge of $101 million after-tax ($128 million before-tax) and an asset impairment charge of $125 million after-tax ($182 million before-tax). |
| (7) | The third quarter of 2017 includes a litigation expense of $97 million after-tax ($118 million before-tax), Actelion acquisition related costs of $255 million after-tax ($367 million before-tax) and a restructuring charge of $136 million after-tax ($187 million before-tax). |
| (8) | The fourth quarter of 2017 includes a litigation expense of $506 million after-tax ($645 million before-tax), Actelion acquisition related costs of $313 million after-tax ($217 million before-tax), a restructuring charge of $237 million after-tax ($284 million before-tax), an in-process research and development expense of $266 million after-tax ($408 million before-tax) and an after-tax benefit of $116 million related to the insulin pump business. Additionally, the fourth quarter of 2017 includes a provisional charge of $13.6 billion for recently enacted tax legislation. |
| 80 |
| 20. | Business Combinations and Divestitures |
Certain businesses were acquired for $0.9 billion in cash and $0.1 billion of liabilities assumed during 2018. These acquisitions were accounted for using the acquisition method and, accordingly, results of operations have been included in the financial statements from their respective dates of acquisition.
The 2018 acquisitions primarily included: Zarbee’s, Inc., a privately held company that is a leader in naturally-based consumer healthcare products; Medical Enterprises Distribution LLC, a privately held healthcare technology firm focused on surgical procedure innovation; BeneVir Biopharm, Inc. (BeneVir), a privately-held, biopharmaceutical company specializing in the development of oncolytic immunotherapies and Orthotaxy, a privately-held developer of software-enabled surgery technologies, including a differentiated robotic-assisted surgery solution.
The excess of purchase price over the estimated fair value of tangible assets acquired amounted to $1.0 billion and has been assigned to identifiable intangible assets, with any residual recorded to goodwill.
On October 23, 2018, the Company entered into an agreement to acquire Ci:z Holdings Co., Ltd., a Japanese company focused on the marketing, development and distribution of a broad range of dermocosmetic, cosmetic and skincare products for a total purchase price of approximately ¥230 billion, which equates to approximately $2.1 billion, using the exchange rate of 109.06 Japanese Yen to each U.S. Dollar on January 16, 2019. The acquisition was completed on January 17, 2019, through a series of transactions that included an all-cash tender offer to acquire the publicly held shares not already held by the Company for ¥5,900 per share. Upon completion of the tender offer and the related transactions, the Company acquired 89% of the outstanding shares. The Company plans to acquire the remaining shares that were not tendered in the tender offer through a share consolidation under Japanese law during the first half of 2019 and take appropriate actions to delist from the Tokyo Stock Exchange. The acquisition will include the range of brands comprising DR.CI:LABO, LABO LABO and GENOMER line of skincare products. The Company expects to treat this transaction as a business combination and will include it in the Consumer segment.
On February 13, 2019, the Company entered into a definitive agreement to acquire Auris Health, Inc. for approximately $3.4 billion in cash. Additional contingent payments of up to$2.35 billion, in the aggregate, may be payable upon reaching certain predetermined milestones. Auris Health is a privately held developer of robotic technologies, initially focused in lung cancer, with an FDA-cleared platform currently used in bronchoscopic diagnostic and therapeutic procedures. The closing is subject to antitrust clearance and other customary closing conditions. The transaction is expected to close by the end of the second quarter of 2019. The Company expects to treat this transaction as a business combination and will include it in the Medical Devices segment.
During 2017 certain businesses were acquired for $35.2 billion in cash and $1.8 billion of liabilities assumed. These acquisitions were accounted for using the acquisition method and, accordingly, results of operations have been included in the financial statements from their respective dates of acquisition.
The 2017 acquisitions primarily included: Actelion Ltd, an established leading franchise of differentiated, innovative products for pulmonary arterial hypertension (PAH); Abbott Medical Optics (AMO), a wholly-owned subsidiary of Abbott Laboratories, which included ophthalmic products related to: cataract surgery, laser refractive surgery and consumer eye health; Neuravi Limited, a privately-held medical device company that develops and markets medical devices for neurointerventional therapy; TearScience Inc., a manufacturer of products dedicated to treating meibomian gland dysfunction; Sightbox, Inc., a privately-held company that developed a subscription vision care service that connects consumers with eye care professionals and a supply of contact lenses; Torax Medical, Inc., a privately-held medical device company that manufactures and markets the LINX™ Reflux Management System for the surgical treatment of gastroesophageal reflux disease and Megadyne Medical Products, Inc., a privately-held medical device company that develops, manufactures and markets electrosurgical tools.
The excess of purchase price over the estimated fair value of tangible assets acquired amounted to $34.4 billion and has been assigned to identifiable intangible assets, with any residual recorded to goodwill. Of this amount, approximately $1.1 billion has been identified as the value of IPR&D, primarily associated with the acquisition of Actelion Ltd. The value of the IPR&D was calculated using cash flow projections discounted for the inherent risk in the projects.
During 2017, the Company completed the acquisition of Actelion Ltd through an all cash tender offer in Switzerland for $280 per share, amounting to $29.6 billion, net of cash acquired. As part of the transaction, immediately prior to the completion of the acquisition, Actelion spun out its drug discovery operations and early-stage clinical development assets into a newly created Swiss biopharmaceutical company, Idorsia Ltd. The shares of Idorsia are listed on the SIX Swiss Exchange (SIX). In 2017 the Company held 9.9% of the shares of Idorsia and had rights to an additional 22.1% of Idorsia equity through a convertible loan with a principal amount of approximately $0.5 billion. As a result of Idorsia raising additional capital in July 2018, the Company currently holds 9.0% of the shares of Idorsia and has rights to an additional 20.8% of Idorsia equity through a convertible loan with a principal amount of approximately $0.5 billion. The convertible loan may be converted into Idorsia shares as follows: (i) up to an aggregate shareholding of 16% of Idorsia shares as a result of certain shareholders holding more than 20% of the issued Idorsia shares, and (ii) up to the balance of the remaining amount within 20 business days of the maturity date of the convertible loan, which has a 10 year term, or if Idorsia undergoes a change of control transaction. The investment in Idorsia was recorded as a cost method investment in Other assets in the Company's consolidated Balance Sheet. The Company also exercised the option acquired on ACT-132577, a product within Idorsia being developed for resistant hypertension currently in phase 2 of clinical development. The Company has also entered into an agreement to provide Idorsia
| 81 |
with a Swiss franc denominated credit facility of approximately $250 million. As of December 30, 2018, Idorsia has not made any draw-downs under the credit facility. Actelion has entered into a transitional services agreement with Idorsia. Actelion has established a leading franchise of differentiated, innovative products for pulmonary arterial hypertension (PAH) that are highly complementary to the existing portfolio of the Company. The addition of Actelion’s specialty in-market medicines and late-stage products is consistent with the Company's efforts to grow in attractive and complementary therapeutic areas and serve patients with serious illnesses and significant unmet medical need.
During the fiscal second quarter of 2018, the Company finalized the purchase price allocation to the individual assets acquired and liabilities assumed using the acquisition method. The following table presents the amounts recognized for assets acquired and liabilities assumed as of the acquisition date with adjustments made through the second quarter of 2018:
| (Dollars in Millions) | ||
| Cash & Cash equivalents | 469 | |
| Inventory(1) | 759 | |
| Accounts Receivable | 485 | |
| Other current assets | 93 | |
| Property, plant and equipment | 104 | |
| Goodwill | 6,161 | |
| Intangible assets | 25,010 | |
| Deferred Taxes | 99 | |
| Other non-current assets | 19 | |
| Total Assets Acquired | 33,199 | |
| Current liabilities | 956 | |
| Deferred Taxes | 1,776 | |
| Other non-current liabilities | 413 | |
| Total Liabilities Assumed | 3,145 | |
| Net Assets Acquired | 30,054 |
(1) Includes adjustment of $642 million to write-up the acquired inventory to its estimated fair value.
The adjustments made since the date of acquisition were $0.2 billion to the deferred taxes and $0.4 billion to the current liabilities with the offset to goodwill. The assets acquired are recorded in the Pharmaceutical segment. The acquisition of Actelion resulted in approximately $6.2 billion of goodwill. The goodwill is primarily attributable to synergies expected to arise from the acquisition. The goodwill is not expected to be deductible for tax purposes.
The purchase price allocation to the identifiable intangible assets is as follows:
| (Dollars in Millions) | ||||
| Intangible assets with definite lives: | ||||
| Patents and trademarks* | $ | 24,230 | ||
| Total amortizable intangibles | 24,230 | |||
| In-process research and development | 780 | |||
| Total intangible assets | $ | 25,010 |
*Includes $0.4 billion related to VALCHLOR®, one of the acquired products, which was divested in the fiscal second quarter of 2018.
The patents and trademarks acquired are comprised of developed technology with a weighted average life of 9 years and was primarily based on the patent life of the marketed products. The intangible assets with definite lives were assigned asset lives ranging from 4 to 10 years. The in-process research and development intangible assets were valued for technology programs for unapproved products.
The value of the IPR&D was calculated using probability adjusted cash flow projections discounted for the risk inherent in such projects. The discount rate applied was 9%.
| 82 |
The acquisition was accounted for using the acquisition method and, accordingly, the results of operations of Actelion were reported in the Company's financial statements beginning on June 16, 2017, the date of acquisition. For the year ended December 31, 2017, total sales and a net loss for Actelion from the date of acquisition were $1.4 billion and $1.4 billion, respectively.
The following table provides pro forma results of operations for the fiscal year ended December 31, 2017 and January 1, 2017, as if Actelion had been acquired as of January 4, 2016. The pro forma results include the effect of certain purchase accounting adjustments such as the estimated changes in depreciation and amortization expense on the acquired tangible and intangible assets. However, pro forma results do not include any anticipated cost savings or other effects of the planned integration of Actelion. Accordingly, such amounts are not necessarily indicative of the results if the acquisition had occurred on the dates indicated or which may occur in the future.
| Unaudited Pro forma Consolidated Results | ||||
| (Dollars in Millions Except Per Share Data) | 2017 | 2016 | ||
| Net Sales | 77,681 | 74,339 | ||
| Net Earnings | 1,509 | 13,916 | ||
| Diluted Net Earnings per Common Share | 0.55 | 4.99 |
The Company recorded Actelion acquisition related costs before tax of approximately $0.2 billion and $0.8 billion in 2018 and 2017, respectively, which was recorded in Other (income)/expense and Cost of products sold.
During 2017, the Company acquired Abbott Medical Optics (AMO), a wholly-owned subsidiary of Abbott Laboratories, for $4.3 billion, net of cash acquired. The acquisition included ophthalmic products related to: cataract surgery, laser refractive surgery and consumer eye health. The net purchase price was primarily recorded as amortizable intangible assets for $2.3 billion and goodwill for $1.7 billion. The weighted average life of total amortizable intangibles, the majority being customer relationships, is approximately 14.4 years. The goodwill is primarily attributable to synergies expected to arise from the business acquisition and is not deductible for tax purposes. The intangible assets and goodwill amounts are based on the final purchase price allocation. The assets acquired were recorded in the Medical Devices segment.
Certain businesses were acquired for $4.5 billion in cash and $0.1 billion of liabilities assumed during 2016. These acquisitions were accounted for using the acquisition method and, accordingly, results of operations have been included in the financial statements from their respective dates of acquisition.
The 2016 acquisitions primarily included: Vogue International LLC, a privately-held company focused on the marketing, development and distribution of salon-influenced and nature inspired hair care and other personal products; NeuWave Medical, Inc., a privately-held medical device company that manufactures and markets minimally invasive soft tissue microwave ablation systems; NeoStrata Company, Inc., a global leader in dermocosmetics; and the global rights for the commercialization of RHINOCORT® allergy spray outside the United States.
The excess of purchase price over the estimated fair value of tangible assets acquired amounted to $4.1 billion and has been assigned to identifiable intangible assets, with any residual recorded to goodwill.
The net purchase price for Vogue International LLC of $3.3 billion was primarily recorded as amortizable intangible assets for $2.3 billion and goodwill for $1.1 billion. The weighted average life for the $2.3 billion of total amortizable intangibles is approximately 22 years. The trademark asset values were determined to have definite lives ranging from 10 to 22 years, with the majority being 22 years. The goodwill is primarily attributable to synergies expected to arise from the business acquisition and is expected to be deductible for tax purposes. The assets acquired were recorded in the Consumer segment.
In 2012, the Company completed the acquisition of Synthes, Inc. for a purchase price of $20.2 billion in cash and stock. In connection with the acquisition of Synthes, Inc. the Company entered into two accelerated share repurchase (ASR) agreements. In 2013, the Company settled the remaining liabilities under the ASR agreements. While the Company believes that the transactions under each ASR agreement and a series of related internal transactions were consummated in a tax efficient manner in accordance with applicable law, it is possible that the Internal Revenue Service could assert one or more contrary positions to challenge the transactions from a tax perspective. If challenged, an amount up to the total purchase price for the Synthes shares could be treated as subject to applicable U.S. tax at approximately the statutory rate to the Company, plus interest.
With the exception of the Actelion Ltd acquisition, supplemental pro forma information for 2018, 2017 and 2016 in accordance with U.S. GAAP standards related to business combinations, and goodwill and other intangible assets, is not provided, as the impact of the aforementioned acquisitions did not have a material effect on the Company’s results of operations, cash flows or financial position.
During 2018, the Company divested the LifeScan Inc business for approximately $2.1 billion and retained certain net liabilities. Other divestitures in 2018 included: NIZORAL®, RoC® and certain non-strategic Pharmaceutical products. In 2018, the pre-tax gains on the divestitures were approximately $1.2 billion. Additionally, in 2018, the Company accepted the binding
| 83 |
offer from Fortive Corporation to acquire its Advanced Sterilization Products (ASP) business for approximately $2.7 billion, subject to customary adjustments. The transaction is expected to close in 2019. As of December 30, 2018, the assets held for sale on the Consolidated Balance Sheet were $0.2 billion of inventory, $0.1 billion of property, plant and equipment and $0.3 billion of goodwill. The Company will retain certain net receivables of approximately $0.1 billion associated with the ASP business.
In 2018, the Company accepted a binding offer to form a strategic collaboration with Jabil Inc., one of the world’s leading manufacturing services providers for health care products and technology products. The Company is expanding a 12-year relationship with Jabil to produce a range of products within the Ethicon Endo-Surgery and DePuy Synthes businesses. This transaction includes the transfer of employees and manufacturing sites. As of December 30, 2018, the assets held for sale on the Consolidated Balance Sheet were $0.3 billion of inventory and $0.1 billion of property, plant and equipment, net. For additional details on the global supply chain restructuring see Note 22 to the Consolidated Financial Statements.
During 2017, the Company divestitures primarily included: the Codman Neurosurgery business, to Integra LifeSciences Holdings Corporation and the divestiture of COMPEED® to HRA Pharma. In 2017, the pre-tax gains on the divestitures were approximately $1.3 billion.
During 2016, the Company divestitures included: the controlled substance raw material and active pharmaceutical ingredient (API) business; certain anesthetic products in Europe; and certain non-strategic Consumer brands. In 2016, the pre-tax gains on the divestitures were approximately $0.6 billion.
| 21. | Legal Proceedings |
Johnson & Johnson and certain of its subsidiaries are involved in various lawsuits and claims regarding product liability, intellectual property, commercial, supplier indemnification and other matters; governmental investigations; and other legal proceedings that arise from time to time in the ordinary course of their business.
The Company records accruals for loss contingencies associated with these legal matters when it is probable that a liability will be incurred and the amount of the loss can be reasonably estimated. As of December 30, 2018, the Company has determined that the liabilities associated with certain litigation matters are probable and can be reasonably estimated. The Company has accrued for these matters and will continue to monitor each related legal issue and adjust accruals as might be warranted based on new information and further developments in accordance with ASC 450-20-25. For these and other litigation and regulatory matters discussed below for which a loss is probable or reasonably possible, the Company is unable to estimate the possible loss or range of loss beyond the amounts already accrued. Amounts accrued for legal contingencies often result from a complex series of judgments about future events and uncertainties that rely heavily on estimates and assumptions. The ability to make such estimates and judgments can be affected by various factors, including whether damages sought in the proceedings are unsubstantiated or indeterminate; scientific and legal discovery has not commenced or is not complete; proceedings are in early stages; matters present legal uncertainties; there are significant facts in dispute; or there are numerous parties involved.
In the Company's opinion, based on its examination of these matters, its experience to date and discussions with counsel, the ultimate outcome of legal proceedings, net of liabilities accrued in the Company's balance sheet, is not expected to have a material adverse effect on the Company's financial position. However, the resolution of, or increase in accruals for, one or more of these matters in any reporting period may have a material adverse effect on the Company's results of operations and cash flows for that period.
PRODUCT LIABILITY
Johnson & Johnson and certain of its subsidiaries are involved in numerous product liability claims and lawsuits involving multiple products. Claimants in these cases seek substantial compensatory and, where available, punitive damages. While the Company believes it has substantial defenses, it is not feasible to predict the ultimate outcome of litigation. The Company has established accruals for product liability claims and lawsuits in compliance with ASC 450-20 based on currently available information, which in some cases may be limited. The Company accrues an estimate of the legal defense costs needed to defend each matter when those costs are probable and can be reasonably estimated. For certain of these matters, the Company has accrued additional amounts such as estimated costs associated with settlements, damages and other losses. To the extent adverse verdicts have been rendered against the Company, the Company does not record an accrual until a loss is determined to be probable and can be reasonably estimated. Product liability accruals can represent projected product liability for thousands of claims around the world, each in different litigation environments and with different fact patterns. Changes to the accruals may be required in the future as additional information becomes available.
The most significant of these cases include: the DePuy ASR™ XL Acetabular System and DePuy ASR™ Hip Resurfacing System; the PINNACLE® Acetabular Cup System; pelvic meshes; RISPERDAL®; XARELTO®; body powders containing talc, primarily JOHNSONS® Baby Powder; INVOKANA®; and ETHICON PHYSIOMESH® Flexible Composite Mesh. As of December 30, 2018, in the United States there were approximately 1,800 plaintiffs with direct claims in pending lawsuits
| 84 |
regarding injuries allegedly due to the DePuy ASR™ XL Acetabular System and DePuy ASR™ Hip Resurfacing System; 10,500 with respect to the PINNACLE® Acetabular Cup System; 34,800 with respect to pelvic meshes; 13,400 with respect to RISPERDAL®; 25,600 with respect to XARELTO®; 13,000 with respect to body powders containing talc; 1,050 with respect to INVOKANA®; and 2,100 with respect to ETHICON PHYSIOMESH® Flexible Composite Mesh.
In August 2010, DePuy Orthopaedics, Inc. (DePuy) announced a worldwide voluntary recall of its ASR™ XL Acetabular System and DePuy ASR™ Hip Resurfacing System used in hip replacement surgery. Claims for personal injury have been made against DePuy and Johnson & Johnson. The number of pending lawsuits is expected to fluctuate as certain lawsuits are settled or dismissed and additional lawsuits are filed. Cases filed in federal courts in the United States have been organized as a multi-district litigation in the United States District Court for the Northern District of Ohio. Litigation has also been filed in countries outside of the United States, primarily in the United Kingdom, Canada, Australia, Ireland, Germany and Italy. In November 2013, DePuy reached an agreement with a Court-appointed committee of lawyers representing ASR Hip System plaintiffs to establish a program to settle claims with eligible ASR Hip patients in the United States who had surgery to replace their ASR Hips, known as revision surgery, as of August 31, 2013. DePuy reached additional agreements in February 2015 and March 2017, which further extended the settlement program to include ASR Hip patients who had revision surgeries after August 31, 2013 and prior to February 15, 2017. This settlement program has resolved more than 10,000 claims, therefore bringing to resolution significant ASR Hip litigation activity in the United States. However, lawsuits in the United States remain, and the settlement program does not address litigation outside of the United States. In Australia, a class action settlement was reached that resolved the claims of the majority of ASR Hip patients in that country. In Canada, the Company has reached agreements to settle two pending class actions which have been approved by the Québec Superior Court and the Supreme Court of British Columbia. The British Columbia order is currently the subject of an appeal. The Company continues to receive information with respect to potential additional costs associated with this recall on a worldwide basis. The Company has established accruals for the costs associated with the United States settlement program and DePuy ASR™ Hip-related product liability litigation.
Claims for personal injury have also been made against DePuy Orthopaedics, Inc. and Johnson & Johnson (collectively, DePuy) relating to the PINNACLE® Acetabular Cup System used in hip replacement surgery. The number of pending product liability lawsuits continues to increase, and the Company continues to receive information with respect to potential costs and the anticipated number of cases. Cases filed in federal courts in the United States have been organized as a multi-district litigation in the United States District Court for the Northern District of Texas. Litigation has also been filed in some state courts and in countries outside of the United States. Several adverse verdicts have been rendered against DePuy, one of which was reversed on appeal and remanded for retrial, the second remains under appeal and the third is pending decision on post-trial motions in the district court. The Company has established an accrual for product liability litigation associated with the PINNACLE® Acetabular Cup System. The Company is negotiating settlements of these cases and the related costs are reflected in the Company’s accruals.
Claims for personal injury have been made against Ethicon, Inc. (Ethicon) and Johnson & Johnson arising out of Ethicon's pelvic mesh devices used to treat stress urinary incontinence and pelvic organ prolapse. The Company continues to receive information with respect to potential costs and additional cases. Cases filed in federal courts in the United States have been organized as a multi-district litigation in the United States District Court for the Southern District of West Virginia. The Company has settled or otherwise resolved a majority of the United States cases and the costs associated with these settlements are reflected in the Company's accruals. In addition, class actions and individual personal injury cases or claims have been commenced in various countries outside of the United States, including claims and cases in the United Kingdom, the Netherlands and Belgium, and class actions in Israel, Australia and Canada, seeking damages for alleged injury resulting from Ethicon's pelvic mesh devices. In Australia, a trial of class action issues has been completed and the parties are awaiting a decision. The Company has established accruals with respect to product liability litigation associated with Ethicon's pelvic mesh products.
Following a June 2016 worldwide market withdrawal of ETHICON PHYSIOMESH® Flexible Composite Mesh, claims for personal injury have been made against Ethicon, Inc. and Johnson & Johnson alleging personal injury arising out of the use of this hernia mesh device. Cases filed in federal courts in the United States have been organized as a multi-district litigation (MDL) in the United States District Court for the Northern District of Georgia. A multi county litigation (MCL) has also been formed in New Jersey state court and assigned to Atlantic County for cases pending in New Jersey. Product liability lawsuits continue to be filed, and the Company continues to receive information with respect to potential costs and the anticipated number of cases. The Company has established accruals with respect to product liability litigation associated with ETHICON PHYSIOMESH® Flexible Composite Mesh.
Claims for personal injury have been made against Janssen Pharmaceuticals, Inc. and Johnson & Johnson arising out of the use of RISPERDAL®, indicated for the treatment of schizophrenia, acute manic or mixed episodes associated with bipolar I
| 85 |
disorder and irritability associated with autism, and related compounds. Lawsuits have been primarily filed in state courts in Pennsylvania, California, and Missouri. Other actions are pending in various courts in the United States and Canada. Product liability lawsuits continue to be filed, and the Company continues to receive information with respect to potential costs and the anticipated number of cases. The Company has settled or otherwise resolved many of the United States cases and the costs associated with these settlements are reflected in the Company's accruals.
Claims for personal injury arising out of the use of XARELTO®, an oral anticoagulant, have been made against Janssen Pharmaceuticals, Inc. (JPI); Johnson & Johnson; and JPI's collaboration partner for XARELTO® Bayer AG and certain of its affiliates. The number of pending product liability lawsuits continues to increase, and the Company continues to receive information with respect to potential costs and the anticipated number of cases. Cases filed in federal courts in the United States have been organized as a multi-district litigation in the United States District Court for the Eastern District of Louisiana. In addition, cases have been filed in state courts across the United States. Many of these cases have been consolidated into a state mass tort litigation in Philadelphia, Pennsylvania; and there are coordinated proceedings in Delaware, California and Missouri. Class action lawsuits also have been filed in Canada. The Company has established an accrual for defense costs only in connection with product liability litigation associated with XARELTO®.
Personal injury claims alleging that talc causes cancer have been made against Johnson & Johnson Consumer Inc. and Johnson & Johnson arising out of the use of body powders containing talc, primarily JOHNSONS® Baby Powder. The number of pending product liability lawsuits continues to increase, and the Company continues to receive information with respect to potential costs and the anticipated number of cases. Lawsuits have been primarily filed in state courts in Missouri, New Jersey and California. Cases filed in federal courts in the United States have been organized as a multi-district litigation in the United States District Court for the District of New Jersey. The Company has successfully defended a number of these cases but there have been verdicts against the Company, including a verdict in July 2018 of $4.7 billion. The Company believes that it has strong grounds on appeal to overturn these verdicts. The Company has established an accrual for defense costs only in connection with product liability litigation associated with body powders containing talc.
In February 2018, a securities class action lawsuit was filed against Johnson & Johnson and certain named officers in the United States District Court for the District of New Jersey, alleging that Johnson & Johnson violated the federal securities laws by failing to adequately disclose the alleged asbestos contamination in body powders containing talc, primarily JOHNSON'S® Baby Powder, and that purchasers of Johnson & Johnson’s shares suffered losses as a result. Plaintiffs are seeking damages. In October 2018, a shareholder derivative lawsuit was filed against Johnson & Johnson as the nominal defendant and its current directors as defendants in the United States District Court for the District of New Jersey, alleging a breach of fiduciary duties related to the alleged asbestos contamination in body powders containing talc, primarily JOHNSON’S® Baby Powder, and that Johnson & Johnson has suffered damages as a result of those alleged breaches. Plaintiff is seeking damages and an order for the Company to reform its internal policies and procedures. In January 2019, two ERISA class action lawsuits were filed by participants in the Johnson & Johnson Savings Plan against Johnson & Johnson, its Pension and Benefits Committee, and certain named officers in the United States District Court for the District of New Jersey, alleging that the defendants breached their fiduciary duties by offering Johnson & Johnson stock as a Johnson & Johnson Savings Plan investment option when it was imprudent to do so because of failures to disclose alleged asbestos contamination in body powders containing talc, primarily JOHNSON’S® Baby Powder. Plaintiffs are seeking damages and injunctive relief. Each of these matters will be adjudicated in conjunction with the multi-district litigation referenced in the prior paragraph. In addition, the Company has received preliminary inquiries and subpoenas to produce documents regarding these matters from Senator Murray, a member of the Senate Committee on Health, Education, Labor and Pensions, the Department of Justice and the Securities and Exchange Commission. The Company is cooperating with these government inquiries and will be producing documents in response.
Claims for personal injury have been made against a number of Johnson & Johnson companies, including Janssen Pharmaceuticals, Inc. and Johnson & Johnson, arising out of the use of INVOKANA®, a prescription medication indicated to improve glycemic control in adults with Type 2 diabetes. Lawsuits filed in federal courts in the United States have been organized as a multi-district litigation in the United States District Court for the District of New Jersey. Cases have also been filed in state courts in Pennsylvania, California and New Jersey. Class action lawsuits have been filed in Canada. Product liability lawsuits continue to be filed, and the Company continues to receive information with respect to potential costs and the anticipated number of cases. The Company has settled or otherwise resolved many of the cases and claims in the United States and the costs associated with these settlements are reflected in the Company's accruals.
| 86 |
INTELLECTUAL PROPERTY
Certain subsidiaries of Johnson & Johnson are subject, from time to time, to legal proceedings and claims related to patent, trademark and other intellectual property matters arising out of their businesses. Many of these matters involve challenges to the coverage and/or validity of the patents on various products and allegations that certain of the Company’s products infringe the patents of third parties. Although these subsidiaries believe that they have substantial defenses to these challenges and allegations with respect to all significant patents, there can be no assurance as to the outcome of these matters. A loss in any of these cases could adversely affect the ability of these subsidiaries to sell their products, result in loss of sales due to loss of market exclusivity, require the payment of past damages and future royalties, and may result in a non-cash impairment charge for any associated intangible asset. The most significant of these matters are described below.
Medical Devices
In June 2009, Rembrandt Vision Technologies, L.P. (Rembrandt) filed a patent infringement lawsuit against Johnson & Johnson Vision Care, Inc. (JJVCI) in the United States District Court for the Eastern District of Texas alleging that JJVCI's manufacture and sale of its ACUVUE® ADVANCE and ACUVUE OASYS® Hydrogel Contact Lenses infringed Rembrandt’s United States Patent No. 5,712,327 and seeking monetary relief. The case was transferred to the United States District Court for the Middle District of Florida, where a trial in May 2012 resulted in a verdict of non-infringement that was subsequently upheld on appeal. In July 2014, Rembrandt sought a new trial based on alleged new evidence, which the district court denied. In April 2016, the Court of Appeals overturned that ruling and remanded the case to the district court for a new trial. A new trial was held in August 2017, and the jury returned a verdict of non-infringement in favor of JJVCI. Rembrandt has appealed the verdict to the United States Court of Appeals for the Federal Circuit (CAFC). In February 2019, the CAFC affirmed the judgment in favor of JJVCI.
In March 2013, Medinol Ltd. (Medinol) filed a patent infringement lawsuit against Cordis Corporation (Cordis) and Johnson & Johnson in the United States District Court for the Southern District of New York alleging that Cordis’s sales of the CYPHER™ and CYPHER SELECT™ stents made in the United States since 2005 willfully infringed four of Medinol's patents directed to the geometry of articulated stents. Medinol is seeking damages and attorneys’ fees. Although Johnson & Johnson has since sold Cordis, it has retained liability for this case. After trial in January 2014, the district court dismissed the case, finding Medinol unreasonably delayed bringing its claims (the laches defense). In September 2014, the district court denied a motion by Medinol to vacate the judgment and grant it a new trial. Medinol appealed the decision to the United States Court of Appeals for the Federal Circuit. In March 2017, the United States Supreme Court held that the laches defense is not available in patent cases. In April 2018, the United States Court of Appeals for the Federal Circuit remanded the case back to the district court to reconsider Medinol’s motion for a new trial, and briefing in the district court was completed in June 2018.
In November 2016, MedIdea, L.L.C. (MedIdea) filed a patent infringement lawsuit against DePuy Orthopaedics, Inc. in the United States District Court for the Northern District of Illinois alleging infringement by the ATTUNE® Knee System. In April 2017, MedIdea filed an amended complaint adding DePuy Synthes Products, Inc. and DePuy Synthes Sales, Inc. as named defendants. MedIdea alleges infringement of United States Patent Nos. 6,558,426 (’426); 8,273,132 (’132); 8,721,730 (’730) and 9,492,280 (’280) relating to posterior stabilized knee systems. Specifically, MedIdea alleges that the SOFCAMTM Contact feature of the ATTUNE® posterior stabilized knee products infringes the patents-in-suit. MedIdea is seeking monetary damages and injunctive relief. In June 2017, the case was transferred to the United States District Court for the District of Massachusetts. A claim construction hearing was held in October 2018, and a claim construction order was issued in November 2018. In December 2018, MedIdea stipulated to non-infringement of the ’132, ’730 and ’280 patents, based on the district court’s claim construction and reserving its right to appeal that construction, leaving only the ’426 patent at issue before the district court. In January 2019, the district court stayed the case pending a decision in the Inter Partes Review proceeding on the ’426 patent (see below). In December 2017, DePuy Synthes Products, Inc. filed a Petition for Inter Partes Review with the United States Patent and Trademark Office (USPTO), seeking to invalidate the two claims of the ’426 patent asserted in the district court litigation, and in June 2018, the USPTO instituted review of those claims. A hearing trial is scheduled for March 2019, and a decision in the proceeding is due by June 2019.
In December 2016, Ethicon Endo-Surgery, Inc. and Ethicon Endo-Surgery, LLC (now known as Ethicon LLC) sued Covidien, Inc. in the United States District Court for the District of Massachusetts seeking a declaration that United States Patent Nos. 6,585,735 (the ’735 patent); 7,118,587; 7,473,253; 8,070,748 and 8,241,284 (the ’284 patent), are either invalid or not infringed by Ethicon’s ENSEAL® X1 Large Jaw Tissue Sealer product. In April 2017, Covidien LP, Covidien Sales LLC, and Covidien AG (collectively, Covidien) answered and counterclaimed, denying the allegations, asserting willful infringement of the ’735 patent, the ’284 patent and United States Patent Nos. 8,323,310 (the ’310 patent); 9,084,608; 9,241,759 (the ’759 patent) and 9,113,882, and seeking damages and an injunction. Covidien filed a motion for preliminary injunction, which was denied in
| 87 |
October 2017. The parties have entered joint stipulations such that only the ’735 patent, the ’310 patent and the ’759 patent remain in dispute. Trial is scheduled to begin in September 2019.
In November 2017, Board of Regents, The University of Texas System and Tissuegen, Inc. (collectively, UT) filed a lawsuit in the United States District Court for the Western District of Texas against Ethicon, Inc. and Ethicon US, LLC alleging the manufacture and sale of VICRYL® Plus Antibacterial Sutures, MONOCRYL® Plus Antibacterial Sutures, PDS® Plus Antibacterial Sutures, STRATAFIX® POS® Antibacterial Sutures and STRATAFIX® MONOCRYL®Plus Antibacterial Sutures infringe plaintiffs’ United States Patent Nos. 6,596,296 and 7,033,603 directed to implantable polymer drug releasing biodegradable fibers containing a therapeutic agent. UT is seeking damages and an injunction. In December 2018, Ethicon filed petitions with the USPTO, seeking Inter Partes Review (IPR) of both asserted patents. Those petitions have been stayed by the USPTO pending a decision by the U.S. Court of Appeals for the Federal Circuit in an unrelated case.
Pharmaceutical
In April 2016, MorphoSys AG, a German biotech company, filed a patent infringement lawsuit against Janssen Biotech, Inc. (JBI), Genmab U.S. Inc. and Genmab A/S (collectively, Genmab) in the United States District Court for the District of Delaware. MorphoSys alleged that JBI’s manufacture and sale of DARZALEX® (daratumumab) willfully infringed MorphoSys’ United States Patent Nos. 8,263,746, 9,200,061 and 9,785,590. MorphoSys sought money damages. JBI licenses patents and the commercial rights to DARZALEX® from Genmab. In January 2019, the district court granted summary judgment in JBI and Genmab’s favor, invalidating the asserted claims of the patents-in-suit, and the parties filed a joint stipulation of dismissal of the action.
In August 2016, Sandoz Ltd and Hexal AG (collectively, Sandoz) filed a lawsuit in the English High Court against G.D. Searle LLC, a Pfizer company (Searle) and Janssen Sciences Ireland UC (JSI) alleging that Searle’s supplementary protection certificate SPC/GB07/038 (SPC), which is exclusively licensed to JSI, is invalid and should be revoked. Janssen-Cilag Limited sells PREZISTA® (darunavir) in the United Kingdom pursuant to this license. In October 2016, Searle and JSI counterclaimed against Sandoz for threatened infringement of the SPC based on statements of its plans to launch generic darunavir in the United Kingdom. Sandoz admitted that its generic darunavir product would infringe the SPC if it is found valid. Searle and JSI are seeking an order enjoining Sandoz from marketing its generic darunavir before the expiration of the SPC. Following a trial in April 2017, the court entered a decision holding that the SPC is valid and granting a final injunction. Sandoz has appealed the court’s decision and the injunction is stayed pending the appeal. In January 2018, the court referred the issue on appeal to the Court of Justice for the European Union (CJEU) and stayed the proceedings pending the CJEU’s ruling on the issue.
In April 2018, Acerta Pharma B.V., AstraZeneca UK Ltd and AstraZeneca Pharmaceuticals LP filed a patent infringement lawsuit in the United States District Court for the District of Delaware against Pharmacylics LLC and Abbvie Inc. (collectively, Abbvie), alleging that the manufacture and sale of IMBRUVICA® infringes U.S. Patent No. 7,459,554. Janssen Biotech, Inc., which commercializes IMBRUVICA® jointly with Abbvie, intervened in the action in November 2018. A trial is scheduled to begin in January 2021.
REMICADE® Related Cases
In August 2014, Celltrion Healthcare Co. Ltd. and Celltrion Inc. (collectively, Celltrion) filed an application with the United States Food and Drug Administration (FDA) for approval to make and sell its own infliximab biosimilar. In March 2015, Janssen Biotech, Inc. (JBI) filed a lawsuit in the United States District Court for the District of Massachusetts against Celltrion and Hospira Healthcare Corporation (Hospira), which has exclusive marketing rights for Celltrion’s infliximab biosimilar in the United States, seeking, among other things, a declaratory judgment that their biosimilar product infringes or potentially infringes several JBI patents, including United States Patent No. 6,284,471 relating to REMICADE® (infliximab) (the ’471 patent) and United States Patent No. 7,598,083 (the ’083 patent) directed to the cell culture media used to make Celltrion’s biosimilar. In August 2016, the district court granted both Celltrion’s and Hospira’s motions for summary judgment of invalidity of the ’471 patent. JBI appealed those decisions to the United States Court of Appeals for the Federal Circuit. In January 2018, the Federal Circuit dismissed the appeal as moot based on its affirmance of a decision by the USPTO’s Patent Trial and Appeal Board affirming invalidity of the ’471 patent.
In June 2016, JBI filed two additional patent infringement lawsuits asserting the ’083 patent, one against Celltrion and Hospira in the United States District Court for the District of Massachusetts and the other against HyClone Laboratories, Inc., the manufacturer of the cell culture media that Celltrion uses to make its biosimilar product, in the United States District Court for the District of Utah. On July 30, 2018 the district court granted Celltrion’s motion for summary judgment of non-infringement and entered an order dismissing the ’083 lawsuit against Celltrion and Hospira. JBI appealed to the United States Court of
| 88 |
Appeals for the Federal Circuit. The litigation against HyClone in Utah is stayed pending the outcome of the Massachusetts actions.
The FDA approved the first infliximab biosimilar for sale in the United States in 2016, and a number of such products have been launched.
Litigation Against Filers of Abbreviated New Drug Applications (ANDAs)
The following summarizes lawsuits pending against generic companies that have filed Abbreviated New Drug Applications (ANDAs) with the FDA or undertaken similar regulatory processes outside of the United States, seeking to market generic forms of products sold by various subsidiaries of Johnson & Johnson prior to expiration of the applicable patents covering those products. These ANDAs typically include allegations of non-infringement and invalidity of the applicable patents. In the event the subsidiaries are not successful in an action, or the automatic statutory stay of the ANDAs expires before the United States District Court rulings are obtained, the third-party companies involved would have the ability, upon approval of the FDA, to introduce generic versions of their products to the market, resulting in the potential for substantial market share and revenue losses for the applicable products, and which may result in a non-cash impairment charge in any associated intangible asset. In addition, from time to time, subsidiaries may settle these types of actions and such settlements can involve the introduction of generic versions of the products at issue to the market prior to the expiration of the relevant patents. The Inter Partes Review (IPR) process with the United States Patent and Trademark Office (USPTO), created under the 2011 America Invents Act, is also being used at times by generic companies in conjunction with ANDAs and lawsuits, to challenge the applicable patents.
ZYTIGA®
In July 2015, Janssen Biotech, Inc., Janssen Oncology, Inc. and Janssen Research & Development, LLC (collectively, Janssen) and BTG International Ltd. (BTG) initiated a patent infringement lawsuit in the United States District Court for the District of New Jersey against a number of generic companies (and certain of their affiliates and/or suppliers) who filed ANDAs seeking approval to market a generic version of ZYTIGA® 250mg before the expiration of United States Patent No. 8,822,438 (the ’438 patent). The generic companies include Amneal Pharmaceuticals, LLC and Amneal Pharmaceuticals of New York, LLC (collectively, Amneal); Apotex Inc. and Apotex Corp. (collectively, Apotex); Citron Pharma LLC (Citron); Dr. Reddy’s Laboratories, Ltd. and Dr. Reddy’s Laboratories, Inc. (collectively, Dr. Reddy’s); Mylan Pharmaceuticals Inc. and Mylan Inc. (collectively, Mylan); Par Pharmaceuticals, Inc. and Par Pharmaceutical Companies, Inc. (collectively, Par); Sun Pharmaceutical Industries Ltd. and Sun Pharmaceuticals Industries, Inc. (collectively, Sun); Teva Pharmaceuticals USA, Inc. (Teva); Wockhardt Bio A.G.; Wockhardt USA LLC and Wockhardt Ltd. (collectively, Wockhardt); West-Ward Pharmaceutical Corp. (West-Ward) and Hikma Pharmaceuticals, LLC (Hikma).
Janssen and BTG also initiated patent infringement lawsuits in the United States District Court for the District of New Jersey against Amerigen Pharmaceuticals Limited (Amerigen) in May 2016, and Glenmark Pharmaceuticals, Inc. (Glenmark) in June 2016, each of whom filed an ANDA seeking approval to market its generic version of ZYTIGA® before the expiration of the ’438 patent. These lawsuits have been consolidated with the lawsuit filed in July 2015.
In August 2015, Janssen and BTG filed an additional jurisdictional protective lawsuit against the Mylan defendants in the United States District Court for the Northern District of West Virginia, which has been stayed.
In August 2017, Janssen and BTG initiated a patent infringement lawsuit in the United States District Court for the District of New Jersey against Teva, who filed an ANDA seeking approval to market a generic version of ZYTIGA® 500mg before the expiration of the ’438 patent. This lawsuit has been consolidated with the lawsuit filed in July 2015.
In February 2018, Janssen and BTG filed a patent infringement lawsuit against MSN Pharmaceuticals, Inc. and MSN Laboratories Private Limited (collectively, MSN) in United States District Court for the District of New Jersey based on its ANDA seeking approval for a generic version of ZYTIGA® prior to the expiration of the ’438 patent.
In November 2018, Janssen and BTG initiated a patent infringement lawsuit in the United States District Court for the District of New Jersey against Qilu Pharmaceutical Co., Ltd. and Qilu Pharma, Inc. (collectively, Qilu), who filed an ANDA seeking approval to market a generic version of ZYTIGA® before the expiration of the ’438 patent.
In December 2017, Janssen and BTG entered into a settlement agreement with Glenmark. In January 2018, Janssen dismissed its lawsuit against Sun after it withdrew its ANDA. In April 2018, Janssen and BTG entered into a settlement agreement with Apotex.
| 89 |
In October 2018, the United States District Court for the District of New Jersey issued a ruling invalidating all asserted claims of the ’438 patent. The court held that the patent claims would be infringed if the patent were valid. Janssen appealed the court’s decision.
In November 2018, the United States Court of Appeals for the Federal Circuit denied Janssen’s request for an injunction pending appeal. As a result, several generic versions of ZYTIGA® have entered the market. Janssen has appealed the decision of the United States District Court for the District of New Jersey, and the oral argument on the appeal is scheduled for March 2019.
The lawsuits against MSN and Qilu remain pending in the district courts. In each of these lawsuits, Janssen is seeking an order enjoining the defendants from marketing their generic versions of ZYTIGA® before the expiration of the ’438 patent.
Several generic companies including Amerigen, Argentum Pharmaceuticals LLC (Argentum), Mylan, Wockhardt, Actavis, Amneal, Dr. Reddy’s, Sun, Teva, West-Ward and Hikma filed Petitions for Inter Partes Review (IPR) with the USPTO, seeking to invalidate the ’438 patent. In January 2018, the USPTO issued decisions finding the ’438 patent claims unpatentable, and Janssen requested rehearing. In December 2018, the USPTO denied Janssen’s request for rehearing of the IPR decisions. Janssen filed an appeal, which was consolidated with the above-mentioned appeal of the decision of the United States District Court for the District of New Jersey.
In October 2017, Janssen Inc. and Janssen Oncology, Inc. (collectively, Janssen) initiated two Notices of Application under Section 6 of the Patented Medicines (Notice of Compliance) Regulations against Teva Canada Limited (Teva) and the Minister of Health in Canada in response to Teva's filing Abbreviated New Drug Submissions (ANDS) and seeking approval to market generic versions of ZYTIGA® 250mg and ZYTIGA® 500mg before the expiration of Canadian Patent No. 2,661,422. In June 2018, the parties entered into a settlement agreement.
In November 2017, Janssen initiated a Notice of Application under Section 6 of the Patented Medicines (Notice of Compliance) Regulations against Apotex Inc. (Apotex) and the Minister of Health in Canada in response to Apotex’s filing of an Abbreviated New Drug Submission (ANDS) seeking approval to market a generic version of ZYTIGA® before the expiration of Canadian Patent No. 2,661,422. The federal court of Canada scheduled the Final Hearing for April 2019. Janssen is seeking an order prohibiting the Minister of Health from issuing a Notice of Compliance with respect to Apotex’s ANDS before the expiration of Janssen’s patent.
In January 2019, Janssen initiated a Notice of Application under Section 6 of the Patented Medicines (Notice of Compliance) Regulations against Apotex and the Minister of Health in Canada in response to Apotex’s filing of an Abbreviated New Drug Submission (ANDS) seeking approval to market a film-coated generic version of ZYTIGA® before the expiration of Canadian Patent No. 2,661,422. Janssen is seeking an order prohibiting the Minister of Health from issuing a Notice of Compliance with respect to Apotex’s ANDS before the expiration of Janssen’s patent.
XARELTO®
Beginning in October 2015, Janssen Pharmaceuticals, Inc. (JPI) and Bayer Pharma AG and Bayer Intellectual Property GmbH (collectively, Bayer) filed patent infringement lawsuits in the United States District Court for the District of Delaware against a number of generic companies who filed ANDAs seeking approval to market generic versions of XARELTO® before expiration of Bayer’s United States Patent Nos. 7,157,456, 7,585,860 and 7,592,339 relating to XARELTO®. JPI is the exclusive sublicensee of the asserted patents. The following generic companies are named defendants: Aurobindo Pharma Limited and Aurobindo Pharma USA, Inc. (collectively, Aurobindo); Breckenridge Pharmaceutical, Inc. (Breckenridge); InvaGen Pharmaceuticals Inc. (InvaGen); Micro Labs USA Inc. and Micro Labs Ltd (collectively, Micro); Mylan Pharmaceuticals Inc. (Mylan); Prinston Pharmaceuticals, Inc.; Sigmapharm Laboratories, LLC (Sigmapharm); Torrent Pharmaceuticals, Limited and Torrent Pharma Inc. (collectively, Torrent). Trial concluded in April 2018. In July 2018 the district court entered judgment against Mylan and Sigmapharm, holding that the asserted compound patent is valid and infringed. In September 2018, the district court entered judgment against the remaining defendants. None of the defendants appealed the judgment.
Beginning in April 2017, JPI and Bayer Intellectual Property GmbH and Bayer AG (collectively, Bayer AG) filed patent infringement lawsuits in the United States District Court for the District of Delaware against a number of generic companies who filed ANDAs seeking approval to market generic versions of XARELTO® before expiration of Bayer AG’s United States Patent No. 9,539,218 (’218) relating to XARELTO®. JPI is the exclusive sublicensee of the asserted patent. The following generic companies are named defendants: Alembic Pharmaceuticals Limited, Alembic Global Holding SA and Alembic Pharmaceuticals, Inc. (Alembic); Aurobindo; Breckenridge; InvaGen; Lupin Limited and Lupin Pharmaceuticals, Inc.
| 90 |
(collectively, Lupin); Micro; Mylan; Sigmapharm; Taro Pharmaceutical Industries Ltd. and Taro Pharmaceuticals U.S.A., Inc. (collectively, Taro) and Torrent. Lupin counterclaimed for declaratory judgment of noninfringement and invalidity of United States Patent No. 9,415,053, but Lupin dismissed its counterclaims after it was provided a covenant not to sue on that patent. Aurobindo, Taro, Torrent, Micro, Breckenridge, InvaGen, Sigmapharm, Lupin and Alembic have agreed to have their cases stayed and to be bound by the outcome of any final judgment rendered against any of the other defendants. The ’218 cases have been consolidated for discovery and trial, and are currently set for trial in April 2019.
In December 2018, JPI and Bayer AG filed a patent infringement lawsuit in the United States District Court for the District of Delaware against Teva Pharmaceuticals USA, Inc. and Teva Pharmaceutical Industries Ltd. (collectively, Teva) who filed an ANDA seeking approval to market a generic version of XARELTO® before expiration of Bayer AG’s ’218 patent.
In each of these lawsuits, JPI is seeking an order enjoining the defendants from marketing their generic versions of XARELTO® before the expiration of the relevant patents.
In May 2018, Mylan filed a Petition for Inter Partes Review with the USPTO, seeking to invalidate the ’218 patent. In December 2018, the USPTO issued a decision denying institution of Mylan’s Petition for Inter Partes Review.
PREZISTA®
In May 2018, Janssen Products, L.P. and Janssen Sciences Ireland UC (collectively, Janssen) initiated a patent infringement lawsuit in the United States District Court for the District of New Jersey against Dr. Reddys Laboratories, Inc., Dr. Reddys Laboratories, Ltd., Laurus Labs, Ltd. and Pharmaq, Inc. (collectively, DRL) who filed an ANDA seeking approval to market generic versions of PREZISTA® before the expiration of United States Patent Nos. 8,518,987; 7,126,015; and 7,595,408. Trial is scheduled to begin in May 2020.
In December 2018, Janssen initiated a patent infringement lawsuit in the United States District Court for the District of New Jersey against Amneal Pharmaceuticals, LLC, Amneal Pharmaceuticals Company GmbH, Amneal Pharmaceuticals of New York, LLC, Amneal Pharmaceuticals Pvt Ltd., and Raks Pharma Pvt. Ltd. (collectively, Amneal), who filed an ANDA seeking approval to market generic versions of PREZISTA® before the expiration of United States Patent Nos. 8,518,987; 7,126,015; and 7,595,408.
In each of these lawsuits, Janssen is seeking an order enjoining the defendants from marketing its generic versions of PREZISTA® before the expiration of the relevant patents.
INVOKANA®/INVOKAMET®
Beginning in July 2017, Janssen Pharmaceuticals, Inc., Janssen Research & Development, LLC, Cilag GmbH International and Janssen Pharmaceutica NV (collectively, Janssen) and Mitsubishi Tanabe Pharma Corporation (MTPC) filed patent infringement lawsuits in the United States District Court for the District of New Jersey, the United States District Court for the District of Colorado and the United States District Court for the District of Delaware against a number of generic companies who filed ANDAs seeking approval to market generic versions of INVOKANA® and/or INVOKAMET® before expiration of MTPC’s United States Patent Nos. 7,943,582 and/or 8,513,202 relating to INVOKANA® and INVOKAMET®. Janssen is the exclusive licensee of the asserted patents. The following generic companies are named defendants: Apotex Inc. and Apotex Corp. (Apotex); Aurobindo Pharma USA Inc. (Aurobindo); Macleods Pharmaceuticals Ltd. and Macleods Pharma USA, Inc.; InvaGen Pharmaceuticals, Inc. (InvaGen); Prinston Pharmaceuticals Inc.; Dr. Reddy’s Laboratories, Inc. and Dr. Reddy’s Laboratories Ltd; Hetero USA, Inc., Hetero Labs Limited Unit-V and Hetero Labs Limited; MSN Laboratories Private Ltd. and MSN Pharmaceuticals, Inc.; Laurus Labs Ltd.; Indoco Remedies Ltd.; Zydus Pharmaceuticals (USA) Inc. (Zydus); Sandoz, Inc. (Sandoz); Teva Pharmaceuticals USA, Inc.; and Lupin Ltd. and Lupin Pharmaceuticals, Inc.
Beginning in July 2017, Janssen and MTPC filed patent infringement lawsuits in the United States District Court for the District of New Jersey and the United States District Court for the District of Colorado against Sandoz and InvaGen, who filed ANDAs seeking approval to market generic versions of INVOKANA® and/or INVOKAMET® before expiration of MTPC’s United States Patent No. 7,943,788 (the ’788 patent) relating to INVOKANA® and INVOKAMET® and against Zydus, who filed ANDAs seeking approval to market generic versions of INVOKANA® and INVOKAMET® before expiration of the ’788 patent, MTPC's United States Patent No. 8,222,219 relating to INVOKANA® and INVOKAMET® and MTPC’s United States Patent No. 8,785,403 relating to INVOKAMET®, and against Aurobindo, who filed an ANDA seeking approval to market a generic version of INVOKANA® before expiration of the ’788 patent and the ’219 patent relating to INVOKANA®.
| 91 |
Janssen is the exclusive licensee of the asserted patents. In October 2017, the Colorado lawsuits against Sandoz were dismissed. In December 2017, the Delaware lawsuits against Apotex and Teva were dismissed.
In April 2018, Janssen and MTPC filed a patent infringement lawsuit in the United States District Court for the District of New Jersey against Prinston, who filed an ANDA seeking approval to market a generic version of INVOKANA® before expiration of the ’788 patent relating to INVOKANA®.
In each of these lawsuits, Janssen and MTPC are seeking an order enjoining the defendants from marketing their generic versions of INVOKANA® and/or INVOKAMET® before the expiration of the relevant patents.
OPSUMIT®
In January 2018, Actelion Pharmaceuticals Ltd (Actelion) initiated a patent infringement lawsuit in the United States District Court for the District of New Jersey against Zydus Pharmaceuticals (USA) Inc. (Zydus) and Amneal Pharmaceuticals LLC (Amneal), each of whom filed an ANDA seeking approval to market a generic version of OPSUMIT® before the expiration of United States Patent No. 7,094,781. In the lawsuit, Actelion is seeking an order enjoining Zydus and Amneal from marketing generic versions of OPSUMIT® before the expiration of the patent. In December 2018, the district court entered an order wherein one of the defendants, Amneal, stipulated to infringement. Trial is scheduled to commence in October 2020.
INVEGA SUSTENNA®
In January 2018, Janssen Pharmaceutica NV and Janssen Pharmaceuticals, Inc. (collectively, Janssen) initiated a patent infringement lawsuit in the United States District Court for the District of New Jersey against Teva Pharmaceuticals USA, Inc. (Teva), who filed an ANDA seeking approval to market a generic version of INVEGA SUSTENNA® before the expiration of United States Patent No. 9,439,906. In the lawsuit, Janssen is seeking an order enjoining Teva from marketing a generic version of INVEGA SUSTENNA® before the expiration of the patent.
In February 2018, Janssen Inc. and Janssen Pharmaceutica NV (collectively, Janssen) initiated a Notices of Application under Section 6 of the Patented Medicines (Notice of Compliance) Regulations against Teva Canada Limited (Teva) and the Minister of Health in response to Teva's filing of an Abbreviated New Drug Submission (ANDS) seeking approval to market a generic version of INVEGA SUSTENNA® before the expiration of Canadian Patent Nos. 2,309,629 and 2,655,335. Janssen is seeking an order prohibiting the Minister of Health from issuing a Notice of Compliance with respect to Teva’s ANDS before the expiration of these patents. The Final Hearing is scheduled to begin in September 2019.
IMBRUVICA®
Beginning in January 2018, Pharmacyclics LLC (Pharmacyclics) and Janssen Biotech, Inc. (JBI) filed patent infringement lawsuits in the United States District Court for the District of Delaware against a number of generic companies who filed ANDAs seeking approval to market generic versions of IMBRUVICA® before expiration of Pharmacyclics’ United States Patent Nos. 8,008,309, 7,514,444, 8,697,711, 8,735,403, 8,957,079, 9,181,257, 8,754,091, 8,497,277, 8,925,015, 8,476,284, 8,754,090, 8,999,999, 9,125,889, 9,801,881, 9,801,883, 9,814,721, 9,795,604, 9,296,753, 9,540,382, 9,713,617 and/or 9,725,455 relating to IMBRUVICA®. JBI is the exclusive licensee of the asserted patents. The following generic companies are named defendants: Cipla Limited and Cipla USA Inc. (Cipla); Fresenius Kabi USA, LLC, Fresenius Kabi USA, Inc., and Fresenius Kabi Oncology Limited (Fresenius Kabi); Sandoz Inc. and Lek Pharmaceuticals d.d. (Sandoz); Shilpa Medicare Limited (Shilpa); Sun Pharma Global FZE and Sun Pharmaceutical Industries Limited (Sun); Teva Pharmaceuticals USA, Inc. (Teva); and Zydus Worldwide DMCC and Cadila Healthcare Limited (Zydus). Trial is scheduled to begin in October 2020.
In October 2018, Pharmacyclics and JBI filed a patent infringement lawsuit in the United States District Court for the District of Delaware against Sun asserting newly issued United States Patent No. 10,004,746.
In each of the lawsuits, Pharmacyclics and JBI are seeking an order enjoining the defendants from marketing generic versions of IMBRUVICA® before the expiration of the relevant patents.
In January 2019, Pharmacyclics and JBI amended their complaints against Fresenius Kabi, Zydus, Teva and Sandoz to further allege infringement of U.S. Patent Nos. 10,106,548, and 10,125,140.
In January 2019, Pharmacyclics and JBI filed a patent infringement lawsuit in the United States District Court for the District of Delaware against Zydus, who filed an ANDA seeking approval to market a generic version of IMBRUVICA® 70 mg before the
| 92 |
expiration of U.S. Patent Nos. 514,444, 8,003,309, 8,476,284, 8,497,277, 8,697,711, 8,753,403, 8,754,090, 8,754,091, 8,952,015, 8,957,079, 9,181,257, 9,296,753, 9,540,382, 9,713,617, 9,725,455, 10,106,548, and 10,125,140.
GOVERNMENT PROCEEDINGS
Like other companies in the pharmaceutical and medical devices industries, Johnson & Johnson and certain of its subsidiaries are subject to extensive regulation by national, state and local government agencies in the United States and other countries in which they operate. As a result, interaction with government agencies is ongoing. The most significant litigation brought by, and investigations conducted by, government agencies are listed below. It is possible that criminal charges and substantial fines and/or civil penalties or damages could result from government investigations or litigation.
Average Wholesale Price (AWP) Litigation
Johnson & Johnson and several of its pharmaceutical subsidiaries (the J&J AWP Defendants), along with numerous other pharmaceutical companies, were named as defendants in a series of lawsuits in state and federal courts involving allegations that the pricing and marketing of certain pharmaceutical products amounted to fraudulent and otherwise actionable conduct because, among other things, the companies allegedly reported an inflated Average Wholesale Price (AWP) for the drugs at issue. Payors alleged that they used those AWPs in calculating provider reimbursement levels. The plaintiffs in these cases included three classes of private persons or entities that paid for any portion of the purchase of the drugs at issue based on AWP, and state government entities that made Medicaid payments for the drugs at issue based on AWP. Many of these cases, both federal actions and state actions removed to federal court, were consolidated for pre-trial purposes in a multi-district litigation in the United States District Court for the District of Massachusetts, where all claims against the J&J AWP Defendants were ultimately dismissed. The J&J AWP Defendants also prevailed in a case brought by the Commonwealth of Pennsylvania. Other AWP cases have been resolved through court order or settlement. Two cases remain pending. In a case brought by Illinois, trial has been scheduled for March 2019. In New Jersey, a putative class action based upon AWP allegations is pending against Centocor, Inc. and Ortho Biotech Inc. (both now Janssen Biotech, Inc.), Johnson & Johnson and ALZA Corporation.
Opioids Litigation
Beginning in 2014 and continuing to the present, Johnson & Johnson and Janssen Pharmaceuticals, Inc. (JPI), along with other pharmaceutical companies, have been named in more than 1,600 lawsuits brought by certain state and local governments related to the marketing of opioids, including DURAGESIC®, NUCYNTA® and NUCYNTA® ER. To date, complaints against pharmaceutical companies, including Johnson & Johnson and JPI, have been filed in state court by the state Attorneys General in Arkansas, Florida, Kentucky, Louisiana, Mississippi, Missouri, New Hampshire, New Jersey, New Mexico, Ohio, Oklahoma and South Dakota. Complaints against the manufacturers also have been filed in state or federal court by city, county and local government agencies in the following states: Alabama; Arkansas; California; Connecticut; Florida; Georgia; Illinois; Kentucky; Louisiana; Maine; Maryland; Massachusetts; Mississippi; Missouri; Nevada; New Hampshire; New Jersey; New Mexico; New York; North Carolina; Ohio; Oklahoma; Oregon; Pennsylvania; Rhode Island; South Carolina; South Dakota; Tennessee; Texas; Utah; Virginia; Washington; West Virginia and Wisconsin. The Government of Puerto Rico filed suit in Superior Court of San Juan. In addition, the Province of British Columbia filed suit in Canada. These actions allege a variety of claims related to opioids marketing practices, including false advertising, unfair competition, public nuisance, consumer fraud violations, deceptive acts and practices, false claims and unjust enrichment. The suits generally seek penalties and/or injunctive and monetary relief and, in some of the suits, the plaintiffs are seeking joint and several liability among the defendants. These cases are in early stages of litigation. In October 2017, Johnson & Johnson and JPI were both served with a motion to consolidate 66 pending matters into a federal Multi District Litigation in the Southern District of Ohio. In December 2017, the MDL was approved in the Northern District of Ohio and there are over 1,400 cases that have been transferred to the MDL.
Johnson & Johnson, JPI and other pharmaceutical companies have also received subpoenas or requests for information related to opioids marketing practices from the following state Attorneys General: Alaska, Indiana, Montana, New Hampshire, South Carolina, Tennessee, Texas and Washington. In September 2017, Johnson & Johnson and JPI were contacted by the Texas and Colorado Attorney General’s Offices on behalf of approximately 38 states regarding a multi-state Attorney General investigation. The multi-state coalition served Johnson & Johnson and JPI with subpoenas as part of the investigation. Johnson & Johnson and JPI have also received requests for information from the ranking minority member of the United States Senate Committee on Homeland Security and Governmental Affairs regarding the sales, marketing, and educational strategies related to the promotion of opioids use.
Other
| 93 |
In August 2012, DePuy Orthopaedics, Inc., DePuy, Inc. (now known as DePuy Synthes, Inc.), and Johnson & Johnson Services, Inc. (collectively DePuy) received an informal request from the United States Attorney's Office for the District of Massachusetts and the Civil Division of the United States Department of Justice (the United States) for the production of materials relating to the DePuy ASR™ XL Hip device. In July 2014, the United States notified the United States District Court for the District of Massachusetts that it had declined to intervene in a qui tam case filed pursuant to the False Claims Act against the companies. In February 2016, the district court granted the companies’ motion to dismiss with prejudice, unsealed the qui tam complaint, and denied the qui tam relators’ request for leave to file a further amended complaint. The qui tam relators appealed the case to the United States Court of Appeals for the First Circuit. In July 2017, the First Circuit affirmed the district court’s dismissal in part, reversed in part, and affirmed the decision to deny the relators’ request to file a third amended complaint. The relators’ remaining claims are now pending before the district court, and fact discovery is currently scheduled to close in September 2019. Additionally, DePuy filed a petition for certiorari with the United States Supreme Court, seeking review of the First Circuit’s decision. The Supreme Court denied the petition in April 2018.
Since October 2013, a group of State Attorneys General have issued Civil Investigative Demands relating to the development, sales and marketing of several of DePuy Orthopaedics, Inc.'s hip products. In July 2014, the Oregon Department of Justice, which was investigating these matters independently of the other states, announced a settlement of its ASR™ XL Hip device investigation with the State of Oregon. In December 2018, the Company, the remaining states and the District of Columbia agreed to settle all of the investigations, and on January 22, 2019, the states and the Company filed consent judgments resolving the matter.
In October 2012, Johnson & Johnson was contacted by the California Attorney General's office regarding a multi-state Attorney General investigation of the marketing of surgical mesh products for hernia and urogynecological purposes by Johnson & Johnson's subsidiary, Ethicon, Inc. (Ethicon). Johnson & Johnson and Ethicon have since entered into a series of tolling agreements with the 47 states and the District of Columbia participating in the multi-state investigation and have responded to Civil Investigative Demands served by certain of the participating states. The states are seeking monetary and injunctive relief. In May 2016, California and Washington filed civil complaints against Johnson & Johnson, Ethicon and Ethicon US, LLC alleging violations of their consumer protection statutes. Similar complaints were filed against the companies by Kentucky in August 2016 and by Mississippi in October 2017. Johnson & Johnson and Ethicon have entered into a new tolling agreement with the remaining 43 states and the District of Columbia.
In December 2012, Therakos, Inc. (Therakos), formerly a subsidiary of Johnson & Johnson and part of the Ortho-Clinical Diagnostics, Inc. (OCD) franchise, received a letter from the civil division of the United States Attorney's Office for the Eastern District of Pennsylvania informing Therakos that the United States Attorney's Office was investigating the sales and marketing of Uvadex® (methoxsalen) and the Uvar Xts® and Cellex® Systems during the period 2000 to the present. The United States Attorney's Office requested that OCD and Johnson & Johnson preserve documents that could relate to the investigation. Therakos was subsequently acquired by an affiliate of Gores Capital Partners III, L.P. in January 2013, and OCD was divested in June 2014. Following the divestiture of OCD, Johnson & Johnson retains OCD’s portion of any liability that may result from the investigation for activity that occurred prior to the sale of Therakos. In March 2014 and March 2016, the United States Attorney’s Office requested that Johnson & Johnson produce certain documents, and Johnson & Johnson is cooperating with those requests.
In June 2014, the Mississippi Attorney General filed a complaint in Chancery Court of The First Judicial District of Hinds County, Mississippi against Johnson & Johnson and Johnson & Johnson Consumer Companies, Inc. (now known as Johnson & Johnson Consumer Inc.) (JJCI). The complaint alleges that defendants failed to disclose alleged health risks associated with female consumers' use of talc contained in JOHNSON'S® Baby Powder and JOHNSON'S® Shower to Shower (a product divested in 2012) and seeks injunctive and monetary relief. Trial is stayed pending interlocutory appeal of a denial of JJCI's motion for summary judgment.
In March 2016, Janssen Pharmaceuticals, Inc. (JPI) received a Civil Investigative Demand from the United States Attorney’s Office for the Southern District of New York related to JPI’s contractual relationships with pharmacy benefit managers over the period from January 1, 2006 to the present with regard to certain of JPI's pharmaceutical products. The demand was issued in connection with an investigation under the False Claims Act.
In January 2017, Janssen Pharmaceuticals, Inc. (JPI) received a Civil Investigative Demand from the United States Department of Justice relating to allegations concerning the sales and marketing practices of OLYSIO®. In December 2017, Johnson & Johnson and JPI were served with a whistleblower lawsuit filed in the United States District Court for the Central District of California alleging the off-label promotion of OLYSIO® and additional products, including NUCYNTA®, XARELTO®, LEVAQUIN® and REMICADE®. At this time, the federal and state governments have declined to intervene and the lawsuit, which is related to the Civil Investigative Demand, is being prosecuted by a former company employee. The United States
| 94 |
District Court for the Central District of California dismissed the claim in April 2018. In May 2018, the relator filed a notice of appeal to the United States Court of Appeals for the Ninth Circuit.
In November 2018, a second whistleblower lawsuit was unsealed in the United States District Court for the Central District of California. The lawsuit is substantially similar to the lawsuit under appeal but is brought in the name of the original relator. The federal and state governments have declined to intervene in the second suit at this time.
In February 2017, Johnson & Johnson received a subpoena from the United States Attorney's Office for the District of Massachusetts seeking the production of records pertaining to payments to any 501(c)(3) charitable organization that provides financial assistance to Medicare patients. Multiple pharmaceutical companies have publicly reported receipt of subpoenas and ongoing inquiries similar to this one and the one described below. The government has represented that it will not be pursuing action against the company in this matter.
Actelion Pharmaceuticals US, Inc. (Actelion US), received a subpoena in May 2016, with follow-up requests for documents from the United States Attorney's Office for the District of Massachusetts. The subpoena seeks the production of records pertaining to Actelion US’ payments to 501(c)(3) charitable organizations that provide financial assistance to Medicare patients. In December 2018, the Company and the United States Department of Justice agreed to a settlement in this matter.
In March 2017, Janssen Biotech, Inc. received a Civil Investigative Demand from the United States Department of Justice regarding a False Claims Act investigation concerning management and advisory services provided to rheumatology and gastroenterology practices that purchased REMICADE® or SIMPONI ARIA®.
In April and September 2017, Johnson & Johnson received subpoenas from the United States Attorney for the District of Massachusetts seeking documents broadly relating to pharmaceutical copayment support programs for DARZALEX®, OLYSIO®, REMICADE®, SIMPONI®, STELARA® and ZYTIGA®. The subpoenas also seek documents relating to Average Manufacturer Price and Best Price reporting to the Center for Medicare and Medicaid Services related to those products, as well as rebate payments to state Medicaid agencies.
In June 2017, Johnson & Johnson received a subpoena from the United States Attorney's Office for the District of Massachusetts seeking information regarding practices pertaining to the sterilization of DePuy Synthes, Inc. spinal implants at three hospitals in Boston as well as interactions of employees of Company subsidiaries with physicians at these hospitals. Johnson & Johnson and DePuy Synthes, Inc. have produced documents in response to the subpoena and are fully cooperating with the government’s investigation.
In July 2018, Advanced Sterilization Products (ASP) received a Civil Investigative Demand from the United States Department of Justice regarding a False Claims Act investigation concerning the pricing, quality, marketing and promotion of EvoTech ECR, Tyvek Peel Pouches, or Sterrad Cyclesure 24 biological indicators.
In July 2018 the Public Prosecution Service in Rio de Janeiro and representatives from the Brazilian antitrust authority CADE inspected the offices of more than 30 companies including Johnson & Johnson do Brasil Indústria e Comércio de Produtos para Saúde Ltda. The authorities appear to be investigating allegations of possible anti-competitive behavior and possible improper payments in the medical device industry. The United States Department of Justice and the United States Securities and Exchange Commission have made additional preliminary inquiries about the inspection in Brazil, and Johnson & Johnson do Brasil Indústria e Comércio de Produtos para Saúde Ltda. is cooperating with those requests.
From time to time, the Company has received requests from a variety of United States Congressional Committees to produce information relevant to ongoing congressional inquiries. It is the policy of Johnson & Johnson to cooperate with these inquiries by producing the requested information.
GENERAL LITIGATION
In April 2016, a putative class action was filed against Johnson & Johnson, Johnson & Johnson Sales and Logistics Company, LLC and McNeil PPC, Inc. (now known as Johnson & Johnson Consumer, Inc.) in New Jersey Superior Court, Camden County on behalf of persons who reside in the state of New Jersey who purchased various McNeil over-the-counter products from December 2008 through the present. The complaint alleges violations of the New Jersey Consumer Fraud Act. Following the grant of a motion to dismiss and the filing of an amended complaint, in May 2017, the court denied a motion to dismiss the amended complaint. In December 2018, a settlement was reached and the matter has been dismissed.
| 95 |
In May 2014, two purported class actions were filed in federal court, one in the United States District Court for the Central District of California and one in the United States District Court for the Southern District of Illinois, against Johnson & Johnson and Johnson & Johnson Consumer Companies, Inc. (now known as Johnson & Johnson Consumer Inc.) (JJCI) alleging violations of state consumer fraud statutes based on nondisclosure of alleged health risks associated with talc contained in JOHNSON'S® Baby Powder and JOHNSON'S® Shower to Shower (a product no longer sold by JJCI). Both cases seek injunctive relief and monetary damages; neither includes a claim for personal injuries. In October 2016, both cases were transferred to the United States District Court for the District Court of New Jersey as part of a newly created federal multi-district litigation. In July 2017, the district court granted Johnson & Johnson's and JJCI’s motion to dismiss one of the cases. In September 2018, the United States Court of Appeals for the Third Circuit affirmed this dismissal. In September 2017, the plaintiff in the second case voluntarily dismissed their complaint. In March 2018, the plaintiff in the second case refiled in Illinois State Court.
In August 2014, United States Customs and Border Protection (US CBP) issued a Penalty Notice against Janssen Ortho LLC (Janssen Ortho), assessing penalties for the alleged improper classification of darunavir ethanolate (the active pharmaceutical ingredient in PREZISTA®) in connection with its importation into the United States. In October 2014, Janssen Ortho submitted a Petition for Relief in response to the Penalty Notice. In May 2015, US CBP issued an Amended Penalty Notice assessing substantial penalties and Janssen Ortho filed a Petition for Relief in July 2015.
In March and April 2015, over 30 putative class action complaints were filed by contact lens patients in a number of courts around the United States against Johnson & Johnson Vision Care, Inc. (JJVCI) and other contact lens manufacturers, distributors, and retailers, alleging vertical and horizontal conspiracies to fix the retail prices of contact lenses. The complaints allege that the manufacturers reached agreements with each other and certain distributors and retailers concerning the prices at which some contact lenses could be sold to consumers. The plaintiffs are seeking damages and injunctive relief. All of the class action cases were transferred to the United States District Court for the Middle District of Florida in June 2015. The plaintiffs filed a consolidated class action complaint in November 2015. In June 2016, the district court denied motions to dismiss filed by JJVCI and other defendants. Discovery is ongoing. In March 2017, the plaintiffs filed a motion for class certification. The district court held a hearing on the motion for class certification in August 2018. In December 2018, the district court granted the plaintiffs motion for class certification.
In August 2015, two third-party payors filed a purported class action in the United States District Court for the Eastern District of Louisiana against Janssen Research & Development, LLC, Janssen Ortho LLC, Janssen Pharmaceuticals, Inc., Ortho-McNeil-Janssen Pharmaceuticals, Inc. and Johnson & Johnson (as well as certain Bayer entities), alleging that the defendants improperly marketed and promoted XARELTO® as safer and more effective than less expensive alternative medications while failing to fully disclose its risks. The complaint seeks damages.
In May 2017, Lonza Sales AG (Lonza) filed a Request for Arbitration with the London Court of International Arbitration against Janssen Research & Development, LLC (Janssen R&D). Lonza alleges that Janssen R&D breached a 2005 agreement between the parties by sublicensing certain Lonza technology used in the manufacture of daratumumab without Lonza’s consent. Lonza seeks monetary damages. The arbitration hearing was held in September 2018. Post hearing briefing is complete, and the parties are awaiting a decision.
In May 2017, a purported class action was filed in the United States District Court for the Western District of Washington against LifeScan Inc., Johnson & Johnson, other diabetes test strip manufacturers and certain Pharmacy Benefit Managers (PBMs). The complaint alleges that consumers paid inflated prices for glucose monitor test strips as a consequence of undisclosed rebates and other incentives paid by manufacturers to PBMs. The complaint includes RICO, ERISA, and state consumer protection claims. The complaint seeks equitable relief and damages. In November 2017, the case was ordered transferred to United States District Court for the District of New Jersey. The LifeScan business was divested in October 2018 and Johnson & Johnson retained liability that may result from these claims prior to the closing of the divestiture.
In September 2017, Pfizer, Inc. (Pfizer) filed an antitrust complaint against Johnson & Johnson and Janssen Biotech, Inc. (collectively, Janssen) in United States District Court for the Eastern District of Pennsylvania. Pfizer alleges that Janssen has violated federal antitrust laws through its contracting strategies for REMICADE®. The complaint seeks damages and injunctive relief.
Beginning in September 2017, multiple purported class actions were filed against Johnson & Johnson and Janssen Biotech, Inc. (collectively, Janssen) alleging that Janssen’s REMICADE® contracting strategies violated federal and state antitrust and consumer laws and seeking damages and injunctive relief. In November 2017, the cases were consolidated for pre-trial purposes in United States District Court for the Eastern District of Pennsylvania as In re Remicade Antitrust Litigation.
| 96 |
In June 2018, Walgreen Co. and Kroger Co, filed an antitrust complaint against Johnson & Johnson and Janssen Biotech, Inc. (collectively, Janssen) in the United States District Court for the Eastern District of Pennsylvania. The complaint alleges that Janssen has violated federal antitrust laws through its contracting strategies for REMICADE®. The complaint seeks damages and injunctive relief.
In October 2017, certain United States service members and their families brought a complaint against a number of pharmaceutical and medical devices companies, including Johnson & Johnson and certain of its subsidiaries, alleging that the defendants violated the United States Anti-Terrorism Act. The complaint alleges that the defendants provided funding for terrorist organizations through their sales practices pursuant to pharmaceutical and medical device contracts with the Iraqi Ministry of Health.
Andover Healthcare, Inc. (Andover) filed a Lanham act case against Johnson & Johnson Consumer Inc. in April 2017 in the United States District Court for the District of Massachusetts. Andover asserts that the claim “not made with natural rubber latex” on COACH® Sports Wrap, BAND-AID® Brand SECURE-FLEX® Wrap and BAND-AID® Brand HURT-FREE® Wrap is false. Andover seeks actual damages and pre-judgment interest thereon, disgorgement of profits, treble damages, attorney’s fees and injunctive relief. In December 2018, the parties entered into a settlement agreement.
In October 2018, two separate putative class actions were filed against Actelion Pharmaceutical Ltd., Actelion Pharmaceuticals US, Inc., and Actelion Clinical Research, Inc. (collectively “Actelion”) in United States District Court for the District of Maryland and United States District Court for the District of Columbia. The complaints allege that Actelion violated state and federal antitrust and unfair competition laws by allegedly refusing to supply generic pharmaceutical manufacturers with samples of TRACLEER®. TRACLEER® is subject to a Risk Evaluation and Mitigation Strategy, which imposes restrictions on distribution of the product. In January 2019, the plaintiffs dismissed the District of Columbia case and filed a consolidated complaint in federal court in Maryland.
In December 2018, Janssen Biotech, Inc., Janssen Oncology, Inc, Janssen Research & Development, LLC, and Johnson & Johnson (collectively, Janssen) were served with a qui tam complaint filed on behalf of the United States, 28 states, and the District of Columbia. The complaint, which was filed in December 2017 in United States District Court for the Northern District of California, alleges that Janssen violated the federal False Claims Act and state law when providing pricing information for ZYTIGA® to the government in connection with direct government sales and government-funded drug reimbursement programs. At this time, the federal and state governments have declined to intervene.
Johnson & Johnson or its subsidiaries are also parties to a number of proceedings brought under the Comprehensive Environmental Response, Compensation, and Liability Act, commonly known as Superfund, and comparable state, local or foreign laws in which the primary relief sought is the cost of past and/or future remediation.
- Restructuring
In the first quarter of 2016, the Company announced restructuring actions in its Medical Devices segment to better serve the needs of patients and customers in today’s evolving healthcare marketplace. The Company has undertaken actions to strengthen its go-to-market model, accelerate the pace of innovation, further prioritize key platforms and geographies, and streamline operations while maintaining high quality standards.
In 2018, the Company recorded a pre-tax charge of $462 million, of which $46 million was included in cost of products sold and $227 million was included in other (income) expense. Total project costs of $2.5 billion have been recorded since the restructuring has been announced. This restructuring program was completed in the fiscal fourth quarter of 2018.
On April 17, 2018, the Company announced plans to implement a series of actions across its Global Supply Chain that are intended to focus resources and increase investments in the critical capabilities, technologies and solutions necessary to manufacture and supply its product portfolio, enhance agility and drive growth. The Global Supply Chain actions will include expanding the use of strategic collaborations and bolstering initiatives to reduce complexity, improve cost-competitiveness, enhance capabilities and optimize the Supply Chain network. For additional details on the global supply chain restructuring strategic collaborations see Note 20 to the Consolidated Financial Statements. In 2018, the Company recorded a pre-tax charge of $238 million, of which $59 million was included in cost of products sold and $117 million was included in other (income) expense. See the following table for additional details on the restructuring programs.
In total, the Company expects the Global Supply Chain actions to generate approximately $0.6 billion to $0.8 billion in annual pre-tax cost savings that will be substantially delivered by 2022. The Company expects to record pre-tax restructuring charges of approximately $1.9 billion to $2.3 billion, over the 4 to 5 year period of this activity. These costs are associated with network optimizations, exit costs and accelerated depreciation and amortization.
| 97 |
The following table summarizes the severance charges and the associated spending under these initiatives through the fiscal year ended 2018:
| (Dollars in Millions) | Severance | Asset Write-offs | Other** | Total | |||||
| Reserve balance, January 3, 2016 | $ | 484 | — | 17 | 501 | ||||
| 2016 activity | (104 | ) | — | (16 | ) | (120 | ) | ||
| Reserve balance, January 1, 2017 | 380 | — | 1 | 381 | |||||
| 2017 activity | (151 | ) | — | 37 | (114 | ) | |||
| Reserve balance, December 31, 2017 | 229 | — | 38 | 267 | |||||
| Current year activity: | |||||||||
| Charges | — | 132 | 568 | 700 | |||||
| Cash payments | (35 | ) | — | (558 | ) | (593 | ) | ||
| Settled non cash | — | (132 | ) | — | (132 | ) | |||
| Reserve balance, December 30, 2018* | $ | 194 | — | 48 | 242 | ||||
*Cash outlays for severance are expected to be substantially paid out over the next 2 years in accordance with the Company's plans and local laws.
**Other includes project expense such as salaries for employees supporting the initiative and consulting expenses.
Although the Medical Devices restructuring program was completed in 2018, the Company expects that severance charges will continue beyond that date. The Company continuously reevaluates its severance reserves related to restructuring and the timing of payments has extended due to the planned release of associates regarding several longer-term projects. The Company believes that the existing severance reserves are sufficient to cover the Global Supply Chain plans given the period over which the actions will take place. The Company will continue to assess and make adjustments as necessary if additional amounts become probable and estimable. Approximately 2,375 individuals received separation payments since these restructuring announcements.
| 98 |
Report of Independent Registered Public Accounting Firm
To the Board of Directors and Shareholders of Johnson & Johnson
Opinions on the Financial Statements and Internal Control over Financial Reporting
We have audited the accompanying consolidated balance sheets of Johnson & Johnson and its subsidiaries (the “Company”) as of December 30, 2018 and December 31, 2017, and the related consolidated statements of earnings, of comprehensive income, of equity, and of cash flows for each of the three years in the period ended December 30, 2018 including the related notes (collectively referred to as the “consolidated financial statements”). We also have audited the Company's internal control over financial reporting as of December 30, 2018, based on criteria established in Internal Control - Integrated Framework (2013) issued by the Committee of Sponsoring Organizations of the Treadway Commission (COSO).
In our opinion, the consolidated financial statements referred to above present fairly, in all material respects, the financial position of the Company as of December 30, 2018 and December 31, 2017, and the results of its operations and its cash flows for each of the three years in the period ended December 30, 2018 in conformity with accounting principles generally accepted in the United States of America. Also in our opinion, the Company maintained, in all material respects, effective internal control over financial reporting as of December 30, 2018, based on criteria established in Internal Control - Integrated Framework (2013) issued by the COSO.
Basis for Opinions
The Company's management is responsible for these consolidated financial statements, for maintaining effective internal control over financial reporting, and for its assessment of the effectiveness of internal control over financial reporting, included in the accompanying Management’s Report on Internal Control over Financial Reporting. Our responsibility is to express opinions on the Company’s consolidated financial statements and on the Company's internal control over financial reporting based on our audits. We are a public accounting firm registered with the Public Company Accounting Oversight Board (United States) (PCAOB) and are required to be independent with respect to the Company in accordance with the U.S. federal securities laws and the applicable rules and regulations of the Securities and Exchange Commission and the PCAOB.
We conducted our audits in accordance with the standards of the PCAOB. Those standards require that we plan and perform the audits to obtain reasonable assurance about whether the consolidated financial statements are free of material misstatement, whether due to error or fraud, and whether effective internal control over financial reporting was maintained in all material respects.
Our audits of the consolidated financial statements included performing procedures to assess the risks of material misstatement of the consolidated financial statements, whether due to error or fraud, and performing procedures that respond to those risks. Such procedures included examining, on a test basis, evidence regarding the amounts and disclosures in the consolidated financial statements. Our audits also included evaluating the accounting principles used and significant estimates made by management, as well as evaluating the overall presentation of the consolidated financial statements. Our audit of internal control over financial reporting included obtaining an understanding of internal control over financial reporting, assessing the risk that a material weakness exists, and testing and evaluating the design and operating effectiveness of internal control based on the assessed risk. Our audits also included performing such other procedures as we considered necessary in the circumstances. We believe that our audits provide a reasonable basis for our opinions.
Definition and Limitations of Internal Control over Financial Reporting
A company’s internal control over financial reporting is a process designed to provide reasonable assurance regarding the reliability of financial reporting and the preparation of financial statements for external purposes in accordance with generally accepted accounting principles. A company’s internal control over financial reporting includes those policies and procedures that (i) pertain to the maintenance of records that, in reasonable detail, accurately and fairly reflect the transactions and dispositions of the assets of the company; (ii) provide reasonable assurance that transactions are recorded as necessary to permit preparation of financial statements in accordance with generally accepted accounting principles, and that receipts and expenditures of the company are being made only in accordance with authorizations of management and directors of the company; and (iii) provide reasonable assurance regarding prevention or timely detection of unauthorized acquisition, use, or disposition of the company’s assets that could have a material effect on the financial statements.
| 99 |
Because of its inherent limitations, internal control over financial reporting may not prevent or detect misstatements. Also, projections of any evaluation of effectiveness to future periods are subject to the risk that controls may become inadequate because of changes in conditions, or that the degree of compliance with the policies or procedures may deteriorate.
/s/PricewaterhouseCoopers LLP
Florham Park, New Jersey
February 20, 2019
We have served as the Company’s auditor since at least 1920. We have not been able to determine the specific year we began serving as auditor of the Company.
| 100 |
Management’s Report on Internal Control Over Financial Reporting
Under Section 404 of the Sarbanes-Oxley Act of 2002, management is required to assess the effectiveness of the Company’s internal control over financial reporting as of the end of each fiscal year and report, based on that assessment, whether the Company’s internal control over financial reporting is effective.
Management of the Company is responsible for establishing and maintaining adequate internal control over financial reporting. The Company’s internal control over financial reporting is designed to provide reasonable assurance as to the reliability of the Company’s financial reporting and the preparation of external financial statements in accordance with generally accepted accounting principles.
Internal controls over financial reporting, no matter how well designed, have inherent limitations. Therefore, internal control over financial reporting determined to be effective can provide only reasonable assurance with respect to financial statement preparation and may not prevent or detect all misstatements. Moreover, projections of any evaluation of effectiveness to future periods are subject to the risk that controls may become inadequate because of changes in conditions, or that the degree of compliance with the policies or procedures may deteriorate.
The Company’s management has assessed the effectiveness of the Company’s internal control over financial reporting as of December 30, 2018. In making this assessment, the Company used the criteria established by the Committee of Sponsoring Organizations of the Treadway Commission (COSO) in “Internal Control-Integrated Framework (2013).” These criteria are in the areas of control environment, risk assessment, control activities, information and communication, and monitoring. The Company’s assessment included extensive documenting, evaluating and testing the design and operating effectiveness of its internal controls over financial reporting.
Based on the Company’s processes and assessment, as described above, management has concluded that, as of December 30, 2018, the Company’s internal control over financial reporting was effective.
The effectiveness of the Company’s internal control over financial reporting as of December 30, 2018 has been audited by PricewaterhouseCoopers LLP, an independent registered public accounting firm, as stated in their report, which appears herein.
| /s/ Alex Gorsky | /s/ Joseph J. Wolk | |
| Alex Gorsky | Joseph J. Wolk | |
| Chairman, Board of Directors | Executive Vice President, Chief Financial Officer | |
| Chief Executive Officer |
| 101 |
Shareholder Return Performance Graphs
Set forth below are line graphs comparing the cumulative total shareholder return on the Company’s Common Stock for periods of five years and ten years ending December 31, 2018, against the cumulative total return of the Standard & Poor’s 500 Stock Index, the Standard & Poor’s Pharmaceutical Index and the Standard & Poor’s Health Care Equipment Index. The graphs and tables assume that $100 was invested on December 31, 2013 and December 31, 2008 in each of the Company’s Common Stock, the Standard & Poor’s 500 Stock Index, the Standard & Poor’s Pharmaceutical Index and the Standard & Poor’s Health Care Equipment Index and that all dividends were reinvested.
5 Year Shareholder Return Performance J&J vs. Indices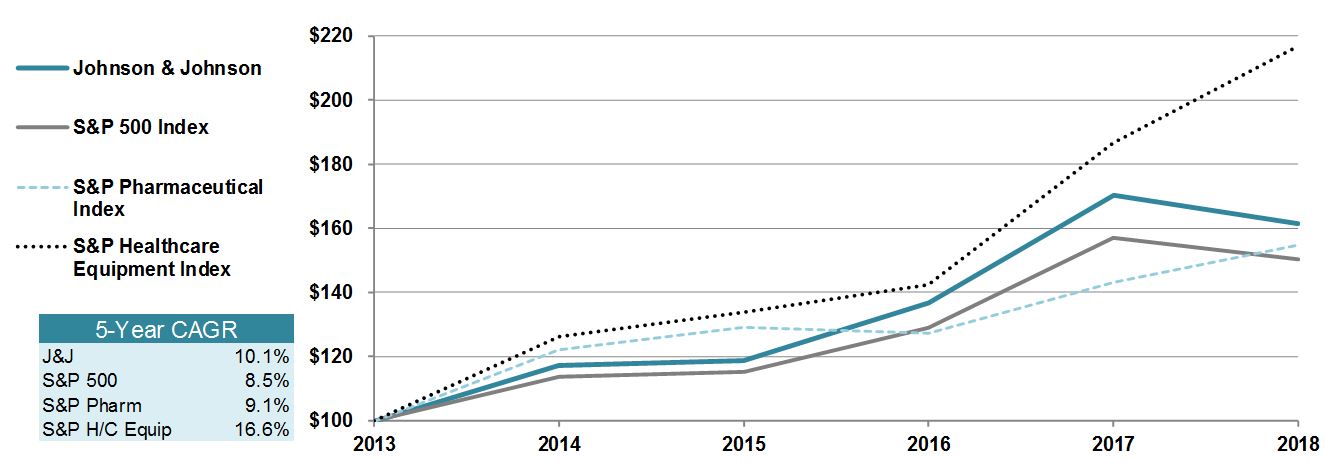
| 2013 | 2014 | 2015 | 2016 | 2017 | 2018 | |
| Johnson & Johnson | $100.00 | $117.34 | $118.69 | $136.88 | $170.29 | $161.54 |
| S&P 500 Index | $100.00 | $113.68 | $115.24 | $129.02 | $157.17 | $150.27 |
| S&P Pharmaceutical Index | $100.00 | $122.22 | $129.29 | $127.27 | $143.27 | $154.86 |
| S&P Healthcare Equipment Index | $100.00 | $126.28 | $133.82 | $142.50 | $186.53 | $216.82 |
10 Year Shareholder Return Performance J&J vs. Indices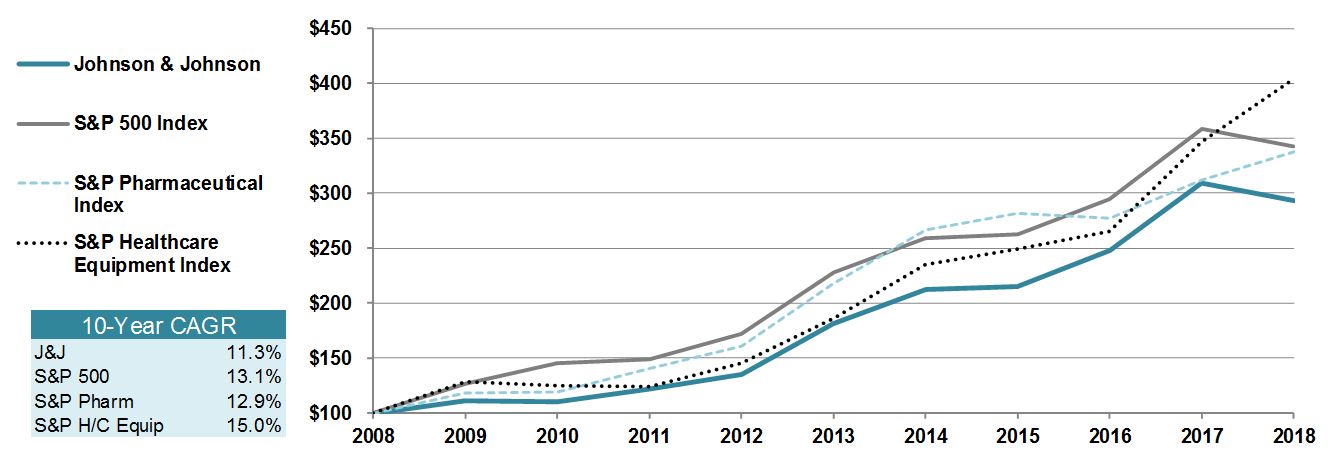
| 2008 | 2009 | 2010 | 2011 | 2012 | 2013 | 2014 | 2015 | 2016 | 2017 | 2018 | |
| Johnson & Johnson | $100.00 | $111.28 | $110.63 | $121.57 | $134.73 | $181.37 | $212.81 | $215.28 | $248.26 | $308.85 | $292.99 |
| S&P 500 Index | $100.00 | $126.45 | $145.49 | $148.55 | $172.31 | $228.09 | $259.29 | $262.86 | $294.28 | $358.50 | $342.75 |
| S&P Pharmaceutical Index | $100.00 | $118.62 | $119.54 | $140.77 | $161.07 | $217.82 | $266.21 | $281.62 | $277.21 | $312.06 | $337.32 |
| S&P Healthcare Equipment Index | $100.00 | $128.79 | $125.30 | $124.30 | $145.76 | $186.12 | $235.04 | $249.08 | $265.23 | $347.17 | $403.55 |
| 102 |
Previous: Item 7A. QUANTITATIVE AND QUALITATIVE DISCLOSURES ABOUT MARKET RISK · Next: Item 9. CHANGES IN AND DISAGREEMENTS WITH ACCOUNTANTS ON ACCOUNTING AND FINANCIAL DISCLOSURE