 filings.tools
Item 2. MANAGEMENT’S DISCUSSION AND ANALYSIS OF FINANCIAL CONDITION AND RESULTS OF OPERATIONS
50K characters. Original on sec.gov · Markdown
Item 2. MANAGEMENT’S DISCUSSION AND ANALYSIS OF FINANCIAL CONDITION AND RESULTS OF OPERATIONS
RESULTS OF OPERATIONS
Sales to Customers
Analysis of Consolidated Sales
For the fiscal first quarter of 2023, worldwide sales were $24.7 billion, a total increase of 5.6%, which included operational growth of 9.0% and a negative currency impact of 3.4% as compared to 2022 fiscal first quarter sales of $23.4 billion. In the fiscal first quarter of 2023, the net impact of acquisitions and divestitures on worldwide operational sales growth was a positive 1.4%.
Sales by U.S. companies were $12.5 billion in the fiscal first quarter of 2023, which represented an increase of 9.7% as compared to the prior year. In the fiscal first quarter of 2023, the net impact of acquisitions and divestitures on the U.S. operational sales growth was a positive 2.3%. Sales by international companies were $12.2 billion, a total increase of 1.8%, which included operational growth of 8.3% and a negative currency impact of 6.5%. In the fiscal first quarter of 2023, the net impact of acquisitions and divestitures on the international operational sales growth was a positive 0.4%.
In the fiscal first quarter of 2023, sales by companies in Europe achieved growth of 5.1%, which included operational growth of 10.0% and a negative currency impact of 4.9%. Sales by companies in the Western Hemisphere, excluding the U.S., achieved growth of 7.1%, including operational growth of 14.3% and a negative currency impact of 7.2%. Sales by companies in the Asia-Pacific, Africa region experienced a decline of 4.3%, including operational growth of 4.1% offset by a negative currency impact of 8.4%.


Note: values may have been rounded
Table of Content
Analysis of Sales by Business Segments
Consumer Health
Consumer Health segment sales in the fiscal first quarter of 2023 were $3.9 billion, an increase of 7.4% as compared to the same period a year ago, including operational growth of 11.3% and a negative currency impact of 3.9%. U.S. Consumer Health segment sales increased by 11.4%. International Consumer Health segment sales increased by 4.4% including operational growth of 11.3% and a negative currency impact of 6.9%. In the fiscal first quarter of 2023, the net impact of acquisitions and divestitures on the Consumer Health segment operational sales growth was negligible.
Major Consumer Health Franchise Sales — Fiscal First Quarter Ended
| (Dollars in Millions) | April 2, 2023 | April 3, 2022 | Total Change | Operations Change | Currency Change | |||||||||||||||||||||||||||
| OTC(1) | $ | 1,642 | $ | 1,461 | 12.4 | % | 15.8 | % | (3.4) | % | ||||||||||||||||||||||
| Skin Health/Beauty | 1,110 | 1,012 | 9.7 | 13.1 | (3.4) | |||||||||||||||||||||||||||
| Oral Care | 361 | 366 | (1.3) | 2.1 | (3.4) | |||||||||||||||||||||||||||
| Baby Care | 359 | 355 | 1.0 | 6.5 | (5.5) | |||||||||||||||||||||||||||
| Women’s Health | 217 | 228 | (4.8) | 4.1 | (8.9) | |||||||||||||||||||||||||||
| Wound Care/Other | 164 | 164 | (0.1) | 2.5 | (2.6) | |||||||||||||||||||||||||||
| Total Consumer Health Sales | $ | 3,852 | $ | 3,586 | 7.4 | % | 11.3 | % | (3.9) | % |
The OTC franchise achieved operational growth of 15.8% as compared to the prior year fiscal first quarter. The growth was driven by price actions, exceptionally high Cough/Cold/Flu incidences primarily in Europe, and one-time supply replenishment reflected in TYLENOL, MOTRIN, NICORETTE and IMODIUM.
The Skin Health/Beauty franchise achieved operational growth of 13.1% as compared to the prior year fiscal first quarter. The growth was driven by price actions, one-time supply replenishment and sun season pipeline fill, and e-commerce and club channel performance driven by new product innovations in NEUTROGENA and AVEENO. The growth was partially offset by U.S. portfolio simplification and competitive pressures.
The Oral Care franchise achieved operational growth of 2.1% as compared to the prior year fiscal first quarter. The growth was driven by U.S. price actions, partially offset by category deceleration outside the U.S. and the negative impact from suspension of personal care sales in Russia.
The Baby Care franchise achieved operational growth of 6.5% as compared to the prior year fiscal first quarter. The growth was driven by price actions, one-time supply replenishment and lapping of a prior year reserve true-up outside the U.S. The growth was partially offset by the negative impact from suspension of personal care sales in Russia.
The Women’s Health franchise achieved operational growth of 4.1% as compared to the prior year fiscal first quarter primarily driven by price actions and strong performance in India partially offset by the negative impact from suspension of personal care sales in Russia.
The Wound Care/Other franchise achieved operational growth of 2.5% as compared to the prior year fiscal first quarter primarily driven by price actions and strong demand in Canada.
In November 2021, the Company announced its intention to separate the Company’s Consumer Health business (Kenvue as the name for the planned New Consumer Health Company), with the intention to create a new, publicly traded company by the end of the fiscal year 2023, pending market conditions.
Table of Content
Pharmaceutical
Pharmaceutical segment sales in the fiscal first quarter of 2023 were $13.4 billion, an increase of 4.2% as compared to the same period a year ago, including an operational increase of 7.2% and a negative currency impact of 3.0%. U.S. Pharmaceutical sales increased 5.9% as compared to the same period a year ago. International Pharmaceutical sales increased by 2.4%, including operational growth of 8.6% and a negative currency impact of 6.2%. In the fiscal first quarter of 2023, the net impact of acquisitions and divestitures on the Pharmaceutical segment operational sales growth was negligible.
Major Pharmaceutical Therapeutic Area Sales** — Fiscal First Quarter Ended
| (Dollars in Millions) | April 2, 2023 | April 3, 2022 | Total Change | Operations Change | Currency Change | |||||||||||||||||||||||||||
| Immunology | $ | 4,112 | $ | 4,119 | (0.2) | % | 2.5 | % | (2.7) | % | ||||||||||||||||||||||
| REMICADE | 487 | 663 | (26.5) | (25.0) | (1.5) | |||||||||||||||||||||||||||
| SIMPONI/ SIMPONI ARIA | 537 | 571 | (5.8) | (1.9) | (3.9) | |||||||||||||||||||||||||||
| STELARA | 2,444 | 2,288 | 6.8 | 9.6 | (2.8) | |||||||||||||||||||||||||||
| TREMFYA | 640 | 590 | 8.4 | 11.0 | (2.6) | |||||||||||||||||||||||||||
| Other Immunology | 3 | 6 | (51.3) | (51.3) | 0.0 | |||||||||||||||||||||||||||
| Infectious Diseases | 1,586 | 1,297 | 22.3 | 26.4 | (4.1) | |||||||||||||||||||||||||||
| COVID-19 VACCINE | 747 | 457 | 63.4 | 70.8 | (7.4) | |||||||||||||||||||||||||||
| EDURANT/rilpivirine | 280 | 248 | 12.8 | 18.0 | (5.2) | |||||||||||||||||||||||||||
| PREZISTA/ PREZCOBIX/ REZOLSTA/ SYMTUZA | 477 | 501 | (4.8) | (3.7) | (1.1) | |||||||||||||||||||||||||||
| Other Infectious Diseases | 82 | 91 | (9.8) | (8.0) | (1.8) | |||||||||||||||||||||||||||
| Neuroscience | 1,804 | 1,741 | 3.6 | 6.1 | (2.5) | |||||||||||||||||||||||||||
| CONCERTA/ methylphenidate | 206 | 157 | 31.4 | 38.2 | (6.8) | |||||||||||||||||||||||||||
| INVEGA SUSTENNA/ XEPLION/ INVEGA TRINZA/ TREVICTA | 1,044 | 1,048 | (0.4) | 1.7 | (2.1) | |||||||||||||||||||||||||||
| SPRAVATO | 131 | 70 | 86.9 | 88.0 | (1.1) | |||||||||||||||||||||||||||
| Other Neuroscience(1) | 423 | 467 | (9.4) | (6.9) | (2.5) | |||||||||||||||||||||||||||
| Oncology | 4,112 | 3,950 | 4.1 | 7.7 | (3.6) | |||||||||||||||||||||||||||
| CARVYKTI | 72 | — | * | * | — | |||||||||||||||||||||||||||
| DARZALEX | 2,264 | 1,856 | 22.0 | 25.7 | (3.7) | |||||||||||||||||||||||||||
| ERLEADA | 542 | 400 | 35.6 | 40.3 | (4.7) | |||||||||||||||||||||||||||
| IMBRUVICA | 827 | 1,038 | (20.3) | (17.2) | (3.1) | |||||||||||||||||||||||||||
| ZYTIGA/ abiraterone acetate | 245 | 539 | (54.5) | (50.9) | (3.6) | |||||||||||||||||||||||||||
| Other Oncology | 162 | 118 | 37.4 | 41.0 | (3.6) | |||||||||||||||||||||||||||
| Pulmonary Hypertension | 872 | 852 | 2.4 | 5.0 | (2.6) | |||||||||||||||||||||||||||
| OPSUMIT | 440 | 443 | (0.7) | 2.3 | (3.0) | |||||||||||||||||||||||||||
| UPTRAVI | 362 | 325 | 11.4 | 12.4 | (1.0) | |||||||||||||||||||||||||||
| Other Pulmonary Hypertension | 70 | 83 | (16.1) | (9.3) | (6.8) | |||||||||||||||||||||||||||
| Cardiovascular / Metabolism / Other | 927 | 910 | 1.8 | 3.0 | (1.2) | |||||||||||||||||||||||||||
| XARELTO | 578 | 508 | 13.7 | 13.7 | — | |||||||||||||||||||||||||||
| Other(2) | 349 | 402 | (13.2) | (10.5) | (2.7) | |||||||||||||||||||||||||||
| Total Pharmaceutical Sales | $ | 13,413 | $ | 12,869 | 4.2 | % | 7.2 | % | (3.0) | % |
- Percentage greater than 100% or not meaningful
**Certain prior year amounts have been reclassified to conform to current year presentation
(1) Inclusive of RISPERDAL CONSTA which was previously disclosed separately
(2) Inclusive of INVOKANA which was previously disclosed separately
Table of Content
Immunology products achieved operational growth of 2.5% as compared to the same period a year ago driven by market growth and share growth of STELARA (ustekinumab) in Crohn’s disease and Ulcerative Colitis partially offset by unfavorable patient mix and price. Additionally, strong growth of TREMFYA (guselkumab) was due to share gains in Psoriasis and Psoriatic Arthritis partially offset by unfavorable patient mix. Lower sales of REMICADE (infliximab) were due to biosimilar competition.
Biosimilar versions of REMICADE have been introduced in the United States and certain markets outside the United States and additional competitors continue to enter the market. Continued infliximab biosimilar competition will result in a further reduction in sales of REMICADE.
The latest expiring United States composition of matter patent for STELARA (ustekinumab) expires in September 2023. STELARA (ustekinumab) U.S. sales in fiscal 2022 were approximately $6.4 billion. Third parties have filed abbreviated Biologics License Applications with the FDA seeking approval to market biosimilar versions of STELARA. In the event the Company is not successful in defending its patent claims in related lawsuits, biosimilar versions of STELARA may be introduced to the market, potentially resulting in substantial market share and revenue losses. There is also risk that one or more competitors could launch a biosimilar version of the product at issue following regulatory approval even though one or more valid patents are in place.
Infectious disease products achieved operational growth of 26.4% as compared to the same period a year ago. Growth was primarily driven by COVID-19 vaccine revenue (which is now substantially complete) and EDURANT (rilpivirine) sales. This was partially offset by lower sales of PREZISTA and PREZCOBIX/REZOLSTA (darunavir/cobicistat) due to increased competition outside the U.S.
Neuroscience products achieved operational sales growth of 6.1% as compared to the same period a year ago. Growth of SPRAVATO (esketamine) was driven by ongoing launches in the U.S. and Europe as well as increased patient demand. Paliperidone long-acting injectables growth was due to the strength of INVEGA SUSTENNA/XEPLION (paliperidone palmitate) and INVEGA TRINZA/TREVICTA driven by new patient starts and persistence of treatment as well as the launch of INVEGA HAFYERA/BYANNLI. This was partially offset by the XEPLION loss of exclusivity in the European Union.
Oncology products achieved operational sales growth of 7.7% as compared to the same period a year ago. Strong sales of DARZALEX (daratumumab) were driven by share gains in all regions, continued market growth, and strong FASPRO adoption. Growth of ERLEADA (apalutamide) was due to continued strong share gains, market growth, and increased penetration from new launches. Sales of CARVYKTI (ciltacabtagene autoleucel) were driven by continued market share gains and the ongoing phased launch. Growth was partially offset by ZYTIGA (abiraterone acetate) due to loss of exclusivity and IMBRUVICA (ibrutinib) due to global competitive pressures.
Pulmonary Hypertension achieved operational sales growth of 5.0% as compared to the same period a year ago. Sales growth was due to market and volume growth from UPTRAVI (selexipag) and OPSUMIT (macitentan) partially offset by declines in Other Pulmonary Hypertension.
Cardiovascular / Metabolism / Other products achieved operational growth of 3.0% as compared to the same period a year ago. The growth of XARELTO (rivaroxaban) was primarily driven by favorable patient mix and market growth partially offset by share loss.
The Company maintains a policy that no end customer will be permitted direct delivery of product to a location other than the billing location. This policy impacts contract pharmacy transactions involving non-grantee 340B covered entities for most of the Company’s drugs, subject to multiple exceptions. Both grantee and non-grantee covered entities can maintain certain contract pharmacy arrangements under policy exceptions. The Company has been and will continue to offer 340B discounts to covered entities on all of its covered outpatient drugs, and it believes its policy will improve its ability to identify inappropriate duplicate discounts and diversion prohibited by the 340B statute. The 340B Drug Pricing Program is a U.S. federal government program requiring drug manufacturers to provide significant discounts on covered outpatient drugs to covered entities. This policy had discount implications which positively impacted sales to customers in the fiscal first quarter of 2023.
Table of Content
MedTech
The MedTech segment sales in the fiscal first quarter of 2023 were $7.5 billion, an increase of 7.3% as compared to the same period a year ago, which included operational growth of 11.0% and a negative currency impact of 3.7%. U.S. MedTech sales increased 16.6%. International MedTech sales decreased by 0.6%, including operational growth of 6.2% offset by a negative currency impact of 6.8%. In the fiscal first quarter of 2023, the net impact of acquisitions and divestitures on the MedTech segment operational sales growth was a positive 4.6%, related to the Abiomed acquisition.
Major MedTech Franchise Sales** — Fiscal First Quarter Ended
| (Dollars in Millions) | April 2, 2023 | April 3, 2022 | Total Change | Operations Change | Currency Change | |||||||||||||||||||||||||||
| Surgery | $ | 2,434 | $ | 2,434 | 0.0 | % | 4.1 | % | (4.1) | % | ||||||||||||||||||||||
| Advanced | 1,118 | 1,146 | (2.5) | 1.6 | (4.1) | |||||||||||||||||||||||||||
| General | 1,316 | 1,288 | 2.2 | 6.4 | (4.2) | |||||||||||||||||||||||||||
| Orthopaedics | 2,245 | 2,188 | 2.6 | 5.1 | (2.5) | |||||||||||||||||||||||||||
| Hips | 390 | 389 | 0.4 | 2.7 | (2.3) | |||||||||||||||||||||||||||
| Knees | 368 | 339 | 8.7 | 11.3 | (2.6) | |||||||||||||||||||||||||||
| Trauma | 757 | 748 | 1.2 | 3.4 | (2.2) | |||||||||||||||||||||||||||
| Spine, Sports & Other | 729 | 712 | 2.4 | 5.2 | (2.8) | |||||||||||||||||||||||||||
| Interventional Solutions | 1,503 | 1,092 | 37.6 | 41.9 | (4.3) | |||||||||||||||||||||||||||
| Electrophysiology | 1,092 | 1,002 | 9.1 | 13.3 | (4.2) | |||||||||||||||||||||||||||
| Abiomed | 324 | — | * | * | — | |||||||||||||||||||||||||||
| Other Interventional Solutions | 87 | 90 | (3.9) | 1.1 | (5.0) | |||||||||||||||||||||||||||
| Vision | 1,300 | 1,257 | 3.4 | 7.6 | (4.2) | |||||||||||||||||||||||||||
| Contact Lenses/Other | 953 | 910 | 4.7 | 9.3 | (4.6) | |||||||||||||||||||||||||||
| Surgical | 347 | 347 | 0.1 | 3.1 | (3.0) | |||||||||||||||||||||||||||
| Total MedTech Sales | $ | 7,481 | $ | 6,971 | 7.3 | % | 11.0 | % | (3.7) | % |
- Percentage greater than 100% or not meaningful
**Certain prior year amounts have been reclassified to conform to current year presentation
The Surgery franchise achieved operational sales growth of 4.1% as compared to the prior year fiscal first quarter. The operational growth in Advanced Surgery was primarily driven by the following: Biosurgery global procedure recovery, the strength from new products and a differentiated portfolio; and Energy products double digit growth in the U.S. with improved procedure volumes and strength of new products partially offset by volume-based procurement in China and product supply challenges; partially offset by Endocutter decline primarily due to volume-based procurement in China, competitive pressures predominately in the U.S. and supply challenges partially offset by positive uptake from recently launched products. The operational growth in General Surgery was primarily driven by improved procedure volumes coupled with technology penetration and benefits from differentiated Wound Closure portfolio.
The Orthopaedics franchise achieved operational sales growth of 5.1% as compared to the prior year fiscal first quarter. The operational growth in hips reflects global procedure recovery and strength across the portfolio. This was partially offset by impacts of volume-based procurement in China and supply challenges. The operational growth in knees was primarily driven by global procedure recovery, strength of the ATTUNE portfolio and pull through related to the VELYS Robotic assisted solution. This was partially offset by impacts of volume-based procurement in China. The operational growth in Trauma was driven by the adoption of recently launched products. This was partially offset by softer procedure volumes compared to the prior year and impacts of volume-based procurement in China. The operational growth in Spine, Sports & Other was primarily driven by market growth and positive new product performance in Digital Solutions, shoulders and spine. This was partially offset by impacts of volume-based procurement in China and continued competitive pressures in Spine.
The Interventional Solutions franchise achieved operational sales growth of 41.9% as compared to the prior year fiscal first quarter which includes sales from Abiomed acquired on December 22, 2022. Electrophysiology grew by double digits in all regions except Asia Pacific which reflects the impacts of COVID-19 procedure disruption and volume-based procurement in China.
Table of Content
The Vision franchise achieved operational sales growth of 7.6% as compared to the prior year fiscal first quarter. The Contact Lenses/Other operational growth was primarily driven by the market recovery, continued strong performance in the ACUVUE OASYS 1-Day family (including recent launches) and effective commercial execution. This was partially offset by supply challenges. The Surgical operational growth was primarily driven by the strength in Monofocal IOLs partially offset by softer refractive and premium IOL markets and supply challenges.
ANALYSIS OF CONSOLIDATED EARNINGS BEFORE PROVISION FOR TAXES ON INCOME
Consolidated earnings/loss before provision for taxes on income for the fiscal first quarter of 2023 was a loss of $0.7 billion representing (3.0)% of sales as compared to earnings of $5.9 billion in the fiscal first quarter of 2022, representing 25.0% of sales primarily driven by the $6.9 billion charge related to the talc settlement proposal.
Cost of Products Sold
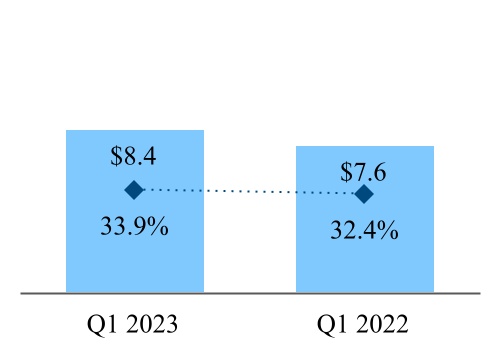
(Dollars in billions. Percentages in chart are as a percent to total sales)
Q1 2023 versus Q1 2022
Cost of products sold increased as a percent to sales primarily driven by:
-
one-time COVID-19 vaccine manufacturing related exit costs and mix in the Pharmaceutical business
-
Commodity inflation and Abiomed amortization in the MedTech business
The intangible asset amortization expense included in cost of products sold for the fiscal first quarters of 2023 and 2022 was $1.2 billion and $1.1 billion, respectively.
Selling, Marketing and Administrative Expenses
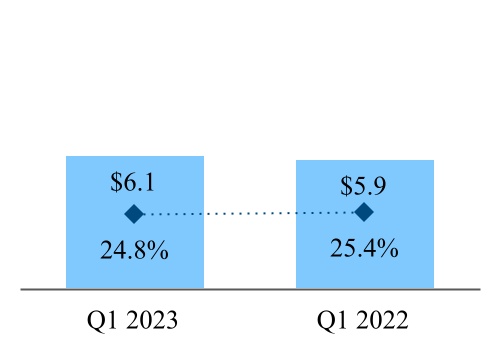
(Dollars in billions. Percentages in chart are as a percent to total sales)
Q1 2023 versus Q1 2022
Selling, Marketing and Administrative Expenses decreased as a percent to sales primarily driven by:
- A reduction in brand marketing expenses in the Pharmaceutical business
Table of Content
Research and Development Expense
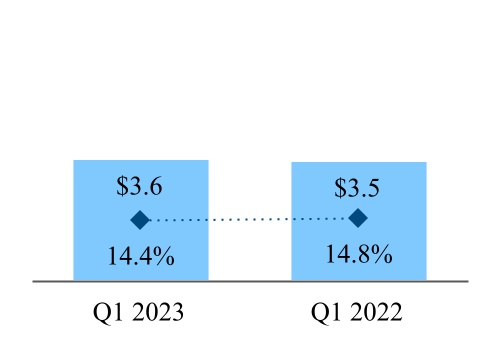
(Dollars in billions. Percentages in chart are as a percent to total sales)
Q1 2023 versus Q1 2022
Research and Development decreased as a percent to sales driven by:
- a reduction in COVID-19 Vaccine related expenses
partially offset by
- portfolio progression in the Pharmaceutical business
In-Process Research and Development (IPR&D)
In the fiscal first quarter of 2023, the Company recorded a charge of approximately $0.1 billion associated with the IPR&D acquired with Pulsar Vascular in 2016. In the fiscal first quarter of 2022, the Company recorded an intangible asset impairment charge of approximately $0.6 billion related to an in-process research and development asset, bermekimab (JnJ-77474462), an investigational drug for the treatment of Atopic Dermatitis (AD) and Hidradenitis Suppurativa (HS). The Company acquired all rights to bermekimab from XBiotech, Inc. in the fiscal year 2020.
Interest (Income) Expense
Interest income in the fiscal first quarter of 2023 was $235 million as compared to $22 million in the fiscal first quarter of 2022 primarily due to higher rates of interest earned on cash balances. Interest expense in the fiscal first quarter of 2023 was $215 million as compared to interest expense of $10 million in the same period a year ago primarily due to a higher debt balance at higher interest rates. The balance of cash, cash equivalents, restricted cash and current marketable securities was $32.3 billion ($24.6 billion unrestricted and $7.7 billion restricted) at the end of the fiscal first quarter of 2023 as compared to $30.4 billion at the end of the fiscal first quarter of 2022. The Company’s debt position was $52.9 billion ($7.7 billion related to Kenvue debt) as of April 2, 2023, as compared to $33.1 billion the same period a year ago.
Other (Income) Expense, Net*
Q1 2023 versus Q1 2022
Other (income) expense, net for the fiscal first quarter of 2023 was unfavorable by $7.3 billion as compared to the prior year primarily due to the following:
| Fiscal First Quarter | ||||||||||||||||||||
| (Dollars in Billions)(Income)/Expense | 2023 | 2022 | Change | |||||||||||||||||
| Litigation related(1) | $ | 6.9 | 0.0 | 6.9 | ||||||||||||||||
| Consumer Health separation costs | 0.3 | 0.1 | 0.2 | |||||||||||||||||
| COVID-19 Vaccine related exit costs | 0.2 | 0.0 | 0.2 | |||||||||||||||||
| Changes in the fair value of securities | 0.1 | 0.4 | (0.3) | |||||||||||||||||
| Employee benefit plan related | (0.4) | (0.3) | (0.1) | |||||||||||||||||
| Other | 0.1 | (0.3) | 0.4 | |||||||||||||||||
| Total Other (Income) Expense, Net | $ | 7.2 | (0.1) | 7.3 |
(1) Related to the talc settlement proposal
Table of Content
*Other (income) expense, net is the account where the Company records gains and losses related to the sale and write-down of certain investments in equity securities held by Johnson & Johnson Innovation - JJDC, Inc. (JJDC), changes in the fair value of securities, gains and losses on divestitures, gains and losses on sale of assets, certain transactional currency gains and losses, acquisition-related costs, litigation accruals and settlements, investment (income)/loss related to employee benefit plans, as well as royalty income.
EARNINGS BEFORE PROVISION FOR TAXES BY SEGMENT
Income (loss) before tax by segment of business for the fiscal first quarters were as follows:
| Income Before Tax | Segment Sales | Percent of Segment Sales | ||||||||||||||||||||||||||||||||||||
| (Dollars in Millions) | April 2, 2023 | April 3, 2022 | April 2, 2023 | April 3, 2022 | April 2, 2023 | April 3, 2022 | ||||||||||||||||||||||||||||||||
| Consumer Health | $ | 776 | $ | 686 | $ | 3,852 | $ | 3,586 | 20.1 | % | 19.1 | % | ||||||||||||||||||||||||||
| Pharmaceutical | 4,444 | 3,924 | 13,413 | 12,869 | 33.1 | 30.5 | ||||||||||||||||||||||||||||||||
| MedTech | 1,445 | 1,477 | 7,481 | 6,971 | 19.3 | 21.2 | ||||||||||||||||||||||||||||||||
| Segment earnings before tax | 6,665 | 6,087 | 24,746 | 23,426 | 26.9 | 26.0 | ||||||||||||||||||||||||||||||||
| Less: Expenses not allocated to segments(1) | 7,102 | 123 | ||||||||||||||||||||||||||||||||||||
| Less: Consumer Health separation costs | 300 | 102 | ||||||||||||||||||||||||||||||||||||
| Worldwide income/(loss) before tax | $ | (737) | $ | 5,862 | $ | 24,746 | $ | 23,426 | (3.0) | % | 25.0 | % |
(1)Amounts not allocated to segments include interest (income) expense and general corporate (income) expense. The fiscal first quarter of 2023 includes the incremental $6.9 billion charge related to the talc settlement proposal.
Consumer Health Segment
The Consumer Health segment income before tax as a percent of sales in the fiscal first quarter of 2023 was 20.1% versus 19.1% for the same period a year ago. The increase in the income before tax as a percent of sales in the fiscal first quarter of 2023 as compared to the prior year was primarily driven by the following:
- pricing actions
partially offset by
- commodity inflation
Pharmaceutical Segment
The Pharmaceutical segment income before tax as a percent of sales in the fiscal first quarter of 2023 was 33.1% versus 30.5% for the same period a year ago. The increase in the income before tax as a percent of sales for the fiscal first quarter as compared to the prior year was primarily driven by the following:
-
An IPR&D charge of $0.6 billion in 2022 related to bermekimab (JnJ-77474462), an investigational drug for the treatment of AD and Hidradenitis Suppurativa (HS)
-
Unfavorable changes in the fair value of securities in 2022 of $0.4 billion
-
Leveraging in selling and marketing expenses
partially offset by
-
COVID-19 Vaccine related exit costs of $0.4 billion in 2023
-
Restructuring charges of $0.1 billion in 2023
-
Unfavorable product mix
MedTech Segment
The MedTech segment income before tax as a percent of sales in the fiscal first quarter of 2023 was 19.3% versus 21.2% for the same period a year ago. The decrease in the income before tax as a percent of sales for the fiscal first quarter was primarily driven by the following:
-
Higher amortization expense of $0.1 billion in 2023 related to Abiomed
-
An IPR&D charge in 2023 of approximately $0.1 billion related to the Pulsar Vascular acquisition
-
Acquisition costs related to Abiomed
-
Commodity inflation in 2023
partially offset by
-
No Restructuring charges in 2023 versus $0.1 billion in 2022
-
Proactive management of costs
Table of Content
Restructuring
In the first quarter of 2023, the Company completed a prioritization of its research and development (R&D) investment within the Pharmaceutical segment to focus on the most promising medicines with the greatest benefit to patients. This resulted in the exit of certain programs including the discontinuation of its respiratory syncytial virus (RSV) adult vaccine program, HIV and hepatitis. The pre-tax restructuring charge of approximately $0.1 billion in the fiscal first quarter of 2023 includes the termination of partnered and non-partnered program costs and asset impairments. In the fiscal first quarter of 2022, the Company recorded a pre-tax charge of $0.1 billion related to a restructuring program of its Global Supply Chain. The Global Supply Chain program was announced in the second quarter of 2018 and was completed in the fiscal fourth quarter of 2022.
Provision for Taxes on Income
The worldwide effective income tax rate for the first fiscal three months of 2023 was 90.8% in 2023 and 12.2% in 2022.
On December 15, 2022, the European Union (EU) Member States formally adopted the EU’s Pillar Two Directive, which generally provides for a minimum effective tax rate of 15%, as established by the Organization for Economic Co-operation and Development (OECD) Pillar Two Framework that was supported by over 130 countries worldwide. The EU effective dates are January 1, 2024, and January 1, 2025, for different aspects of the directive. A significant number of other countries are also implementing similar legislation. The Company is continuing to evaluate the potential impact on future periods of the Pillar Two Framework, pending legislative adoption by additional individual countries, including those within the European Union.
Subsequent to April 2, 2023, as part of the planned separation of the Company’s Consumer Health business the Company anticipates the recognition of approximately $0.5 billion in incremental international tax costs due to the reorganization of certain international subsidiaries in the fiscal second quarter of 2023. During the fiscal year 2023, the Company is expected to incur additional tax costs related to the legal separation of the Consumer Health business.
For discussion related to the 2023 provision for taxes refer to Note 5 to the Consolidated Financial Statements.
LIQUIDITY AND CAPITAL RESOURCES
Cash Flows
Cash, cash equivalents and restricted cash were $26.9 billion at the end of the fiscal first quarter of 2023 as compared with $14.1 billion at the end of fiscal year 2022. The primary sources and uses of cash that contributed to the $12.8 billion increase were:
| (Dollars In Billions) | |||||
| $ | 14.1 | Q4 2022 Cash and cash equivalents balance | |||
| 3.3 | net cash generated from operating activities | ||||
| 3.3 | net cash generated from investing activities | ||||
| 6.1 | net cash generated from financing activities | ||||
| 0.1 | rounding | ||||
| $ | 26.9 | Q1 2023 Cash, cash equivalents and restricted cash balance |
In addition, the Company had $5.4 billion in marketable securities at the end of the fiscal first quarter of 2023 and $9.4 billion at the end of fiscal year 2022.
Table of Content
Cash flow from operations of $3.3 billion was the result of:
| (Dollars In Billions) | |||||
| $ | (0.1) | Net Loss | |||
| 1.1 | non-cash expenses and other adjustments primarily for depreciation and amortization, stock-based compensation, asset write-downs and credit losses and accounts receivable allowances partially offset by the deferred tax provision and net gain on sale of assets/businesses | ||||
| (0.6) | an increase in accounts receivable and inventories | ||||
| (2.6) | a decrease in accounts payable and accrued liabilities | ||||
| (0.9) | an increase in other current and non-current assets | ||||
| 6.3 | an increase in other current and non-current liabilities | ||||
| 0.1 | Rounding | ||||
| $ | 3.3 | Cash Flow from operations |
Cash flow from investing activities of $3.3 billion was primarily from:
| (Dollars In Billions) | |||||
| (0.9) | additions to property, plant and equipment | ||||
| 4.0 | net sales of investments | ||||
| 0.2 | credit support agreements activity, net | ||||
| $ | 3.3 | Net cash from investing activities |
Cash flow from financing activities of $6.1 billion was primarily from:
| (Dollars In Billions) | |||||
| $ | (2.9) | dividends to shareholders | |||
| (3.5) | repurchase of common stock | ||||
| 5.2 | net proceeds from short term debt and repayment of long term debt | ||||
| 7.7 | proceeds from Kenvue long term debt, net of issuance cost | ||||
| $ | (0.4) | other and rounding | |||
| $ | 6.1 | Net cash from financing activities |
The Company has access to substantial sources of funds at numerous banks worldwide. In September 2022, the Company secured a new 364-day Credit Facility of $10 billion, which expires on September 7, 2023. In November 2022, the Company secured an additional 364-day revolving Credit Facility of $10 billion, which has an expiration of November 21, 2023. Interest charged on borrowings under the credit line agreement is based on either Secured Overnight Financing Rate (SOFR) Reference Rate or other applicable market rate as allowed plus applicable margins. Commitment fees under the agreement are not material.
In March 2023, Kenvue, a wholly owned subsidiary of the Company, priced an offering of senior unsecured notes in an aggregate principal amount of $7.75 billion (See Note 4 to the Consolidated Financial Statements for additional details). The senior unsecured notes (the Notes) will be senior unsecured obligations of Kenvue and will initially be fully and unconditionally guaranteed (the Guarantees) on a senior unsecured basis by the Company. The Guarantees will terminate upon (1) the completion in all material respects of the transfer of the assets and liabilities of Johnson & Johnson’s Consumer Health Business to Kenvue and (2) Kenvue having registered equity securities. The Notes were issued in connection with Johnson & Johnson’s separation of its Consumer Health Business. Kenvue intends to use the proceeds from the offering of the Notes as partial consideration to Johnson & Johnson for the Consumer Health Business that Johnson & Johnson will transfer to Kenvue. The proceeds of the Notes offering were placed in a segregated escrow account pending the transfer of the assets and liabilities of the Consumer Health Business to Kenvue and as such, classified as restricted cash as of the balance sheet date. On April 5, 2023, the net proceeds of the Notes were released from escrow upon completion of the Consumer Health Business transfer.
Table of Content
Further, in March 2023, Kenvue entered into a credit agreement providing for a five-year senior unsecured revolving credit facility (the Revolving Credit Facility) in an aggregate principal amount of $4.0 billion to be made available in U.S. dollars and Euros. The Revolving Credit Facility contains representations and warranties, covenants and events of default that are customary for this type of financing, including covenants restricting the incurrence of liens and the entry into certain merger transactions. In addition, Kenvue entered into a commercial paper program (the Commercial Paper Program) of up to $4.0 billion in aggregate principal amount of commercial paper under the Commercial Paper Program. The Commercial Paper Program contains representations and warranties, covenants and default that are customary for this type of financing.
Subsequent to the fiscal first quarter, on April 24, 2023, the Company announced that Kenvue has launched a roadshow for the initial public offering (“IPO”) of 151,204,000 shares of its common stock. Kenvue expects to grant the underwriters a 30-day option to purchase up to an additional 22,680,600 shares of its common stock to cover over-allotments, if any. The IPO price is currently expected to be between $20.00 and $23.00 per share. Kenvue has applied to list its common stock on the New York Stock Exchange under the symbol “KVUE.” After the completion of the IPO, Johnson & Johnson will own 1,716,160,000 shares of Kenvue’s common stock, representing 91.9% of the total outstanding shares of Kenvue’s common stock (or 90.8% if the underwriters exercise in full their over-allotment option).
As of April 2, 2023, the Company's cash, cash equivalents, restricted cash ($7.7 billion related to Kenvue) and marketable securities was approximately $32.3 billion and had approximately $52.9 billion of notes payable and long-term debt ($7.7 billion related to Kenvue) for a net debt position of $20.6 billion as compared to the prior year net debt position of $2.8 billion. Considering recent market conditions, the Company has re-evaluated its operating cash flows and liquidity profile and does not foresee any significant incremental risk. The Company anticipates that operating cash flows, the ability to raise funds from external sources, borrowing capacity from existing committed credit facilities and access to the commercial paper markets will continue to provide sufficient resources to fund operating needs, including the Company’s remaining balance to be paid on the agreement to settle opioid litigation for approximately $2.5 billion and the establishment of the $8.9 billion reserve (present value) for the talc settlement proposal. (See Note 11 to the Consolidated Financial Statements for additional details). In addition, the Company monitors the global capital markets on an ongoing basis and from time to time may raise capital when market conditions are favorable.
Subsequent to April 2, 2023, the Company paid approximately $3.5 billion to the U.S. Treasury including $1.5 billion related to the current installment due on foreign undistributed earnings as part of the TCJA charge (see Note 1 to the Consolidated Financial Statements in the Company’s Annual Report on Form 10-K for the fiscal year ended January 1, 2023), $1.4 billion in advance payments to resolve certain items under examination in its 2013 through 2016 U.S. IRS audit, and $0.6 billion primarily related to the normal estimated payment for the fiscal first quarter of 2023.
On September 14, 2022, the Company announced that its Board of Directors approved a share repurchase program, authorizing the Company to purchase up to $5.0 billion of the Company’s Common Stock. Any shares acquired will be available for general corporate purposes. As of April 2, 2023, $5.0 billion has been repurchased and the repurchase program was completed.
Dividends
On January 3, 2023, the Board of Directors declared a regular cash dividend of $1.13 per share, payable on March 7, 2023, to shareholders of record as of February 21, 2023.
On April 18, 2023, the Board of Directors declared a regular cash dividend of $1.19 per share, payable on June 6, 2023, to shareholders of record as of May 23, 2023. The Company expects to continue the practice of paying regular quarterly cash dividends.
OTHER INFORMATION
New Accounting Pronouncements
Refer to Note 1 to the Consolidated Financial Statements for new accounting pronouncements.
Economic and Market Factors
Russia-Ukraine War
Although the long-term implications of Russia’s invasion of Ukraine are difficult to predict at this time, the financial impact of the conflict in the fiscal first quarter of 2023, including accounts receivable or inventory reserves, was not material. As of both the fiscal first quarter ending April 2, 2023, and the 2022 fiscal year ending January 1, 2023, the business of the Company’s Ukraine subsidiaries represented less than 1% of the Company’s consolidated assets and revenues. As of both the fiscal first quarter ending April 2, 2023, and the 2022 fiscal year ending January 1, 2023, the business of the Company’s Russian subsidiaries represented less than 1% of the Company’s consolidated assets and represented 1% of revenues.
Table of Content
In early March of 2022, the Company took steps to suspend all advertising, enrollment in clinical trials, and any additional investment in Russia. Additionally, at the end of March 2022, the Company made the decision to suspend supply of personal care products in Russia. The Company continues to supply its other products as patients rely on many of the products for healthcare purposes.
The Company operates in certain countries where the economic conditions continue to present significant challenges. The Company continues to monitor these situations and take appropriate actions. Inflation rates and currency exchange rates continue to have an effect on worldwide economies and, consequently, on the way the Company operates. The Company has accounted for operations in Venezuela, Argentina and Turkey (beginning in the fiscal second quarter of 2022) as highly inflationary, as the prior three-year cumulative inflation rate surpassed 100%. In the face of increasing costs, the Company strives to maintain its profit margins through cost reduction programs, productivity improvements and periodic price increases.
Governments around the world consider various proposals to make changes to tax laws, which may include increasing or decreasing existing statutory tax rates. In connection with various government initiatives, companies are required to disclose more information to tax authorities on operations around the world, which may lead to greater audit scrutiny of profits earned in other countries. A change in statutory tax rate in any country would result in the revaluation of the Company’s deferred tax assets and liabilities related to that particular jurisdiction in the period in which the new tax law is enacted. This change would result in an expense or benefit recorded to the Company’s Consolidated Statement of Earnings. The Company closely monitors these proposals as they arise in the countries where it operates. Changes to the statutory tax rate may occur at any time, and any related expense or benefit recorded may be material to the fiscal quarter and year in which the law change is enacted.
The Company faces various worldwide health care changes that may continue to result in pricing pressures that include health care cost containment and government legislation relating to sales, promotions and reimbursement of health care products.
Changes in the behavior and spending patterns of purchasers of healthcare products and services, including delaying medical procedures, rationing prescription medications, reducing the frequency of physician visits and foregoing healthcare insurance coverage, as a result of the current global economic downturn, may continue to impact the Company’s businesses.
The Company faces regular intellectual property challenges from third parties, including generic and biosimilar manufacturers, seeking to manufacture and market generic and biosimilar versions of key pharmaceutical products prior to the expiration of the applicable patents. These challengers file Abbreviated New Drug Applications or abbreviated Biologics License Applications with the FDA or otherwise challenged the coverage and/or validity of the Company’s patents. In the event the Company is not successful in defending the patent claims challenged in the resulting lawsuits, generic or biosimilar versions of the products at issue may be introduced to the market, resulting in the potential for substantial market share and revenue losses for those products, and which may result in a non-cash impairment charge in any associated intangible asset. There is also risk that one or more competitors could launch a generic or biosimilar version of the product at issue following regulatory approval even though one or more valid patents are in place.
Previous: Item 1. FINANCIAL STATEMENTS · Next: Item 3. QUANTITATIVE AND QUALITATIVE DISCLOSURES ABOUT MARKET RISK