 filings.tools
Item 2. Management’s Discussion & Analysis of Financial Condition & Results of Operations
201K characters. Original on sec.gov · Markdown
Item 2. Management’s Discussion & Analysis of Financial Condition & Results of Operations
Introduction
This section reviews the financial condition and results of operations of KeyCorp and its subsidiaries for the quarterly periods ended March 31, 2023, and March 31, 2022. Some tables may include additional periods to comply with disclosure requirements or to illustrate trends in greater depth. When you read this discussion, you should also refer to the consolidated financial statements and related notes in this report. The page locations of specific sections and notes that we refer to are presented in the Table of Contents.
References to our “2022 Form 10-K” refer to our Form 10-K for the year ended December 31, 2022, which has been filed with the SEC and is available on its website (www.sec.gov) and on our website (www.key.com/ir).
Terminology
Throughout this discussion, references to “Key,” “we,” “our,” “us,” and similar terms refer to the consolidated entity consisting of KeyCorp and its subsidiaries. “KeyCorp” refers solely to the parent holding company, and “KeyBank” refers solely to KeyCorp’s subsidiary bank, KeyBank National Association. “KeyBank (consolidated)” refers to the consolidated entity consisting of KeyBank and its subsidiaries.
We want to explain some industry-specific terms at the outset so you can better understand the discussion that follows.
-
We use the phrase continuing operations in this document to mean all of our businesses other than our government-guaranteed and private education lending business, which has been accounted for as discontinued operations since 2009.
-
We engage in capital markets activities primarily through business conducted by our Commercial Bank segment*.* These activities encompass a variety of products and services. Among other things, we trade securities as a dealer, enter into derivative contracts (both to accommodate clients’ financing needs and to mitigate certain risks), and conduct transactions in foreign currencies (to accommodate clients’ needs).
-
For regulatory purposes, capital is divided into two classes. Federal regulations currently prescribe that at least one-half of a bank or BHC’s total risk-based capital must qualify as Tier 1 capital. Both total and Tier 1 capital serve as bases for several measures of capital adequacy, which is an important indicator of financial stability and condition. Banking regulators evaluate a component of Tier 1 capital, known as Common Equity Tier 1, under the Regulatory Capital Rules. The “Capital” section of this report under the heading “Capital adequacy” provides more information on total capital, Tier 1 capital, and the Regulatory Capital Rules, including Common Equity Tier 1, and describes how these measures are calculated.
The acronyms and abbreviations identified below are used in the Management’s Discussion & Analysis of Financial Condition & Results of Operations as well as in the Notes to Consolidated Financial Statements (Unaudited). You may find it helpful to refer back to this page as you read this report.
| ABO: Accumulated benefit obligation. ALCO: Asset/Liability Management Committee. ALLL: Allowance for loan and lease losses. A/LM: Asset/liability management. AML: Anti-money laundering. AOCI: Accumulated other comprehensive income (loss). APBO: Accumulated postretirement benefit obligation. AQN Strategies: Arbitria Quum Notitia, LLC. ARRC: Alternative Reference Rates Committee. ASC: Accounting Standards Codification. ASR: Accelerated share repurchase. ASU: Accounting Standards Update. ATMs: Automated teller machines. BSA: Bank Secrecy Act. BHCA: Bank Holding Company Act of 1956, as amended. BHCs: Bank holding companies. Board: KeyCorp Board of Directors. CAPM: Capital Asset Pricing Model. CARES Act: Coronavirus Aid, Relief, and Economic Security Act CCAR: Comprehensive Capital Analysis and Review. Cain Brothers: Cain Brothers & Company, LLC. CECL: Current Expected Credit Losses. CFPB: Consumer Financial Protection Bureau, also known as the Bureau of Consumer Financial Protection. CFTC: Commodities Futures Trading Commission. CMBS: Commercial mortgage-backed securities. CMO: Collateralized mortgage obligation. Common Shares: KeyCorp common shares, $1 par value. CVA: Credit valuation adjustment. DCF: Discounted cash flow. DIF: Deposit Insurance Fund of the FDIC. Dodd-Frank Act: Dodd-Frank Wall Street Reform and Consumer Protection Act of 2010. EAD: Exposure at default. EBITDA: Earnings before interest, taxes, depreciation, and amortization. EPS: Earnings per share. ERISA: Employee Retirement Income Security Act of 1974. ERM: Enterprise risk management. ESG: Environmental, social, and governance. EVE: Economic value of equity. FASB: Financial Accounting Standards Board. FDIA: Federal Deposit Insurance Act, as amended. FDIC: Federal Deposit Insurance Corporation. Federal Reserve: Board of Governors of the Federal Reserve System. FHLB: Federal Home Loan Bank of Cincinnati. FHLMC: Federal Home Loan Mortgage Corporation. FICO: Fair Isaac Corporation. FINRA: Financial Industry Regulatory Authority. First Niagara: First Niagara Financial Group, Inc. FNMA: Federal National Mortgage Association. | FSOC: Financial Stability Oversight Council. FVA: Fair value of employee benefit plan assets. GAAP: U.S. generally accepted accounting principles. GNMA: Government National Mortgage Association. HTC: Historic tax credit. IRS: Internal Revenue Service. ISDA: International Swaps and Derivatives Association. KBCM: KeyBanc Capital Markets, Inc. KCC: Key Capital Corporation. KCDC: Key Community Development Corporation. KCIC: Key Community Investment Capital LLC. KEF: Key Equipment Finance. LCR: Liquidity coverage ratio. LGD: Loss given default. LIBOR: London Interbank Offered Rate. LIHTC: Low-income housing tax credit. LTV: Loan-to-value. Moody’s: Moody’s Investor Services, Inc. MRM: Market Risk Management group. MRC: Market Risk Committee. N/A: Not applicable. NAV: Net asset value. NFA: National Futures Association. N/M: Not meaningful. NMTC: New market tax credit. NOW: Negotiable Order of Withdrawal. NPR: Notice of proposed rulemaking. NSF: Non-sufficient funds. NYSE: New York Stock Exchange. OCC: Office of the Comptroller of the Currency. OCI: Other comprehensive income (loss). OREO: Other real estate owned. PBO: Projected benefit obligation. PCCR: Purchased credit card relationship. PCD: Purchased credit deteriorated. PD: Probability of default. PPP: Paycheck Protection Program. RMBS: Residential mortgage-backed securities. S&P: Standard and Poor’s Ratings Services, a Division of The McGraw-Hill Companies, Inc. SEC: U.S. Securities & Exchange Commission. SIFIs: Systemically important financial institutions, including large, interconnected BHCs and nonbank financial companies designated by FSOC for supervision by the Federal Reserve. SOFR: Secured Overnight Financing Rate. TDR: Troubled debt restructuring. TE: Taxable-equivalent. U.S. Treasury: United States Department of the Treasury. VaR: Value at risk. VEBA: Voluntary Employee Beneficiary Association. VIE: Variable interest entity. |
Forward-looking statements
From time to time, we have made or will make forward-looking statements within the meaning of the Private Securities Litigation Reform Act of 1995. These statements do not relate strictly to historical or current facts. Forward-looking statements usually can be identified by the use of words such as “goal,” “objective,” “plan,” “expect,” “assume,” “anticipate,” “intend,” “project,” “believe,” “estimate,” “will,” “would,” “should,” “could,” or other words of similar meaning. Forward-looking statements provide our current expectations or forecasts of future events, circumstances, results or aspirations. Our disclosures in this report contain forward-looking statements. We may also make forward-looking statements in other documents filed with or furnished to the SEC. In addition, we may make forward-looking statements orally to analysts, investors, representatives of the media, and others.
Forward-looking statements, by their nature, are subject to assumptions, risks, and uncertainties, many of which are outside of our control. Our actual results may differ materially from those set forth in our forward-looking statements.
There is no assurance that any list of risks and uncertainties or risk factors is complete. Factors that could cause our actual results to differ from those described in forward-looking statements include, but are not limited to:
-
our concentrated credit exposure in commercial and industrial loans;
-
deterioration of commercial real estate market fundamentals;
-
defaults by our loan counterparties or clients;
-
adverse changes in credit quality trends;
-
declining asset prices;
-
deterioration of asset quality and an increase in credit losses;
-
labor shortages and supply chain constraints, as well as the impact of inflation;
-
the extensive regulation of the U.S. financial services industry;
-
changes in accounting policies, standards, and interpretations;
-
operational or risk management failures by us or critical third parties;
-
breaches of security or failure or unavailability of our technology systems due to technological or other factors and cybersecurity threats;
-
negative outcomes from claims or litigation;
-
failure or circumvention of our controls and procedures;
-
the occurrence of natural disasters, which may be exacerbated by climate change;
-
societal responses to climate change;
-
increased operational risks resulting from remote work;
-
evolving capital and liquidity standards under applicable regulatory rules;
-
disruption of the U.S. financial system, including the impact of inflation and a potential global economic downturn or recession;
-
the impact of any failure by the U.S. government to increase the debt ceiling or any government shutdown;
-
our ability to receive dividends from our subsidiaries, including KeyBank;
-
unanticipated changes in our liquidity position, including but not limited to, changes in our access to or the cost of funding and our ability to secure alternative funding sources;
-
downgrades in our credit ratings or those of KeyBank;
-
a worsening of the U.S. economy due to financial, political or other shocks;
-
our ability to anticipate interest rate changes and manage interest rate risk;
-
uncertainty surrounding the transition from LIBOR to an alternate reference rate;
-
deterioration of economic conditions in the geographic regions where we operate;
-
the soundness of other financial institutions, including the impact from the recent bank failures;
-
our ability to manage our reputational risks;
-
our ability to timely and effectively implement our strategic initiatives;
-
increased competitive pressure;
-
our ability to adapt our products and services to industry standards and consumer preferences;
-
our ability to attract and retain talented executives and employees;
-
unanticipated adverse effects of strategic partnerships or acquisitions and dispositions of assets or businesses and;
-
our ability to develop and effectively use the quantitative models we rely upon in our business planning.
Any forward-looking statements made by us or on our behalf speak only as of the date they are made, and we do not undertake any obligation to update any forward-looking statement to reflect the impact of subsequent events or circumstances, except as required by applicable securities laws. Before making an investment decision, you should carefully consider all risks and uncertainties disclosed in our 2022 Form 10-K, Part II, Item 1A "Risk Factors" of this report, and any subsequent reports filed with the SEC by Key, as well as our registration statements under the Securities Act of 1933, as amended, all of which are or will upon filing be accessible on the SEC’s website at www.sec.gov and on our website at www.key.com/ir.
Long-term financial targets
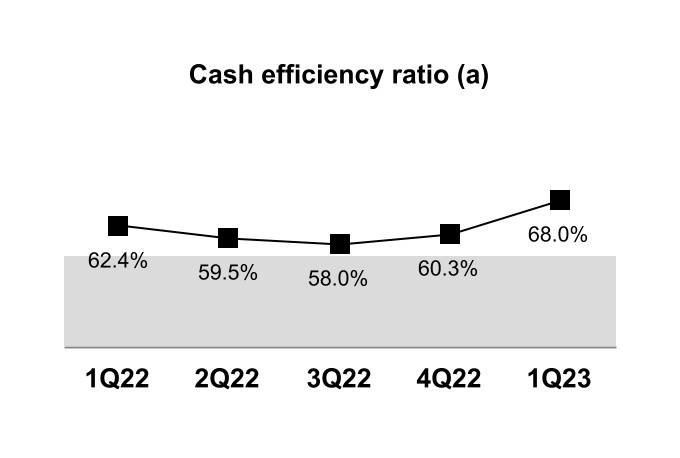
(a)See the section entitled “GAAP to Non-GAAP Reconciliations,” which presents the computations of certain financial measures related to “cash efficiency.” The section includes tables that reconcile the GAAP performance measures to the corresponding non-GAAP measures, which provides a basis for period-to-period comparisons.
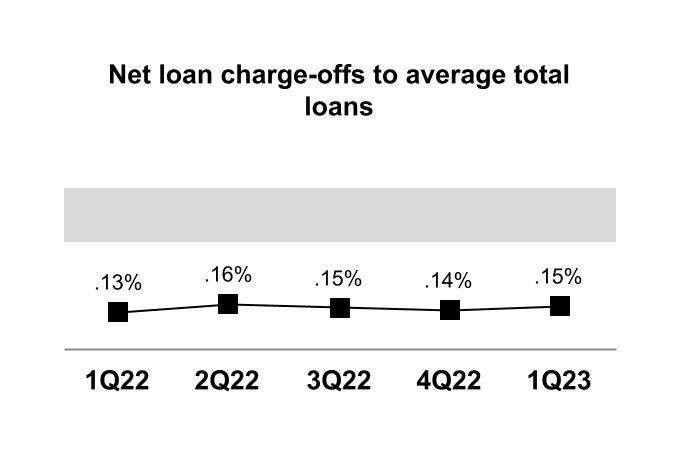
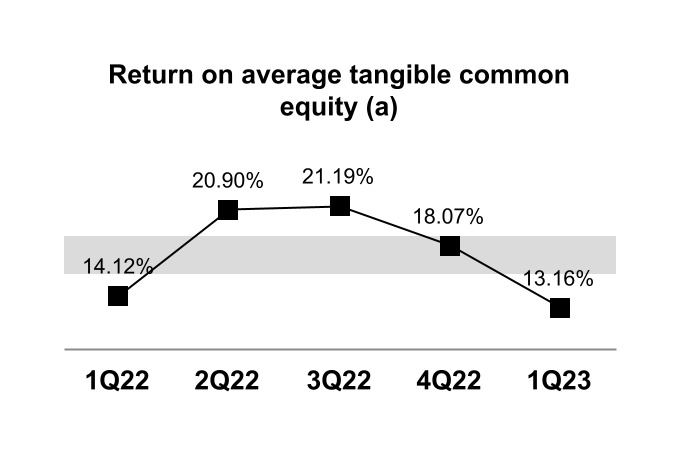
(a)See the section entitled “GAAP to Non-GAAP Reconciliations,” which presents the computations of certain financial measures related to “tangible common equity.” The section includes tables that reconcile the GAAP performance measures to the corresponding non-GAAP measures, which provides a basis for period-to-period comparisons.
Positive Operating Leverage
Generate positive operating leverage and a cash efficiency ratio in the range of 54% to 56%.
We have exercised disciplined expense management, completing actions in the first quarter of 2023 to keep expenses relatively stable in 2023, while retaining room for investments to drive future growth. As such, our efficiency ratio in the first quarter of 2023 reflected $64 million of pre-tax costs related to expense actions, including $36 million in severance and $28 million in other costs. Our commitment to positive operating leverage remains.
Moderate Risk Profile
Maintain a moderate risk profile by targeting a net loan charge-offs to average loans ratio in the range of .40% to .60% through a credit cycle.
We believe our strong risk management practices and disciplined underwriting continue to strengthen our credit quality. Net charge-offs to average loans remain at low levels, in alignment with our moderate risk profile.
Financial Return
A return on average tangible common equity in the range of 16% to 19%.
Our relationship-based business model, strong expense management and disciplined underwriting continue to drive sound profitable growth.
Strategic developments
Our actions and results during the first quarter of 2023 support our corporate strategy described in the “Introduction” section under the “Corporate strategy” heading on page 49 of our 2022 Form 10-K.
-
Our relationship-based business model provides us with a strong granular deposit base and attractive lending and fee-based opportunities. Our long-term strategic commitment to primacy, that is, serving as our client's primary bank, continues to serve us well.
-
We grew and expanded relationships, with our differentiated originate-to-distribute model enabling us to support our clients on and off-balance sheet. Market disruption has provided further opportunity for client acquisition.
-
Our Laurel Road business is expanding in 2023 to serve the distinct needs of healthcare professionals through hospital system partnerships.
-
We continue to focus on deepening client relationships, including the growth of mass affluent retail relationships through Key Wealth Management.
-
Overall, credit quality remains strong as our new loan originations in both our commercial and consumer business continue to meet our criteria for high quality loans as we continue to effectively manage risk and rewards. Our continuous focus on maintaining our risk discipline has and will continue to position us to perform well through all business cycles.
-
Our strong capital position allows us to continue to execute against our capital priorities. During the first quarter, the Board of Directors declared a Common Share dividend of $.205 per Common Share, and our Common Equity Tier 1 ratio is 9.1%.
Current year expectations - full year 2023 vs. full year 2022
| Category | Expectations (a) | |||||||
| Average loans | up 6% to 9% | |||||||
| Average deposits | flat to down 2% | |||||||
| Net interest income (TE) | down 1% to 3% | |||||||
| Noninterest income | down 1% to 3% | |||||||
| Noninterest expense | relatively stable | |||||||
| Net charge-offs to average loans | 25 to 30 basis points | |||||||
| Effective tax rate | 20% to 21% |
(a) Relatively stable: +/- 2%
Demographics
The Consumer Bank serves individuals and small businesses throughout our 15-state branch footprint as well as healthcare professionals nationally through our Laurel Road digital brand by offering a variety of deposit and investment products, personal finance and financial wellness services, lending, student loan refinancing, mortgage and home equity, credit card, treasury services, and business advisory services. In addition, wealth management and investment services are offered to assist non-profit and high-net-worth clients with their banking, trust, portfolio management, life insurance, charitable giving, and related needs.
The Commercial Bank consists of the Commercial and Institutional operating segments. The Commercial operating segment is a full-service, commercial banking platform that focuses primarily on serving the borrowing, cash management, and capital markets needs of middle market clients within Key’s 15-state branch footprint. It is also a significant, national, commercial real estate lender and third-party servicer of commercial mortgage loans and special servicer of CMBS. The Institutional operating segment operates nationally in providing lending, equipment financing, and banking products and services to large corporate and institutional clients. The industry coverage and product teams have established expertise in the following sectors: Consumer, Energy, Healthcare, Industrial, Public Sector, Real Estate, and Technology. This operating segment includes the KBCM platform, which provides a broad suite of capital markets products and services including syndicated finance, debt and equity capital markets, derivatives, foreign exchange, financial advisory, and public finance. Additionally, KBCM provides fixed income and equity sales and trading services to investor clients.
Supervision and regulation
The following discussion provides a summary of recent regulatory developments and should be read in conjunction with the disclosure included in our 2022 Form 10-K under the heading “Supervision and Regulation” in Item 1. Business and under the heading “II. Compliance Risk” in Item 1A. Risk Factors as well as the disclosure included in Part II, Item 1A. "Risk Factors" of this report.
Regulatory capital requirements
KeyCorp and KeyBank are subject to regulatory capital requirements that are based largely on the Basel III international capital framework (“Basel III”). The Basel III capital framework and the U.S. implementation of the Basel III capital framework (“Regulatory Capital Rules”) are discussed in more detail in Item 1. Business of our 2022 Form 10-K under the heading “Supervision and Regulation — Regulatory capital requirements.”
Under the Regulatory Capital Rules, standardized approach banking organizations, such as KeyCorp and KeyBank, are required to meet the minimum capital and leverage ratios set forth in Figure 1 below. At March 31, 2023, KeyCorp’s ratios under the fully phased-in Regulatory Capital Rules are set forth in Figure 1.
Figure 1. Minimum Capital Ratios and KeyCorp Ratios Under the Regulatory Capital Rules
| Ratios (including stress capital buffer) | Regulatory Minimum Requirement | Stress Capital Buffer (b) | Regulatory Minimum With Stress Capital Buffer | KeyCorp March 31, 2023 (c) | ||||||||||
| Common Equity Tier 1 | 4.5 | % | 2.5 | % | 7.0 | % | 9.1 | % | ||||||
| Tier 1 Capital | 6.0 | 2.5 | 8.5 | 10.6 | ||||||||||
| Total Capital | 8.0 | 2.5 | 10.5 | 12.8 | ||||||||||
| Leverage (a) | 4.0 | N/A | 4.0 | 8.8 |
(a)As a standardized approach banking organization, KeyCorp is not subject to the 3% supplemental leverage ratio requirement, which became effective January 1, 2018.
(b)Stress capital buffer must consist of Common Equity Tier 1 capital. As a standardized approach banking organization, KeyCorp is not subject to the countercyclical capital buffer of up to 2.5% imposed upon an advanced approaches banking organization under the Regulatory Capital Rules.
(c)Ratios reflect the five-year transition of CECL impacts on regulatory ratios.
Revised prompt corrective action framework
The federal prompt corrective action (“PCA”) framework under the FDIA groups FDIC-insured depository institutions into one of five prompt corrective action capital categories: “well capitalized,” “adequately capitalized,” “undercapitalized,” “significantly undercapitalized,” and “critically undercapitalized.” In addition to implementing the Basel III capital framework in the United States, the Regulatory Capital Rules also revised the PCA capital category threshold ratios applicable to FDIC-insured depository institutions such as KeyBank, with an effective date of January 1, 2015. The revised PCA framework table in Figure 2 identifies the capital category thresholds for a “well capitalized” and an “adequately capitalized” institution under the PCA Framework.
Figure 2. "Well Capitalized" and "Adequately Capitalized" Capital Category Ratios under Revised PCA Framework
| Prompt Corrective Action | Capital Category | ||||||||||
| Ratio | Well Capitalized (a) | Adequately Capitalized | |||||||||
| Common Equity Tier 1 Risk-Based | 6.5 | % | 4.5 | % | |||||||
| Tier 1 Risk-Based | 8.0 | 6.0 | |||||||||
| Total Risk-Based | 10.0 | 8.0 | |||||||||
| Tier 1 Leverage (b) | 5.0 | 4.0 |
(a)A “well capitalized” institution also must not be subject to any written agreement, order, or directive to meet and maintain a specific capital level for any capital measure.
(b)As a “standardized approach” banking organization, KeyBank is not subject to the 3% supplemental leverage ratio requirement, which became effective January 1, 2018.
As of March 31, 2023, KeyBank (consolidated) satisfied the risk-based and leverage capital requirements necessary to be considered “well capitalized” for purposes of the PCA framework. However, investors should not regard this determination as a representation of the overall financial condition or prospects of KeyBank because the PCA framework is intended to serve a limited supervisory function. Moreover, it is important to note that the PCA framework does not apply to BHCs, like KeyCorp.
Capital planning and stress testing
On June 23, 2022, the Federal Reserve announced the results of the supervisory stress test that it conducted of 34 BHCs having more than $100 billion in total consolidated assets (including KeyCorp). The Federal Reserve indicated that all BHCs subject to the stress test maintained capital ratios above the minimum required levels under
the severely adverse scenario. The stress test results for individual BHCs were used to determine a BHC’s stress capital buffer requirement, which became effective on October 1, 2022, and will remain in effect until September 30, 2023, unless the firm later receives an updated stress capital buffer requirement from the Federal Reserve. On August 4, 2022, the Federal Reserve confirmed that KeyCorp’s required stress capital buffer, based on its June 2022 stress test, is 2.5%, which is the minimum buffer required for banking organizations the size of KeyCorp.
See Item 1. Business of our 2022 Form 10-K under the heading “Supervision and Regulation - Regulatory capital requirements - Capital planning and stress testing” for a discussion of other developments concerning capital planning and stress testing requirements.
Liquidity requirements
See Item 1. Business of our 2022 Form 10-K under the heading “Supervision and Regulation - Regulatory capital requirements - Liquidity requirements” for a discussion of liquidity requirements, including the Liquidity Coverage Rules.
Deposit insurance and assessments
On October 18, 2022, the FDIC adopted a final rule, applicable to all insured depository institutions to increase the initial base deposit insurance assessment rate schedules uniformly by two basis points consistent with the Amended Restoration Plan approved by the FDIC on June 21, 2022. The FDIC indicated that it was taking this action in order to restore the DIF reserve ratio to the required statutory minimum of 1.35% by the statutory deadline of September 30, 2028. The FDIC said that the reserve ratio had declined below this level because of the increase in insured deposits since the start of the pandemic and other factors that affect the level of the DIF. Under the final rule, the increase in rates will begin with the first quarterly assessment period of 2023 and will remain in effect unless and until the reserve ratio meets or exceeds 2% in order to support growth in the DIF in progressing toward the FDIC’s long-term goal of a 2% reserve ratio. The increase in assessment rates will apply to KeyBank.
On March 10, 2023, and March 12, 2023, Silicon Valley Bank (“SVB”) and Signature Bank (“Signature”) were closed by the state banking authorities in California and New York, respectively, and the FDIC was appointed as receiver of SVB and Signature. All deposits of SVB and Signature were transferred to bridge banks established by the FDIC under the systemic risk exception in the FDIA so that the uninsured deposits as well as the insured deposits of both banks were protected by the FDIC. Under the FDIA, the loss to the DIF arising from the use of the systemic risk exception must be recovered through one or more special assessments on insured depository institutions, depository institution holding companies, or both, as the FDIC determines to be appropriate. The FDIA requires the FDIC to consider the following factors in designing any special assessment: the types of entities that benefit from the action taken, economic conditions, the effects on the industry, and such other factors as the FDIC deems appropriate and relevant to the action taken. The FDIC indicated that it expects to issue a notice of proposed rulemaking for a special assessment related to the failures of SVB and Signature in May of 2023. KeyBank and KeyCorp may be subject to any special assessment that the FDIC adopts.
See Item 1. Business of our 2022 Form 10-K under the heading “Supervision and Regulation – FDIA, Resolution Authority and Financial Stability - Deposit insurance and assessments” for a discussion of other developments concerning deposit insurance and assessments.
Resolution plans
On October 14, 2022, and October 18, 2022, the Federal Reserve and the FDIC issued an advanced notice of proposed rulemaking ("ANPR”) requesting public comment on the potential adoption of new resolution-related resource requirements for large banking organizations that are not a U.S. global systemically important bank (“GSIB”). The new requirements would potentially include a long-term debt requirement that would provide an extra layer of loss-absorbing capacity, a clean-holding company requirement (prohibiting certain financial arrangements such as short-term borrowings or derivatives), and a requirement for the identification of separability options in the context of recovery or resolution. The Federal Reserve and the FDIC stated that large banking organizations for this purpose are those banking organizations that have $100 billion or more in total consolidated assets and are not GSIBs but indicated that the focus of this ANPR was on Category II and Category III banking organizations, which are banking organizations with $250 billion or more in total consolidated assets or that meet certain risk-based
criteria. KeyCorp is a Category IV banking organization and would not be subject to the potential new requirements unless they are extended to Category IV banking organizations. Comments on the ANPR were due by December 23, 2022. The Federal Reserve and the FDIC extended the due date for comments to January 23, 2023.
See Item 1. Business of our 2022 Form 10-K under the heading “Supervision and Regulation - FDIA, Resolution Authority and Financial Stability - Resolution plans” for a discussion of other developments concerning resolution plans.
Volcker Rule
The Volcker Rule is discussed in detail in Item 1. Business of our 2022 Form 10-K under the heading “Supervision and Regulation - Other Regulatory Developments - Volcker Rule.” As of March 31, 2023, we are in the process of conforming and/or divesting certain indirect investments subject to the Volcker Rule.
Community Reinvestment Act
See Item 1. Business of our 2022 Form 10-K under the heading “Supervision and Regulation - Other Regulatory Developments - Community Reinvestment Act” for a discussion of developments concerning the CRA.
Supervision and governance
See Item 1. Business of our 2022 Form 10-K under the heading “Supervision and Regulation - Other Regulatory Developments - Supervision and governance” for a discussion of supervision and governance-related developments, including a discussion of the Large Financial Institution (“LFI”) Rating System.
Regulatory developments concerning COVID-19
See Item 1. Business of our 2022 Form 10-K under the heading “Supervision and Regulation - Other Regulatory Developments - Regulatory developments concerning COVID-19” for a discussion of regulatory developments relating to the COVID-19 pandemic.
Federal LIBOR transition legislation
On March 15, 2022, President Biden signed into law the Consolidated Appropriations Act, 2022, which contains the Adjustable Interest Rate (LIBOR) Act (the “LIBOR Act”). The LIBOR Act addresses certain issues relating to the transition from the use of LIBOR as a benchmark reference rate in contracts to the use of alternate reference rates. Among other things, the LIBOR Act (i) provides for the replacement, by operation of law, of LIBOR with a SOFR-based reference rate selected by the Federal Reserve for contracts which do not have effective fallback language; (ii) authorizes persons who have discretionary authority for selecting a LIBOR replacement to opt into a statutory safe harbor from liability by selecting the benchmark identified by the Federal Reserve; (iii) states that parties to a contract may opt out of the LIBOR Act; and (iv) provides that no federal supervisory agency may take supervisory action against a bank solely because the bank uses a benchmark rate other than SOFR.
On December 16, 2022, the Federal Reserve adopted a final rule to implement the LIBOR Act. The final rule establishes Federal Reserve-selected benchmark replacements for contracts governed by federal or state law that use LIBOR as a benchmark reference rate but do not provide for a clearly defined or practicable replacement after June 30, 2023, when LIBOR will no longer be available in its current form. The final rule identifies separate Federal Reserve-selected replacement rates for different categories of LIBOR contracts, including, among others, derivative transactions, consumer loans, and contracts involving entities regulated by the Federal Housing Finance Agency. Consistent with the LIBOR Act, each replacement rate is based on SOFR and incorporates spread adjustments for each specified tenor of LIBOR. The final rule also defines various terms and clarifies certain matters relating to the implementation, administration, and calculation of the benchmark replacement rate, including clarification of who is considered a “determining person” able to make the decision to use the Federal Reserve-selected rate in a LIBOR contract. In addition, the final rule indicates that this rule preempts any state or local law, regulation, or standard relating to the selection or use of a benchmark replacement for LIBOR or related conforming changes. The final rule ensures that LIBOR contracts adopting a Federal Reserve-selected benchmark will not be interrupted or terminated following LIBOR’s replacement. The final rule became effective February 27, 2023.
Developments relating to climate change
On March 21, 2022, the SEC issued for public comment a proposal to amend its rules under the Securities Act of 1933 and the Securities Exchange Act of 1934 to require public companies (including KeyCorp) to provide detailed climate-related information in their registration statements and periodic reports. Among other things, the proposal would require public companies to disclose information about (i) climate-related risks that are reasonably likely to have a material impact on the company’s business or financial statements over the short-, medium- or long-term; (ii) the actual and potential impacts of such risks on the company’s strategy, business model, and outlook; (iii) the role of the board of directors in overseeing climate-related risks and management’s role in assessing and managing such risks; (iv) the impact of climate-related events and transitional activities on line items in the company’s consolidated financial statements as well as the financial estimates and assumptions used in the financial statements; and (v) the company’s direct greenhouse gas emissions, indirect emissions from purchased energy, and, if material, indirect emissions from the company’s value chain (which may include financed emissions in a bank’s loan portfolio). The financial services industry has not yet adopted a standardized methodology for banks to use to quantitatively measure indirect emissions from a bank’s value chain, such as financed emissions. Accordingly, this proposal would require many banks to quantify and disclose financed emissions on a comprehensive scale for the first time. Comments on the SEC’s proposal were originally due by May 20, 2022. The comment period was extended to June 17, 2022. On October 7, 2022, the SEC reopened the comment period on this proposal until November 1, 2022, due to a technological error that resulted in a number of public comments submitted through the SEC’s comment website not being received by the SEC.
On December 2, 2022, the Federal Reserve issued for public comment proposed principles that would provide a high-level framework for the safe and sound management of exposures to climate-related financial risks for large banking organizations supervised by the Federal Reserve, including BHCs with over $100 billion in total consolidated assets (such as KeyCorp). The proposed principles would cover six areas: governance; policies, procedures, and limits; strategic planning; risk management; data, risk measurement, and reporting; and scenario analysis. The proposed principles would also describe how climate-related financial risks can be addressed by banking organizations in connection with various specific risk categories, including credit risk, liquidity risk, operational risk, and legal/compliance risk. The proposal issued by the OCC, which would apply to national banks (such as KeyBank), is discussed in our 2022 Form 10-K. The FDIC’s proposal, which would apply to insured state nonmember banks, state-licensed insured branches of foreign banks, and state savings associations, was issued on March 30, 2022. The Federal Reserve indicated that it intends to coordinate with the other federal banking agencies in issuing any final guidance on this subject. Comments on this proposal were due by February 6, 2023. We are awaiting the final rulemaking.
See Item 1. Business of our 2022 Form 10-K under the heading “Supervision and Regulation - Other Regulatory Developments - Developments relating to climate change” for a discussion of other regulatory developments relating to climate change.
Computer-Security Incident Notification Requirements
See Item 1. Business of our 2022 Form 10-K under the heading “Supervision and Regulation - Other Regulatory Developments – Computer-Security Incident Notification Requirements” for a discussion of regulatory developments relating to computer-security incident notification requirements.
NYSE Proposed Clawback Listing Standards
On October 26, 2022, the SEC adopted final rules implementing the incentive-based compensation recovery (clawback) provisions mandated by Section 954 of the Dodd-Frank Act. The rules, which are set forth under new Rule 10D-1 of the Securities Exchange Act of 1934, as amended, directed U.S. stock exchanges to establish listing standards requiring listed companies to adopt policies providing for the recovery (or clawback), in the event of a required accounting restatement, of incentive-based compensation received by current or former executive officers where such compensation is based on the erroneously reported financial information (a “Clawback Policy”). Under the rules, a company must recover erroneously awarded incentive compensation “reasonably promptly” after such obligation is incurred. Rule 10D-1 also requires that the listing standards include disclosure requirements related to clawbacks.
On February 22, 2023, the NYSE and Nasdaq proposed new listing standards that are substantially identical to Rule 10D-1 under the Exchange Act. Consistent with Rule 10D-1, the proposed NYSE listing standards would require NYSE-listed companies, including KeyCorp, to (i) adopt and implement a compliant Clawback Policy, (ii) file the Clawback Policy as an exhibit to their annual reports, and (iii) provide certain disclosures relating to any compensation recovery triggered by the policy. Under the NYSE proposal, NYSE would suspend trading and commence delisting procedures when it determines that a listed company has not recovered compensation as required by its Clawback Policy reasonably promptly after such obligation is incurred.
The public comment period on NYSE’s proposed listing standards ended on April 3, 2023. The NYSE proposal will become effective when approved by the SEC, which can be no later than November 28, 2023. KeyCorp will be required to adopt a compliant Clawback Policy within 60 days of the effective date.
Regulatory responses to recent bank failures
Following the failures of SVB and Signature and the resulting stress in the banking system, the Federal Reserve created a new Bank Term Funding Program (the “Program”) as an additional source of liquidity available to depository institutions that are in generally sound financial condition. The Program offers loans of up to one year to eligible depository institutions, which would pledge U.S. Treasuries, agency debt, mortgage-backed securities, or other qualifying assets valued at par as collateral. The Program will be in effect until at least March 11, 2024.
As a result of the failures of SVB and Signature in March 2023 and First Republic Bank in May 2023, representatives of federal banking agencies have indicated that consideration is being given to strengthening the oversight and regulation of large regional banks, in particular, those banks with between $100 billion and $250 billion in assets. The strengthened oversight and regulation may consist of new requirements imposed on such banking organizations, including additional capital, liquidity, stress testing, resolution planning, and long-term debt requirements. KeyCorp and KeyBank may be subject to any such new requirements that are adopted.
The expected issuance by the FDIC of a notice of proposed rulemaking for a special assessment related to the recent bank failures is discussed above under the heading “Supervision and regulation - Deposit insurance and assessments.”
Results of Operations
Earnings overview
The following chart provides a reconciliation of net income from continuing operations attributable to Key common shareholders for the three months ended March 31, 2022, to the three months ended March 31, 2023 (dollars in millions):

Net interest income
One of our principal sources of revenue is net interest income. Net interest income is the difference between interest income received on earning assets (such as loans and securities) and loan-related fee income, and interest expense paid on deposits and borrowings. There are several factors that affect net interest income, including:
-
the volume, pricing, mix, and maturity of earning assets and interest-bearing liabilities;
-
the volume and value of net free funds, such as noninterest-bearing deposits and equity capital;
-
the use of derivative instruments to manage interest rate risk;
-
interest rate fluctuations and competitive conditions within the marketplace;
-
asset quality; and
-
fair value accounting of acquired earning assets and interest-bearing liabilities.
To make it easier to compare both the results across several periods and the yields on various types of earning assets (some taxable, some not), we present net interest income in this discussion on a “TE basis” (i.e., as if all income were taxable and at the same rate). For example, $100 of tax-exempt income would be presented as $126, an amount that, if taxed at the statutory federal income tax rate of 21%, would yield $100.
Figure 3 shows the various components of our balance sheet that affect interest income and expense and their respective yields or rates for the current periods and comparative year ago periods. This figure also presents a reconciliation of TE net interest income to net interest income reported in accordance with GAAP for each of those quarters. The net interest margin, which is an indicator of the profitability of the earning assets portfolio less cost of funding, is calculated by dividing annualized TE net interest income by average earning assets.
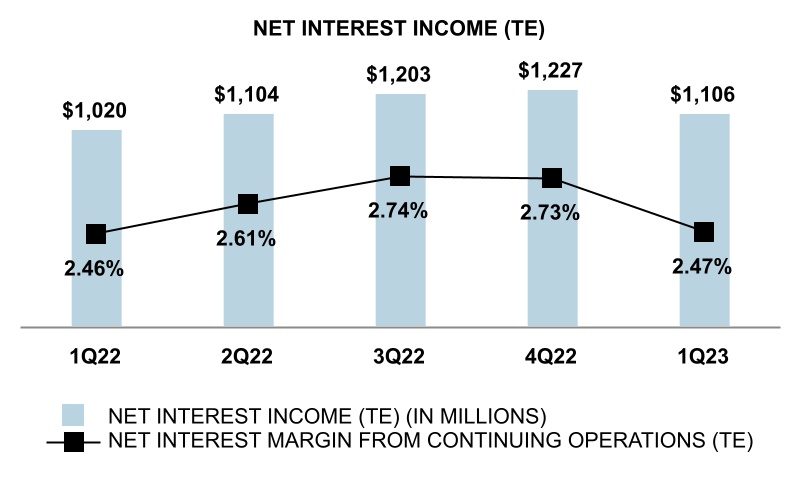
Net interest income (TE) was $1.1 billion for the first quarter of 2023 and the net interest margin was 2.47%. Compared to the first quarter of 2022, net interest income (TE) increased $86 million and net interest margin increased by one basis point. Net interest income and the net interest margin benefited from higher earning asset balances and higher interest rates, partly offset by higher interest-bearing deposit costs and a shift in funding mix.


Average loans were $119.8 billion for the first quarter of 2023, an increase of $16.1 billion compared to the first quarter of 2022. Commercial loans increased $10.9 billion, largely reflecting growth in commercial and industrial loans, as well as an increase in commercial mortgage real estate loans. Consumer loans increased $5.1 billion, largely driven by Key's residential mortgage business.
Average deposits totaled $143.4 billion for the first quarter of 2023, a decrease of $6.8 billion compared to the year-ago quarter. The decline reflects elevated inflation-related spend, the normalization of pandemic-related deposits, and changing client behavior due to higher interest rates.
Figure 3. Consolidated Average Balance Sheets, Net Interest Income, and Yields/Rates and Components of Net Interest Income Changes from Continuing Operations**(h)**
| Three months ended March 31, 2023 | Three months ended March 31, 2022 | Change in Net interest income due to | |||||||||||||||||||||||||||||||||
| Dollars in millions | Average Balance | Interest (a) | Yield/ Rate (a) | Average Balance | Interest (a) | Yield/ Rate (a) | Volume | Yield/Rate | Total | ||||||||||||||||||||||||||
| ASSETS | |||||||||||||||||||||||||||||||||||
| Loans (b), (c) | |||||||||||||||||||||||||||||||||||
| Commercial and industrial (d) | $ | 60,281 | $ | 807 | 5.42 | % | $ | 51,574 | $ | 410 | 3.22 | % | $ | 79 | $ | 318 | $ | 397 | |||||||||||||||||
| Real estate — commercial mortgage | 16,470 | 224 | 5.52 | 14,587 | 121 | 3.37 | 17 | 86 | 103 | ||||||||||||||||||||||||||
| Real estate — construction | 2,525 | 39 | 6.30 | 2,027 | 17 | 3.37 | 5 | 17 | 22 | ||||||||||||||||||||||||||
| Commercial lease financing | 3,783 | 27 | 2.87 | 3,942 | 24 | 2.41 | (1) | 4 | 3 | ||||||||||||||||||||||||||
| Total commercial loans | 83,059 | 1,097 | 5.35 | 72,130 | 572 | 3.21 | 100 | 425 | 525 | ||||||||||||||||||||||||||
| Real estate — residential mortgage | 21,436 | 172 | 3.21 | 16,309 | 112 | 2.75 | 39 | 21 | 60 | ||||||||||||||||||||||||||
| Home equity loans | 7,879 | 106 | 5.47 | 8,345 | 74 | 3.61 | (4) | 36 | 32 | ||||||||||||||||||||||||||
| Consumer direct loans | 6,439 | 75 | 4.71 | 5,954 | 61 | 4.16 | 5 | 9 | 14 | ||||||||||||||||||||||||||
| Credit cards | 983 | 32 | 13.37 | 932 | 24 | 10.36 | 1 | 7 | 8 | ||||||||||||||||||||||||||
| Consumer indirect loans | 41 | 1 | 1.24 | 92 | — | — | — | 1 | 1 | ||||||||||||||||||||||||||
| Total consumer loans | 36,778 | 386 | 4.23 | 31,632 | 271 | 3.45 | 41 | 74 | 115 | ||||||||||||||||||||||||||
| Total loans | 119,837 | 1,483 | 5.01 | 103,762 | 843 | 3.28 | 141 | 499 | 640 | ||||||||||||||||||||||||||
| Loans held for sale | 907 | 13 | 5.86 | 1,485 | 12 | 3.32 | (6) | 7 | 1 | ||||||||||||||||||||||||||
| Securities available for sale (b), (e) | 39,172 | 194 | 1.72 | 44,923 | 173 | 1.50 | (24) | 45 | 21 | ||||||||||||||||||||||||||
| Held-to-maturity securities (b) | 8,931 | 74 | 3.32 | 7,188 | 46 | 2.54 | 13 | 15 | 28 | ||||||||||||||||||||||||||
| Trading account assets | 1,001 | 12 | 4.86 | 842 | 6 | 2.74 | 1 | 5 | 6 | ||||||||||||||||||||||||||
| Short-term investments | 3,532 | 42 | 4.80 | 7,323 | 4 | .25 | (3) | 41 | 38 | ||||||||||||||||||||||||||
| Other investments (e) | 1,309 | 13 | 4.01 | 651 | 2 | 1.26 | 3 | 8 | 11 | ||||||||||||||||||||||||||
| Total earning assets | 174,689 | 1,831 | 4.09 | 166,174 | 1,086 | 2.62 | 125 | 620 | 745 | ||||||||||||||||||||||||||
| Allowance for loan and lease losses | (1,336) | (1,056) | |||||||||||||||||||||||||||||||||
| Accrued income and other assets | 17,498 | 17,471 | |||||||||||||||||||||||||||||||||
| Discontinued assets | 419 | 539 | |||||||||||||||||||||||||||||||||
| Total assets | $ | 191,270 | $ | 183,128 | |||||||||||||||||||||||||||||||
| LIABILITIES | |||||||||||||||||||||||||||||||||||
| Money market deposits | $ | 33,853 | 78 | .94 | $ | 37,233 | 4 | .04 | — | 74 | 74 | ||||||||||||||||||||||||
| Demand deposits | 52,365 | 183 | 1.42 | 51,282 | 7 | .06 | — | 176 | 176 | ||||||||||||||||||||||||||
| Savings deposits | 7,346 | 1 | .03 | 7,599 | — | .01 | — | 1 | 1 | ||||||||||||||||||||||||||
| Certificates of deposit ($100,000 or more) | 2,392 | 16 | 2.64 | 1,639 | 2 | .44 | 1 | 13 | 14 | ||||||||||||||||||||||||||
| Other time deposits | 8,106 | 72 | 3.61 | 2,098 | 1 | .15 | 10 | 61 | 71 | ||||||||||||||||||||||||||
| Total interest-bearing deposits | 104,062 | 350 | 1.36 | 99,851 | 14 | .06 | 11 | 325 | 336 | ||||||||||||||||||||||||||
| Federal funds purchased and securities sold under repurchase agreements | 2,087 | 22 | 4.34 | 287 | — | .13 | — | 22 | 22 | ||||||||||||||||||||||||||
| Bank notes and other short-term borrowings | 6,597 | 78 | 4.80 | 705 | 3 | 1.94 | 62 | 13 | 75 | ||||||||||||||||||||||||||
| Long-term debt (f), (g) | 20,141 | 275 | 5.47 | 10,830 | 49 | 1.79 | 68 | 158 | 226 | ||||||||||||||||||||||||||
| Total interest-bearing liabilities | 132,887 | 725 | 2.20 | 111,673 | 66 | .24 | 141 | 518 | 659 | ||||||||||||||||||||||||||
| Noninterest-bearing deposits | 39,343 | 50,312 | |||||||||||||||||||||||||||||||||
| Accrued expense and other liabilities | 4,804 | 3,824 | |||||||||||||||||||||||||||||||||
| Discontinued liabilities (g) | 419 | 539 | |||||||||||||||||||||||||||||||||
| Total liabilities | 177,453 | 166,348 | |||||||||||||||||||||||||||||||||
| EQUITY | |||||||||||||||||||||||||||||||||||
| Key shareholders’ equity | 13,817 | 16,780 | |||||||||||||||||||||||||||||||||
| Noncontrolling interests | — | — | |||||||||||||||||||||||||||||||||
| Total equity | 13,817 | 16,780 | |||||||||||||||||||||||||||||||||
| Total liabilities and equity | $ | 191,270 | $ | 183,128 | |||||||||||||||||||||||||||||||
| Interest rate spread (TE) | 1.89 | % | 2.38 | % | |||||||||||||||||||||||||||||||
| Net interest income (TE) and net interest margin (TE) | 1,106 | 2.47 | % | 1,020 | 2.46 | % | $ | (16) | $ | 102 | 86 | ||||||||||||||||||||||||
| TE adjustment (b) | 7 | 6 | |||||||||||||||||||||||||||||||||
| Net interest income, GAAP basis | $ | 1,099 | $ | 1,014 | |||||||||||||||||||||||||||||||
(a)Results are from continuing operations. Interest excludes the interest associated with the liabilities referred to in (g), calculated using a matched funds transfer pricing methodology.
(b)Interest income on tax-exempt securities and loans has been adjusted to a taxable-equivalent basis using the statutory federal income tax rate of 21% for the three months ended March 31, 2023, and March 31, 2022.
(c)For purposes of these computations, nonaccrual loans are included in average loan balances.
(d)Commercial and industrial average balances include $178 million and $141 million of assets from commercial credit cards for the three months ended March 31, 2023, and March 31, 2022, respectively.
(e)Yield is calculated on the basis of amortized cost.
(f)Rate calculation excludes basis adjustments related to fair value hedges.
(g)A portion of long-term debt and the related interest expense is allocated to discontinued liabilities as a result of applying our matched funds transfer pricing methodology to discontinued operations.
(h)Average balances presented are based on daily average balances over the respective stated period.
Provision for credit losses
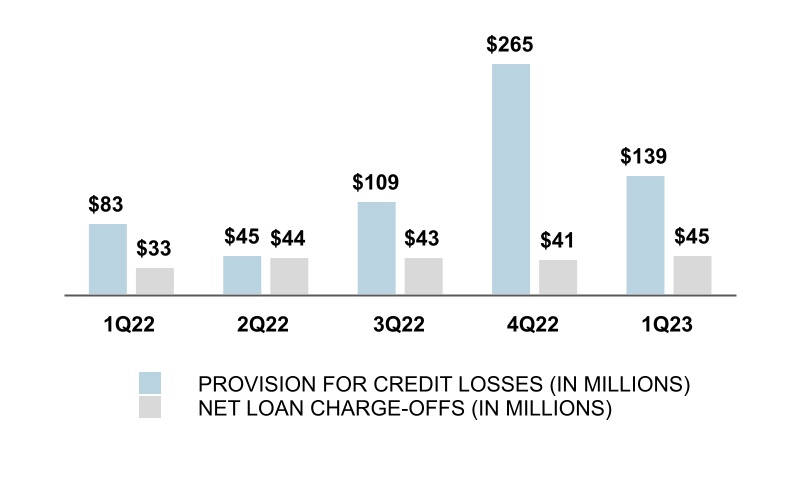
Key’s provision for credit losses was $139 million for the three months ended March 31, 2023, compared to $83 million for the three months ended March 31, 2022. The increase was largely driven by changes in the economic outlook.
Noninterest income
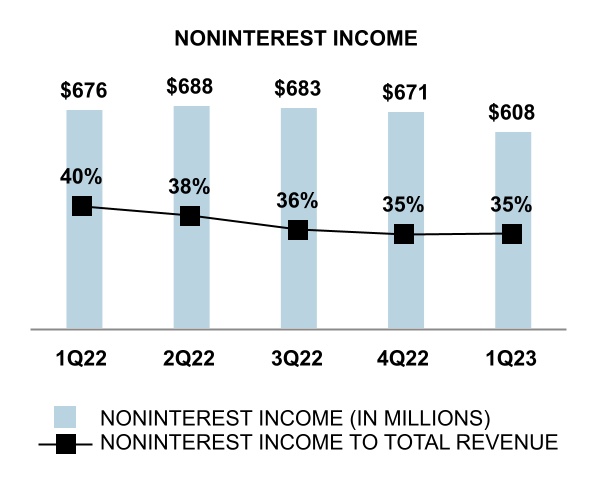
As shown in Figure 4, noninterest income was $608 million, and represented 35% of total revenue for the first quarter of 2023, compared to $676 million, representing 40% of total revenue, for the year-ago quarter.
The following discussion explains the composition of certain elements of our noninterest income and the factors that caused those elements to change.
Figure 4. Noninterest Income
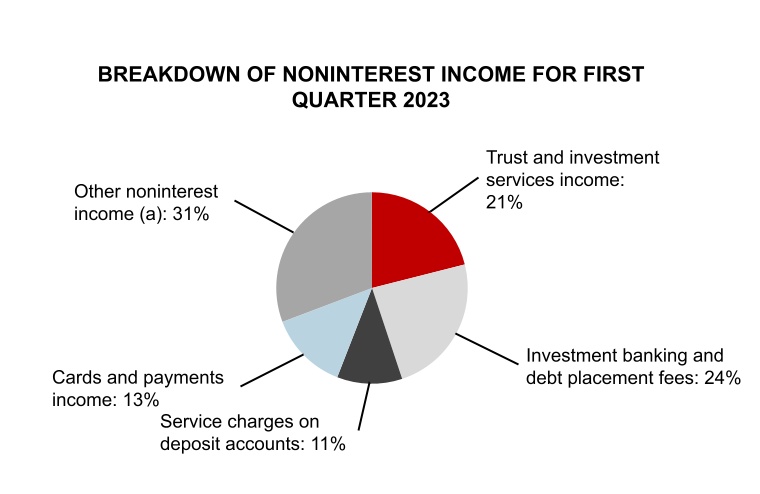
(a)Other noninterest income includes operating lease income and other leasing gains, corporate services income, corporate-owned life insurance income, consumer mortgage income, commercial mortgage servicing fees, and other income. See the "Consolidated Statements of Income" in Item 1. Financial Statements of this report.


Trust and investment services income
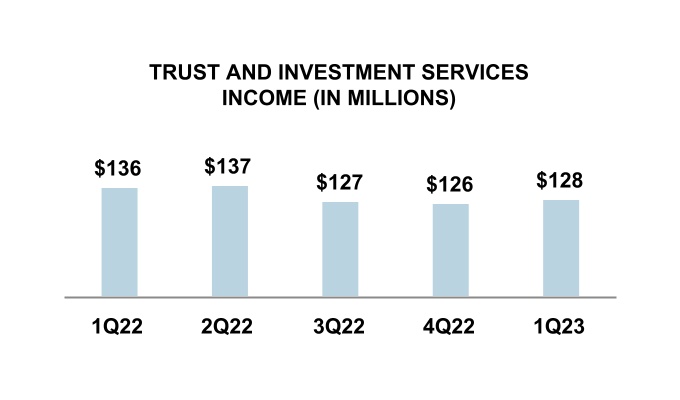
Trust and investment services income consists of brokerage commissions, trust and asset management fees, and insurance income. The assets under management that primarily generate certain trust and asset management fees are shown in Figure 5. For the three months ended March 31, 2023, trust and investment services income was down $8 million, or 5.9%, compared to the same period one year ago. This was primarily due to a decrease in average market performance informing fees and market decline impact on recurring fees.
A significant portion of our trust and investment services income depends on the value and mix of assets under management. As shown in Figure 5, at March 31, 2023, our bank, trust, and registered investment advisory subsidiaries had assets under management of $53.7 billion, which were relatively flat compared to March 31, 2022.
Figure 5. Assets Under Administration
| Dollars in millions | March 31, 2023 | December 31, 2022 | September 30, 2022 | June 30, 2022 | March 31, 2022 | ||||||||||||
| Discretionary assets under management by investment type: | |||||||||||||||||
| Equity | $ | 29,139 | $ | 28,313 | $ | 26,930 | $ | 28,344 | $ | 32,270 | |||||||
| Fixed income | 14,615 | 14,432 | 13,035 | 12,913 | 13,414 | ||||||||||||
| Money market | 6,490 | 5,238 | 4,850 | 4,604 | 4,481 | ||||||||||||
| Total discretionary assets under management | 50,244 | 47,983 | 44,815 | 45,861 | 50,165 | ||||||||||||
| Non-discretionary assets under administration | 3,445 | 3,299 | 3,031 | 3,142 | 3,542 | ||||||||||||
| Total | $ | 53,689 | $ | 51,282 | $ | 47,846 | $ | 49,003 | $ | 53,707 | |||||||
Investment banking and debt placement fees
Investment banking and debt placement fees consist of syndication fees, debt and equity securities underwriting fees, merger and acquisition and financial advisory fees, gains on sales of commercial mortgages, and agency origination fees. For the three months ended March 31, 2023, investment banking and debt placement fees were down $18 million, or 11.0%, compared to the same period a year ago. The decrease reflects lower syndication fees partially offset by an increase in advisory fees.
Service charges on deposit accounts
Service charges on deposit accounts decreased $24 million, or 26.4%, for the three months ended March 31, 2023, compared to the same period one year ago, driven by the new client friendly fee structure for NSF/OD fees and lower account analysis fees due to the interest rate environment.
Cards and payments income
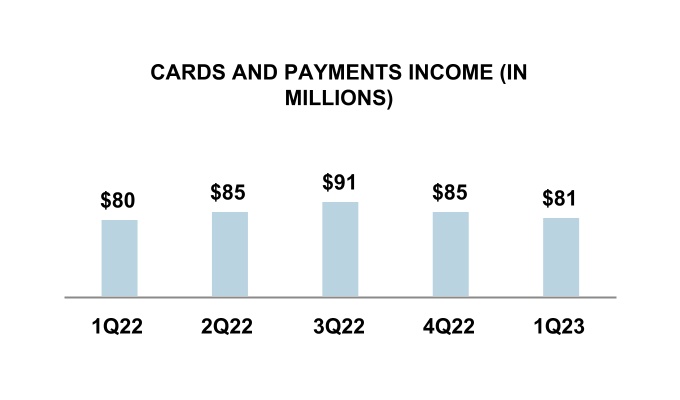
Cards and payments income, which consists of debit card, prepaid card, consumer and commercial credit card, and merchant services income, increased $1 million, or 1.3%, for the three months ended March 31, 2023, compared to the same period one year ago.
Other noninterest income
Other noninterest income includes operating lease income and other leasing gains, corporate services income,
corporate-owned life insurance income, consumer mortgage income, commercial mortgage servicing fees, and other income. Other noninterest income for the three months ended March 31, 2023, decreased $19 million, or 9.2%, from the year-ago quarter, primarily due to a decrease in corporate services income stemming from lower loan fees and market-related adjustments in the prior period. Consumer mortgage income decreased $10 million, reflecting lower saleable volume and lower gain on sale margins. Partially offsetting the decrease was a $10 million increase in commercial mortgage servicing fees.
Noninterest expense
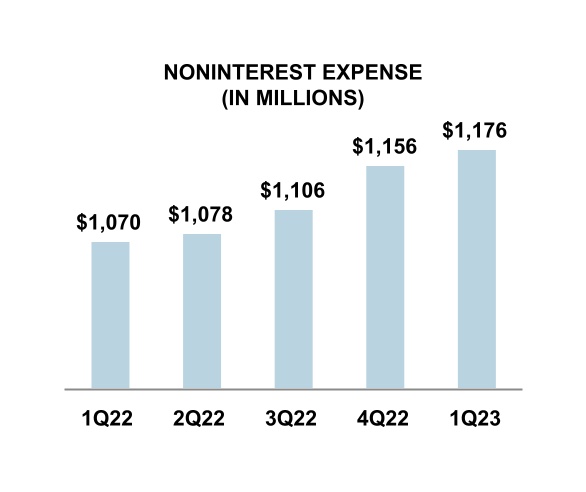
As shown in Figure 6, noninterest expense was $1.2 billion for the first quarter of 2023, compared to $1.1 billion for the first quarter of 2022.
The following discussion explains the composition of certain elements of our noninterest expense and the factors that caused those elements to change.
Figure 6. Noninterest Expense

(a)Other noninterest expense includes equipment, operating lease expense, marketing, FDIC assessment, and other expense. See the "Consolidated Statements of Income" in Item 1. Financial Statements of this report.
Personnel
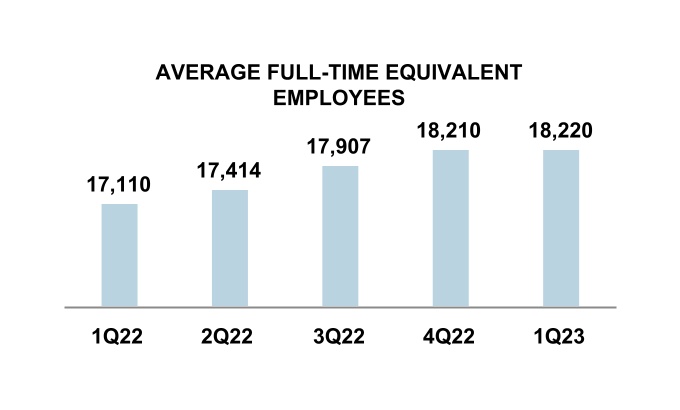
Personnel expense, the largest category of our noninterest expense, increased by $71 million, or 11.3%, for the three months ended March 31, 2023, compared to the same period one year ago. The increases were driven by an increase of $36 million in severance and other costs related to expense actions, as well as higher salaries.
Other nonpersonnel expense
Other nonpersonnel expense includes net occupancy, computer processing, business services and professional fees, equipment, operating lease expense, marketing, FDIC assessment, and other miscellaneous expense categories. Other nonpersonnel expense for the three months ended March 31, 2023, increased $35 million, or 8.0%, from the year-ago quarter, driven by a $47 million increase in other expense, reflecting $28 million related to our expense actions and an increase in the base FDIC assessment rate of $9 million. Additionally, computer processing expense increased $15 million. Partially offsetting the increase in nonpersonnel expense was an $8 million decline in business services and professional fees, an $8 million decline in operating lease expense and a $7 million decline in marketing expense.
Income taxes
We recorded tax expense of $81 million for the first quarter of 2023 and $90 million for the first quarter of 2022.
Our federal tax expense and effective tax rate differs from the amount that would be calculated using the federal statutory tax rate; primarily due to investments in tax-advantaged assets, such as corporate-owned life insurance, tax credits associated with low-income housing investments, and periodic adjustments to our tax reserves.
Additional information pertaining to how our tax expense (benefit) and the resulting effective tax rates were derived is included in Note 14 (“Income Taxes”) beginning on page 151 of our 2022 Form 10-K.
Business Segment Results
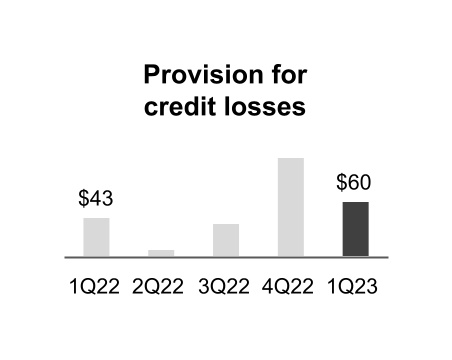
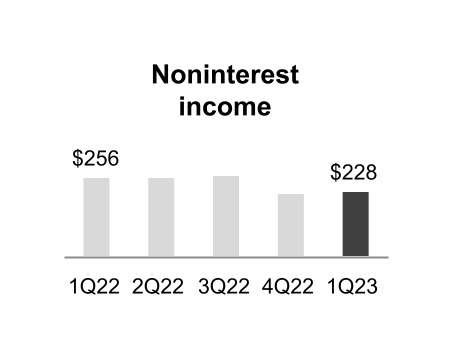
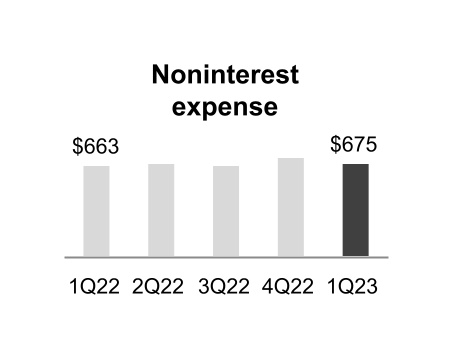
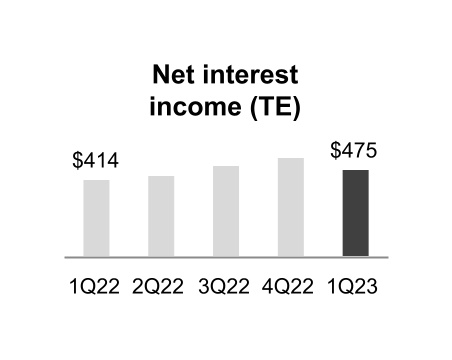
This section summarizes the financial performance of our two major business segments (operating segments): Consumer Bank and Commercial Bank. Note 20 (“Business Segment Reporting”) describes the products and services offered by each of these business segments and provides more detailed financial information pertaining to the segments. For more information on the segment imperatives and market and business overview, see “Business Segment Results” beginning on page 57 of our 2022 Form 10-K. Dollars in the charts are presented in millions.
Consumer Bank
Summary of operations
-
Net income attributable to Key of $81 million for the first quarter of 2023, compared to $71 million for the year-ago quarter
-
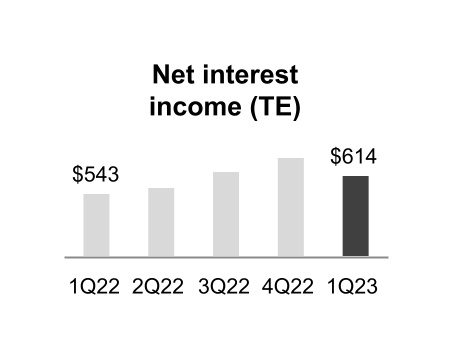
Taxable-equivalent net interest income increased by $71 million, or 13.1%, compared to the first quarter of 2022, driven by higher interest rates and balance sheet mix
-
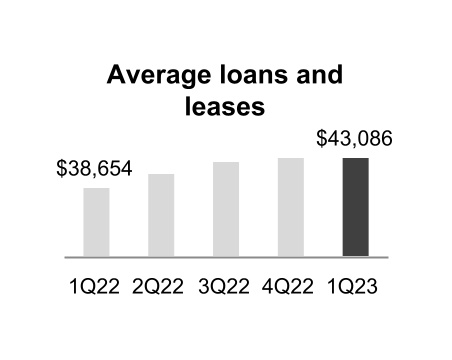
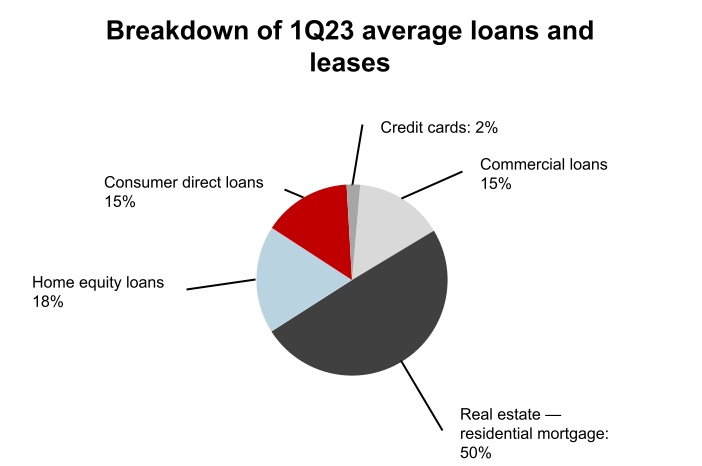
Average loans and leases increased $4.4 billion, or 11.5%, from the first quarter of 2022,driven by loan growth in consumer mortgage
-
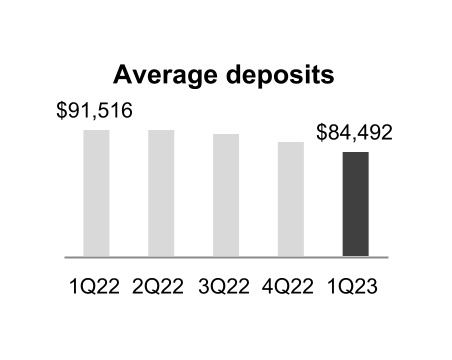
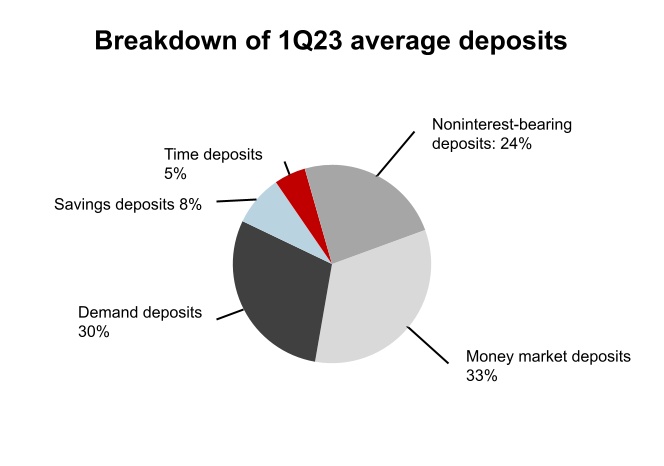
Average deposits decreased $7.0 billion, or 7.7%, from the first quarter of 2022, driven by elevated inflation-related spend, the normalization of pandemic-related deposits, and changing client behavior due to higher interest rates
-
Provision for credit losses increased $17 million compared to the first quarter of 2022, driven by changes in the economic outlook
-
Noninterest income decreased $28 million, or 10.9%, from the first quarter of 2022, driven by a decline in service charges on deposit accounts, reflecting a planned reduction in overdraft and non-sufficient funds fees, and lower consumer mortgage income, reflecting lower saleable volume and gain on sale margins
-
Noninterest expense increased $12 million, or 1.8%, from the first quarter of 2022, primarily driven by an increase in salaries
Commercial Bank
Summary of operations
-
Net income attributable to Key of $264 million for the first quarter of 2023, compared to $284 million for the year-ago quarter
-
Taxable-equivalent net interest income increased by $61 million, compared to the first quarter of 2022, reflecting higher interest rates and balance sheet mix
-
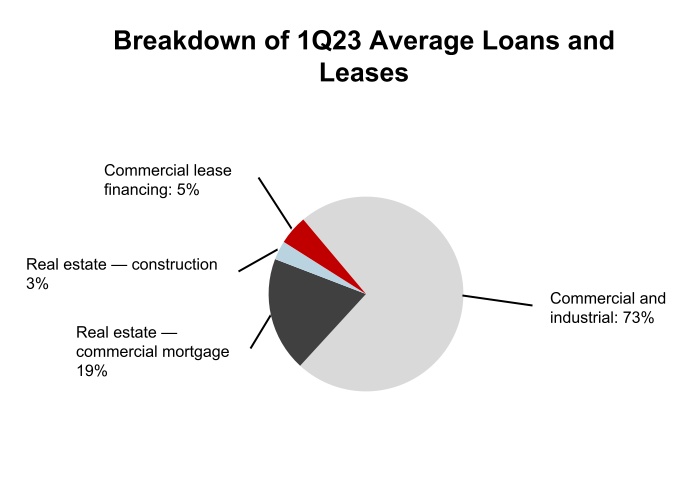
Average loan and lease balances increased $11.6 billion, compared to the first quarter of 2022, reflecting growth in commercial and industrial loans and an increase in commercial mortgage real estate loans
-
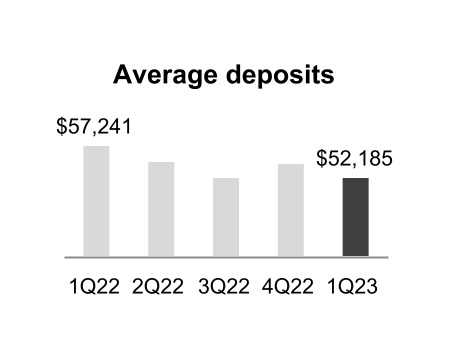
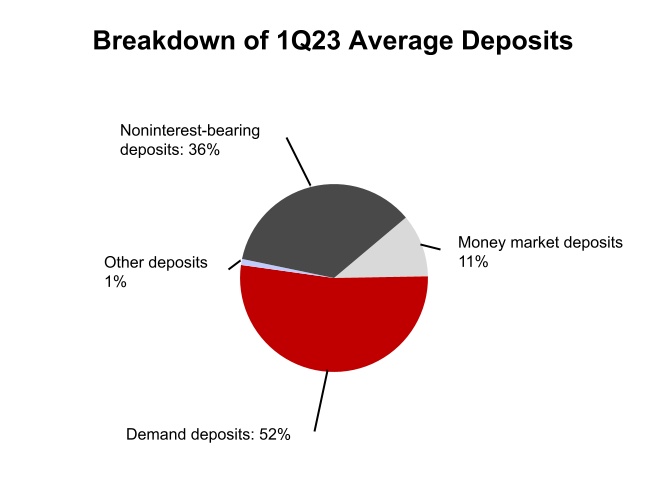
Average deposit balances decreased $5.1 billion, or 8.8%, compared to the first quarter of 2022, reflecting elevated inflation-related spend, the normalization of pandemic-related deposits, and changing client behavior due to higher interest rates

-
Provision for credit losses increased $39 million compared to the first quarter of 2022, as we prepare for more challenging economic conditions
-
Noninterest income decreased $28 million, from the first quarter of 2022, driven by a decline in corporate services income and lower investment banking and debt placement fees
-
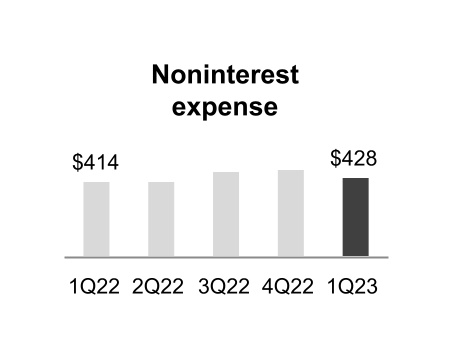
Noninterest expense increased by $14 million, or 3.4%, from the first quarter of 2022, driven by an increase in salaries and incentive compensation


Financial Condition
Loans and loans held for sale
Figure 7. Breakdown of Loans at March 31, 2023
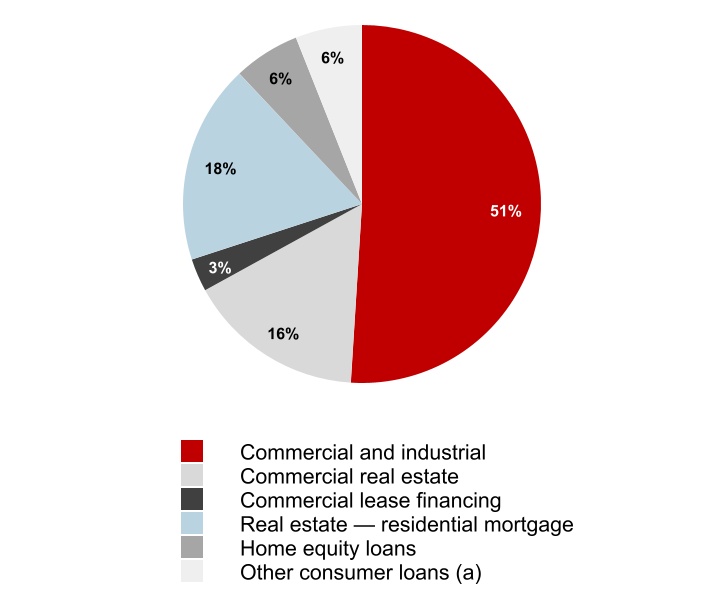

(a)Other consumer loans include Consumer direct loans, Credit cards, and Consumer indirect loans. See Note 3 (“Loan Portfolio”) in Item 1. Financial Statements of this report.
At March 31, 2023, total loans outstanding from continuing operations were $120.0 billion, compared to $119.4 billion at December 31, 2022. For more information on balance sheet carrying value, see Note 1 (“Summary of Significant Accounting Policies”) under the headings “Loans” and “Loans Held for Sale” starting on page 106 of our 2022 Form 10-K.
Commercial loan portfolio
Commercial loans outstanding were $83.3 billion at March 31, 2023, an increase of $801 million, or 1.0%, compared to December 31, 2022. The increase was driven by growth in commercial and industrial loans, which increased $918 million, or 1.5%.
Figure 8 provides our commercial loan portfolios by industry classification at March 31, 2023, and December 31, 2022.
Figure 8. Commercial Loans by Industry
| March 31, 2023 | Commercial and industrial | Commercial real estate | Commercial lease financing | Total commercial loans | Percent of total | ||||||||||||||||||||||||
| Dollars in millions | |||||||||||||||||||||||||||||
| Industry classification: | |||||||||||||||||||||||||||||
| Agriculture | $ | 855 | $ | 176 | $ | 93 | $ | 1,124 | 1.3 | % | |||||||||||||||||||
| Automotive | 1,791 | 824 | 10 | 2,625 | 3.1 | ||||||||||||||||||||||||
| Business products | 2,386 | 169 | 36 | 2,591 | 3.1 | ||||||||||||||||||||||||
| Business services | 3,648 | 244 | 162 | 4,054 | 4.9 | ||||||||||||||||||||||||
| Chemicals | 990 | 48 | 42 | 1,080 | 1.3 | ||||||||||||||||||||||||
| Commercial real estate | 8,989 | 13,793 | 10 | 22,792 | 27.4 | ||||||||||||||||||||||||
| Construction materials and contractors | 2,237 | 289 | 297 | 2,823 | 3.4 | ||||||||||||||||||||||||
| Consumer goods | 4,180 | 588 | 303 | 5,071 | 6.1 | ||||||||||||||||||||||||
| Consumer services | 5,011 | 870 | 337 | 6,218 | 7.5 | ||||||||||||||||||||||||
| Equipment | 2,010 | 118 | 113 | 2,241 | 2.7 | ||||||||||||||||||||||||
| Finance | 9,201 | 109 | 379 | 9,689 | 11.6 | ||||||||||||||||||||||||
| Healthcare | 3,409 | 1,372 | 286 | 5,067 | 6.1 | ||||||||||||||||||||||||
| Metals and mining | 1,489 | 73 | 92 | 1,654 | 2.0 | ||||||||||||||||||||||||
| Oil and gas | 2,338 | 42 | 19 | 2,399 | 2.9 | ||||||||||||||||||||||||
| Public exposure | 2,511 | 13 | 540 | 3,064 | 3.7 | ||||||||||||||||||||||||
| Technology | 1,057 | 12 | 86 | 1,155 | 1.4 | ||||||||||||||||||||||||
| Transportation | 1,149 | 171 | 490 | 1,810 | 2.2 | ||||||||||||||||||||||||
| Utilities | 6,885 | 5 | 450 | 7,340 | 8.8 | ||||||||||||||||||||||||
| Other | 429 | 22 | 18 | 469 | .5 | ||||||||||||||||||||||||
| Total | $ | 60,565 | $ | 18,938 | $ | 3,763 | $ | 83,266 | 100.0 | % | |||||||||||||||||||
| December 31, 2022 | Commercial and industrial | Commercial real estate | Commercial lease financing | Total commercial loans | Percent of total | ||||||||||||||||||||||||
| Dollars in millions | |||||||||||||||||||||||||||||
| Industry classification: | |||||||||||||||||||||||||||||
| Agriculture | $ | 907 | $ | 171 | $ | 96 | $ | 1,174 | 1.4 | % | |||||||||||||||||||
| Automotive | 1,660 | 741 | 12 | 2,413 | 2.9 | ||||||||||||||||||||||||
| Business products | 2,332 | 176 | 37 | 2,545 | 3.1 | ||||||||||||||||||||||||
| Business services | 3,497 | 249 | 167 | 3,913 | 4.7 | ||||||||||||||||||||||||
| Chemicals | 934 | 31 | 45 | 1,010 | 1.2 | ||||||||||||||||||||||||
| Commercial real estate | 8,862 | 13,897 | 7 | 22,766 | 27.6 | ||||||||||||||||||||||||
| Construction materials and contractors | 2,351 | 327 | 309 | 2,987 | 3.7 | ||||||||||||||||||||||||
| Consumer goods | 4,312 | 544 | 286 | 5,142 | 6.2 | ||||||||||||||||||||||||
| Consumer services | 4,963 | 873 | 346 | 6,182 | 7.5 | ||||||||||||||||||||||||
| Equipment | 1,988 | 111 | 113 | 2,212 | 2.7 | ||||||||||||||||||||||||
| Finance | 8,784 | 111 | 462 | 9,357 | 11.3 | ||||||||||||||||||||||||
| Healthcare | 3,379 | 1,348 | 310 | 5,037 | 6.1 | ||||||||||||||||||||||||
| Metals and mining | 1,453 | 86 | 94 | 1,633 | 2.0 | ||||||||||||||||||||||||
| Oil and gas | 2,385 | 32 | 20 | 2,437 | 3.0 | ||||||||||||||||||||||||
| Public exposure | 2,526 | 9 | 582 | 3,117 | 3.8 | ||||||||||||||||||||||||
| Technology | 914 | 12 | 89 | 1,015 | 1.2 | ||||||||||||||||||||||||
| Transportation | 1,139 | 159 | 497 | 1,795 | 2.2 | ||||||||||||||||||||||||
| Utilities | 6,725 | 5 | 450 | 7,180 | 8.7 | ||||||||||||||||||||||||
| Other | 536 | — | 14 | 550 | .7 | ||||||||||||||||||||||||
| Total | $ | 59,647 | $ | 18,882 | $ | 3,936 | $ | 82,465 | 100.0 | % | |||||||||||||||||||
Commercial and industrial. Commercial and industrial loans are the largest component of our loan portfolio, representing 51% of our total loan portfolio at March 31, 2023, and 50% at December 31, 2022. This portfolio is approximately 87% variable rate and consists of loans originated primarily to large corporate, middle market, and small business clients.
Commercial and industrial loans totaled $60.6 billion at March 31, 2023, an increase of $918 million, or 1.5%, compared to December 31, 2022. The increase was broad-based and spread across most industry categories with Finance driving 45% of the increase.
Commercial real estate loans. Our commercial real estate portfolio includes project loans primarily focused in market-rate and affordable multi-family housing loans, owner-occupied commercial and industrial operating company buildings, and community center grocer-anchored retail centers. These three commercial real estate segments make up 74% of our commercial real estate portfolio. Our non-owner-occupied portfolio is focused on owners and operators of commercial real estate who not only utilize our loan products, but also our broader industry-focused products and services and provide consistent pipelines into our agency, CMBS, and other long-term market take out products. This focus ensures our relationship clients foster and build portfolios with stable,
recurring cash flows, with adequate, balanced cash reserves to support our balance sheet exposures through the economic cycle.
At March 31, 2023, commercial real estate loans totaled $18.9 billion, which includes $16.3 billion of mortgage loans and $2.6 billion of construction loans. Compared to December 31, 2022, this portfolio increased $56 million, or .3%, driven by growth in multi-family lending. Nonowner-occupied properties, generally properties for which at least 50% of the debt service is provided by rental income from nonaffiliated third parties, represented 80% of total commercial real estate loans outstanding at March 31, 2023.
Since the pre-global financial crisis in 2008, we have limited our construction business and reduced our overall construction loans from 42% to 14% of commercial real estate loans as of March 31, 2023. Construction loans provide a stream of funding for properties not fully leased at origination to support debt service payments over the term of the contract or project. As of March 31, 2023, 72% of our construction portfolio are multi-family project loans.
Our office exposure, which only represents 5% of commercial real estate loans at period end, is largely non-gateway city exposure and is currently 85% occupied.
As shown in Figure 9, our commercial real estate loan portfolio includes various property types and geographic locations of the underlying collateral. These loans include commercial mortgage and construction loans in both Consumer Bank and Commercial Bank.
Figure 9. Commercial Real Estate Loans
| Geographic Region | Total | Percent of Total | Construction | Commercial Mortgage | |||||||||||||||||||||||||||||||
| Dollars in millions | West | Southwest | Central | Midwest | Southeast | Northeast | National | ||||||||||||||||||||||||||||
| March 31, 2023 | |||||||||||||||||||||||||||||||||||
| Nonowner-occupied: | |||||||||||||||||||||||||||||||||||
| Diversified | $ | 9 | $ | — | $ | — | $ | 4 | $ | — | $ | 23 | $ | 231 | $ | 267 | 1.4 | % | $ | — | $ | 267 | |||||||||||||
| Industrial | 46 | 25 | 71 | 137 | 223 | 302 | 20 | 824 | 4.4 | 145 | 679 | ||||||||||||||||||||||||
| Land & Residential | 1 | 3 | 3 | 4 | 3 | 23 | — | 37 | .2 | 16 | 21 | ||||||||||||||||||||||||
| Lodging | 58 | — | 10 | 4 | 21 | 71 | 48 | 212 | 1.1 | 23 | 189 | ||||||||||||||||||||||||
| Medical Office | 46 | — | 43 | 10 | 21 | 100 | 27 | 247 | 1.3 | 47 | 200 | ||||||||||||||||||||||||
| Multifamily | 1,108 | 551 | 1,263 | 1,303 | 2,897 | 1,412 | 400 | 8,934 | 47.2 | 1,867 | 7,067 | ||||||||||||||||||||||||
| Office | 189 | — | 171 | 113 | 123 | 295 | 59 | 950 | 5.0 | — | 950 | ||||||||||||||||||||||||
| Retail | 251 | 14 | 110 | 182 | 86 | 377 | 233 | 1,253 | 6.6 | 119 | 1,134 | ||||||||||||||||||||||||
| Self Storage | 85 | 13 | 50 | 20 | 80 | 37 | 202 | 487 | 2.6 | 3 | 484 | ||||||||||||||||||||||||
| Senior Housing | 152 | 54 | 146 | 76 | 124 | 120 | 233 | 905 | 4.8 | 163 | 742 | ||||||||||||||||||||||||
| Skilled Nursing | — | — | — | 51 | — | 222 | 147 | 420 | 2.2 | — | 420 | ||||||||||||||||||||||||
| Student Housing | — | — | — | 55 | 201 | — | — | 256 | 1.4 | 43 | 213 | ||||||||||||||||||||||||
| Other | 13 | 4 | 9 | 77 | 39 | 78 | 196 | 416 | 2.2 | — | 416 | ||||||||||||||||||||||||
| Total nonowner-occupied | 1,958 | 664 | 1,876 | 2,036 | 3,818 | 3,060 | 1,796 | 15,208 | 80.3 | 2,426 | 12,782 | ||||||||||||||||||||||||
| Owner-occupied | 1,149 | 4 | 375 | 667 | 167 | 1,368 | — | 3,730 | 19.7 | 164 | 3,566 | ||||||||||||||||||||||||
| Total | $ | 3,107 | $ | 668 | $ | 2,251 | $ | 2,703 | $ | 3,985 | $ | 4,428 | $ | 1,796 | $ | 18,938 | 100.0 | % | $ | 2,590 | $ | 16,348 | |||||||||||||
| Nonperforming loans | $ | — | — | — | $ | 15 | $ | — | $ | 6 | $ | 38 | $ | 59 | N/M | $ | — | $ | 59 | ||||||||||||||||
| Accruing loans past due 90 days or more | — | — | — | — | — | 7 | — | 7 | N/M | — | 7 | ||||||||||||||||||||||||
| Accruing loans past due 30 through 89 days | 2 | 2 | 1 | — | 10 | 2 | — | 17 | N/M | — | 17 | ||||||||||||||||||||||||
| December 31, 2022 | |||||||||||||||||||||||||||||||||||
| Nonowner-occupied: | |||||||||||||||||||||||||||||||||||
| Diversified | $ | 9 | $ | — | $ | — | $ | 4 | $ | — | $ | 24 | $ | 231 | $ | 268 | 1.4 | % | $ | — | $ | 268 | |||||||||||||
| Industrial | 75 | 25 | 101 | 135 | 220 | 284 | 52 | 892 | 4.7 | 203 | 689 | ||||||||||||||||||||||||
| Land & Residential | 1 | 3 | 3 | 3 | 3 | 24 | — | 37 | .2 | 15 | 22 | ||||||||||||||||||||||||
| Lodging | 58 | — | 10 | 4 | 20 | 72 | 41 | 205 | 1.1 | 22 | 183 | ||||||||||||||||||||||||
| Medical Office | 47 | — | 43 | 9 | 19 | 98 | 25 | 241 | 1.3 | 64 | 177 | ||||||||||||||||||||||||
| Multifamily | 1,083 | 533 | 1,388 | 1,264 | 2,813 | 1,370 | 438 | 8,889 | 47.1 | 1,705 | 7,184 | ||||||||||||||||||||||||
| Office | 189 | 1 | 173 | 113 | 128 | 300 | 95 | 999 | 5.3 | — | 999 | ||||||||||||||||||||||||
| Retail | 282 | 35 | 112 | 183 | 69 | 395 | 235 | 1,311 | 6.9 | 106 | 1,205 | ||||||||||||||||||||||||
| Self Storage | 85 | 13 | 50 | 20 | 79 | 37 | 202 | 486 | 2.6 | 4 | 482 | ||||||||||||||||||||||||
| Senior Housing | 150 | 57 | 144 | 76 | 118 | 120 | 235 | 900 | 4.8 | 194 | 706 | ||||||||||||||||||||||||
| Skilled Nursing | — | — | — | 52 | — | 239 | 143 | 434 | 2.3 | — | 434 | ||||||||||||||||||||||||
| Student Housing | — | — | — | 53 | 199 | 13 | — | 265 | 1.4 | 39 | 226 | ||||||||||||||||||||||||
| Other | 24 | 4 | 9 | 79 | 42 | 83 | 195 | 436 | 2.3 | 2 | 434 | ||||||||||||||||||||||||
| Total nonowner-occupied | 2,003 | 671 | 2,033 | 1,995 | 3,710 | 3,059 | 1,892 | 15,363 | 81.4 | 2,354 | 13,009 | ||||||||||||||||||||||||
| Owner-occupied | 1,149 | 5 | 364 | 580 | 128 | 1,293 | — | 3,519 | 18.6 | 176 | 3,343 | ||||||||||||||||||||||||
| Total | $ | 3,152 | $ | 676 | $ | 2,397 | $ | 2,575 | $ | 3,838 | $ | 4,352 | $ | 1,892 | $ | 18,882 | 100.0 | % | $ | 2,530 | $ | 16,352 | |||||||||||||
| Nonperforming loans | $ | — | — | — | $ | 2 | $ | — | $ | 7 | $ | 12 | $ | 21 | N/M | $ | — | $ | 21 | ||||||||||||||||
| Accruing loans past due 90 days or more | — | — | — | — | — | 8 | — | 8 | N/M | — | 8 | ||||||||||||||||||||||||
| Accruing loans past due 30 through 89 days | — | — | 1 | 11 | — | 6 | — | 18 | N/M | — | 18 |
| West – | Alaska, California, Hawaii, Idaho, Montana, Oregon, Washington, and Wyoming | ||||
| Southwest – | Arizona, Nevada, and New Mexico | ||||
| Central – | Arkansas, Colorado, Oklahoma, Texas, and Utah | ||||
| Midwest – | Illinois, Indiana, Iowa, Kansas, Michigan, Minnesota, Missouri, Nebraska, North Dakota, Ohio, South Dakota, and Wisconsin | ||||
| Southeast – | Alabama, Delaware, Florida, Georgia, Kentucky, Louisiana, Maryland, Mississippi, North Carolina, South Carolina, Tennessee, Virginia, Washington D.C., and West Virginia | ||||
| Northeast – | Connecticut, Maine, Massachusetts, New Hampshire, New Jersey, New York, Pennsylvania, Rhode Island, and Vermont | ||||
| National – | Accounts in three or more regions |
Consumer loan portfolio
Consumer loans outstanding as of March 31, 2023, totaled $36.7 billion, a decrease of $224 million, or .6%, from December 31, 2022. The decrease reflects balance declines across most consumer loan categories, partly offset by growth in our residential mortgage business.
The residential mortgage portfolio is comprised of loans originated by our Consumer Bank and is the largest segment of our consumer loan portfolio as of March 31, 2023, representing 59% of consumer loans outstanding. This is followed by our home equity portfolio representing 21% of consumer loans outstanding at March 31, 2023.
We held the first lien position for approximately 66% of the home equity portfolio at both March 31, 2023, and December 31, 2022. For loans with real estate collateral, we track borrower performance monthly. Regardless of the lien position, credit metrics are refreshed quarterly, including recent FICO scores as well as updated loan-to-value ratios. This information is used in establishing the ALLL. Our methodology is described in Note 1 (“Summary of Significant Accounting Policies”) under the heading “Allowance for Loan and Lease Losses” of our 2022 Form 10-K.
Figure 10 presents our consumer loans by geography.
Figure 10. Consumer Loans by State
| Dollars in millions | Real estate — residential mortgage | Home equity loans | Consumer direct loans | Credit cards | Consumer indirect loans | Total | ||||||||||||||
| March 31, 2023 | ||||||||||||||||||||
| Washington | $ | 4,685 | $ | 1,068 | $ | 235 | $ | 85 | $ | 1 | $ | 6,074 | ||||||||
| Ohio | 2,782 | 1,131 | 326 | 198 | 4 | 4,441 | ||||||||||||||
| New York | 850 | 2,187 | 770 | 336 | 1 | 4,144 | ||||||||||||||
| Colorado | 3,038 | 293 | 161 | 32 | — | 3,524 | ||||||||||||||
| California | 2,365 | 14 | 529 | 3 | 6 | 2,917 | ||||||||||||||
| Oregon | 1,287 | 618 | 115 | 42 | — | 2,062 | ||||||||||||||
| Pennsylvania | 458 | 560 | 402 | 59 | 3 | 1,482 | ||||||||||||||
| Florida | 857 | 44 | 444 | 13 | 6 | 1,364 | ||||||||||||||
| Connecticut | 822 | 277 | 118 | 27 | 1 | 1,245 | ||||||||||||||
| Utah | 846 | 267 | 69 | 18 | — | 1,200 | ||||||||||||||
| Other | 3,642 | 1,247 | 3,190 | 156 | 17 | 8,252 | ||||||||||||||
| Total | $ | 21,632 | $ | 7,706 | $ | 6,359 | $ | 969 | $ | 39 | $ | 36,705 | ||||||||
| December 31, 2022 | ||||||||||||||||||||
| Washington | $ | 4,621 | $ | 1,100 | $ | 253 | $ | 87 | $ | 2 | $ | 6,063 | ||||||||
| Ohio | 2,766 | 1,173 | 347 | 214 | 5 | 4,505 | ||||||||||||||
| New York | 840 | 2,256 | 770 | 359 | 1 | 4,226 | ||||||||||||||
| Colorado | 3,006 | 301 | 171 | 32 | — | 3,510 | ||||||||||||||
| California | 2,357 | 16 | 538 | 4 | 6 | 2,921 | ||||||||||||||
| Oregon | 1,268 | 630 | 117 | 43 | — | 2,058 | ||||||||||||||
| Pennsylvania | 459 | 580 | 403 | 61 | 3 | 1,506 | ||||||||||||||
| Florida | 851 | 45 | 453 | 14 | 6 | 1,369 | ||||||||||||||
| Texas | 336 | 3 | 397 | 4 | 3 | 743 | ||||||||||||||
| Illinois | 134 | 3 | 212 | 2 | 1 | 352 | ||||||||||||||
| Other | 4,763 | 1,844 | 2,847 | 206 | 16 | 9,676 | ||||||||||||||
| Total | $ | 21,401 | $ | 7,951 | $ | 6,508 | $ | 1,026 | $ | 43 | $ | 36,929 | ||||||||
Figure 11 summarizes our loan sales for the three months ended March 31, 2023, and all of 2022.
Figure 11. Loans Sold (Including Loans Held for Sale)
| Dollars in millions | Commercial | Commercial Real Estate | Commercial Lease Financing | Residential Real Estate | Total | ||||||||||||||||||
| 2023 | |||||||||||||||||||||||
| First quarter | $ | 123 | $ | 1,121 | $ | 164 | $ | 135 | $ | 1,543 | |||||||||||||
| Total | $ | 123 | $ | 1,121 | $ | 164 | $ | 135 | $ | 1,543 | |||||||||||||
| 2022 | |||||||||||||||||||||||
| Fourth quarter | $ | 33 | $ | 2,774 | $ | 114 | $ | 235 | $ | 3,156 | |||||||||||||
| Third quarter | 211 | 1,882 | 43 | 353 | 2,489 | ||||||||||||||||||
| Second quarter | 41 | 1,851 | 150 | 496 | 2,538 | ||||||||||||||||||
| First quarter | 1,469 | 1,909 | 39 | 901 | 4,318 | ||||||||||||||||||
| Total | $ | 1,754 | $ | 8,416 | $ | 346 | $ | 1,985 | $ | 12,501 | |||||||||||||
Figure 12 shows loans that are either administered or serviced by us, but not recorded on the balance sheet; this includes loans that were sold.
Figure 12. Loans Administered or Serviced
| Dollars in millions | March 31, 2023 | December 31, 2022 | September 30, 2022 | June 30, 2022 | March 31, 2022 | ||||||||||||
| Commercial real estate loans | $ | 493,865 | $ | 488,478 | $ | 485,342 | $ | 479,974 | $ | 469,371 | |||||||
| Residential mortgage | 10,951 | 11,026 | 11,014 | 10,948 | 10,756 | ||||||||||||
| Education loans | 294 | 312 | 341 | 366 | 389 | ||||||||||||
| Commercial lease financing | 1,673 | 1,646 | 1,619 | 1,418 | 1,195 | ||||||||||||
| Commercial loans | 712 | 723 | 727 | 724 | 740 | ||||||||||||
| Consumer direct | 480 | 509 | 536 | 575 | 621 | ||||||||||||
| Consumer indirect | 1,316 | 1,536 | 1,766 | 2,039 | 2,354 | ||||||||||||
| Total | $ | 509,291 | $ | 504,230 | $ | 501,345 | $ | 496,044 | $ | 485,426 | |||||||
In the event of default by a borrower, we are subject to recourse with respect to approximately $6.8 billion of the $509.3 billion of loans administered or serviced at March 31, 2023. Additional information about this recourse arrangement is included in Note 17 (“Contingent Liabilities and Guarantees”) under the heading “Recourse agreement with FNMA.”
We derive income from several sources when retaining the right to administer or service loans that are sold. We earn noninterest income (recorded as “Consumer mortgage income” and “Commercial mortgage servicing fees”) from fees for servicing or administering loans. This fee income is reduced by the amortization of related servicing assets. In addition, we earn interest income from investing funds generated by escrow deposits collected in connection with the servicing loans. Additional information about our mortgage servicing assets is included in Note 8 (“Mortgage Servicing Assets”).
Securities
Our securities portfolio is constructed to help manage overall interest rate risk and provide a source of liquidity, including holding securities used to accommodate pledging requirements. Our securities portfolio totaled $49.1 billion at March 31, 2023, compared to $47.8 billion at December 31, 2022. Available-for-sale securities were $39.5 billion at March 31, 2023, compared to $39.1 billion at December 31, 2022. Held-to-maturity securities were $9.6 billion at March 31, 2023, and $8.7 billion at December 31, 2022.
As shown in Figure 13, all of our mortgage-backed securities, which include both securities available-for-sale and held-to-maturity securities, are issued by government-sponsored enterprises or GNMA, and are traded in liquid secondary markets. These securities are recorded on the balance sheet at fair value for the available-for-sale portfolio and at amortized cost for the held-to-maturity portfolio. For more information about these securities, refer to our 2022 Form 10-K within Note 1 (“Summary of Significant Accounting Policies”) under the heading “Securities” and Note 6 (“Fair Value Measurements”) under the heading “Qualitative Disclosures of Valuation Techniques.” Additionally refer to Note 6 (“Securities”) within this report.
Figure 13. Mortgage-Backed Securities by Issuer
| Dollars in millions | March 31, 2023 | December 31, 2022 | ||||||
| FHLMC & FNMA | $ | 26,138 | $ | 25,371 | ||||
| GNMA | 12,173 | 11,620 | ||||||
| Total (a) | $ | 38,311 | $ | 36,991 | ||||
(a) Includes securities held in the available-for-sale and held-to-maturity portfolios.
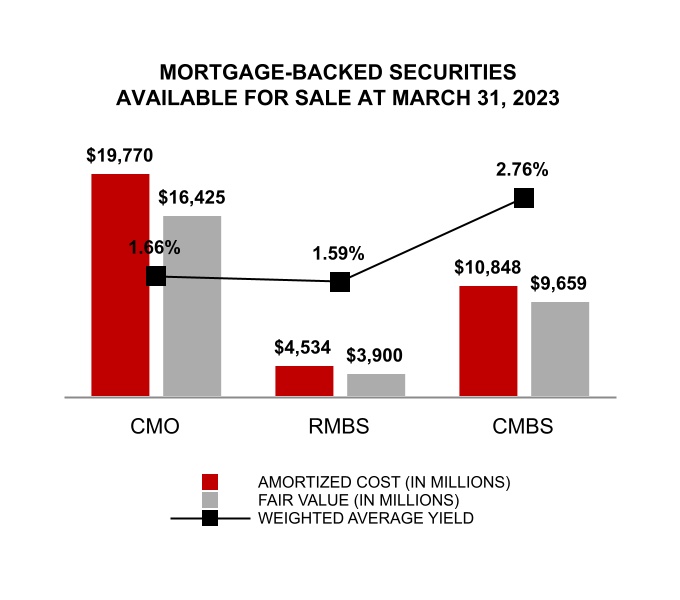
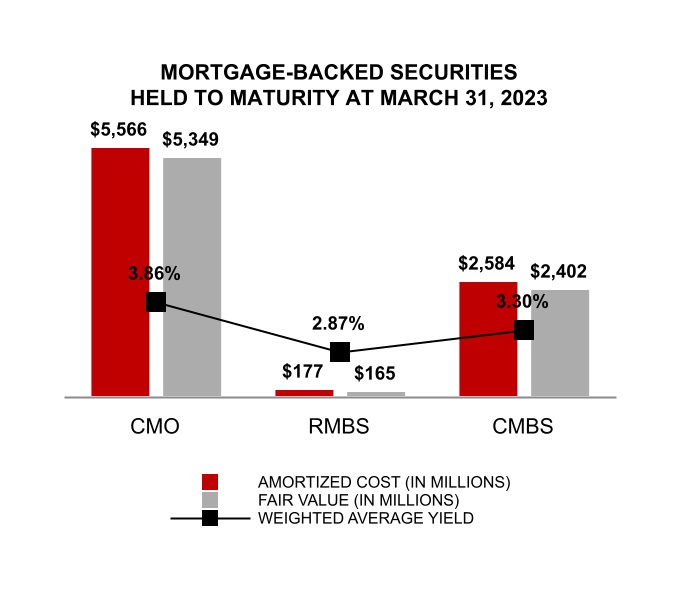
Securities available for sale
The majority of our securities available-for-sale portfolio consists of Federal Agency CMOs and mortgage-backed securities. CMOs are debt securities secured by a pool of mortgages or mortgage-backed securities. Figure 14 shows the composition, yields, and remaining maturities of our securities available for sale. For more information about these securities, including gross unrealized gains and losses by type of security and securities pledged, see Note 6 (“Securities”).
Figure 14. Securities Available for Sale
| Dollars in millions | U.S. Treasury, Agencies, and Corporations | Agency Residential Collateralized Mortgage Obligations (a) | Agency Residential Mortgage-backed Securities (a) | Agency Commercial Mortgage-backed Securities (a) | Total | Weighted-Average Yield (b) | ||||||||||||||||||||
| March 31, 2023 | ||||||||||||||||||||||||||
| Remaining maturity: | ||||||||||||||||||||||||||
| One year or less | $ | 1,774 | $ | 59 | $ | 2 | $ | 52 | $ | 1,887 | .46 | % | ||||||||||||||
| After one through five years | 7,476 | 1,979 | 2,889 | 2,332 | 14,676 | 1.37 | ||||||||||||||||||||
| After five through ten years | 157 | 11,211 | 750 | 6,058 | 18,176 | 1.98 | ||||||||||||||||||||
| After ten years | 107 | 3,176 | 259 | 1,217 | 4,759 | 1.82 | ||||||||||||||||||||
| Fair value | $ | 9,514 | $ | 16,425 | $ | 3,900 | $ | 9,659 | $ | 39,498 | — | |||||||||||||||
| Amortized cost | $ | 10,027 | $ | 19,770 | $ | 4,534 | $ | 10,848 | $ | 45,179 | 1.68 | % | ||||||||||||||
| Weighted-average yield (b) | .59 | % | 1.66 | % | 1.59 | % | 2.76 | % | 1.68 | % | — | |||||||||||||||
| Weighted-average maturity | 1.6 years | 8.1 years | 4.9 years | 7.3 years | 6.1 years | — | ||||||||||||||||||||
| December 31, 2022 | ||||||||||||||||||||||||||
| Fair value | $ | 9,415 | $ | 16,433 | $ | 3,920 | $ | 9,349 | $ | 39,117 | — | |||||||||||||||
| Amortized cost | 10,044 | 20,180 | 4,616 | 10,712 | 45,552 | 1.67 | % |
(a)Maturity is based upon expected average lives rather than contractual terms.
(b)Weighted-average yields are calculated based on amortized cost. Such yields have been adjusted to a TE basis using the statutory federal income tax rate of 21%.
Held-to-maturity securities
The majority of our held-to-maturity portfolio consists of Federal agency CMOs and mortgage-backed securities. This portfolio is also comprised of asset-backed securities that were acquired as the result of balance sheet optimization strategies, including the indirect auto portfolio transaction in the third quarter of 2021. The remaining balance is comprised of foreign bonds. Figure 15 shows the composition, yields, and remaining maturities of these securities.
Figure 15. Held-to-Maturity Securities
| Dollars in millions | Agency Residential Collateralized Mortgage Obligations (a) | Agency Residential Mortgage-backed Securities (a) | Agency Commercial Mortgage-backed Securities (a) | Asset-backed securities | Other Securities | Total | Weighted-Average Yield (b) | ||||||||||||||||
| March 31, 2023 | |||||||||||||||||||||||
| Remaining maturity: | |||||||||||||||||||||||
| One year or less | $ | 10 | $ | — | $ | 5 | $ | 2 | $ | 4 | $ | 21 | 2.50 | % | |||||||||
| After one through five years | 2,187 | 124 | 1,958 | 1,217 | 11 | 5,497 | 3.15 | ||||||||||||||||
| After five through ten years | 2,553 | 53 | 585 | — | — | 3,191 | 3.80 | ||||||||||||||||
| After ten years | 816 | — | 36 | — | — | 852 | 4.23 | ||||||||||||||||
| Amortized cost | $ | 5,566 | $ | 177 | $ | 2,584 | $ | 1,219 | $ | 15 | $ | 9,561 | 3.46 | % | |||||||||
| Fair value | $ | 5,349 | $ | 165 | $ | 2,402 | $ | 1,155 | $ | 14 | $ | 9,085 | — | ||||||||||
| Weighted-average yield (b) | 3.86 | % | 2.87 | % | 3.30 | % | 2.10 | % | 2.78 | % | 3.46 | % | — | ||||||||||
| Weighted-average maturity | 6.5 years | 5.4 years | 4.3 years | 1.3 years | 2.6 years | 5.2 years | — | ||||||||||||||||
| December 31, 2022 | |||||||||||||||||||||||
| Amortized cost | $ | 4,586 | $ | 181 | $ | 2,522 | $ | 1,407 | $ | 14 | $ | 8,710 | 3.18 | % | |||||||||
| Fair value | 4,308 | 165 | 2,315 | 1,311 | 14 | 8,113 | — |
(a)Maturity is based upon expected average lives rather than contractual terms.
(b)Weighted-average yields are calculated based on amortized cost. Such yields have been adjusted to a TE basis using the statutory federal income tax rate of 21%.
Deposits and other sources of funds
Figure 16. Breakdown of Deposits at March 31, 2023
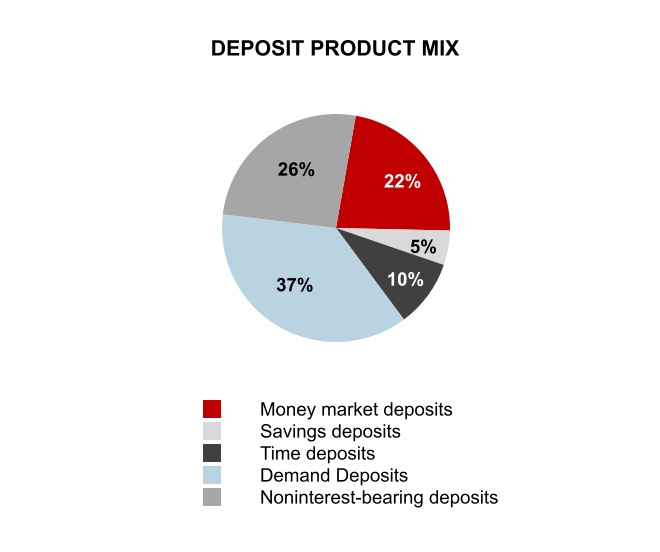
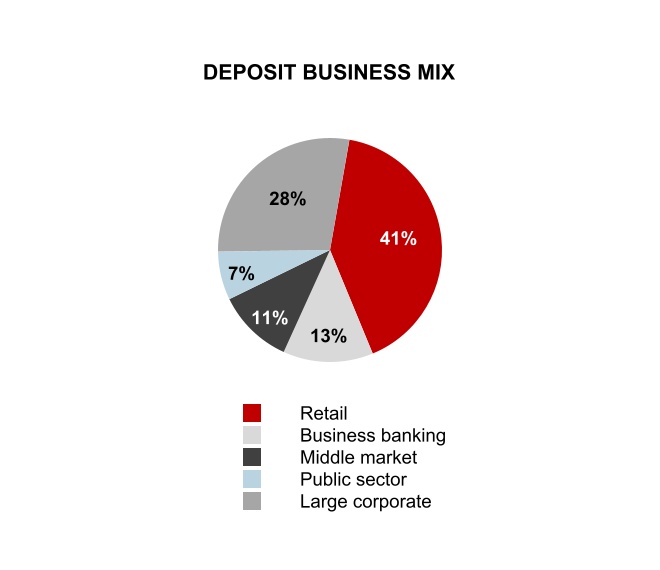
Our highly diversified and retail-oriented deposit base is our primary source of funding. At March 31, 2023, our deposits totaled $144.1 billion, an increase of $1.6 billion compared to December 31, 2022. The increase reflects seasonal inflows offset by shifting client behavior due to higher interest rates and recent market disruption.
Average deposits totaled $143.4 billion for the first quarter of 2023, a decrease of $6.8 billion compared to the year-ago quarter and by $2.3 billion compared to the fourth quarter of 2022. The declines, which are concentrated in retail deposits, reflect an increase in inflation-related spend, the normalization of pandemic-related deposits, and changing client behavior due to higher interest rates and current market conditions. Average deposits at March 31, 2023 were also impacted by normal seasonal inflows.
Uninsured deposits are defined as the portion of deposit accounts in U.S. offices that exceed the FDIC insurance limit or similar state deposit insurance regimes and amounts in any other uninsured investment or deposit accounts that are classified as deposits and not subject to any federal or state deposit insurance regimes. Figure 17 presents estimated uninsured deposits for the noted periods which reflect amounts disclosed in KeyBank’s Call Report adjusted for intercompany deposits, which are not customer facing and are eliminated in consolidation, and accrued interest.
Figure 17. Estimated Uninsured Deposits
| Dollars in billions | March 31, 2023 | December 31, 2022 | September 30, 2022 | June 30, 2022 | March 31, 2022 | ||||||||||||
| Uninsured deposits(a) | $ | 63.3 | $ | 67.1 | $ | 69.7 | $ | 71.6 | $ | 73.1 | |||||||
| Total deposits | 144.1 | 142.6 | 144.9 | 145.9 | 148.7 | ||||||||||||
| Uninsured % of Deposits | 44 | % | 47 | % | 48 | % | 49 | % | 49 | % | |||||||
| (a) Intercompany deposits and accrued interest excluded from uninsured deposits | $ | 8.3 | $ | 8.4 | $ | 8.3 | $ | 7.6 | $ | 6.6 |
As of March 31, 2023, approximately $13.7 billion of uninsured deposits were collateralized by government-backed securities.
Wholesale funds, consisting of short-term borrowings and long-term debt, totaled $34.2 billion at March 31, 2023, compared to $28.8 billion at December 31, 2022. The increase reflects unexpected balance sheet volatility stemming from recent market disruption and, in accordance with our liquidity risk management processes, our desire to maintain increased levels of cash at the Federal Reserve. For more information regarding our wholesale funds, see Item 2. Management’s Discussion & Analysis of Financial Condition & Results of Operations under the heading “Risk Management - Liquidity risk management” of this report.
Capital
The objective of capital management is to maintain capital levels consistent with our risk appetite and of a sufficient amount to operate under a wide range of economic conditions. Our current capital levels positions us well to execute against our capital priorities including supporting organic growth and paying dividends.
The following sections discuss certain ways we have deployed our capital. For further information, see the Consolidated Statements of Changes in Equity and Note 19 (“Shareholders' Equity”).
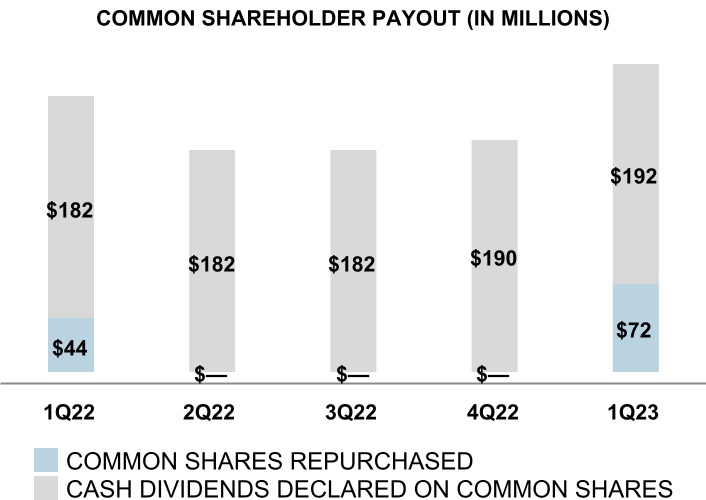
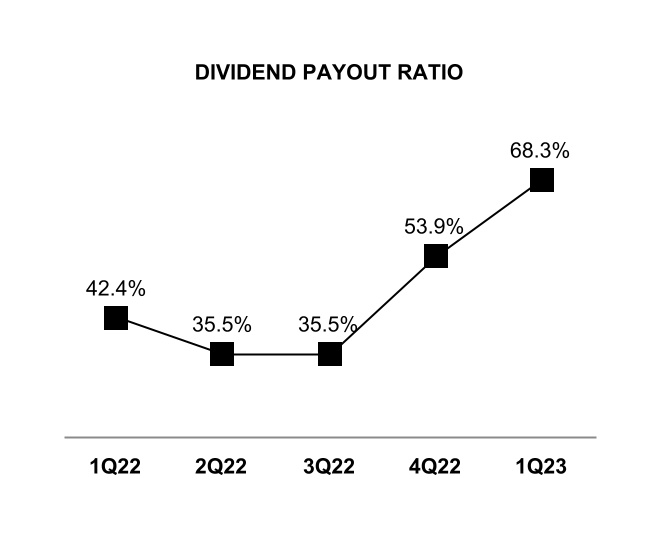
Dividends
Consistent with our capital plan, we paid a quarterly dividend of $.205 per Common Share for the first quarter of 2023. Further information regarding the capital planning process and CCAR is included under the heading “Capital planning and stress testing” beginning on page 17 in the “Supervision and Regulation” section of our 2022 Form 10-K.
Common shares outstanding
Our Common Shares are traded on the NYSE under the symbol KEY with 29,428 holders of record at March 31, 2023. Our book value per Common Share was $12.70 based on 935.2 million shares outstanding at March 31, 2023, compared to $11.79 per Common Share based on 933.3 million shares outstanding at December 31, 2022. At March 31, 2023, our tangible book value per Common Share was $9.67, compared to $8.75 per Common Share at December 31, 2022.
Figure 18 shows activities that caused the change in outstanding Common Shares over the past five quarters.
Figure 18. Changes in Common Shares Outstanding
| 2023 | 2022 | |||||||||||||||||||
| In thousands | First | Fourth | Third | Second | First | |||||||||||||||
| Shares outstanding at beginning of period | 933,325 | 932,938 | 932,643 | 932,398 | 928,850 | |||||||||||||||
| Open market repurchases and return of shares under employee compensation plans | (4,333) | (2) | (3) | (24) | (1,707) | |||||||||||||||
| Shares issued under employee compensation plans (net of cancellations) | 6,237 | 389 | 298 | 269 | 5,255 | |||||||||||||||
| Shares outstanding at end of period | 935,229 | 933,325 | 932,938 | 932,643 | 932,398 | |||||||||||||||
As shown above, Common Shares outstanding increased by 1.9 million shares during the first quarter of 2023.
At March 31, 2023, we had 321.5 million treasury shares, compared to 323.4 million treasury shares at December 31, 2022. Going forward we expect to reissue treasury shares as needed in connection with stock-based compensation awards and for other corporate purposes.
Information on repurchases of Common Shares by KeyCorp is included in Part II, Item 2. “Unregistered Sales of Equity Securities and Use of Proceeds” of this report.
Capital adequacy
Capital adequacy is an important indicator of financial stability and performance. All of our capital ratios remained in excess of regulatory requirements at March 31, 2023. Our capital and liquidity levels are intended to position us to weather an adverse operating environment while continuing to serve our clients’ needs, as well as to meet the Regulatory Capital Rules described in Item 1. Business of our 2022 Form 10-K under the heading “Supervision and Regulation.” Our shareholders’ equity to assets ratio was 7.3% at March 31, 2023, compared to 7.1% at December 31, 2022. Our tangible common equity to tangible assets ratio was 4.6% at March 31, 2023, compared to 4.4% at December 31, 2022. See the section entitled “GAAP to Non-GAAP Reconciliations,” which presents the computations of certain financial measures related to “tangible common equity.” The minimum capital and leverage ratios under the Regulatory Capital Rules together with the ratios of KeyCorp at March 31, 2023, are set forth in the “Supervision and regulation — Regulatory capital requirements” section in Item 2 of this report.
Figure 19 represents the details of our regulatory capital positions at March 31, 2023, and December 31, 2022, under the Regulatory Capital Rules. Information regarding the regulatory capital ratios of KeyCorp’s banking subsidiaries is presented annually, with the most recent information included in Note 24 (“Shareholders' Equity”) beginning on page 170 of our 2022 Form 10-K.
Figure 19. Capital Components and Risk-Weighted Assets
| Dollars in millions | March 31, 2023 | December 31, 2022 | |||||||||
| COMMON EQUITY TIER 1 | |||||||||||
| Key shareholders’ equity (GAAP) | $ | 14,322 | $ | 13,454 | |||||||
| Less: | Preferred Stock (a) | 2,446 | 2,446 | ||||||||
| Add: | CECL phase-in (b) | 118 | 178 | ||||||||
| Common Equity Tier 1 capital before adjustments and deductions | 11,994 | 11,186 | |||||||||
| Less: | Goodwill, net of deferred taxes | 2,608 | 2,612 | ||||||||
| Intangible assets, net of deferred taxes | 78 | 88 | |||||||||
| Deferred tax assets | 1 | 1 | |||||||||
| Net unrealized gains (losses) on available-for-sale securities, net of deferred taxes | (4,283) | (4,857) | |||||||||
| Accumulated gains (losses) on cash flow hedges, net of deferred taxes | (916) | (1,160) | |||||||||
| Amounts in AOCI attributed to pension and postretirement benefit costs, net of deferred taxes | (275) | (277) | |||||||||
| Total Common Equity Tier 1 capital | $ | 14,781 | $ | 14,779 | |||||||
| TIER 1 CAPITAL | |||||||||||
| Common Equity Tier 1 | $ | 14,781 | $ | 14,779 | |||||||
| Additional Tier 1 capital instruments and related surplus | 2,446 | 2,446 | |||||||||
| Less: | Deductions | — | — | ||||||||
| Total Tier 1 capital | $ | 17,227 | $ | 17,225 | |||||||
| TIER 2 CAPITAL | |||||||||||
| Tier 2 capital instruments and related surplus | $ | 2,144 | $ | 2,200 | |||||||
| Allowance for losses on loans and liability for losses on lending-related commitments (c) | 1,521 | 1,351 | |||||||||
| Less: | Deductions | — | — | ||||||||
| Total Tier 2 capital | 3,665 | 3,551 | |||||||||
| Total risk-based capital | $ | 20,892 | $ | 20,776 | |||||||
| RISK-WEIGHTED ASSETS | |||||||||||
| Risk-weighted assets on balance sheet | $ | 126,503 | $ | 125,900 | |||||||
| Risk-weighted off-balance sheet exposure | 35,422 | 35,745 | |||||||||
| Market risk-equivalent assets | 1,084 | 826 | |||||||||
| Gross risk-weighted assets | 163,009 | 162,471 | |||||||||
| Less: | Excess allowance for loan and lease losses | — | — | ||||||||
| Net risk-weighted assets | $ | 163,009 | $ | 162,471 | |||||||
| AVERAGE QUARTERLY TOTAL ASSETS | $ | 195,023 | $ | 193,986 | |||||||
| CAPITAL RATIOS | |||||||||||
| Tier 1 risk-based capital | 10.57 | % | 10.60 | % | |||||||
| Total risk-based capital | 12.82 | % | 12.79 | % | |||||||
| Leverage (d) | 8.83 | % | 8.88 | % | |||||||
| Common Equity Tier 1 | 9.07 | % | 9.10 | % |
(a)Net of capital surplus.
(b)Amount reflects our decision to adopt the CECL transitional provision.
(c)The ALLL included in Tier 2 capital is limited by regulation to 1.25% of the institution’s standardized total risk-weighted assets (excluding its standardized market risk-weighted assets). The ALLL includes $19 million and $21 million of allowance classified as “discontinued assets” on the balance sheet at March 31, 2023, and December 31, 2022, respectively.
(d)This ratio is Tier 1 capital divided by average quarterly total assets as defined by the Federal Reserve less: (i) goodwill, (ii) the disallowed intangible and deferred tax assets, and (iii) other deductions from assets for leverage capital purposes.
Risk Management
Overview
Like all financial services companies, we engage in business activities and assume the related risks. The most significant risks we face are credit, compliance, operational, liquidity, market, reputation, strategic, and model risks. Our risk management activities are focused on ensuring that we properly identify, measure, and manage such risks across the entire enterprise to maintain safety and soundness, and to maximize profitability. Our definition, philosophy, and approach to risk management have not materially changed from the discussion presented under the heading “Risk Management” beginning on page 72 of our 2022 Form 10-K.
Market risk management
Market risk is the risk that movements in market risk factors, including interest rates, foreign exchange rates, equity prices, commodity prices, credit spreads, and volatilities, will reduce Key’s income and the value of its portfolios. These factors influence prospective yields, values, or prices associated with the instrument. We are exposed to market risk both in our trading and nontrading activities, which include asset and liability management activities. Information regarding our fair value policies, procedures, and methodologies is provided in Note 1 (“Summary of Significant Accounting Policies”) under the heading “Fair Value Measurements” on page 109 of our 2022 Form 10-K and Note 5 (“Fair Value Measurements”) in this report.
Trading market risk
Key incurs market risk as a result of trading activities that are used in support of client facilitation and hedging activities, principally within our investment banking and capital markets businesses. Key has exposures to a wide range of risk factors including interest rates, equity prices, foreign exchange rates, credit spreads, and commodity prices, as well as the associated implied volatilities and spreads. Our primary market risk exposures are a result of trading and hedging activities in the derivative and fixed income markets, including securitization positions exposures. At March 31, 2023, we did not have any re-securitization positions. We maintain modest trading inventories to facilitate customer flow, make markets in securities, and hedge certain risks including but not limited to credit risk and interest rate risk. The risks associated with these activities are mitigated in accordance with the Market Risk hedging policy. The majority of our positions are traded in active markets.
Market risk management is an integral part of Key’s risk culture. The Risk Committee of our Board provides oversight of trading market risks. The ERM Committee and the Market Risk Committee regularly review and discuss market risk reports prepared by our MRM that contain our market risk exposures and results of monitoring activities. Market risk policies and procedures have been defined and approved by the Market Risk Committee, a Tier 2 Risk Governance Committee, and take into account our tolerance for risk and consideration for the business environment. For more information regarding monitoring of trading positions and the activities related to the Market Risk Rule compliance, see “Market Risk Management” beginning on page 74 of our 2022 Form 10-K.
VaR and stressed VaR. VaR is the estimate of the maximum amount of loss on an instrument or portfolio due to adverse market conditions during a given time interval within a stated confidence level. Stressed VaR is used to assess extreme conditions on market risk within our trading portfolios. The MRM calculates VaR and stressed VaR on a daily basis, and the results are distributed to appropriate management. VaR and stressed VaR results are also provided to our regulators and utilized in regulatory capital calculations.
We use a historical simulation VaR model to measure the potential adverse effect of changes in interest rates, foreign exchange rates, equity prices, and credit spreads on the fair value of our covered positions and other non-covered positions. We analyze market risk by portfolios and do not separately measure and monitor our portfolios by risk type. Historical scenarios are customized for specific positions, and numerous risk factors are incorporated in the calculation. Additional consideration is given to the risk factors to estimate the exposures that contain optionality features, such as options and cancellable provisions. VaR is calculated using daily observations over a one-year time horizon and approximates a 95% confidence level. Statistically, this means that we would expect to incur losses greater than VaR, on average, five out of 100 trading days, or three to four times each quarter. We also calculate VaR and stressed VaR at a 99% confidence level. For more information regarding our VaR model, its governance, and assumptions, see “Market Risk Management” on page 74 of our 2022 Form 10-K.
Actual losses for the total covered portfolios did not exceed aggregate daily VaR on any day during the quarters ended March 31, 2023, and March 31, 2022. The MRM backtests our VaR model on a daily basis to evaluate its predictive power. The test compares VaR model results at the 99% confidence level to daily held profit and loss. Results of backtesting are provided to the Market Risk Committee. Backtesting exceptions occur when trading losses exceed VaR. We do not engage in correlation trading or utilize the internal model approach for measuring default and credit migration risk. Our net VaR approach incorporates diversification, but our VaR calculation does not include the impact of counterparty risk and our own credit spreads on derivatives.
The aggregate VaR at the 99% confidence level with a one day holding period for all covered positions was $1.7 million at March 31, 2023, and $1.1 million at March 31, 2022. Figure 20 summarizes our VaR at the 99% confidence level with a one day holding period for significant portfolios of covered positions for the three months ended March 31, 2023, and March 31, 2022.
Figure 20. VaR for Significant Portfolios of Covered Positions
| 2023 | 2022 | ||||||||||||||||||||||||||||
| Three months ended March 31, | Three months ended March 31, | ||||||||||||||||||||||||||||
| Dollars in millions | High | Low | Mean | March 31, | High | Low | Mean | March 31, | |||||||||||||||||||||
| Trading account assets: | |||||||||||||||||||||||||||||
| Fixed income | $ | 1.3 | $ | .4 | $ | .8 | $ | 1.1 | $ | 1.7 | $ | .4 | $ | 1.0 | $ | .8 | |||||||||||||
| Derivatives: | |||||||||||||||||||||||||||||
| Interest rate | $ | .7 | $ | .3 | $ | .4 | $ | .4 | $ | .4 | $ | .1 | $ | .2 | $ | .1 | |||||||||||||
Stressed VaR is calculated by running the portfolios through a predetermined stress period which is approved by the Market Risk Committee and is calculated at the 99% confidence level using the same model and assumptions used for general VaR. The aggregate stressed VaR for all covered positions was $2.3 million at March 31, 2023, and $2.7 million at March 31, 2022. Figure 21 summarizes our stressed VaR at the 99% confidence level with a one day holding period for significant portfolios of covered positions for the three months ended March 31, 2023, and March 31, 2022.
Figure 21. Stressed VaR for Significant Portfolios of Covered Positions
| 2023 | 2022 | ||||||||||||||||||||||||||||
| Three months ended March 31, | Three months ended March 31, | ||||||||||||||||||||||||||||
| Dollars in millions | High | Low | Mean | March 31, | High | Low | Mean | March 31, | |||||||||||||||||||||
| Trading account assets: | |||||||||||||||||||||||||||||
| Fixed income | $ | 2.2 | $ | .9 | $ | 1.6 | $ | 1.6 | $ | 4.5 | $ | 1.3 | $ | 3.0 | $ | 2.1 | |||||||||||||
| Derivatives: | |||||||||||||||||||||||||||||
| Interest rate | $ | .8 | $ | .2 | $ | .5 | $ | .5 | $ | .8 | $ | .2 | $ | .4 | $ | .3 | |||||||||||||
Internal capital adequacy assessment. Market risk is a component of our internal capital adequacy assessment. Our risk-weighted assets include a market risk-equivalent asset amount, which consists of a VaR component, stressed VaR component, a de minimis exposure amount, and a specific risk add-on including the securitization positions. The aggregate market value of the securitization positions as defined by the Market Risk Rule was $3.0 million at March 31, 2023, all of which were mortgage-backed security positions. Specific risk is the price risk of individual financial instruments, which is not accounted for by changes in broad market risk factors and is measured through a standardized approach. Market risk weighted assets, including the specific risk calculations, are run quarterly by the MRM in accordance with the Market Risk Rule, and approved by the Chief Market Risk Officer.
Nontrading market risk
Most of our nontrading market risk is derived from interest rate fluctuations and its impacts on our traditional loan and deposit products, as well as investments, hedging relationships, long-term debt, and certain short-term borrowings. Interest rate risk, which is inherent in the banking industry, is measured by the potential for fluctuations in net interest income and the EVE. Such fluctuations may result from changes in interest rates and differences in the repricing and maturity characteristics of interest-earning assets and interest-bearing liabilities. We manage the exposure to changes in net interest income and the EVE in accordance with our risk appetite and in accordance with the Board approved ERM policy.
Interest rate risk positions are influenced by a number of factors, including the balance sheet positioning that arises out of customer preferences for loan and deposit products, economic conditions, the competitive environment within
our markets, changes in market interest rates that affect client activity, and our hedging, investing, funding, and capital positions. The primary components of interest rate risk exposure consist of reprice risk, basis risk, yield curve risk, and option risk.
-
“Reprice risk”** is the exposure to changes in the level of interest rates and occurs when the volume of interest-bearing liabilities and the volume of interest-earning assets they fund (e.g., deposits used to fund loans) do not mature or reprice at the same time.
-
“Basis risk”** is the exposure to asymmetrical changes in interest rate indexes and occurs when floating-rate assets and floating-rate liabilities reprice at the same time, but in response to different market factors or indexes.
-
“Yield curve risk” is the exposure to nonparallel changes in the slope of the yield curve (where the yield curve depicts the relationship between the yield on a particular type of security and its term to maturity) and occurs when interest-bearing liabilities and the interest-earning assets that they fund do not price or reprice to the same term point on the yield curve.
-
“Option risk”** is the exposure to a customer or counterparty’s ability to take advantage of the interest rate environment and terminate or reprice one of our assets, liabilities, or off-balance sheet instruments prior to contractual maturity without a penalty. Option risk occurs when exposures to customer and counterparty early withdrawals or prepayments are not mitigated with an offsetting position or appropriate compensation.
The management of nontrading market risk is centralized within Corporate Treasury. The Risk Committee of our Board provides oversight of nontrading market risk. The ERM Committee and the ALCO review reports on the interest rate risk exposures described above. In addition, the ALCO reviews reports on stress tests and sensitivity analyses related to interest rate risk. These committees have various responsibilities related to managing nontrading market risk, including recommending, approving, and monitoring strategies that maintain risk positions within approved tolerance ranges. The A/LM policy provides the framework for the oversight and management of interest rate risk and is administered by the ALCO. The MRM, as the second line of defense, provides additional oversight.
LIBOR Transition
As disclosed in Item 1A. Risk Factors of our 2022 Form 10-K, bank regulators have issued guidance advising against the use of LIBOR in its current form for new contracts. For most financial products, the most common alternative reference rates have been, and are expected to be, SOFR-based benchmarks. This is true for both new originations and legacy LIBOR contracts that are subject to amendment or a transition by their terms. We have established an enterprise-wide program to identify and address all LIBOR transition issues related to legacy LIBOR contracts. We are collaborating closely with regulators and industry groups on the transition and closely monitoring industry practices related to LIBOR alternatives. The goals of our LIBOR transition program include:
-
Identifying and analyzing LIBOR-based exposure and developing and executing transition strategies;
-
Reviewing and updating near-term strategies and actions for existing LIBOR-based contracts not yet transitioned;
-
Assessing financial impacts and risks while planning and executing mitigation actions;
-
Understanding and strategically addressing the current market approach to LIBOR relative to transitioning to alternative reference rates, including the impact of the LIBOR Act and the Federal Reserve’s regulations as well as the FCA’s policy decisions related to so-called synthetic USD LIBOR; and
-
Determining and executing system and process work to be operationally ready for credit sensitive benchmarks.
As part of the LIBOR transition program, we completed an initial risk assessment to help us identify the impact and risks associated with various products, systems, processes, and models. This risk assessment has assisted us in making necessary updates to our infrastructure and operational systems and processes to implement a replacement rate, and we have implemented various SOFR-based benchmarks as determined by the affected line of business, including but not limited to, Daily Simple SOFR in Arrears, SOFR Compounded in Arrears, SOFR Averages in Advance, and Term SOFR. We are actively quoting alternative indexes other than LIBOR, such as SOFR and Term SOFR, and are originating new loans in those indexes. We have also originated a small number of new loans using credit sensitive rates in a limited and managed fashion.
We have compiled an inventory of existing legal contracts that are impacted by the LIBOR transition. We have assessed the LIBOR fallback language in those contracts, have devised a strategy to address the LIBOR transition for those contracts, and are in the process of remediating such contracts. Our progress is well-paced to complete the remediation of the LIBOR portfolio by June 30, 2023. We are leveraging recommendations made by the ARRC and ISDA that are tailored to our specific client segments. We also have evaluated the impact of the LIBOR Act on our transition strategy. The legislation provides a uniform national approach for replacing LIBOR in legacy contracts that do not provide for the use of a clearly defined or practicable replacement benchmark rate.
As of March 31, 2023, Key had the following instruments that were either directly or indirectly dependent on LIBOR.
| Dollars in millions | Maturity through June 30, 2023 | Maturity past June 30, 2023 | ||||||
| Outstanding balance of loans | $ | 703 | $ | 8,310 | ||||
| Notional value of derivative contracts | 6,874 | 67,793 | ||||||
| Investment securities | — | 525 | ||||||
| Debt and equity instruments | — | 1,276 |
Net interest income simulation analysis. The primary tool we use to measure our interest rate risk is simulation analysis. For purposes of this analysis, we estimate our net interest income based on the current and projected composition of our on- and off-balance sheet positions, accounting for recent and anticipated trends in customer activity. The analysis also incorporates assumptions for the current and projected interest rate environments and balance sheet growth projections based on a most likely macroeconomic view. The modeling incorporates investment portfolio and swap portfolio balances consistent with management's desired interest rate risk positioning. The simulation model estimates the amount of net interest income at risk by simulating the change in net interest income that would occur if rates were to gradually increase or decrease from current levels over the next 12 months (subject to a floor on market interest rates at zero).
Figure 22 presents the results of the simulation analysis at March 31, 2023, and March 31, 2022. At March 31, 2023, our simulated impact to changes in interest rates was moderate. The exposure to declining rates has decreased as a result of higher funding costs and a funding mix change to more rate sensitive instruments compared to the March 31, 2022 analysis. Current modeled exposure is within the Board approved tolerances. If a tolerance level is breached and determined inconsistent with risk appetite, the development of a remediation plan is required to reduce exposure back to within tolerance.
Figure 22. Simulated Change in Net Interest Income
| March 31, 2023 | March 31, 2022 | |||||||||||||
| Basis point change assumption | -200 | +200 | -200 | +200 | ||||||||||
| Assumed floor in market rates (in basis points) | — | N/A | — | N/A | ||||||||||
| Rising rate beta | N/A | Mid 40s | N/A | Low 30s | ||||||||||
| Tolerance level | (5.50) | % | (5.50) | % | (5.50) | % | (5.50) | % | ||||||
| Interest rate risk assessment | 1.37 | % | (3.27) | % | (4.35) | % | 3.33 | % | ||||||
| +200 NII at risk beta sensitivity | March 31, 2023 | |||||||||||||
| Beta assumption | Mid 40s | Low 40s | Mid 30s | Low 30s | ||||||||||
| Interest rate risk assessment | (3.27) | % | (2.26) | % | (1.25) | % | (0.24) | % |
Simulation analyses produce a sophisticated estimate of interest rate exposure based on assumption inputs within the model. Assumptions are tailored to the specific interest rate environment and validated on a regular basis. However, actual results may differ from those derived in simulation analyses due to unanticipated changes to the balance sheet composition, customer behavior, product pricing, market interest rates, changes in management’s desired interest rate risk positioning, investment, funding and hedging activities or repercussions from exogenous events.
Regular stress tests and sensitivity analyses are performed on the model inputs that could materially change the resulting risk assessments. Assessments are performed using different yield curve shapes, including steepenings or flattenings of the curve, immediate changes in market interest rates, and changes in the relationship of money market interest rates. Assessments are also performed on changes to the following assumptions: loan and deposit balances, the pricing of deposits without contractual maturities, changes in lending spreads, prepayments on loans and securities, investment, funding and hedging activities, and liquidity and capital management strategies.
The results of additional assessments indicate that net interest income could increase or decrease from the base simulation results presented in Figure 22. Net interest income is highly dependent on the timing, magnitude, frequency, and path of interest rate changes and the associated assumptions for deposit repricing relationships, lending spreads, and the balance behavior of transaction accounts. If fixed rate assets increase by $1 billion, or fixed rate liabilities decrease by $1 billion, then the benefit to rising rates would decrease by approximately 21 basis points. If the interest-bearing liquid deposit beta assumption increases or decreases by 5% (e.g., 40% to 45%), then the benefit to rising rates would decrease or increase by approximately 105 basis points.
The current interest rate risk position could fluctuate to higher or lower levels of risk depending on the competitive environment and client behavior that may affect the actual volume, mix, maturity, and repricing characteristics of loan and deposit flows. Corporate Treasury discretionary activities related to funding, investing, and hedging may also change as a result of changes in customer business flows or changes in management’s desired interest rate risk positioning. As changes occur to both the configuration of the balance sheet and the outlook for the economy, management proactively evaluates hedging opportunities that may change the interest rate risk profile.
Simulations are also conducted that measure the effect of changes in market interest rates in the second and third years of a three-year horizon. These simulations are conducted in a similar manner to those based on a 12-month horizon. To capture longer-term exposures, changes in the EVE are calculated as discussed in the following section.
Economic value of equity modeling. EVE complements net interest income simulation analysis as it estimates risk exposure beyond 12-, 24-, and 36-month horizons. EVE modeling measures the extent to which the economic values of assets, liabilities, and off-balance sheet instruments may change in response to fluctuations in interest rates. EVE is calculated by subjecting the balance sheet to an immediate increase or decrease in interest rates, measuring the resulting change in the values of assets, liabilities, and off-balance sheet instruments, and comparing those amounts with the base case of the current interest rate environment. EVE policy limits are measured against a +200 basis point/policy decline scenario. The policy decline scenario is equal to the current Fed Target Rate capped at 200 basis points. As of March 31, 2023, the policy decline scenario is minus 200 basis points. This analysis is highly dependent upon assumptions applied to assets and liabilities with non-contractual maturities. Those assumptions are based on historical behaviors, as well as forward expectations. Remediation plans are similarly developed if the analysis indicates that the EVE will decrease by more than 15% in response to an immediate increase or decrease in interest rates. The position is within these guidelines as of March 31, 2023.
Management of interest rate exposure. The results of the various interest rate risk analyses are used to formulate A/LM strategies to achieve the desired risk profile while managing to objectives for capital adequacy and liquidity risk exposures. Specifically, risk positions are managed by purchasing securities, issuing term debt with floating or fixed interest rates, and using derivatives. Interest rate swaps and options are predominantly used, which modify the interest rate characteristics of certain assets and liabilities.
Figure 23 shows all swap positions held for A/LM purposes. These positions are used to convert the contractual interest rate index of agreed-upon amounts of assets and liabilities (i.e., notional amounts) to another interest rate index. For example, fixed-rate debt is converted to a floating rate through a “receive fixed/pay variable” interest rate swap. The volume, maturity, and mix of portfolio swaps change frequently to reflect broader A/LM objectives and the balance sheet positions to be hedged. For more information about how interest rate swaps are used to manage the risk profile, see Note 7 (“Derivatives and Hedging Activities”).
Figure 23. Portfolio Swaps by Interest Rate Risk Management Strategy
| March 31, 2023 | ||||||||||||||||||||||||||||||||
| Weighted-Average | December 31, 2022 | |||||||||||||||||||||||||||||||
| Dollars in millions | Notional Amount | Fair Value | Maturity (Years) | Receive Rate | Pay Rate | Notional Amount | Fair Value | |||||||||||||||||||||||||
| Receive fixed/pay variable — conventional A/LM (a) | $ | 27,000 | $ | (1,212) | 2.1 | 1.3 | % | 4.8 | % | $ | 28,450 | $ | (1,503) | |||||||||||||||||||
| Receive fixed/pay variable — conventional debt | 9,810 | (394) | 4.3 | 2.3 | 4.7 | 10,995 | (551) | |||||||||||||||||||||||||
| Receive fixed/pay variable — forward A/LM | 4,000 | 16 | 3.3 | 3.5 | 4.0 | 1,300 | (8) | |||||||||||||||||||||||||
| Receive fixed/pay variable — forward debt | 1,425 | (4) | 7.3 | 3.1 | 4.3 | — | — | |||||||||||||||||||||||||
| Pay fixed/receive variable — conventional debt | 50 | — | 5.3 | 4.8 | 3.6 | 50 | 1 | |||||||||||||||||||||||||
| Pay fixed/receive variable — forward securities | — | — | — | — | — | — | — | |||||||||||||||||||||||||
| Pay fixed/receive variable — securities | 1,405 | 53 | 2.4 | 4.7 | 2.9 | 405 | 48 | |||||||||||||||||||||||||
| Total portfolio swaps | $ | 43,690 | $ | (1,541) | (b) | 2.8 | 1.7 | % | 4.2 | % | $ | 41,200 | $ | (2,013) | (b) | |||||||||||||||||
| Floors — forward purchased | 3,250 | 44 | 2.9 | — | — | $ | — | $ | — | |||||||||||||||||||||||
| Floors — forward sold | 3,250 | (20) | 2.9 | — | — | — | — | |||||||||||||||||||||||||
| Total floors | 6,500 | 24 | — | — | — | $ | — | $ | — | |||||||||||||||||||||||
(a)Portfolio swaps designated as A/LM are used to manage interest rate risk tied to both assets and liabilities.
(b)Excludes accrued interest of $53 million and $62 million at March 31, 2023, and December 31, 2022, respectively.
Liquidity risk management
Liquidity risk, which is inherent in the banking industry, is measured by our ability to accommodate liability maturities and deposit withdrawals, meet contractual obligations, and fund new business opportunities at a reasonable cost, in a timely manner, and without adverse consequences. Liquidity management involves maintaining sufficient and diverse sources of funding to accommodate planned, as well as unanticipated, changes in assets and liabilities under both normal and adverse conditions.
Factors affecting liquidity
Our liquidity could be adversely affected by both direct and indirect events. An example of a direct event would be a downgrade in our public credit ratings by a rating agency. Examples of indirect events (events unrelated to us) that could impair our access to liquidity would be an act of terrorism or war, natural disasters, global pandemics, political events, or the default or bankruptcy of a major corporation, mutual fund, or hedge fund. Similarly, market speculation, or rumors about us or the banking industry in general, may adversely affect the cost and availability of normal funding sources. For a discussion of certain risks which may impact our liquidity, see Part II, Item 1A. "Risk Factors" in this report. For more information on recent liquidity activity, see the header "Our liquidity position and recent activity" in this report below.
Our credit ratings at March 31, 2023, are shown in Figure 24. We believe these credit ratings, under normal conditions in the capital markets, would enable KeyCorp or KeyBank to issue fixed income securities to investors. On April 21, 2023, Moody’s affirmed all long-term and short-term ratings and assessments of KeyCorp and KeyBank, while changing KeyCorp and KeyBank’s rating outlook from “stable” to “negative” related to uncertainty in the banking industry following the recent bank failures. The change in outlook was part of a broader action by Moody’s whereby the macro profile of the U.S. banking system was lowered reflecting general concern around the banking industry as a whole. KeyCorp and KeyBank’s rating outlook from Standard & Poor’s, Fitch Ratings, Inc., and DBRS, Inc., remain unchanged and are listed as “stable”.
Figure 24. Credit Ratings
| March 31, 2023 | Short-Term Borrowings | Long-Term Deposits (a) | Senior Long-Term Debt | Subordinated Long-Term Debt | Capital Securities | Preferred Stock | ||||||||||||||
| KEYCORP | ||||||||||||||||||||
| Standard & Poor’s | A-2 | N/A | BBB+ | BBB | BB+ | BB+ | ||||||||||||||
| Moody’s | P-2 | N/A | Baa1 | Baa1 | Baa2 | Baa3 | ||||||||||||||
| Fitch Ratings, Inc. | F1 | N/A | A- | N/A | BB+ | BB+ | ||||||||||||||
| DBRS, Inc. | R-1 (low) | N/A | A | A (low) | A (low) | BBB | ||||||||||||||
| KEYBANK | ||||||||||||||||||||
| Standard & Poor’s | A-2 | N/A | A- | BBB+ | N/A | N/A | ||||||||||||||
| Moody’s | P-2 | P-1/A1 | A3 | Baa1 | N/A | N/A | ||||||||||||||
| Fitch Ratings, Inc. | F1 | F1/A | A- | BBB+ | N/A | N/A | ||||||||||||||
| DBRS, Inc. | R-1 (middle) | A (high) | A (high) | A | N/A | N/A |
(a)P-1 rating assigned by Moody’s is specific to KeyBank’s short-term bank deposit ratings. F1 assigned by Fitch Ratings, Inc. is specific to KeyBank’s short-term deposit ratings.
Sources of liquidity
Our primary source of funding for KeyBank are customer deposits resulting in a consolidated loan-to-deposit ratio of 84% as of March 31, 2023. If the cash flows needed to support operating and investing activities are not satisfied by deposit balances, we rely on wholesale funding or on-balance sheet liquid reserves. Conversely, excess cash generated by operating, investing, and deposit-gathering activities may be used to repay outstanding debt or invest in liquid assets. We maintain a Contingency Funding Plan that outlines the process for addressing a liquidity crisis. As part of the plan, we maintain on-balance sheet liquid reserves referred to as our liquid asset portfolio, which consists of high quality liquid assets. During a problem period, that reserve could be used as a source of funding to provide time to develop and execute a longer-term strategy. Our available contingent liquidity at March 31, 2023, totaled $76.9 billion, consisting of $16.1 billion of unpledged securities, $8.4 billion of net balances of federal funds sold and balances in our Federal Reserve account, $45.5 billion of unused secured borrowing capacity at the Federal Reserve Bank of Cleveland, and $6.9 billion of unused secured borrowing capacity at the FHLB. During the first quarter of 2023, our secured term borrowings increased $5.5 billion as additional advances were taken to increase the level of cash held in our Federal Reserve Account.
We have several liquidity programs, which are described in Note 20 (“Long-term Debt”) beginning on page 164 of our 2022 Form 10-K, that are designed to enable KeyCorp and KeyBank to raise funds in the public and private debt markets. The proceeds from most of these programs can be used for general corporate purposes, including acquisitions. On January 26, 2023, KeyBank issued the following notes under the bank note program: $1 billion of Fixed Rate Senior Bank Notes due January 26, 2033, and $500 million of Fixed Rate Senior Bank Notes due January 26, 2026.
Liquidity for KeyCorp
The primary source of liquidity for KeyCorp is from subsidiary dividends, primarily from KeyBank. KeyCorp has sufficient liquidity when it can service its debt; support customary corporate operations and activities (including acquisitions); support occasional guarantees of subsidiaries’ obligations in transactions with third parties at a reasonable cost, in a timely manner, and without adverse consequences; and fund capital distributions in the form of dividends and share buybacks.
At March 31, 2023, KeyCorp held $3.0 billion in cash, which we projected to be sufficient to meet our projected obligations, including the repayment of our maturing debt obligations for the periods prescribed by our risk tolerance.
Typically, KeyCorp meets its liquidity requirements through regular dividends from KeyBank, supplemented with term debt. KeyCorp had no debt issuances during the first quarter of 2023. During the first quarter of 2023, KeyBank paid $150 million cash dividends to KeyCorp. As of March 31, 2023, KeyBank had regulatory capacity to pay $2.6 billion in dividends to KeyCorp without prior regulatory approval.
Our liquidity position and recent activity
Over the past quarter, our liquid asset portfolio, which includes overnight and short-term investments, as well as unencumbered, high quality liquid securities held as protection against a range of potential liquidity stress scenarios, has increased primarily from an increase in cash balances. The liquid asset portfolio continues to exceed the amount that we estimate would be necessary to manage through an adverse liquidity event by providing sufficient time to develop and execute a longer-term solution. In response to the recent market volatility driven by the recent bank failures, Key has initiated heightened monitoring for liquidity and funding. This heightened monitoring includes daily updates to senior management centered on balance sheet flows and reserve balances held at the Federal Reserve. We have also increased the level of cash held at the Federal Reserve in the event there is an unexpected funding outflow.
From time to time, KeyCorp or KeyBank may seek to retire, repurchase, or exchange outstanding debt, capital securities, preferred shares, or Common Shares through cash purchase, privately negotiated transactions or other means. Additional information on repurchases of Common Shares by KeyCorp is included in Part II, Item 5. Market for the Registrant’s Common Equity, Related Stockholder Matters and Issuer Purchases of Equity Securities beginning on page 45 of our 2022 Form 10-K and Part II, Item 2 of this Form 10-Q. Such transactions depend on prevailing market conditions, our liquidity and capital requirements, contractual restrictions, regulatory requirements, and other factors. The amounts involved may be material, individually or collectively.
The Consolidated Statements of Cash Flows summarize our sources and uses of cash by type of activity for the three-month periods ended March 31, 2023, and March 31, 2022.
For more information regarding liquidity governance structure, management of liquidity risk at KeyBank and KeyCorp, long-term liquidity strategies, and other liquidity programs, see “Liquidity Risk Management” beginning on page 80 of our 2022 Form 10-K as well as the disclosure included in Part II, Item 1A. “Risk Factors” of this report.
Credit risk management
Credit risk is the risk of loss arising from an obligor’s inability or failure to meet contractual payment or performance terms. Like other financial services institutions, we make loans, extend credit, distribute credit risk, purchase securities, provide financial and payments products, and enter into financial derivative contracts, all of which have related credit risk.
Credit policy, approval, and evaluation
We manage credit risk exposure through a multifaceted program. The Credit Risk Committee approves management credit policies and recommends significant credit policies to the Enterprise Risk Management Committee, the KeyBank Board, and the Risk Committee of the KeyCorp Board for approval. These policies are communicated throughout the organization to foster a consistent approach to granting credit.
Our credit risk management team and certain individuals within our lines of business, to whom credit risk management has delegated limited credit authority, are responsible for credit approval. Individuals with assigned credit authority are authorized to grant exceptions to credit policies. It is not unusual to make exceptions to established policies when mitigating circumstances dictate, however, a corporate level tolerance has been established to keep exceptions at an acceptable level based upon portfolio and economic considerations.
Our credit risk management team uses risk models to evaluate consumer loans. These models, known as scorecards, forecast the probability of serious delinquency and default for an applicant. The scorecards are embedded in the application processing system, which allows for real-time scoring and automated decisions for many of our products. We periodically validate the loan scoring processes.
We maintain an active concentration management program to mitigate concentration risk in our credit portfolios. For individual obligors, we employ a sliding scale of exposure, known as hold limits, which is dictated by the type of loan and strength of the borrower. We also set and monitor industry concentration and correlation risk by setting appropriate limits and tolerances to achieve balanced and acceptable portfolio composition levels with our desired risk profile. We set, measure, and manage that risk consideration of both internal and external industry performance metrics, domestic and global economic data, and by allocating capital adequacy stress test supported capacity.
With highly uncertain economic conditions, we maintain diligent and vigilant portfolio monitoring activities in keeping with our credit risk framework. These activities include proactive higher risk portfolio segment detailed reviews. This allows us greater insight to support our credit loss guidance. All financial institutions will experience credit portfolio migration. Understanding and effectively managing these portfolios allow us to minimize ultimate economic loss, while supporting our fulsome relationship clients.
Allowance for loan and lease losses
We estimate the appropriate level of the ALLL on at least a quarterly basis. The methodology used is described in Note 1 (“Summary of Significant Accounting Policies”) under the heading “Allowance for Loan and Lease Losses” beginning on page 107 of our 2022 Form 10-K. Briefly, the ALLL estimate uses various models and estimation techniques based on our historical loss experience, current borrower characteristics, current economic conditions, reasonable and supportable forecasts, and other relevant factors. The ALLL at March 31, 2023, represents our best estimate of the lifetime expected credit losses inherent in the loan portfolio at that date.
As shown in Figure 25, our ALLL from continuing operations increased by $43 million, or 3.2%, from December 31, 2022. The commercial ALLL increased by $20 million, or 2.3%, from December 31, 2022, through March 31, 2023. Our consumer ALLL increased by $23 million, or 4.9%, from December 31, 2022, through March 31, 2023. Refer to Note 4 (“Asset Quality”) within this report for further discussion of changes in the ALLL.
Figure 25. Allocation of the Allowance for Loan and Lease Losses
| March 31, 2023 | December 31, 2022 | ||||||||||||||||||||||
| Dollars in millions | Amount | Percent of Allowance to Total Allowance | Percent of Loan Type to Total Loans | Amount | Percent of Allowance to Total Allowance | Percent of Loan Type to Total Loans | |||||||||||||||||
| Commercial and industrial | $ | 605 | 43.8 | % | 50.5 | % | $ | 601 | 45.0 | % | 50.0 | % | |||||||||||
| Commercial real estate: | |||||||||||||||||||||||
| Commercial mortgage | 218 | 15.8 | 13.6 | 203 | 15.2 | 13.7 | |||||||||||||||||
| Construction | 28 | 2.0 | 2.2 | 28 | 2.1 | 2.1 | |||||||||||||||||
| Total commercial real estate loans | 246 | 17.8 | 15.8 | 231 | 17.3 | 15.8 | |||||||||||||||||
| Commercial lease financing | 33 | 2.4 | 3.1 | 32 | 2.4 | 3.3 | |||||||||||||||||
| Total commercial loans | 884 | 64.0 | 69.4 | 864 | 64.7 | 69.1 | |||||||||||||||||
| Real estate — residential mortgage | 212 | 15.4 | 18.0 | 196 | 14.7 | 17.9 | |||||||||||||||||
| Home equity loans | 96 | 7.0 | 6.4 | 98 | 7.3 | 6.6 | |||||||||||||||||
| Consumer direct loans | 116 | 8.4 | 5.3 | 111 | 8.3 | 5.4 | |||||||||||||||||
| Credit cards | 71 | 5.1 | 0.8 | 66 | 4.9 | 0.9 | |||||||||||||||||
| Consumer indirect loans | 1 | 0.1 | 0.1 | 2 | 0.1 | 0.1 | |||||||||||||||||
| Total consumer loans | 496 | 36.0 | 30.6 | 473 | 35.3 | 30.9 | |||||||||||||||||
| Total ALLL — continuing operations (a) | $ | 1,380 | 100.0 | % | 100.0 | % | $ | 1,337 | 100.0 | % | 100.0 | % | |||||||||||
(a)Excludes allocations of the ALLL related to the discontinued operations of the education lending business in the amount of $19 million at March 31, 2023, and $21 million at December 31, 2022.
Net loan charge-offs
Figure 26 shows the trend in our net loan charge-offs by loan type, while the composition of loan charge-offs and recoveries by type of loan is presented in Figure 28. Figure 27 shows the ratios of net charge-offs by loan category as a percentage of the respective average loan balance.
Net loan charge-offs for the three months ended March 31, 2023, increased $12 million compared to the year-ago quarter.
Figure 26. Net Loan Charge-offs from Continuing Operations (a)
| 2023 | 2022 | |||||||||||||||||||
| Dollars in millions | First | Fourth | Third | Second | First | |||||||||||||||
| Commercial and industrial | $ | 27 | $ | 17 | $ | 36 | $ | 31 | $ | 19 | ||||||||||
| Real estate — Commercial mortgage | 5 | 12 | 1 | 2 | 3 | |||||||||||||||
| Real estate — Construction | — | — | — | (1) | — | |||||||||||||||
| Commercial lease financing | (2) | (2) | (1) | (1) | 2 | |||||||||||||||
| Total commercial loans | 30 | 27 | 36 | 31 | 24 | |||||||||||||||
| Real estate — Residential mortgage | (1) | (3) | — | (3) | (1) | |||||||||||||||
| Home equity loans | — | — | (1) | (1) | — | |||||||||||||||
| Consumer direct loans | 9 | 8 | 4 | 9 | 5 | |||||||||||||||
| Credit cards | 8 | 7 | 5 | 7 | 5 | |||||||||||||||
| Consumer indirect loans | (1) | 2 | (1) | 1 | — | |||||||||||||||
| Total consumer loans | 15 | 14 | 7 | 13 | 9 | |||||||||||||||
| Total net loan charge-offs | $ | 45 | $ | 41 | $ | 43 | $ | 44 | $ | 33 | ||||||||||
| Net loan charge-offs to average loans | .15 | % | .14 | % | .15 | % | .16 | % | .13 | % | ||||||||||
| Net loan charge-offs from discontinued operations — education lending business | $ | 1 | $ | 2 | $ | — | $ | — | $ | 2 |
(a)Credit amounts indicate that recoveries exceeded charge-offs.
Figure 27. Net Loan Charge-offs to Average Loans from Continuing Operations (a)
| 2023 | 2022 | |||||||||||||||||||
| Dollars in millions | First | Fourth | Third | Second | First | |||||||||||||||
| Commercial and industrial | 0.18 | % | 0.12 | % | 0.25 | % | 0.23 | % | 0.15 | % | ||||||||||
| Real estate — commercial mortgage | 0.12 | 0.29 | 0.02 | 0.05 | 0.08 | |||||||||||||||
| Real estate — construction | — | — | — | (0.19) | — | |||||||||||||||
| Commercial lease financing | (0.21) | (0.21) | (0.10) | (0.11) | 0.21 | |||||||||||||||
| Total commercial loans | 0.15 | 0.13 | 0.18 | 0.17 | 0.13 | |||||||||||||||
| Real estate — residential mortgage | (0.02) | (0.06) | — | (0.07) | (0.02) | |||||||||||||||
| Home equity loans | — | — | (0.05) | (0.05) | — | |||||||||||||||
| Consumer direct loans | 0.57 | 0.47 | 0.23 | 0.55 | 0.34 | |||||||||||||||
| Credit cards | 3.30 | 2.80 | 2.05 | 2.98 | 2.18 | |||||||||||||||
| Consumer indirect loans | (9.89) | 17.25 | (7.63) | 6.80 | — | |||||||||||||||
| Total consumer loans | 0.17 | 0.15 | 0.08 | 0.15 | 0.12 | |||||||||||||||
| Total net loan charge-offs | 0.15 | % | 0.14 | % | 0.15 | % | 0.16 | % | 0.13 | % | ||||||||||
(a)Credit amounts indicate that recoveries exceeded charge-offs.
Figure 28. Summary of Loan and Lease Loss Experience from Continuing Operations
| Three months ended March 31, | |||||||||||||||||
| Dollars in millions | 2023 | 2022 | |||||||||||||||
| Average loans outstanding | $ | 119,837 | $ | 103,762 | |||||||||||||
| Allowance for loan and lease losses at beginning of period | 1,337 | 1,061 | |||||||||||||||
| Loans charged off: | |||||||||||||||||
| Commercial and industrial | 35 | 30 | |||||||||||||||
| Real estate — commercial mortgage | 5 | 4 | |||||||||||||||
| Real estate — construction | — | — | |||||||||||||||
| Commercial lease financing | (1) | 2 | |||||||||||||||
| Total commercial loans | 39 | 36 | |||||||||||||||
| Real estate — residential mortgage | — | (1) | |||||||||||||||
| Home equity loans | 1 | 1 | |||||||||||||||
| Consumer direct loans | 11 | 7 | |||||||||||||||
| Credit cards | 9 | 7 | |||||||||||||||
| Consumer indirect loans | — | 1 | |||||||||||||||
| Total consumer loans | 21 | 15 | |||||||||||||||
| Total loans charged off | 60 | 51 | |||||||||||||||
| Recoveries: | |||||||||||||||||
| Commercial and industrial | 8 | 11 | |||||||||||||||
| Real estate — commercial mortgage | — | 1 | |||||||||||||||
| Real estate — construction | — | — | |||||||||||||||
| Commercial lease financing | 1 | — | |||||||||||||||
| Total commercial loans | 9 | 12 | |||||||||||||||
| Real estate — residential mortgage | 1 | — | |||||||||||||||
| Home equity loans | 1 | 1 | |||||||||||||||
| Consumer direct loans | 2 | 2 | |||||||||||||||
| Credit cards | 1 | 2 | |||||||||||||||
| Consumer indirect loans | 1 | 1 | |||||||||||||||
| Total consumer loans | 6 | 6 | |||||||||||||||
| Total recoveries | 15 | 18 | |||||||||||||||
| Net loan charge-offs | (45) | (33) | |||||||||||||||
| Provision (credit) for loan and lease losses | 88 | 77 | |||||||||||||||
| Allowance for loan and lease losses at end of period | $ | 1,380 | $ | 1,105 | |||||||||||||
| Liability for credit losses on off-balance sheet exposures at beginning of period | 225 | 160 | |||||||||||||||
| Provision (credit) for losses on off-balance sheet exposures | 51 | 6 | |||||||||||||||
| Liability for credit losses on off-balance sheet exposures at end of period(a) | $ | 276 | $ | 166 | |||||||||||||
| Total allowance for credit losses at end of period | $ | 1,656 | $ | 1,271 | |||||||||||||
| Net loan charge-offs to average total loans | .15 | % | .13 | % | |||||||||||||
| Allowance for loan and lease losses to period-end loans | 1.15 | 1.04 | |||||||||||||||
| Allowance for credit losses to period-end loans | 1.38 | 1.19 | |||||||||||||||
| Allowance for loan and lease losses to nonperforming loans | 331.7 | 251.7 | |||||||||||||||
| Allowance for credit losses to nonperforming loans | 398.1 | 289.5 | |||||||||||||||
| Discontinued operations — education lending business: | |||||||||||||||||
| Loans charged off | $ | 1 | $ | 2 | |||||||||||||
| Recoveries | — | — | |||||||||||||||
| Net loan charge-offs | $ | (1) | $ | (2) | |||||||||||||
(a)Included in "Accrued expense and other liabilities" on the balance sheet.
Nonperforming assets
Figure 29 shows the composition of our nonperforming assets. As shown in Figure 29, nonperforming assets at March 31, 2023, increased $27 million from December 31, 2022. This increase was primarily driven by two healthcare related loans suffering from lingering pandemic impacts.
See Note 1 (“Summary of Significant Accounting Policies”) of our 2022 Form 10-K under the headings “Nonperforming Loans,” “Impaired Loans,” and “Allowance for Loan and Lease Losses” for a summary of our nonaccrual and charge-off policies.
Figure 29. Summary of Nonperforming Assets and Past Due Loans from Continuing Operations
| Dollars in millions | March 31, 2023 | December 31, 2022 | September 30, 2022 | June 30, 2022 | March 31, 2022 | ||||||||||||
| Commercial and industrial | $ | 170 | $ | 174 | $ | 169 | $ | 197 | $ | 186 | |||||||
| Real estate — commercial mortgage | 59 | 21 | 34 | 35 | 40 | ||||||||||||
| Real estate — construction | — | — | — | — | — | ||||||||||||
| Total commercial real estate loans (a) | 59 | 21 | 34 | 35 | 40 | ||||||||||||
| Commercial lease financing | 1 | 1 | 2 | 2 | 3 | ||||||||||||
| Total commercial loans (b) | 230 | 196 | 205 | 234 | 229 | ||||||||||||
| Real estate — residential mortgage | 75 | 77 | 66 | 67 | 73 | ||||||||||||
| Home equity loans | 104 | 107 | 112 | 120 | 129 | ||||||||||||
| Consumer direct loans | 3 | 3 | 3 | 3 | 4 | ||||||||||||
| Credit cards | 3 | 3 | 3 | 3 | 3 | ||||||||||||
| Consumer indirect loans | 1 | 1 | 1 | 2 | 1 | ||||||||||||
| Total consumer loans | 186 | 191 | 185 | 195 | 210 | ||||||||||||
| Total nonperforming loans (c) | 416 | 387 | 390 | 429 | 439 | ||||||||||||
| OREO | 13 | 13 | 12 | 9 | 8 | ||||||||||||
| Nonperforming loans held for sale | 18 | 20 | 17 | 25 | 20 | ||||||||||||
| Other nonperforming assets | — | — | — | — | — | ||||||||||||
| Total nonperforming assets | $ | 447 | $ | 420 | $ | 419 | $ | 463 | $ | 467 | |||||||
| Accruing loans past due 90 days or more | $ | 55 | $ | 60 | $ | 47 | $ | 41 | $ | 55 | |||||||
| Accruing loans past due 30 through 89 days | 164 | 180 | 187 | 137 | 122 | ||||||||||||
| Nonperforming assets from discontinued operations — education lending business | 3 | 3 | 3 | 3 | 4 | ||||||||||||
| Nonperforming loans to period-end portfolio loans | .35 | % | .32 | % | .34 | % | .38 | % | .41 | % | |||||||
| Nonperforming assets to period-end portfolio loans plus OREO and other nonperforming assets | .37 | .35 | .36 | .41 | .44 |
(a)See Figure 9 and the accompanying discussion in the “Loans and loans held for sale” section for more information related to our commercial real estate loan portfolio.
(b)See Figure 8 and the accompanying discussion in the “Loans and loans held for sale” section for more information related to our commercial loan portfolio.
(c)On January 1, 2023, Key adopted ASU 2022-02 Financial Instruments - Credit Losses (Topic 326): Troubled Debt Restructurings and Vintage Disclosures. In connection with the adoption of this guidance, nonperforming loans as of March 31, 2023, includes certain loans which were modified for borrowers experiencing financial difficulty. Prior period amounts included nonperforming troubled debt restructurings (TDRs), for which accounting guidance was eliminated upon adoption of ASU 2022-02 on January 1, 2023. See Note 1 (“Basis of Presentation and Accounting Policies”) of this report for more information on Key’s adoption of this ASU.
Figure 30 shows the types of activity that caused the change in our nonperforming loan balance during each of the last five quarters.
Figure 30. Summary of Changes in Nonperforming Loans from Continuing Operations
| 2023 | 2022 | |||||||||||||||||||
| Dollars in millions | First | Fourth | Third | Second | First | |||||||||||||||
| Balance at beginning of period | $ | 387 | $ | 390 | $ | 429 | $ | 439 | $ | 454 | ||||||||||
| Loans placed on nonaccrual status | 143 | 113 | 80 | 118 | 87 | |||||||||||||||
| Charge-offs | (60) | (67) | (68) | (59) | (50) | |||||||||||||||
| Loans sold | (2) | (4) | (3) | (8) | — | |||||||||||||||
| Payments | (31) | (22) | (29) | (35) | (27) | |||||||||||||||
| Transfers to OREO | (2) | (1) | (1) | (2) | (1) | |||||||||||||||
| Loans returned to accrual status | (19) | (22) | (18) | (24) | (24) | |||||||||||||||
| Balance at end of period | $ | 416 | $ | 387 | $ | 390 | $ | 429 | $ | 439 | ||||||||||
Operational and compliance risk management
Like all businesses, we are subject to operational risk, which is the risk of loss resulting from human error or malfeasance, inadequate or failed internal processes and systems, and external events. These events include, among other things, threats to our cybersecurity, as we are reliant upon information systems and the Internet to conduct our business activities. Operational risk intersects with compliance risk, which is the risk of loss from violations of, or noncompliance with, laws, rules and regulations, prescribed practices, and ethical standards. Under the Dodd-Frank Act, large financial companies like Key are subject to heightened prudential standards and regulation. This heightened level of regulation has increased our operational risk. While operational and compliance risk are separate risk disciplines in KeyCorp’s ERM framework, losses and/or additional regulatory compliance costs are included in operational loss reporting and could take the form of explicit charges, increased operational costs, harm to our reputation, or foregone opportunities.
We seek to mitigate operational risk through identification and measurement of risk, alignment of business strategies with risk appetite and tolerance, and a system of internal controls and reporting. We continuously strive to strengthen our system of internal controls to improve the oversight of our operational risk and to ensure compliance with laws, rules, and regulations. For example, an operational event database tracks the amounts and sources of operational risk and losses. This tracking mechanism helps to identify weaknesses and to highlight the need to take corrective action. We also rely upon software programs designed to assist in assessing operational risk and monitoring our control processes. This technology has enhanced the reporting of the effectiveness of our controls to senior management and the Board.
The Operational Risk Management Program provides the framework for the structure, governance, roles, and responsibilities, as well as the content, to manage operational risk for Key. The Compliance Risk Management Program serves the same function in managing compliance risk for Key. The Operational Risk Committee and the Compliance Risk Committee support the ERM Committee by identifying early warning events and trends, escalating emerging risks, and discussing forward-looking assessments. Both the Operational Risk Committee and the Compliance Risk Committee include attendees from each of the Three Lines of Defense. Primary responsibility for managing and monitoring internal control mechanisms lies with the managers of our various lines of business. The Operational Risk Committee and Compliance Risk Committee are senior management committees that oversee our level of operational and compliance risk and direct and support our operational and compliance infrastructure and related activities. These committees and the Operational Risk Management and Compliance Risk Management functions are an integral part of our ERM Program. Our Risk Review function regularly assesses the overall effectiveness of our Operational Risk Management and Compliance Risk Management Programs and our system of internal controls. Risk Review reports the results of reviews on internal controls and systems to senior management and the Audit Committee and updates the Risk Committee, as appropriate, on matters related to the oversight of these controls.
Cybersecurity
We maintain comprehensive Cyber Incident Response Plans, and we devote significant time and resources to maintaining and regularly updating our technology systems and processes to protect the security of our computer systems, software, networks, and other technology assets against attempts to obtain unauthorized access to confidential information, destroy data, disrupt or degrade service, sabotage systems, shut down access to systems for ransom, or cause other damage. As the threat landscape continues to evolve, critical infrastructure, including financial services, remains a top target for cyberattacks. The remote work environment utilized by our employees and our third-party service providers inherently introduces additional risk. Additionally, we face heightened risk of cyberattacks in the near term because of recent geopolitical events, which may result in increased attacks against U.S. critical infrastructure, including financial institutions. Cyberattacks may include, but are not limited to, attacks that are intended to disrupt or disable banking services and prevent banking transactions, attempts to breach the security of systems and data, and social engineering attempts aimed at tricking employees and clients into providing sensitive information or executing financial transactions.
We also face cyberattack risks related to our third-party service providers. Cyberattacks successfully compromising or circumventing the security of the systems of our third-party service providers have resulted in, and could again in the future result in, negative consequences to us, including interfering with our third-party providers’ ability to fulfill their contractual obligations to us, an interruption in our business processes, or the disclosure or misappropriation of confidential information of us or that of our clients. These cyberattacks may result in regulatory consequences, reputational harm or financial loss or liability that could adversely affect our financial condition or results of
operations. High-profile cyberattacks have targeted retailers, credit bureaus, and other businesses for the purpose of acquiring the confidential information (including personal, financial, and credit card information) of their customers. There have also been numerous highly publicized cases where hackers requested ransom payments in exchange for not disclosing customer information or to restore company access to locked systems. We have incurred, and may again incur, expenses related to the investigation of cyberattacks involving third-party providers or related to the protection of our clients from identity theft as a result of such attacks. We have also incurred, and may continue to incur, expenses to enhance our systems or processes to protect against cyber or other security incidents.
Risks and exposures related to cyberattacks are expected to remain high for the foreseeable future due to the rapidly evolving nature and sophistication of these threats, as well as due to the expanding use of Internet banking, mobile banking, and other technology-based products and services by us and our clients. To date, Key has not experienced material disruption of our operations, or material harm to our client base, as a result of the heightened threat landscape of cyberattacks.
As described in more detail starting on page 72 of our 2022 Form 10-K under the heading “Risk Management — Overview,” the Board serves in an oversight capacity ensuring that Key’s risks are managed in a manner that is effective and balanced and adds value for the shareholders. The Board’s Risk Committee has primary oversight for enterprise-wide risk at KeyCorp, including operational risk (which includes cybersecurity). The Risk Committee reviews and provides oversight of management’s activities related to the enterprise-wide risk management framework, including cyber-related risk. Board members are updated on cybersecurity matters at each regularly-scheduled Board meeting. The ERM Committee, chaired by the Chief Executive Officer and comprising other senior level executives, is responsible for managing risk (including cyber-related risk) and ensuring that the corporate risk profile is managed in a manner consistent with our risk appetite. The ERM Committee reports to the Board’s Risk Committee.
GAAP to Non-GAAP Reconciliations
Non-GAAP financial measures have inherent limitations, are not required to be uniformly applied, and are not
audited. Although these non-GAAP financial measures are frequently used by investors to evaluate a company,
they have limitations as analytical tools, and should not be considered in isolation, nor as a substitute for analyses
of results as reported under GAAP.
The tangible common equity ratio and the return on tangible common equity ratio have been a focus for some investors, and management believes that these ratios may assist investors in analyzing Key’s capital position without regard to the effects of intangible assets and preferred stock. Since analysts and banking regulators may assess our capital adequacy using tangible common equity, we believe it is useful to enable investors to assess our capital adequacy on these same bases.
| Three months ended | |||||||||||||||||||||||||||||
| Dollars in millions | 3/31/2023 | 12/31/2022 | 9/30/2022 | 6/30/2022 | 3/31/2022 | ||||||||||||||||||||||||
| Tangible common equity to tangible assets at period-end | |||||||||||||||||||||||||||||
| Key shareholders’ equity (GAAP) | $ | 14,322 | $ | 13,454 | $ | 13,290 | $ | 14,427 | $ | 15,308 | |||||||||||||||||||
| Less: | Intangible assets (a) | 2,836 | 2,844 | 2,856 | 2,868 | 2,810 | |||||||||||||||||||||||
| Preferred Stock (b) | 2,446 | 2,446 | 2,446 | 1,856 | 1,856 | ||||||||||||||||||||||||
| Tangible common equity (non-GAAP) | $ | 9,040 | $ | 8,164 | $ | 7,988 | $ | 9,703 | $ | 10,642 | |||||||||||||||||||
| Total assets (GAAP) | $ | 197,519 | $ | 189,813 | $ | 190,051 | $ | 187,008 | $ | 181,221 | |||||||||||||||||||
| Less: | Intangible assets (a) | 2,836 | 2,844 | 2,856 | 2,868 | 2,810 | |||||||||||||||||||||||
| Tangible assets (non-GAAP) | $ | 194,683 | $ | 186,969 | $ | 187,195 | $ | 184,140 | $ | 178,411 | |||||||||||||||||||
| Tangible common equity to tangible assets ratio (non-GAAP) | 4.6 | % | 4.4 | % | 4.3 | % | 5.3 | % | 6.0 | % | |||||||||||||||||||
| Average tangible common equity | |||||||||||||||||||||||||||||
| Average Key shareholders’ equity (GAAP) | $ | 13,817 | $ | 13,168 | $ | 14,614 | $ | 14,398 | $ | 16,780 | |||||||||||||||||||
| Less: | Intangible assets (average) (c) | 2,841 | 2,851 | 2,863 | 2,827 | 2,814 | |||||||||||||||||||||||
| Preferred Stock (average) | 2,500 | 2,500 | 2,148 | 1,900 | 1,900 | ||||||||||||||||||||||||
| Average tangible common equity (non-GAAP) | $ | 8,476 | $ | 7,817 | $ | 9,603 | $ | 9,671 | $ | 12,066 | |||||||||||||||||||
| Return on average tangible common equity from continuing operations | |||||||||||||||||||||||||||||
| Net income (loss) from continuing operations attributable to Key common shareholders (GAAP) | $ | 275 | $ | 356 | $ | 513 | $ | 504 | $ | 420 | |||||||||||||||||||
| Average tangible common equity (non-GAAP) | 8,476 | 7,817 | 9,603 | 9,671 | 12,066 | ||||||||||||||||||||||||
| Return on average tangible common equity from continuing operations (non-GAAP) | 13.2 | % | 18.1 | % | 21.2 | % | 20.9 | % | 14.1 | % | |||||||||||||||||||
| Return on average tangible common equity consolidated | |||||||||||||||||||||||||||||
| Net income (loss) attributable to Key common shareholders (GAAP) | $ | 276 | $ | 356 | $ | 515 | $ | 507 | $ | 421 | |||||||||||||||||||
| Average tangible common equity (non-GAAP) | 8,476 | 7,817 | 9,603 | 9,671 | 12,066 | ||||||||||||||||||||||||
| Return on average tangible common equity consolidated (non-GAAP) | 13.2 | % | 18.1 | % | 21.3 | % | 21.0 | % | 14.2 | % |
(a)For the three months ended March 31, 2023, December 31, 2022, September 30, 2022, June 30, 2022, and March 31, 2022, intangible assets exclude $1 million, $2 million, $2 million, $2 million, and $2 million, respectively, of period-end purchased credit card receivables.
(b)Net of capital surplus.
(c)For the three months ended March 31, 2023, December 31, 2022, September 30, 2022, June 30, 2022, and March 31, 2022, average intangible assets exclude $1 million, $2 million, $2 million, $2 million, and $3 million, respectively, of average purchased credit card receivables.
The cash efficiency ratio is a ratio of two non-GAAP performance measures, adjusted noninterest expense and total taxable-equivalent revenue. Accordingly, there is no directly comparable GAAP performance measure. The cash efficiency ratio excludes the impact of our intangible asset amortization from the calculation. We believe this ratio provides greater consistency and comparability between our results and those of our peer banks. Additionally, this ratio is used by analysts and investors to evaluate how effectively management is controlling noninterest expenses in generating revenue, as they develop earnings forecasts and peer bank analysis.
| Three months ended | |||||||||||||||||||||||||||||
| Dollars in millions | 3/31/2023 | 12/31/2022 | 9/30/2022 | 6/30/2022 | 3/31/2022 | ||||||||||||||||||||||||
| Cash efficiency ratio | |||||||||||||||||||||||||||||
| Noninterest expense (GAAP) | $ | 1,176 | $ | 1,156 | $ | 1,106 | $ | 1,078 | $ | 1,070 | |||||||||||||||||||
| Less: | Intangible asset amortization | 10 | 12 | 12 | 12 | 11 | |||||||||||||||||||||||
| Adjusted noninterest expense (non-GAAP) | $ | 1,166 | $ | 1,144 | $ | 1,094 | $ | 1,066 | $ | 1,059 | |||||||||||||||||||
| Net interest income (GAAP) | $ | 1,099 | $ | 1,220 | $ | 1,196 | $ | 1,097 | $ | 1,014 | |||||||||||||||||||
| Plus: | Taxable-equivalent adjustment | 7 | 7 | 7 | 7 | 6 | |||||||||||||||||||||||
| Noninterest income (GAAP) | 608 | 671 | 683 | 688 | 676 | ||||||||||||||||||||||||
| Total taxable-equivalent revenue (non-GAAP) | $ | 1,714 | $ | 1,898 | $ | 1,886 | $ | 1,792 | $ | 1,696 | |||||||||||||||||||
| Cash efficiency ratio (non-GAAP) | 68.0 | % | 60.3 | % | 58.0 | % | 59.5 | % | 62.4 | % |
Critical Accounting Policies and Estimates
Our business is dynamic and complex. Consequently, we must exercise judgment in choosing and applying accounting policies and methodologies. These choices are critical – not only are they necessary to comply with GAAP, they also reflect our view of the appropriate way to record and report our overall financial performance. All accounting policies are important, and all policies described in Note 1 (“Summary of Significant Accounting Policies”) beginning on page 105 of our 2022 Form 10-K should be reviewed for a greater understanding of how we record and report our financial performance. Note 1 (“Basis of Presentation and Accounting Policies”) of this report should also be reviewed for more information on accounting standards that have been adopted during the period.
In our opinion, some accounting policies are more likely than others to have a critical effect on our financial results and to expose those results to potentially greater volatility. These policies apply to areas of relatively greater business importance or require us to exercise judgment and to make assumptions and estimates that affect amounts reported in the financial statements. Because these assumptions and estimates are based on current circumstances, they may prove to be inaccurate, or we may find it necessary to change them.
We rely heavily on the use of judgment, assumptions, and estimates to make a number of core decisions, including accounting for the ALLL; contingent liabilities, guarantees and income taxes; derivatives and related hedging activities; and assets and liabilities that involve valuation methodologies. In addition, we may employ outside valuation experts to assist us in determining fair values of certain assets and liabilities. A brief discussion of each of these areas appears on pages 92 through 94 of our 2022 Form 10-K. During the three months ended March 31, 2023, we did not significantly alter the manner in which we applied our critical accounting policies or developed related assumptions and estimates.
Accounting and Reporting Developments
Accounting Guidance Pending Adoption at March 31, 2023
| Standard | Required Adoption | Description | Effect on Financial Statements or Other Significant Matters | ||||||||
| ASU 2022-03, Fair Value Measurement - Fair Value Measurement of Equity Securities Subject to Contractual Sale Restrictions (Topic 820) | January 1, 2024 Early adoption is permitted. | The amendments clarify that a contractual restriction on the sale of an equity security is not considered part of the unit of account of the equity security and is not considered in measuring fair value. Entities cannot, as a separate unit of account, recognize and measure a contractual sale restriction. The amendments require disclosures for equity securities subject to contractual restrictions including; the fair value of equity securities subject to contractual sale restrictions reflected in the balance sheet, the nature and remaining duration of the restriction(s) and the circumstances that could cause a lapse in the restriction(s). The guidance should be applied prospectively with any adjustments from the adoption of the amendments recognized in earnings and disclosed on the date of adoption. | The guidance is not expected to have a material impact on Key’s financial condition or results of operations. | ||||||||
| ASU 2023-02, Investments—Equity Method and Joint Ventures (Topic 323) | January 1, 2024 Early adoption is permitted. | Reporting entities may elect to account for their tax equity investments, not limited to LIHTC structures, using the proportional amortization method as long as certain criteria are met. Entities must make an accounting policy election to apply the proportional amortization method on a tax-credit-program-by-tax-credit-program basis. Also, LIHTC investments not accounted for using the proportional amortization method will no longer be allowed to use the delayed equity contribution guidance. Further, accounting guidance in ASC 323-740 is now only applicable to tax equity investments accounted for using the proportional amortization method. The guidance should be applied on a modified retrospective or retrospective basis. | The guidance is not expected to have a material impact on Key’s financial condition or results of operations. |
Previous: Cover and table of contents · Next: Item 1. Financial Statements