 filings.tools
Item 5. Market for Registrant's Common Equity, Related Stockholder Matters and Issuer Purchases of Equity Securities.
5K characters. Original on sec.gov · Markdown
Item 5. Market for Registrant's Common Equity, Related Stockholder Matters and Issuer Purchases of Equity Securities.
Our common stock is listed on NASDAQ under the ticker symbol “KHC”. At February 10, 2018, there were approximately 53,000 holders of record of our common stock.
Our stock began publicly trading on July 6, 2015. Our quarterly highest and lowest market prices and dividends declared are:
| 2017 Quarters | 2016 Quarters | ||||||||||||||||||||||||||||||
| First | Second | Third | Fourth | First | Second | Third | Fourth | ||||||||||||||||||||||||
| Market price-high | $ | 97.77 | $ | 93.88 | $ | 90.38 | $ | 82.48 | $ | 79.16 | $ | 89.40 | $ | 90.54 | $ | 90.15 | |||||||||||||||
| Market price-low | 85.41 | 85.45 | 77.40 | 75.21 | 68.18 | 76.64 | 84.25 | 79.69 | |||||||||||||||||||||||
| Dividends declared | 0.60 | 0.60 | 0.625 | 0.625 | 0.575 | 0.575 | 0.60 | 0.60 |
Comparison of Cumulative Total Return
The following graph compares the cumulative total return on our common stock with the cumulative total return of the Standard & Poor's (“S&P”) 500 Index and the S&P Consumer Staples Food Products, which we consider to be our peer group. This graph covers the period from July 6, 2015 (the first day our common stock began trading on NASDAQ) through December 29, 2017 (the last trading day of our fiscal year). The graph shows total shareholder return assuming $100 was invested on July 6, 2015 and the dividends were reinvested on a daily basis.
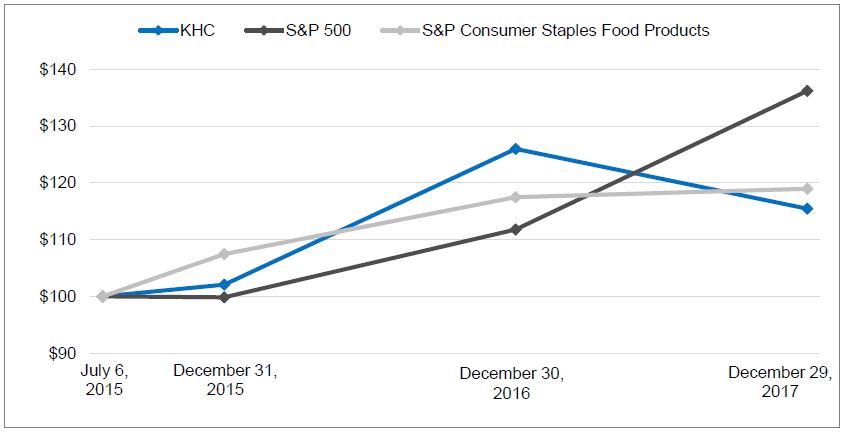
| Kraft Heinz | S&P 500 | S&P Consumer Staples Food Products | |||||||||
| July 6, 2015 | $ | 100.00 | $ | 100.00 | $ | 100.00 | |||||
| December 31, 2015 | 102.07 | 99.85 | 107.48 | ||||||||
| December 30, 2016 | 125.99 | 111.79 | 117.49 | ||||||||
| December 29, 2017 | 115.44 | 136.20 | 118.95 |
Companies included in the S&P Consumer Staples Food Products index change periodically. During 2017, Mead Johnson Nutrition Company was removed from the index, therefore it is excluded from the table and chart above.
The above performance graph shall not be deemed to be “soliciting material” or to be “filed” with the SEC or subject to Regulation 14A or 14C, or to the liabilities of Section 18 of the Exchange Act.
Issuer Purchases of Equity Securities During the Three Months Ended December 30, 2017
Our share repurchase activity in the three months ended December 30, 2017 was:
| Total Number of Shares(a) | Average Price Paid Per Share | Total Number of Shares Purchased as Part of Publicly Announced Plans or Programs(b) | Dollar Value of Shares that May Yet Be Purchased Under the Plans or Programs | |||||||||||
| 10/1/2017 - 11/4/2017 | 648 | $ | 77.25 | — | $ | — | ||||||||
| 11/5/2017 - 12/2/2017 | — | — | — | — | ||||||||||
| 12/3/2017 - 12/30/2017 | 1,428 | 80.46 | — | — | ||||||||||
| For the Three Months Ended December 30, 2017 | 2,076 | — |
| (a) | Includes the following types of share repurchase activity, when they occur: (1) shares repurchased in connection with the exercise of stock options (including periodic repurchases using option exercise proceeds), (2) shares withheld for tax liabilities associated with the vesting of RSUs, and (3) shares repurchased related to employee benefit programs (including our annual bonus swap program) or to offset the dilutive effect of equity issuances. |
| (b) | We do not have any publicly announced share repurchase plans or programs. |
Previous: Item 4. Mine Safety Disclosures. · Next: Item 6. Selected Financial Data.