 filings.tools
Item 7. Management's Discussion and Analysis of Financial Condition and Results of Operations
93K characters. Original on sec.gov · Markdown
Item 7. Management's Discussion and Analysis of Financial Condition and Results of Operations
The following discussion should be read in conjunction with the Consolidated Financial Statements and Notes thereto included in this Form 10-K. Historical results and percentage relationships set forth in the Consolidated Statements of Income contained in the Consolidated Financial Statements, including trends, should not be taken as indicative of future operations.
Executive Summary
Kimco Realty Corporation is one of the nation’s largest publicly-traded owners and operators of open-air shopping centers. As of December 31, 2016, the Company had interests in 525 shopping center properties aggregating 85.4 million square feet of GLA located in 34 states, Puerto Rico and Canada. In addition, the Company had 384 other property interests, primarily through the Company’s preferred equity investments and other real estate investments, totaling 6.3 million square feet of GLA.
The executive officers are engaged in the day-to-day management and operation of real estate exclusively with the Company, with nearly all operating functions, including leasing, asset management, maintenance, construction, legal, finance and accounting, administered by the Company.
The Company’s strategy is to be the premier owner and operator of open-air shopping centers through investments primarily in the U.S. To achieve this strategy the Company is (i) continuing to transform the quality of its portfolio by disposing of lesser quality assets and acquiring larger higher quality properties in key markets identified by the Company, for which substantial progress has been achieved as of the end of 2016, (ii) simplifying its business by: (a) reducing the number of joint venture investments and (b) exiting Mexico, South America and Canada, for which the exit of South America has been completed, Mexico has been substantially completed and the Company essentially sold all operating properties in Canada, (iii) pursuing redevelopment opportunities within its portfolio to increase overall value and (iv) selectively acquiring land parcels in our key markets for real estate development projects for long-term investment. As part of the Company’s strategy each property is evaluated for its highest and best use, which may include residential and mixed-use components. In addition, the Company may consider other opportunistic investments related to retailer controlled real estate such as, repositioning underperforming retail locations, retail real estate financing and bankruptcy transaction support. The Company has an active capital recycling program which provides for the disposition of certain U.S. properties. If the Company accepts sales prices for any of these assets that are less than their net carrying values, the Company would be required to take impairment charges and such amounts could be material. In order to execute the Company’s strategy, the Company intends to continue to strengthen its balance sheet by pursuing deleveraging efforts over time, providing it the necessary flexibility to invest opportunistically and selectively, primarily focusing on U.S. open-air shopping centers.
The following highlights the Company’s significant transactions, events and results that occurred during the year ended December 31, 2016:
Financial and Portfolio Information:
| ● | Net income available to common shareholders was $332.6 million, or $0.79 per diluted share for the year ended December 31, 2016, as compared to $831.2 million, or $2.00 per diluted share for the corresponding period in 2015. This change was primarily attributable to lower gains on sales of operating properties (including joint ventures) of $378.9 million, net of tax and $49.9 million of higher impairments attributable to the sale or pending disposition of operating properties in 2016 (see “Results of Operations” for additional detail). |
|---|
| ● | Funds from operations (“FFO”) decreased to $555.7 million or $1.32 per diluted share for the year ended December 31, 2016 from $643.2 million or $1.56 per diluted share for the year ended December 31, 2015, (see additional disclosure on FFO beginning on page 30). |
|---|
| ● | FFO as adjusted increased to $629.4 million or $1.50 per diluted share for the year ended December 31, 2016 from $603.4 million or $1.46 per diluted share for the year ended December 31, 2015, (see additional disclosure on FFO beginning on page 30). |
|---|
| ● | U.S. same property net operating income (“U.S. same property NOI”) increased 2.8% for the year ended December 31, 2016, as compared to the corresponding period in 2015 (see additional disclosure on U.S. same property NOI beginning on page 32). |
|---|
| ● | Executed 935 new leases, renewals and options totaling approximately 6.8 million square feet in the Consolidated Operating Portfolio. |
|---|
| ● | The Company’s consolidated operating portfolio occupancy at December 31, 2016 was 95.2%. |
|---|
Acquisition Activity (see Footnotes 3, 4 and 8 of the Notes to Consolidated Financial Statements included in this Form 10-K):
| ● | Acquired 12 consolidated operating properties and two out-parcels comprising an aggregate 2.7 million square feet of GLA, for an aggregate purchase price of $645.6 million including the assumption of $284.7 million of non-recourse mortgage debt encumbering 10 of the properties. The Company acquired nine of these properties for an aggregate purchase price of $505.9 million from joint ventures in which the Company previously held noncontrolling ownership interests and recognized an aggregate gain on change in control of interests of $57.4 million from the fair value adjustment. |
|---|
| ● | The Company acquired from its partner the remaining ownership interest in a development project that was held in a joint venture for a gross purchase price of $84.2 million. Additionally, during the year ended December 31, 2016, the Company acquired additional land parcels related to two existing development projects for $13.8 million. |
|---|
Disposition Activity (see Footnote 5 of the Notes to Consolidated Financial Statements included in this Form 10-K):
| ● | During 2016, the Company disposed of 30 consolidated operating properties and two out-parcels, in separate transactions, for an aggregate sales price of $378.7 million. These transactions resulted in (i) an aggregate gain of $86.8 million, after income tax expense, and (ii) aggregate impairment charges of $37.2 million, which were taken prior to sale, before income tax benefit of $10.0 million. |
|---|
Capital Activity (for additional details see Liquidity and Capital Resources below):
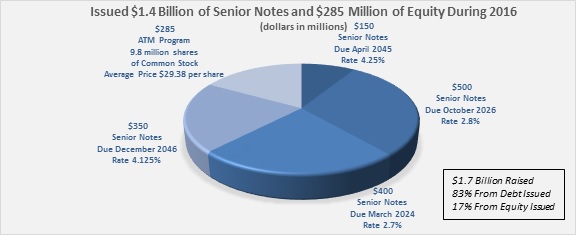 |
|---|
During the years ended December 31, 2016 and 2015, the Company repaid the following notes (dollars in millions):
| Type | Date Paid | Maturity Date | Amount Repaid (USD) | Interest Rate | |||||||||
|---|---|---|---|---|---|---|---|---|---|---|---|---|---|
| Canadian Notes Payable | Aug-16 | Apr-18 | - | Aug-20 | $ | 270.9 | 3.855% | - | 5.99% | ||||
| Senior Unsecured Note | Aug-16 | May-17 | $ | 290.9 | 5.70% | ||||||||
| Medium Term Notes | Mar-16 | Mar-16 | $ | 300.0 | 5.783% |
Also during 2016, the Company (i) repaid $400.0 million of the Company’s $650.0 million unsecured term loan, (ii) assumed $289.0 million of individual non-recourse mortgage debt relating to the acquisition of 10 properties, including $4.3 million associated with fair value debt adjustments, (iii) paid off $703.0 million of mortgage debt (including fair value of debt adjustment of $2.1 million) that encumbered 47 operating properties and (iv) disposed of an encumbered property through foreclosure with debt of $25.6 million (including fair value of debt adjustment of $0.4 million) .
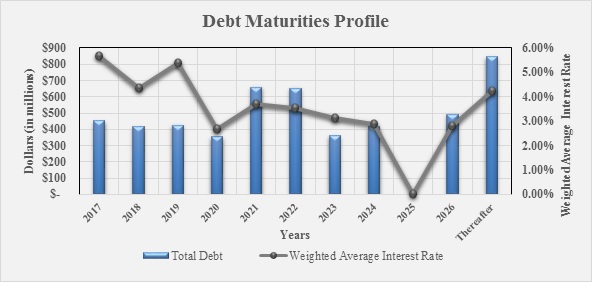
As a result of the above activity the Company was able to extend its debt maturity profile, including extension options, as of December 31, 2016 as follows:
 |
|---|
Critical Accounting Policies
The Consolidated Financial Statements of the Company include the accounts of the Company, its wholly-owned subsidiaries and all entities in which the Company has a controlling interest, including where the Company has been determined to be a primary beneficiary of a variable interest entity in accordance with the consolidation guidance of the FASB Accounting Standards Codification (“ASC”). The Company applies these provisions to each of its joint venture investments to determine whether the cost, equity or consolidation method of accounting is appropriate. The preparation of financial statements in conformity with accounting principles generally accepted in the United States requires management to make estimates and assumptions in certain circumstances that affect amounts reported in the accompanying Consolidated Financial Statements and related notes. In preparing these financial statements, management has made its best estimates and assumptions that affect the reported amounts of assets and liabilities. These estimates are based on, but not limited to, historical results, industry standards and current economic conditions, giving due consideration to materiality. The most significant assumptions and estimates relate to revenue recognition and the recoverability of trade accounts receivable, depreciable lives, valuation of real estate and intangible assets and liabilities, valuation of joint venture investments and other investments, realizability of deferred tax assets and uncertain tax positions. Application of these assumptions requires the exercise of judgment as to future uncertainties, and, as a result, actual results could materially differ from these estimates.
The Company is required to make subjective assessments as to whether there are impairments in the value of its real estate properties, investments in joint ventures, marketable securities and other investments. The Company’s reported net earnings are directly affected by management’s estimate of impairments and/or valuation allowances.
Revenue Recognition and Accounts Receivable
Base rental revenues from rental properties are recognized on a straight-line basis over the terms of the related leases. Certain of these leases also provide for percentage rents based upon the level of sales achieved by the lessee. These percentage rents are recorded once the required sales level is achieved. Operating expense reimbursements are recognized as earned. Rental income may also include payments received in connection with lease termination agreements. In addition, leases typically provide for reimbursement to the Company of common area maintenance, real estate taxes and other operating expenses.
The Company makes estimates of the uncollectability of its accounts receivable related to base rents, straight-line rent, expense reimbursements and other revenues. The Company analyzes accounts receivable and historical bad debt levels, customer credit-worthiness and current economic trends when evaluating the adequacy of the allowance for doubtful accounts. In addition, tenants in bankruptcy are analyzed and estimates are made in connection with the expected recovery of pre-petition and post-petition claims. The Company’s reported net earnings are directly affected by management’s estimate of the collectability of accounts receivable.
Real Estate
The Company’s investments in real estate properties are stated at cost, less accumulated depreciation and amortization. Expenditures for maintenance and repairs are charged to operations as incurred. Significant renovations and replacements, which improve and extend the life of the asset, are capitalized.
Upon acquisition of real estate operating properties, the Company estimates the fair value of acquired tangible assets (consisting of land, building, building improvements and tenant improvements) and identified intangible assets and liabilities (consisting of above and below-market leases, in-place leases and tenant relationships, where applicable), assumed debt and redeemable units issued at the date of acquisition, based on evaluation of information and estimates available at that date. Fair value is determined based on an exit price approach, which contemplates the price that would be received to sell an asset or paid to transfer a liability in an orderly transaction between market participants at the measurement date. If, up to one year from the acquisition date, information regarding fair value of the assets acquired and liabilities assumed is received and estimates are refined, appropriate adjustments are recognized in the reporting period in which the adjustment is identified. The Company expenses transaction costs associated with business combinations in the period incurred. The Company has elected to early adopt ASU 2017-01, Business Combinations (Topic 805): Clarifying the Definition of a Business at the beginning of its fiscal year ended December 31, 2017, including its interim periods within the year, and will appropriately apply the guidance to its prospective asset acquisitions of operating properties, which includes the capitalization of acquisition costs.
Depreciation and amortization are provided on the straight-line method over the estimated useful lives of the assets, as follows:
| Buildings and building improvements (in years) | 15 to 50 | |
|---|---|---|
| Fixtures, leasehold and tenant improvements | Terms of leases or useful | |
| (including certain identified intangible assets) | lives, whichever is shorter |
The Company is required to make subjective assessments as to the useful lives of its properties for purposes of determining the amount of depreciation to reflect on an annual basis with respect to those properties. These assessments have a direct impact on the Company’s net earnings.
On a continuous basis, management assesses whether there are any indicators, including property operating performance, changes in anticipated holding period and general market conditions, that the value of the real estate properties (including any related amortizable intangible assets or liabilities) may be impaired. A property value is considered impaired only if management’s estimate of current and projected operating cash flows (undiscounted and unleveraged) of the property over its anticipated hold period is less than the net carrying value of the property. Such cash flow projections consider factors such as expected future operating income, trends and prospects, as well as the effects of demand, competition and other factors. To the extent impairment has occurred, the carrying value of the property would be adjusted to reflect the estimated fair value of the property.
When a real estate asset is identified by management as held-for-sale, the Company ceases depreciation of the asset and estimates the sales price of such asset net of selling costs. If, in management’s opinion, the net sales price of the asset is less than the net book value of such asset, an adjustment to the carrying value would be recorded to reflect the estimated fair value of the property.
Investments in Unconsolidated Joint Ventures
The Company accounts for its investments in unconsolidated joint ventures under the equity method of accounting as the Company exercises significant influence, but does not control, these entities. These investments are recorded initially at cost and are subsequently adjusted for cash contributions and distributions. Earnings for each investment are recognized in accordance with each respective investment agreement and, where applicable, are based upon an allocation of the investment’s net assets at book value as if the investment was hypothetically liquidated at the end of each reporting period.
The Company’s joint ventures and other real estate investments primarily consist of co-investments with institutional and other joint venture partners in open-air shopping center properties, consistent with its core business. These joint ventures typically obtain non-recourse third-party financing on their property investments, thus contractually limiting the Company’s exposure to losses to the amount of its equity investment, and, due to the lender’s exposure to losses, a lender typically will require a minimum level of equity in order to mitigate its risk. From time to time the joint ventures will obtain unsecured debt, which may be guaranteed by the joint venture. The Company’s exposure to losses associated with its unconsolidated joint ventures is primarily limited to its carrying value in these investments.
On a continuous basis, management assesses whether there are any indicators, including property operating performance and general market conditions, that the value of the Company’s investments in unconsolidated joint ventures may be impaired. An investment’s value is impaired only if management’s estimate of the fair value of the investment is less than the carrying value of the investment and such difference is deemed to be other-than-temporary. To the extent impairment has occurred, the loss shall be measured as the excess of the carrying amount of the investment over the estimated fair value of the investment.
The Company’s estimated fair values are based upon a discounted cash flow model for each joint venture that includes all estimated cash inflows and outflows over a specified holding period and, where applicable, any estimated debt premiums. Capitalization rates, discount rates and credit spreads utilized in these models are based upon rates that the Company believes to be within a reasonable range of current market rates.
Realizability of Deferred Tax Assets and Uncertain Tax Positions
The Company is subject to federal, state and local income taxes on the income from its activities relating to its TRS activities and subject to local taxes on certain non-U.S. investments. The Company accounts for income taxes using the asset and liability method, which requires that deferred tax assets and liabilities be recognized based on future tax consequences of temporary differences between the financial statement carrying amounts of existing assets and liabilities and their respective tax basis. Deferred tax assets and liabilities are measured using enacted tax rates expected to apply in the years in which temporary differences are expected to be recovered or settled. The effect on deferred tax assets and liabilities of a change in tax rates is recognized in earnings in the period when the changes are enacted.
A reduction of the carrying amounts of deferred tax assets by a valuation allowance is required, if based on the evidence available, it is more likely than not (a likelihood of more than 50 percent) that some portion or all of the deferred tax assets will not be realized. The valuation allowance should be sufficient to reduce the deferred tax asset to the amount that is more likely than not to be realized.
The Company considers all available evidence, both positive and negative, to determine whether, based on the weight of that evidence, a valuation allowance is needed. Information about an enterprise's current financial position and its results of operations for the current and preceding years is supplemented by all currently available information about future years. The Company must use judgment in considering the relative impact of negative and positive evidence. The Company’s reported net earnings are directly affected by management’s judgement in determining a valuation allowance.
The Company recognizes and measures benefits for uncertain tax positions, which requires significant judgment from management. Although the Company believes it has adequately reserved for any uncertain tax positions, no assurance can be given that the final tax outcome of these matters will not be different. The Company adjusts these reserves in light of changing facts and circumstances, such as the closing of a tax audit or the refinement of an estimate. Changes in the recognition or measurement of uncertain tax positions could result in material increases or decreases in the Company’s income tax expense in the period in which a change is made, which could have a material impact on operating results (see Footnote 22 of the Notes to Consolidated Financial Statements included in this Form 10-K).
Results of Operations
Comparison 201__6 to 201__5
| 201****6 | 201****5 | Change | % change | |||||||||||||
|---|---|---|---|---|---|---|---|---|---|---|---|---|---|---|---|---|
| (amounts in millions) | ||||||||||||||||
| Revenues from rental properties (1) | $ | 1,152.4 | $ | 1,144.5 | $ | 7.9 | 0.7% | |||||||||
| Rental property expenses: (2) | ||||||||||||||||
| Rent | $ | 11.0 | $ | 12.3 | $ | (1.3 | ) | (10.6%) | ||||||||
| Real estate taxes | 146.6 | 147.2 | (0.6 | ) | (0.4%) | |||||||||||
| Operating and maintenance | 140.9 | 145.0 | (4.1 | ) | (2.8%) | |||||||||||
| $ | 298.5 | $ | 304.5 | $ | (6.0 | ) | (2.0%) | |||||||||
| Depreciation and amortization (3) | $ | 355.3 | $ | 344.5 | $ | 10.8 | 3.1% |
| (1) | Revenues from rental properties increased primarily from the combined effect of (i) the acquisition of operating properties during 2016 and 2015, providing incremental revenues for the year ended December 31, 2016, of $57.4 million, as compared to the corresponding period in 2015 and (ii) the completion of certain redevelopment projects, tenant buyouts and net growth in the current portfolio, providing incremental revenues for the year ended December 31, 2016, of $17.4 million, as compared to the corresponding period in 2015, partially offset by (iii) a decrease in revenues of $66.9 million from properties sold during 2016 and 2015. |
|---|
| (2) | Rental property expenses include (i) rent expense relating to ground lease payments for which the Company is the lessee, (ii) real estate tax expense for consolidated properties for which the Company has a controlling ownership interest and (iii) operating and maintenance expense, which consists of property related costs including repairs and maintenance costs, roof repair, landscaping, parking lot repair, snow removal, utilities, property insurance costs, security and various other property related expenses. Rental property expenses decreased $6.0 million for the year ended December 31, 2016, as compared to the corresponding period in 2015, primarily due to the disposition of properties during 2016 and 2015, partially offset by the acquisition of properties during 2016 and 2015. |
|---|
| (3) | Depreciation and amortization increased for the year ended December 31, 2016, as compared to the corresponding period in 2015, primarily due to operating property acquisitions during 2016 and 2015 and write-offs relating to the Company’s redevelopment projects in 2016, partially offset by property dispositions. |
|---|
Management and other fee income decreased $3.9 million to $18.4 million for the year ended December 31, 2016, as compared to $22.3 million for the corresponding period in 2015. This decrease is primarily attributable to (i) the sale of properties within various joint venture investments and the acquisition of partnership interests in joint ventures by the Company during 2016 and 2015, and (ii) the recognition of enhancement fee income related to the Company’s prior investment in InTown Suites of $1.2 million during 2015.
General and administrative costs include employee-related expenses (salaries, bonuses, equity awards, benefits, severance costs and payroll taxes), professional fees, office rent, travel expense and other company-specific expenses. General and administrative expenses decreased $5.4 million for the year ended December 31, 2016, as compared to the corresponding period in 2015, primarily due to a decrease in severance costs and a reduction in professional fees.
During the year ended December 31, 2016, the Company recognized impairment charges related solely to adjustments to property carrying values of $93.3 million for which the Company’s estimated fair value was primarily based on third party appraisals and third party offers through signed contracts, letters of intent or discounted cash flow models. During the year ended December 31, 2015, the Company recognized impairment charges of $45.5 million, before noncontrolling interests and income taxes, of which $0.1 million is included in discontinued operations. The 2015 impairment charges consisted of (i) $30.3 million related to adjustments to property carrying values, (ii) $9.0 million relating to a cost method investment, (iii) $5.3 million related to certain investments in other real estate investments and (iv) $0.8 million related to marketable debt securities investments. The adjustments to property carrying values for 2016 and 2015 were recognized in connection with the Company’s efforts to market for sale certain properties and management’s assessment as to the likelihood and timing of such potential transactions and the anticipated hold period for such properties. Certain of the calculations to determine fair value utilized unobservable inputs and as such are classified as Level 3 of the fair value hierarchy. For additional disclosure, see Footnote 16 of the Notes to Consolidated Financial Statements included in this Form 10-K.
Interest, dividends and other investment income decreased $37.6 million to $1.5 million for the year ended December 31, 2016, as compared to $39.1 million for the corresponding period in 2015. This decrease is primarily due to the sale of certain marketable securities during the year ended December 31, 2015, which resulted in an aggregate gain of $39.9 million.
Interest expense decreased $26.4 million to $192.5 million for the year ended December 31, 2016, as compared to $218.9 million for the corresponding period in 2015. This decrease is primarily the result of lower levels of borrowings and lower interest rates on borrowings during 2016, as compared to 2015.
During the year ended December 31, 2016, the Company incurred early extinguishment of debt charges aggregating $45.7 million in connection with the optional make-whole provisions of unsecured notes that were repaid prior to maturity and prepayment penalties on a mortgage encumbering 10 operating properties, which the Company also paid prior to the scheduled maturity date. See “Liquidity and Capital Resources” for additional details.
Provision for income taxes, net increased $12.3 million to $72.5 million for the year ended December 31, 2016, as compared to $60.2 million for the corresponding period in 2015. This increase is primarily due to (i) an increase in the Company’s valuation allowance of $63.5 million as a result of the Company’s merger of its taxable REIT subsidiary into a wholly owned LLC of the Company, partially offset by (ii) a decrease in foreign tax expense of $26.1 million primarily relating to fewer sales of unconsolidated properties within the Company’s Canadian portfolio which were subject to foreign taxes at a consolidated reporting entity level during 2016, as compared to 2015, (iii) an increase in tax benefit of $13.4 million related to impairment charges recognized during 2016, as compared to 2015, (iv) a decrease of $4.5 million in tax expense related to gains recognized during 2015, as compared to 2016, (v) a decrease of $3.0 million in tax expense on operations due to fewer properties in the taxable REIT subsidiary as a result of the TRS Merger, (vi) a decrease of $2.0 million resulting from the favorable settlement of a tax audit during 2016 and (vii) a decrease in tax expense of $2.0 million relating to equity income recognized in connection with the Company’s Albertsons investment during 2015.
Equity in income of joint ventures, net decreased $261.7 million to $218.7 million for the year ended December 31, 2016, as compared to $480.4 million for the corresponding period in 2015. This decrease is primarily due to (i) a decrease in gains of $248.1 million resulting from fewer sales of properties and interests within various joint venture investments, including the Company’s Canadian Portfolio, during 2016, as compared to 2015 and (ii) lower equity in income of $26.0 million resulting from the sales of properties within various joint venture investments and the acquisition of partnership interests in joint ventures by the Company during 2016 and 2015, partially offset by (iii) a decrease in impairment charges of $7.2 million recognized during 2016, as compared to 2015.
During 2016, the Company acquired nine operating properties and one development project from joint ventures in which the Company had a noncontrolling interest. The Company recorded a gain on change in control of interests of $57.4 million related to the fair value adjustment associated with its previously held equity interest in the operating properties.
During 2015, the Company acquired 43 properties from joint ventures in which the Company had noncontrolling interests. The Company recorded a net gain on change in control of interests of $149.2 million related to the fair value adjustment associated with its previously held equity interests in these properties.
Equity in income from other real estate investments, net decreased $8.3 million to $27.8 million for the year ended December 31, 2016, as compared to $36.1 million for the corresponding period in 2015. This decrease is primarily due to (i) a decrease in equity in income of $4.9 million resulting from a cash distribution received in excess of the Company’s carrying basis in 2015, (ii) a decrease in income resulting from the sale of the Company’s leveraged lease portfolio of $3.8 million during 2015 and (iii) a decrease of $2.8 million in earnings from the Company’s Preferred Equity Program during the year ended December 31, 2016, primarily resulting from the sale of the Company’s interests in certain preferred equity investments during 2016 and 2015, partially offset by (iv) an increase of $3.3 million in profit participation from the Company’s Preferred Equity Program from capital transactions during the year ended December 31, 2016, as compared to the corresponding period in 2015.
During 2016, the Company disposed of 30 consolidated operating properties and two out-parcels, in separate transactions, for an aggregate sales price of $378.7 million. These transactions resulted in an aggregate gain of $86.8 million, after income tax expense, and aggregate impairment charges of $37.2 million which were taken prior to sale, before income tax benefit of $10.0 million.
During 2015, the Company disposed of 89 consolidated operating properties and eight out-parcels, in separate transactions, for an aggregate sales price of $492.5 million. These transactions resulted in an aggregate gain of $143.6 million, after income tax expense, and aggregate impairment charges of $10.2 million, before income tax expense of $2.3 million. Additionally, during 2015, the Company disposed of its remaining operating property in Chile for a sales price of $51.3 million. This transaction resulted in the release of a cumulative foreign currency translation loss of $19.6 million due to the Company’s liquidation of its investment in Chile, partially offset by a gain on sale of $1.8 million, after income tax expense.
Net income attributable to the Company was $378.9 million for the year ended December 31, 2016, as compared to $894.1 million for the year ended December 31, 2015. On a diluted per share basis, net income available to the Company for the year ended December 31, 2016 was $0.79 as compared to $2.00 for the year ended December 31, 2015. These changes are primarily attributable to (i) a decrease in equity in income of joint ventures, net, resulting from gains on sales of properties within various joint venture investments during 2015, (ii) a decrease in gain on change in control of interests, net related to the fair value adjustment associated with the Company’s previously held equity interests in properties acquired from various joint ventures during 2016 and 2015, (iii) an increase in impairments of operating properties during 2016, (iv) an increase in early extinguishment of debt charges resulting from the prepayment of secured and unsecured debt by the Company, (v) a decrease in gains on sale of operating properties, (vi) a decrease in gain on sale of marketable securities during 2016, as compared to the corresponding period in 2015, (vii) an increase in provision for income taxes due to a valuation allowance on net deferred tax assets resulting from the merger of KRS into a wholly-owned LLC of the Company and (viii) a decrease in gains through the Company’s preferred equity program and other investments, partially offset by (ix) a decrease in interest expense and (x) incremental earnings due to the acquisition of operating properties during 2016 and 2015 and increased profitability from the Company’s operating properties.
Results of Operations
Comparison 20__15 to 20__14
| 2015 | 2014 | Change | % change | |||||||||||||
|---|---|---|---|---|---|---|---|---|---|---|---|---|---|---|---|---|
| (amounts in millions) | ||||||||||||||||
| Revenues from rental properties (1) | $ | 1,144.5 | $ | 958.9 | $ | 185.6 | 19.4% | |||||||||
| Rental property expenses: (2) | ||||||||||||||||
| Rent | $ | 12.3 | $ | 14.3 | $ | (2.0 | ) | (14.0%) | ||||||||
| Real estate taxes | 147.2 | 124.7 | 22.5 | 18.0% | ||||||||||||
| Operating and maintenance | 145.0 | 119.7 | 25.3 | 21.1% | ||||||||||||
| $ | 304.5 | $ | 258.7 | $ | 45.8 | 17.7% | ||||||||||
| Depreciation and amortization (3) | $ | 344.5 | $ | 258.1 | $ | 86.4 | 33.5% |
| (1) | Revenues from rental properties increased primarily from the combined effect of (i) the acquisition of operating properties during 2015 and 2014, providing incremental revenues for the year ended December 31, 2015, of $179.9 million, as compared to the corresponding period in 2014 and (ii) the completion of certain redevelopment projects, tenant buyouts and net growth in the current portfolio, providing incremental revenues for the year ended December 31, 2015, of $23.5 million, as compared to the corresponding period in 2014, partially offset by (iii) a decrease in revenues of $17.8 million from properties sold during 2015 and 2014. |
|---|
| (2) | Rental property expenses include (i) rent expense relating to ground lease payments for which the Company is the lessee, (ii) real estate tax expense for consolidated properties for which the Company has a controlling ownership interest and (iii) operating and maintenance expense, which consists of property related costs including repairs and maintenance costs, roof repair, landscaping, parking lot repair, snow removal, utilities, property insurance costs, security and various other property related expenses. Rental property expenses increased for the year ended December 31, 2015, as compared to the corresponding period in 2014, primarily due to the acquisitions of properties during 2015 and 2014, partially offset by the disposition of properties in 2015, which resulted in (i) a net increase in real estate taxes of $22.5 million, (ii) a net increase in repairs and maintenance costs of $9.7 million, (iii) a net increase in property services of $4.8 million, (iv) a net increase in snow removal costs of $3.6 million, (v) a net increase in professional fees of $2.4 million and (vi) a net increase in insurance expense of $3.1 million, due to an increase in insurance claims. |
|---|
| (3) | Depreciation and amortization increased for the year ended December 31, 2015, as compared to the corresponding period in 2014, primarily due to operating property acquisitions during 2015 and 2014 and amounts relating to the Company’s redevelopment projects in 2015, partially offset by property dispositions. |
|---|
Management and other fee income decreased $12.7 million to $22.3 million for the year ended December 31, 2015, as compared to $35.0 million for the corresponding period in 2014. This decrease is primarily attributable to (i) the sale of properties within various joint venture investments and the acquisition of partnership interests in joint ventures by the Company during 2015 and 2014 and (ii) a decrease in enhancement fee income related to InTown Suites of $4.1 million for the year ended December 31, 2015, as compared to the corresponding period in 2014, resulting from the repayment of debt that was previously guaranteed by the Company.
During the year ended December 31, 2015, the Company recognized impairment charges of $45.5 million, before noncontrolling interests and income taxes, of which $0.1 million is included in discontinued operations. These impairment charges consist of (i) $30.3 million related to adjustments to property carrying values, (ii) $9.0 million relating to a cost method investment, (iii) $5.3 million related to certain investments in other real estate investments and (iv) $0.8 million related to marketable debt securities investments. During the year ended December 31, 2014, the Company recognized impairment charges of $217.8 million, of which $178.0 million, before income tax benefits of $1.7 million, is included in discontinued operations. These impairment charges consist of (i) $118.4 million related to adjustments to property carrying values, (ii) the release of a cumulative foreign currency translation loss of $92.9 million relating to the substantial liquidation of the Company’s investment in Mexico, (iii) $4.8 million related to a cost method investment and (iv) $1.6 million related to a preferred equity investment. The adjustments to property carrying values were recognized in connection with the Company’s efforts to market certain properties and management’s assessment as to the likelihood and timing of such potential transactions and the anticipated hold period for such properties. Certain of the calculations to determine fair value utilized unobservable inputs and as such are classified as Level 3 of the fair value hierarchy. For additional disclosure, see Footnote 16 of the Notes to Consolidated Financial Statements included in this Form 10-K.
Interest, dividends and other investment income increased $38.1 million to $39.1 million for the year ended December 31, 2015, as compared to $1.0 million for the corresponding period in 2014. This increase is primarily due to the sale of certain marketable securities during 2015, which resulted in an aggregate gain of $39.9 million.
Other income/(expense), net changed $10.7 million to income of $2.2 million for the year ended December 31, 2015, as compared to an expense of $8.5 million for the corresponding period in 2014. This change is primarily due to (i) the release of contingent liabilities related to potential earn-out payments, for which the Company ultimately was not required to pay of $5.8 million, (ii) a decrease in acquisition related costs of $2.3 million and (iii) an increase in gains on land sales of $0.8 million.
Interest expense increased $15.1 million to $218.9 million for the year ended December 31, 2015, as compared to $203.8 million for the corresponding period in 2014. This increase is primarily the result of higher levels of borrowings during 2015, as compared to 2014, primarily relating to the acquisition of operating properties during 2015 and 2014.
Provision for income taxes, net increased $37.8 million to $60.2 million for the year ended December 31, 2015, as compared to $22.4 million for the corresponding period in 2014. This increase is primarily due to (i) an increase in foreign tax expense of $33.6 million primarily resulting from the sale of certain Canadian investments during 2015, as compared to 2014 and (ii) an increase in tax expense of $4.3 million relating to equity in income recognized in connection with the Company’s Albertsons investment during 2015, as compared to 2014.
Equity in income of joint ventures, net increased $320.8 million to $480.4 million for the year ended December 31, 2015, as compared to $159.6 million for the corresponding period in 2014. This increase is primarily due to (i) an increase in gains of $316.1 million resulting from the sale of properties and sale of interests within various joint venture investments during the year ended December 31, 2015, as compared to the corresponding period in 2014 and (ii) the release of cumulative foreign currency translation loss of $47.3 million relating to the substantial liquidation of the Company’s investment in Mexico during 2014, partially offset by (iii) a decrease in equity in income of $15.6 million resulting from a cash distribution received in excess of the Company’s carrying basis in 2014, (iv) an increase in impairment charges of $14.9 million recognized during the year ended December 31, 2015, as compared to the corresponding period in 2014 and (v) lower equity in income resulting from the sales of properties within various joint venture investments and the acquisition of partnership interests in joint ventures by the Company during 2015 and 2014.
During 2015, the Company acquired 43 properties from joint ventures in which the Company had noncontrolling interests. The Company recorded a net gain on change in control of interests of $149.2 million related to the fair value adjustment associated with its previously held equity interests in these properties.
During 2014, the Company acquired 34 properties from joint ventures in which the Company had noncontrolling interests. The Company recorded an aggregate net gain on change in control of interests of $107.2 million related to the fair value adjustment associated with its original ownership of these properties.
During 2015, the Company disposed of 89 consolidated operating properties and eight out-parcels, in separate transactions, for an aggregate sales price of $492.5 million. These transactions resulted in an aggregate gain of $143.6 million, after income tax expense, and aggregate impairment charges of $10.2 million, before income tax expense of $2.3 million. Additionally, during 2015, the Company disposed of its remaining operating property in Chile for a sales price of $51.3 million. This transaction resulted in the release of a cumulative foreign currency translation loss of $19.6 million due to the Company’s liquidation of its investment in Chile, partially offset by a gain on sale of $1.8 million, after income tax expense.
During 2014, the Company disposed of 90 consolidated operating properties, in separate transactions, for an aggregate sales price of $833.5 million, including 27 operating properties in Latin America. These transactions, which are included in Discontinued Operations on the Company’s Consolidated Statements of Income, resulted in (i) an aggregate gain of $203.3 million, before income taxes of $12.0 million, (ii) the release of a cumulative foreign currency translation loss of $92.9 million relating to the substantial liquidation of the Company’s investment in Mexico and (iii) aggregate impairment charges of $85.1 million before income tax benefits of $1.7 million.
Net income attributable to the Company was $894.1 million for the year ended December 31, 2015. Net income attributable to the Company was $424.0 million for the year ended December 31, 2014. On a diluted per share basis, net income attributable to the Company was $2.00 for the year ended December 31, 2015, as compared to $0.89 for the year ended December 31, 2014. These changes are primarily attributable to (i) incremental earnings due to the acquisition of operating properties during 2015 and 2014 and increased profitability from the Company’s operating properties, (ii) an increase in equity in income of joint ventures, net, primarily from gains on sale of Canadian assets, (iii) an increase in gains on sale of marketable securities and (iv) an increase in gain on change in control of interests, net, partially offset by (v) an increase in depreciation and amortization, (vi) the disposition of operating properties during 2015 and 2014 and (vii) an increase in provision for income taxes, net.
Liquidity and Capital Resources
The Company’s capital resources include accessing the public debt and equity capital markets, mortgage and construction loan financing, borrowings under term loans and immediate access to an unsecured revolving credit facility with bank commitments of $1.75 billion at December 31, 2016, which were subsequently increased to $2.25 billion during February 2017.
The Company’s cash flow activities are summarized as follows (in millions):
| Year Ended December 31, | ||||||||||||
|---|---|---|---|---|---|---|---|---|---|---|---|---|
| 2016 | 2015 | 2014 | ||||||||||
| Net cash flow provided by operating activities | $ | 592.1 | $ | 493.7 | $ | 629.3 | ||||||
| Net cash flow provided by investing activities | $ | 165.4 | $ | 21.4 | $ | 126.7 | ||||||
| Net cash flow used for financing activities | $ | (804.5 | ) | $ | (512.9 | ) | $ | (717.5 | ) |
Operating Activities
The Company anticipates that cash on hand, borrowings under its revolving credit facility, issuance of equity and public debt, as well as other debt and equity alternatives, will provide the necessary capital required by the Company. Cash flows provided by operating activities for the year ended December 31, 2016, were $592.1 million, as compared to $493.7 million for the comparable period in 2015. The increase of $98.4 million is primarily attributable to (i) the acquisition of operating properties during 2016 and 2015, (ii) new leasing, expansion and re-tenanting of core portfolio properties and (iii) changes in operating assets and liabilities due to timing of receipts and payments, partially offset by (iv) a decrease in operational distributions from the Company’s joint venture programs due to the sale of certain joint venture properties during 2016 and 2015.
Investing Activities
Cash flows provided by investing activities for the year ended December 31, 2016, was $165.4 million, as compared to $21.4 million for the comparable period in 2015. This increase of $144.0 million resulted primarily from (i) a decrease in acquisition of operating real estate and other related net assets of $458.2 million, (ii) a decrease in investment in other investments of $190.3 million related to the Company’s KRS AB Acquisition, LLC joint venture investment in Safeway Inc. during 2015, (iii) an increase in return of investment from liquidation of real estate joint ventures of $103.2 million primarily due to the liquidation of certain Canadian joint ventures in 2016, as compared to the corresponding period in 2015, and (iv) a decrease in improvements to operating real estate of $23.2 million, partially offset by (v) a decrease in distributions from liquidation of real estate joint ventures of $235.4 million, (vi) a decrease in proceeds from the sale of operating properties of $132.4 million, (vii) a decrease in proceeds from sale/repayments of marketable securities of $74.2 million, (viii) an increase in improvements to real estate under development of $55.9 million, (ix) a decrease in collection of mortgage loan receivables of $54.2 million, (x) a decrease in reimbursements of investments and advances to real estate joint ventures and other real estate investments of $51.9 million and (xi) an increase in acquisition of real estate under development of $35.2 million.
Acquisitions of Operating Real Estate and Other Related Net Assets
During the years ended December 31, 2016 and 2015, the Company expended $203.2 million and $661.4 million, respectively, towards the acquisition of operating real estate properties. The Company continues to transform its operating portfolio through its capital recycling program by acquiring what the Company believes are high quality U.S. retail properties and disposing of lesser quality assets. The Company anticipates acquiring approximately $300.0 million to $400.0 million of operating properties during 2017. The Company intends to fund these acquisitions with proceeds from property dispositions, cash flow from operating activities, assumption of mortgage debt, if applicable, and availability under the Company’s revolving line of credit.
Improvements to Operating Real Estate
During the years ended December 31, 2016 and 2015, the Company expended $143.5 million and $166.7 million, respectively, towards improvements to operating real estate. These amounts consist of the following (in thousands):
| Year Ended December 31, | ||||||||
|---|---|---|---|---|---|---|---|---|
| 2016 | 2015 | |||||||
| Redevelopment/renovations | $ | 96,319 | $ | 125,994 | ||||
| Tenant improvements/tenant allowances | 39,016 | 30,127 | ||||||
| Other | 8,154 | 10,549 | ||||||
| Total (1) | $ | 143,489 | $ | 166,670 |
| (1) | During the years ended December 31, 2016 and 2015, the Company capitalized interest of $2.4 million and $3.0 million, respectively, and capitalized payroll of $2.1 million and $3.0 million, respectively, in connection with the Company’s improvements to operating real estate. |
|---|
During the years ended December 31, 2016 and 2015, the Company capitalized personnel costs of $15.4 million and $13.9 million, respectively, relating to deferred leasing costs.
The Company has an ongoing program to redevelop and re-tenant its properties to maintain or enhance its competitive position in the marketplace. The Company is actively pursuing redevelopment opportunities within its operating portfolio which it believes will increase the overall value by bringing in new tenants and improving the assets’ value. The Company has identified three categories of redevelopment, (i) large scale redevelopment, which involves demolishing and building new square footage, (ii) value creation redevelopment, which includes the subdivision of large anchor spaces into multiple tenant layouts, and (iii) creation of out-parcels and pads which are located in the front of the shopping center properties. The Company anticipates its capital commitment toward these redevelopment projects and re-tenanting efforts during 2017 will be approximately $250.0 million to $300.0 million. The funding of these capital requirements will be provided by cash flow from operating activities and availability under the Company’s revolving line of credit.
Real Estate Under Development
The Company is engaged in select real estate development projects, which are expected to be held as long-term investments by the Company. As of December 31, 2016, the Company had in progress a total of six consolidated real estate development projects located in the U.S. The Company anticipates its capital commitment toward these development projects during 2017 will be approximately $150.0 million to $200.0 million. The funding of these capital requirements will be provided by cash flow from operating activities and availability under the Company’s revolving line of credit. The Company anticipates remaining costs to complete for these projects to be approximately $225.0 million to $275.0 million. Additionally, during the year ended December 31, 2016, the Company capitalized interest of $6.9 million, real estate taxes and insurance of $4.3 million and payroll of $1.8 million, in connection with these real estate development projects.
Financing Activities
Cash flow used for financing activities for the year ended December 31, 2016, was $804.5 million, as compared to $512.9 million for the comparable period in 2015. This change of $291.6 million resulted primarily from (i) an increase in repayments under unsecured term loan/notes of $511.9 million, (ii) an increase in principal payments of $135.6 million, (iii) a decrease in contributions from noncontrolling interests, net of $106.2 million, primarily relating to the joint venture investment in Safeway, (iv) a decrease in proceeds from issuance of unsecured term loan/notes of $100.0 million, (v) an increase in early extinguishment of debt charges of $45.7 million and (vi) an increase in dividends paid of $18.2 million, partially offset by (vii) an increase in proceeds from issuance of stock of $288.7 million, (viii) a decrease in redemption of preferred stock of $175.0 million, (ix) an increase in proceeds from unsecured revolving credit facility, net of $126.4 million and (x) a decrease in redemption of noncontrolling interests of $43.2 million.
The Company continually evaluates its debt maturities, and, based on management’s current assessment, believes it has viable financing and refinancing alternatives that will not materially adversely impact its expected financial results. The Company continues to pursue borrowing opportunities with large commercial U.S. and global banks, select life insurance companies and certain regional and local banks. The Company has noticed a continuing trend that, although pricing remains dependent on specific deal terms, generally spreads for non-recourse mortgage financing had been widening due to global economic issues, but have recently stabilized. However, the unsecured debt markets are functioning well and credit spreads are at manageable levels.
Debt maturities for 2017 consist of: $451.6 million of consolidated debt; $358.2 million of unconsolidated joint venture debt; and $59.3 million of debt on properties included in the Company’s Preferred Equity Program, assuming the utilization of extension options where available. Subsequent to December 31, 2016, the Company paid off the remaining $250.0 million outstanding balance on the Company’s unsecured term loan. The 2017 consolidated debt maturities are anticipated to be repaid with operating cash flows, borrowings from the Company’s revolving credit facility (which at December 31, 2016, had $1.725 billion available and was subsequently increased to $2.25 billion) and debt refinancing where applicable. The 2017 debt maturities on properties in the Company’s unconsolidated joint ventures and Preferred Equity Program are anticipated to be repaid through debt refinancing, unsecured credit facilities and partner capital contributions, as deemed appropriate.
The Company intends to maintain strong debt service coverage and fixed charge coverage ratios as part of its commitment to maintain its investment-grade debt ratings. The Company may, from time-to-time, seek to obtain funds through additional common and preferred equity offerings, unsecured debt financings and/or mortgage/construction loan financings and other capital alternatives.
Since the completion of the Company’s IPO in 1991, the Company has utilized the public debt and equity markets as its principal source of capital for its expansion needs. Since the IPO, the Company has completed additional offerings of its public unsecured debt and equity, raising in the aggregate over $12.2 billion. Proceeds from public capital market activities have been used for the purposes of, among other things, repaying indebtedness, acquiring interests in open-air shopping centers, funding real estate under development projects, expanding and improving properties in the portfolio and other investments.
During February 2015, the Company filed a shelf registration statement on Form S-3, which is effective for a term of three years, for the future unlimited offerings, from time-to-time, of debt securities, preferred stock, depositary shares, common stock and common stock warrants. The Company, pursuant to this shelf registration statement may, from time-to-time, offer for sale its senior unsecured debt for any general corporate purposes, including (i) funding specific liquidity requirements in its business, including property acquisitions, development and redevelopment costs and (ii) managing the Company’s debt maturities. (See Footnote 13 of the Notes to Consolidated Financial Statements included in this Form 10-K.)
At the Market Continuous Offering Program (“ATM program”)
During February 2015, the Company established an ATM program, pursuant to which the Company may offer and sell shares of its common stock, par value $0.01 per share, with an aggregate gross sales price of up to $500.0 million through a consortium of banks acting as sales agents. Sales of the shares of common stock may be made, as needed, from time to time in “at the market” offerings as defined in Rule 415 of the Securities Act of 1933, including by means of ordinary brokers’ transactions on the NYSE or otherwise (i) at market prices prevailing at the time of sale, (ii) at prices related to prevailing market prices or (iii) as otherwise agreed to with the applicable sales agent. During the year ended December 31, 2016, the Company issued 9,806,377 shares and received proceeds of $285.2 million, net of commissions and fees of $2.9 million. As of December 31, 2016, the Company had $211.9 million available under this ATM program.
Medium Term Notes (“MTN”) and Senior Notes
The Company’s supplemental indenture governing its MTN and senior notes contains the following covenants, all of which the Company is compliant with:
| Covenant | Must Be | As of 12/31/1****6 | ||||
|---|---|---|---|---|---|---|
| Consolidated Indebtedness to Total Assets | <65% | 38% | ||||
| Consolidated Secured Indebtedness to Total Assets | <40% | 8% | ||||
| Consolidated Income Available for Debt Service to Maximum Annual Service Charge | >1.50x | 6.0x | ||||
| Unencumbered Total Asset Value to Consolidated Unsecured Indebtedness | >1.50x | 2.8x |
For a full description of the various indenture covenants refer to the Indenture dated September 1, 1993; the First Supplemental Indenture dated August 4, 1994; the Second Supplemental Indenture dated April 7, 1995; the Third Supplemental Indenture dated June 2, 2006; the Fourth Supplemental Indenture dated April 26, 2007; the Fifth Supplemental Indenture dated as of September 24, 2009; the Sixth Supplemental Indenture dated as of May 23, 2013; and the Seventh Supplemental Indenture dated as of April 24, 2014, each as filed with the SEC. See the Exhibits Index for specific filing information.
During the year ended December 31, 2016, the Company issued the following Senior Unsecured Notes (dollars in millions):
| Date Issued | Maturity Date | Amount Issued | Interest Rate | ||
|---|---|---|---|---|---|
| Nov-16 | Mar-24 | $ | 400.0 | 2.7% | |
| Nov-16 | Dec-46 | $ | 350.0 | 4.125% | |
| Aug-16 | Oct-26 | $ | 500.0 | 2.8% | |
| May-16 | Apr-45 | $ | 150.0 | 4.25% |
Interest on these senior unsecured notes is payable semi-annually in arrears. The Company used the net proceeds from these issuances, after the underwriting discounts and related offering costs, for general corporate purposes, including to pre-fund near-term debt maturities or to reduce borrowings under the Company’s revolving credit facility.
During the year ended December 31, 2016, the Company repaid (i) its $300.0 million 5.783% medium term notes, which matured in March 2016 and (ii) its $290.9 million 5.70% senior unsecured notes, which were scheduled to mature in May 2017. The Company recorded an early extinguishment of debt charge of $10.2 million resulting from the early repayment of its $290.9 million 5.70% notes.
Canadian Notes Payable
During August 2016, Kimco North Trust III, a wholly-owned subsidiary of the Company, repaid (i) its CAD $150.0 million (USD $116.1 million) 5.99% notes, which were scheduled to mature in April 2018 and (ii) its CAD $200.0 million (USD $154.8 million) 3.855% notes, which were scheduled to mature in August 2020. The Company recorded aggregate early extinguishment of debt charges of CAD $34.1 million (USD $26.3 million) resulting from the early repayment of these notes.
Credit Facility
The Company had a $1.75 billion unsecured revolving credit facility (the “Credit Facility”) with a group of banks, which was scheduled to expire in March 2018 with two additional six month options to extend the maturity date, at the Company’s discretion, to March 2019. The Credit Facility, which could be increased to $2.25 billion through an accordion feature, accrued interest at a rate of LIBOR plus 92.5 basis points (1.67% as of December 31, 2016) on drawn funds. In addition, the Credit Facility included a $500 million sub-limit which provided the Company the opportunity to borrow in alternative currencies including Canadian Dollars, British Pounds Sterling, Japanese Yen or Euros. Pursuant to the terms of the Credit Facility, the Company, among other things, was subject to covenants requiring the maintenance of (i) maximum leverage ratios on both unsecured and secured debt and (ii) minimum interest and fixed coverage ratios. As of December 31, 2016, the Credit Facility had a balance of $25.0 million outstanding and $0.7 million appropriated for letters of credit.
In February 2017, the Company closed on a new $2.25 billion unsecured revolving credit facility (the “New Credit Facility”) with a group of banks, which is scheduled to expire in March 2021 with two additional six month options to extend the maturity date, at the Company’s discretion, to March 2022. The New Credit Facility could be increased to $2.75 billion through an accordion feature. The New Credit Facility replaces the Company’s Credit Facility discussed above, that was scheduled to mature in March 2018. The New Credit Facility accrues interest at a rate of LIBOR plus 87.5 basis points on drawn funds. In addition, there is a $500.0 million sub-limit which provides the company the opportunity to borrow in alternative currencies including Canadian Dollars, British Pounds Sterling, Japanese Yen or Euros. Pursuant to the terms of the New Credit Facility, the Company continues to be subject to the covenants under the Credit Facility. For a full description of the New Credit Facility’s covenants refer to the Amended and Restated Credit Agreement dated as of February 1, 2017, filed as Exhibit 10.1 to the Company’s Current Report on Form 8-K dated January 30, 2017.
Pursuant to the terms of the Credit Facility, the Company, among other things, is subject to maintenance of various covenants. The Company is currently in compliance with these covenants. The financial covenants for the Credit Facility are as follows:
| Covenant | Must Be | As of 12/31/1****6 | ||
|---|---|---|---|---|
| Total Indebtedness to Gross Asset Value (“GAV”) | <60% | 41% | ||
| Total Priority Indebtedness to GAV | <35% | 8% | ||
| Unencumbered Asset Net Operating Income to Total Unsecured Interest Expense | >1.75x | 4.90x | ||
| Fixed Charge Total Adjusted EBITDA to Total Debt Service | >1.50x | 2.84x |
For a full description of the Credit Facility’s covenants refer to the Credit Agreement dated as of March 17, 2014, filed as Exhibit 10.1 to the Company’s Current Report on Form 8-K dated March 20, 2014.
Term Loan
The Company had a $650.0 million unsecured term loan (“Term Loan’) which was scheduled to mature in January 2017, with three one-year extension options at the Company’s discretion, and accrued interest at a spread (95 basis points at December 31, 2016) to LIBOR or at the Company’s option at a base rate as defined per the agreement (1.60% at December 31, 2016). During November 2016, the Company repaid $400.0 million of borrowings under the Company’s Term Loan. As of December 31, 2016, the Term Loan had a balance of $250.0 million. Pursuant to the terms of the credit agreement for the Term Loan, the Company, among other things, is subject to covenants requiring the maintenance of (i) maximum indebtedness ratios and (ii) minimum interest and fixed charge coverage ratios. The Term Loan covenants are similar to the Credit Facility covenants described above. During January 2017, the Company repaid the remaining $250.0 million balance on the Term Loan and terminated the agreement.
Mortgage__s Payable
During 2016, the Company (i) assumed $289.0 million of individual non-recourse mortgage debt relating to the acquisition of 10 properties, including $4.3 million associated with fair value debt adjustments and (ii) paid off $703.0 million of mortgage debt (including fair market value adjustment of $2.1 million) that encumbered 47 operating properties. In connection with the early prepayment of certain of these mortgages, the Company recorded an early extinguishment of debt charge of $9.2 million.
Additionally, during 2016, the Company disposed of an encumbered property through foreclosure. This transaction resulted in a net decrease in mortgage debt of $25.6 million (including fair market value adjustment of $0.4 million) and a gain on forgiveness of debt of $3.1 million, which is included in Other income/(expense), net in the Company’s Consolidated Statements of Income.
In addition to the public equity and debt markets as capital sources, the Company may, from time-to-time, obtain mortgage financing on selected properties and construction loans to partially fund the capital needs of its real estate under development projects. As of December 31, 2016, the Company had over 360 unencumbered property interests in its portfolio.
Dividends
In connection with its intention to continue to qualify as a REIT for federal income tax purposes, the Company expects to continue paying regular dividends to its stockholders. These dividends will be paid from operating cash flows. The Company’s Board of Directors will continue to evaluate the Company’s dividend policy on a quarterly basis as the Board of Directors monitors sources of capital and evaluates the impact of the economy and capital markets availability on operating fundamentals. Since cash used to pay dividends reduces amounts available for capital investment, the Company generally intends to maintain a conservative dividend payout ratio, reserving such amounts as it considers necessary for the expansion and renovation of shopping centers in its portfolio, debt reduction, the acquisition of interests in new properties and other investments as suitable opportunities arise and such other factors as the Board of Directors considers appropriate. Cash dividends paid were $474.0 million in 2016, $455.8 million in 2015 and $427.9 million in 2014.
Although the Company receives substantially all of its rental payments on a monthly basis, it generally intends to continue paying dividends quarterly. Amounts accumulated in advance of each quarterly distribution will be invested by the Company in short-term money market or other suitable instruments. On October 25, 2016, the Company’s Board of Directors declared an increased quarterly cash dividend of $0.27 per common share, an annualized increase of 5.9%, payable to shareholders of record on January 3, 2017, which was paid on January 15, 2017. Additionally, on February 2, 2017, the Company’s Board of Directors declared a quarterly cash dividend of $0.27 per common share payable to shareholders of record on April 5, 2017, which is scheduled to be paid on April 17, 2017.
The Board of Directors also declared quarterly dividends with respect to the Company’s various series of cumulative redeemable preferred shares (Class I, Class J and Class K). All dividends on the preferred shares are scheduled to be paid on April 17, 2017, to shareholders of record on April 4, 2017, with an ex-dividend date of March 31, 2017.
Other
The Company is subject to taxes on its activities in Canada, Puerto Rico and Mexico. In general, under local country law applicable to the structures the Company has in place and applicable treaties, the repatriation of cash to the Company from its subsidiaries and joint ventures in Canada, Puerto Rico and Mexico generally are not subject to withholding tax. The Company is subject to and also includes in its tax provision non-U.S. income taxes on certain investments located in jurisdictions outside the U.S. These investments are held by the Company at the REIT level and not in the Company’s taxable REIT subsidiary. Accordingly, the Company does not expect a U.S. income tax impact associated with the repatriation of undistributed earnings from the Company’s foreign subsidiaries.
Contractual Obligations and Other Commitments
The Company has debt obligations relating to its revolving credit facility, Term Loan, MTNs, senior notes and mortgages with maturities ranging from less than one year to 30 years. As of December 31, 2016, the Company’s total debt had a weighted average term to maturity of 8.7 years. In addition, the Company has non-cancelable operating leases pertaining to its shopping center portfolio. As of December 31, 2016, the Company had 44 consolidated shopping center properties that are subject to long-term ground leases where a third party owns and has leased the underlying land to the Company to construct and/or operate a shopping center. The following table summarizes the Company’s debt maturities (excluding extension options, unamortized debt issuance costs of $50.8 million and fair market value of debt adjustments aggregating $27.7 million) and obligations under non-cancelable operating leases as of December 31, 2016 (in millions):
| Payments due by period | ||||||||||||||||||||||||||||
|---|---|---|---|---|---|---|---|---|---|---|---|---|---|---|---|---|---|---|---|---|---|---|---|---|---|---|---|---|
| Contractual Obligations: | 201****7 | 201****8 | 201****9 | 20****20 | 20****21 | Thereafter | Total | |||||||||||||||||||||
| Long-Term Debt-Principal (1) | $ | 712.4 | $ | 449.4 | $ | 415.9 | $ | 101.2 | $ | 645.4 | $ | 2,765.2 | $ | 5,089.5 | ||||||||||||||
| Long-Term Debt-Interest (2) | $ | 181.3 | $ | 152.4 | $ | 140.5 | $ | 122.7 | $ | 107.3 | $ | 979.7 | $ | 1,683.9 | ||||||||||||||
| Operating Leases: | ||||||||||||||||||||||||||||
| Ground Leases (3) | $ | 8.7 | $ | 8.7 | $ | 8.8 | $ | 8.3 | $ | 8.3 | $ | 143.0 | $ | 185.8 |
| (1) | Maturities utilized do not reflect extension options, which range from one to three years. |
|---|
| (2) | For loans which have interest at floating rates, future interest expense was calculated using the rate as of December 31, 2016. |
|---|
| (3) | For leases which have inflationary increases, future ground rent expense was calculated using the rent as of December 31, 2016. |
|---|
The Company had a $250.0 million unsecured term loan and $462.4 million of secured debt scheduled to mature in 2017. Subsequent to December 31, 2016, the Company paid off the $250.0 million unsecured term loan. The Company anticipates satisfying the remaining maturities with a combination of operating cash flows, its unsecured revolving credit facility, exercise of extension options, where available, and new debt issuances.
The Company has issued letters of credit in connection with completion and repayment guarantees for loans encumbering certain of the Company’s development and redevelopment projects and guarantee of payment related to the Company’s insurance program. As of December 31, 2016, these letters of credit aggregated $40.8 million.
In connection with the construction of its development/redevelopment projects and related infrastructure, certain public agencies require posting of performance and surety bonds to guarantee that the Company’s obligations are satisfied. These bonds expire upon the completion of the improvements and infrastructure. As of December 31, 2016, the Company had $30.1 million in performance and surety bonds outstanding.
The Company has accrued $5.0 million of non-current uncertain tax positions and related interest under the provisions of the authoritative guidance that addresses accounting for income taxes, which are included in Other liabilities on the Company’s Consolidated Balance Sheets at December 31, 2016. These amounts are not included in the table above because a reasonably reliable estimate regarding the timing of settlements with the relevant tax authorities, if any, cannot be made.
Off-Balance Sheet Arrangements
Unconsolidated Real Estate Joint Ventures
The Company has investments in various unconsolidated real estate joint ventures with varying structures. These joint ventures primarily operate shopping center properties. Such arrangements are generally with third-party institutional investors and individuals. The properties owned by the joint ventures are primarily financed with individual non-recourse mortgage loans, however, the Company, on a selective basis, has obtained unsecured financing for certain joint ventures. As of December 31, 2016, the Company did not guarantee any joint venture unsecured debt. Non-recourse mortgage debt is generally defined as debt whereby the lenders’ sole recourse with respect to borrower defaults is limited to the value of the property collateralized by the mortgage. The lender generally does not have recourse against any other assets owned by the borrower or any of the constituent members of the borrower, except for certain specified exceptions listed in the particular loan documents (see Footnote 8 of the Notes to Consolidated Financial Statements included in this Form 10-K). As of December 31, 2016, these investments include the following joint ventures:
| Venture | Kimco Ownership Interest | Number of Properties | Non- Recourse Mortgages Payable (in millions) | Number of Encumbered Properties | Weighted Average Interest Rate | Weighted Average Term (months)***** | ||||||||||||||||||
|---|---|---|---|---|---|---|---|---|---|---|---|---|---|---|---|---|---|---|---|---|---|---|---|---|
| KimPru and KimPru II (a) | 15.0% | 48 | $ | 448.6 | 16 | 3.31% | 73.0 | |||||||||||||||||
| KIR (b) | 48.6% | 45 | $ | 730.7 | 38 | 4.69% | 55.4 | |||||||||||||||||
| CPP (c) | 55.0% | 5 | $ | 84.8 | 1 | 2.17% | 16.0 |
- Average remaining term includes extensions
| (a) | Represents the Company’s joint ventures with Prudential Global Investment Management. As of December 31, 2016, KimPru also has an unsecured term loan with an outstanding balance of $200.0 million, which is scheduled to mature in August 2019, with two one-year extension options at the joint venture’s discretion, and bears interest at a rate equal to LIBOR plus 1.75% (2.52% at December 31, 2016). |
|---|
| (b) | Represents the Company’s joint ventures with certain institutional investors. As of December 31, 2016, KIR has an unsecured revolving credit facility with an outstanding balance of $16.0 million, which is scheduled to mature in June 2018, with two one-year extension options at the joint venture’s discretion, and bears interest at a rate equal to LIBOR plus 1.75% (2.52% at December 31, 2016). |
|---|
| (c) | Represents the Company’s joint ventures with Canada Pension Plan Investment Board (CPPIB). |
|---|
The Company has various other unconsolidated real estate joint ventures with varying structures. As of December 31, 2016, these other unconsolidated joint ventures had individual non-recourse mortgage loans aggregating $584.3 million. The aggregate debt as of December 31, 2016, of all of the Company’s unconsolidated real estate joint ventures is $2.1 billion. As of December 31, 2016, these loans had scheduled maturities ranging from one month to 10 years and bore interest at rates ranging from 2.01% to 7.25%. Approximately $358.2 million of the aggregate outstanding loan balance matures in 2017. These maturing loans are anticipated to be repaid with operating cash flows, debt refinancing and partner capital contributions, as deemed appropriate (see Footnote 8 of the Notes to Consolidated Financial Statements included in this Form 10-K).
Other Real Estate Investments
The Company previously provided capital to owners and developers of real estate properties through its Preferred Equity Program. As of December 31, 2016, the Company’s net investment under the Preferred Equity Program was $193.7 million relating to 365 properties, including 346 net leased properties. As of December 31, 2016, these preferred equity investment properties had individual non-recourse mortgage loans aggregating $427.4 million. These loans have scheduled maturities ranging from one month to eight years and bear interest at rates ranging from 4.19% to 10.47%. Due to the Company’s preferred position in these investments, the Company’s share of each investment is subject to fluctuation and is dependent upon property cash flows. The Company’s maximum exposure to losses associated with its preferred equity investments is limited to its invested capital.
Funds From Operations
Funds From Operations (“FFO”) is a supplemental non-GAAP measure utilized to evaluate the operating performance of real estate companies. The National Association of Real Estate Investment Trusts (“NAREIT”) defines FFO as net income/(loss) attributable to common shareholders computed in accordance with generally accepted accounting principles in the United States (“GAAP”), excluding (i) gains or losses from sales of operating real estate assets and change in control of interests, plus (ii) depreciation and amortization of operating properties and (iii) impairment of depreciable real estate and in substance real estate equity investments and (iv) after adjustments for unconsolidated partnerships and joint ventures calculated to reflect funds from operations on the same basis.
The Company presents FFO as it considers it an important supplemental measure of our operating performance and believes it is frequently used by securities analysts, investors and other interested parties in the evaluation of REITs, many of which present FFO when reporting results. Comparison of our presentation of FFO to similarly titled measures for other REITs may not necessarily be meaningful due to possible differences in the application of the NAREIT definition used by such REITs.
The Company also presents FFO as adjusted as an additional supplemental measure as it believes it is more reflective of the Company’s core operating performance. The Company believes FFO as adjusted provides investors and analysts an additional measure in comparing the Company’s performance across reporting periods on a consistent basis by excluding items that we do not believe are indicative of our core operating performance. FFO as adjusted is generally calculated by the Company as FFO excluding certain transactional income and expenses and non-operating impairments which management believes are not reflective of the results within the Company’s operating real estate portfolio.
FFO is a supplemental non-GAAP financial measure of real estate companies’ operating performances, which does not represent cash generated from operating activities in accordance with GAAP and therefore should not be considered an alternative for net income as a measure of liquidity. Our method of calculating FFO and FFO as adjusted may be different from methods used by other REITs and, accordingly, may not be comparable to such other REITs.
The Company’s reconciliation of net income available to common shareholders to FFO and FFO as adjusted for the three months and years ended December 31, 2016 and 2015 is as follows (in thousands, except per share data):
| Three Months Ended December 31, | Year Ended December 31, | |||||||||||||||
|---|---|---|---|---|---|---|---|---|---|---|---|---|---|---|---|---|
| 201****6 | 201****5 | 201****6 | 201****5 | |||||||||||||
| Net income available to common shareholders | $ | 66,718 | $ | 360,020 | $ | 332,630 | $ | 831,215 | ||||||||
| Gain on disposition of operating property | (10,950 | ) | (43,347 | ) (4) | (92,824 | ) | (131,844 | ) (4) | ||||||||
| Gain on disposition of joint venture operating properties and change in control of interests | (14,880 | ) | (327,933 | ) (4) | (217,819 | ) | (557,744 | ) (4) | ||||||||
| Depreciation and amortization - real estate related | 89,476 | 82,732 | 347,315 | 333,840 | ||||||||||||
| Depreciation and amortization - real estate joint ventures | 9,477 | 14,552 | 45,098 | 68,556 | ||||||||||||
| Impairment of operating properties | 24,125 | 8,545 | 101,928 | 52,021 | ||||||||||||
| (Benefit)/provision for income taxes (2) | (1,227 | ) | 51,849 | 39,570 | 53,792 | |||||||||||
| Noncontrolling interests (2) | 245 | (3,239 | ) | (182 | ) | (6,591 | ) | |||||||||
| FFO | 162,984 | 143,179 | 555,716 | 643,245 | ||||||||||||
| Transactional (income)/expense: | ||||||||||||||||
| Profit participation from other real estate investments | (830 | ) | (48 | ) | (10,883 | ) | (11,399 | ) | ||||||||
| Transactional losses from other real estate investments | - | - | 461 | - | ||||||||||||
| Gains from land sales | (1,255 | ) | (798 | ) | (3,607 | ) | (7,621 | ) | ||||||||
| Acquisition costs | 1,133 | 2,546 | 5,023 | 4,430 | ||||||||||||
| Prepayment penalties | - | - | 45,674 | - | ||||||||||||
| Severance costs – Canada | - | 1,974 | - | 1,974 | ||||||||||||
| Gain on forgiveness of debt | (7,357 | ) | - | (7,357 | ) | - | ||||||||||
| Distributions in excess of Company’s investment basis | - | (303 | ) | (845 | ) | (5,553 | ) | |||||||||
| Gain on sale of marketable securities | - | (1,365 | ) | - | (39,853 | ) | ||||||||||
| Impairments on other investments | 5,300 | 9,012 | 6,358 | 17,860 | ||||||||||||
| Preferred stock redemption charge | - | 5,816 | - | 5,816 | ||||||||||||
| Other expense/(income), net | 62 | (5,101 | ) | 22 | (5,505 | ) | ||||||||||
| Provision/(benefit) for income taxes (3) | 257 | (1,841 | ) | 38,433 | (227 | ) | ||||||||||
| Noncontrolling interests (3) | 125 | - | 410 | 270 | ||||||||||||
| Total transactional (income)/expense, net | (2,565 | ) | 9,892 | 73,689 | (39,808 | ) | ||||||||||
| FFO as adjusted | $ | 160,419 | $ | 153,071 | $ | 629,405 | $ | 603,437 | ||||||||
| Weighted average shares outstanding for FFO calculations: | ||||||||||||||||
| Basic | 423,087 | 411,667 | 418,402 | 411,319 | ||||||||||||
| Units | 841 | 860 | 853 | 791 | ||||||||||||
| Dilutive effect of equity awards | 1,162 | 1,481 | 1,307 | 1,414 | ||||||||||||
| Diluted | 425,090 | (1) | 414,008 | (1) | 420,562 | (1) | 413,524 | (1) | ||||||||
| FFO per common share – basic | $ | 0.39 | $ | 0.35 | $ | 1.33 | $ | 1.56 | ||||||||
| FFO per common share – diluted | $ | 0.38 | (1) | $ | 0.35 | (1) | $ | 1.32 | (1) | $ | 1.56 | (1) | ||||
| FFO as adjusted per common share – basic | $ | 0.38 | $ | 0.37 | $ | 1.50 | $ | 1.47 | ||||||||
| FFO as adjusted per common share – diluted | $ | 0.38 | (1) | $ | 0.37 | (1) | $ | 1.50 | (1) | $ | 1.46 | (1) |
| (1) | Reflects the potential impact if certain units were converted to common stock at the beginning of the period, which would have a dilutive effect on FFO. FFO would be increased by $229 and $217 for the three months ended December 31, 2016 and 2015, respectively, and $881 and $781 for the years ended December 31, 2016 and 2015, respectively. The effect of other certain convertible units would have an anti-dilutive effect upon the calculation of Income from continuing operations per share. Accordingly, the impact of such conversion has not been included in the determination of diluted earnings per share calculations. |
|---|
| (2) | Related to gains, impairment and deprecation on operating properties, where applicable. |
|---|
| (3) | Related to transaction (income)/expense, where applicable. |
|---|
| (4) | Includes cumulative foreign currency translation net loss of $18.8 million due to the liquidation of the Company's Chilean Portfolio as follows: (i) $19.6 million of loss in Gain on disposition of operating property, net, partially offset by (ii) $0.8 million of gain in Gain on disposition of joint venture operating properties and change in control of interests. |
|---|
U.S. Same Property Net Operating Income (“U.S. same property NOI”)
U.S. same property NOI is a supplemental non-GAAP financial measure of real estate companies’ operating performance and should not be considered an alternative to net income in accordance with GAAP or as a measure of liquidity. U.S. same property NOI is considered by management to be an important performance measure of the Company’s operations and management believes that it is frequently used by securities analysts and investors as a measure of the Company’s operating performance because it includes only the net operating income of U.S. properties that have been owned for the entire current and prior year reporting periods including those properties under redevelopment and excludes properties under development and pending stabilization. Properties are deemed stabilized at the earlier of (i) reaching 90% leased or (ii) one year following a project’s inclusion in operating real estate. U.S. same property NOI assists in eliminating disparities in net income due to the development, acquisition or disposition of properties during the particular period presented, and thus provides a more consistent performance measure for the comparison of the Company's properties.
U.S. same property NOI is calculated using revenues from rental properties (excluding straight-line rent adjustments, lease termination fees, amortization of above/below market rents and includes charges for bad debt) less operating and maintenance expense, real estate taxes and rent expense plus the Company’s proportionate share of U.S. same property NOI from U.S. unconsolidated real estate joint ventures, calculated on the same basis. The Company’s method of calculating U.S. same property NOI may differ from methods used by other REITs and, accordingly, may not be comparable to such other REITs.
The following is a reconciliation of the Company’s Income from continuing operations to U.S. same property NOI (in thousands):
| Three Months Ended December 31, | **Year Ende****d **December 31, | |||||||||||||||
|---|---|---|---|---|---|---|---|---|---|---|---|---|---|---|---|---|
| 201****6 | 201****5 | 201****6 | 201****5 | |||||||||||||
| Income from continuing operations | $ | 69,836 | $ | 339,117 | $ | 299,353 | $ | 774,405 | ||||||||
| Adjustments: | ||||||||||||||||
| Management and other fee income | (4,117 | ) | (4,369 | ) | (18,391 | ) | (22,295 | ) | ||||||||
| General and administrative expenses | 27,462 | 33,413 | 117,302 | 122,735 | ||||||||||||
| Impairment charges | 25,140 | 17,475 | 93,266 | 45,383 | ||||||||||||
| Depreciation and amortization | 90,884 | 86,095 | 355,320 | 344,527 | ||||||||||||
| Interest and other expense, net | 40,818 | 52,525 | 232,798 | 174,656 | ||||||||||||
| (Benefit)/provision for income taxes, net | (747 | ) | 48,297 | 72,545 | 60,230 | |||||||||||
| Gain on change in control of interests, net | (4,290 | ) | (3,091 | ) | (57,386 | ) | (149,234 | ) | ||||||||
| Equity in income of other real estate investments, net | (5,241 | ) | (4,854 | ) | (27,773 | ) | (36,090 | ) | ||||||||
| Non same property net operating income | (16,194 | ) | (41,218 | ) | (88,070 | ) | (173,189 | ) | ||||||||
| Non-operational expense/(income) from joint ventures, net | 8,474 | (297,488 | ) | (58,563 | ) | (245,380 | ) | |||||||||
| U.S. same property NOI | $ | 232,025 | $ | 225,902 | $ | 920,401 | $ | 895,748 |
U.S. same property NOI increased by $6.1 million or 2.7% for the three months ended December 31, 2016, as compared to the corresponding period in 2015. This increase is primarily the result of an increase of $4.5 million related to lease-up and rent commencements in the portfolio and an increase of $1.6 million in other property income, net of property expenses.
U.S. same property NOI increased by $24.7 million or 2.8% for the year ended December 31, 2016, as compared to the corresponding period in 2015. This increase is primarily the result of an increase of $13.1 million related to lease-up and rent commencements in the portfolio and an increase of $11.6 million in other property income, net of property expenses.
Effects of Inflation
Many of the Company's leases contain provisions designed to mitigate the adverse impact of inflation. Such provisions include clauses enabling the Company to receive payment of additional rent calculated as a percentage of tenants' gross sales above pre-determined thresholds, which generally increase as prices rise, and/or escalation clauses, which generally increase rental rates during the terms of the leases. Such escalation clauses often include increases based upon changes in the consumer price index or similar inflation indices. In addition, many of the Company's leases are for terms of less than 10 years, which permits the Company to seek to increase rents to market rates upon renewal. Most of the Company's leases require the tenant to pay an allocable share of operating expenses, including common area maintenance costs, real estate taxes and insurance, thereby reducing the Company's exposure to increases in costs and operating expenses resulting from inflation. The Company periodically evaluates its exposure to short-term interest rates and foreign currency exchange rates and will, from time-to-time, enter into interest rate protection agreements and/or foreign currency hedge agreements which mitigate, but do not eliminate, the effect of changes in interest rates on its floating-rate debt and fluctuations in foreign currency exchange rates.
New Accounting Pronouncements
See Footnote 1 of the Notes to Consolidated Financial Statements included in this Form 10-K.
Previous: Item 6. Selected Financial Data · Next: Item 7A. Quantitative and Qualitative Disclosures About Market Risk