 filings.tools
KLA 10-K 2019-06-30
Filed 2019-08-16. 22 sections, 571K characters. Original on sec.gov · Markdown · JSON
Cover and table of contents
10-K 1 klac10k2019.htm 10-K
UNITED STATES
SECURITIES AND EXCHANGE COMMISSION
Washington, D.C. 20549
| FORM 10-K |
(Mark One)
| x | ANNUAL REPORT PURSUANT TO SECTION 13 OR 15(d) OF THE SECURITIES EXCHANGE ACT OF 1934 |
| For the Fiscal Year Ended June 30, 2019 |
OR
| o | TRANSITION REPORT PURSUANT TO SECTION 13 OR 15(d) OF THE SECURITIES EXCHANGE ACT OF 1934 |
| For the Transition Period from to |
Commission File Number 000-09992
KLA CORPORATION
(Exact name of registrant as specified in its charter)
| Delaware | 04-2564110 | |
| (State or other jurisdiction of incorporation or organization) | (I.R.S. Employer Identification Number) | |
| One Technology Drive, Milpitas, California | 95035 | |
| (Address of Principal Executive Offices) | (Zip Code) |
Registrant’s Telephone Number, Including Area Code: (408) 875-3000
Securities Registered Pursuant to Section 12(b) of the Act:
| Title of Each Class | Trading Symbol(s) | Name of Each Exchange on Which Registered |
| Common Stock, $0.001 par value per share | KLAC | The Nasdaq Stock Market, LLC |
| The NASDAQ Global Select Market |
| Securities Registered Pursuant to Section 12(g) of the Act: | ||
| None | ||
| (Title of Class) |
Indicate by check mark if the registrant is a well-known seasoned issuer, as defined in Rule 405 of the Securities Act. Yes x No o
Indicate by check mark if the registrant is not required to file reports pursuant to Section 13 or Section 15(d) of the Act. Yes o No x
Indicate by check mark whether the registrant (1) has filed all reports required to be filed by Section 13 or 15(d) of the Securities Exchange Act of 1934 during the preceding 12 months (or for such shorter period that the registrant was required to file such reports), and (2) has been subject to such filing requirements for the past 90 days. Yes x No o
Indicate by check mark whether the registrant has submitted electronically and posted on its corporate website, if any, every Interactive Data File required to be submitted and posted pursuant to Rule 405 of Regulation S-T (§232.405 of this chapter) during the preceding 12 months (or for such shorter period that the registrant was required to submit and post such files). Yes x No o
Indicate by check mark if disclosure of delinquent filers pursuant to Item 405 of Regulation S-K (§229.405 of this chapter) is not contained herein, and will not be contained, to the best of registrant’s knowledge, in definitive proxy or information statements incorporated by reference in Part III of this Form 10-K or any amendment to this Form 10-K. o
Indicate by check mark whether the registrant is a large accelerated filer, an accelerated filer, a non-accelerated filer, a smaller reporting company or an emerging growth company. See the definitions of “large accelerated filer,” “accelerated filer,” “smaller reporting company,” and “emerging growth company” in Rule 12b-2 of the Exchange Act.
| Large accelerated filer x | Accelerated filer o | |||
| Non-accelerated filer o | (Do not check if a smaller reporting company) | Smaller reporting company o | ||
| Emerging growth companyo |
If an emerging growth company, indicate by check mark if the registrant has elected not to use the extended transition period for complying with any new or revised financial accounting standards provided pursuant to Section 13(a) of the Exchange Act. ¨
Indicate by check mark whether the registrant is a shell company (as defined in Rule 12b-2 of the Exchange Act). Yes o No x
The aggregate market value of the voting and non-voting common stock held by non-affiliates of the registrant based upon the closing price of the registrant’s stock, as of December 31, 2018, was approximately $13.53 billion.
The registrant had 159,255,950 shares of common stock outstanding as of July 19, 2019.
DOCUMENTS INCORPORATED BY REFERENCE
Portions of the Proxy Statement for the 2019 Annual Meeting of Stockholders (“Proxy Statement”), and to be filed pursuant to Regulation 14A within 120 days after the registrant’s fiscal year ended June 30, 2019, are incorporated by reference into Part III of this report.
INDEX
i
SPECIAL NOTE REGARDING FORWARD-LOOKING STATEMENTS
This report contains certain forward-looking statements within the meaning of Section 27A of the Securities Act of 1933 and Section 21E of the Securities Exchange Act of 1934. All statements other than statements of historical fact may be forward-looking statements. You can identify these and other forward-looking statements by the use of words such as “may,” “will,” “could,” “would,” “should,” “expects,” “plans,” “anticipates,” “relies,” “believes,” “estimates,” “predicts,” “intends,” “potential,” “continue,” “thinks,” “seeks,” or the negative of such terms, or other comparable terminology. Forward-looking statements also include the assumptions underlying or relating to any of the foregoing statements. Such forward-looking statements include, among others, forecasts of the future results of our operations, including profitability; orders for our products and capital equipment generally; sales of semiconductors; the investments by our customers in advanced technologies and new materials; the allocation of capital spending by our customers (and, in particular, the percentage of spending that our customers allocate to process control); growth of revenue in the semiconductor industry, the semiconductor capital equipment industry and our business; technological trends in the semiconductor industry; future developments or trends in the global capital and financial markets; our future product offerings and product features; the success and market acceptance of new products; timing of shipment of backlog; our future product shipments and product and service revenues; our future gross margins; our future research and development expenses and selling, general and administrative expenses; our ability to successfully maintain cost discipline; international sales and operations; our ability to maintain or improve our existing competitive position; success of our product offerings; creation and funding of programs for research and development; attraction and retention of employees; results of our investment in leading edge technologies; the effects of hedging transactions; the effect of the sale of trade receivables and promissory notes from customers; our future effective income tax rate; our recognition of tax benefits; the effects of any audits or litigation; future payments of dividends to our stockholders; the completion of any acquisitions of third parties, or the technology or assets thereof; benefits received from any acquisitions and development of acquired technologies; sufficiency of our existing cash balance, investments, cash generated from operations and the unfunded portion of our revolving line of credit under a Credit Agreement (the “Credit Agreement”) to meet our operating and working capital requirements, including debt service and payment thereof; future dividends, and stock repurchases; our compliance with the financial covenants under the Credit Agreement; the adoption of new accounting pronouncements including ASC 606; the tax liabilities resulting from the enactment of the Tax Cuts and Jobs Act; and our repayment of our outstanding indebtedness.
Our actual results may differ significantly from those projected in the forward-looking statements in this report. Factors that might cause or contribute to such differences include, but are not limited to, those discussed in Item 1A, “Risk Factors” in this Annual Report on Form 10-K, as well as in Item 1, “Business” and Item 7, “Management’s Discussion and Analysis of Financial Condition and Results of Operations” in this report. You should carefully review these risks and also review the risks described in other documents we file from time to time with the Securities and Exchange Commission, including the Quarterly Reports on Form 10-Q that we will file in the fiscal year ending June 30, 2020. You are cautioned not to place undue reliance on these forward-looking statements, and we expressly assume no obligation and do not intend to update the forward-looking statements in this report after the date hereof.
ii
PART I
Item 1. BUSINESS
The Company
KLA Corporation (“KLA” or the “Company” and also referred to as “we” or “our”) is a leading supplier of process equipment, process control equipment, and data analytics products for a broad range of industries, including semiconductors, printed circuit boards and displays. We provide advanced process control and process-enabling solutions for manufacturing and testing wafers and reticles, integrated circuits (“IC” or “chip”), packaging, light emitting diodes, power devices, compound semiconductor devices, microelectromechanical systems, data storage, printed circuit boards and flat and flexible panel displays, as well as general materials research.
On February 20, 2019, we completed the acquisition of Orbotech, Ltd. (“Orbotech”) for a total purchase consideration of approximately $3.26 billion. For additional details, refer to Note 6 “Business Combinations” to our Consolidated Financial Statements. Orbotech’s core business enables electronic device manufacturers to inspect, test and measure printed circuit boards and flat panel displays to verify their quality; pattern electronic circuitry on substrate and perform three-dimensional shaping of metalized circuits on multiple surfaces; and utilize advanced vacuum deposition and etching process in semiconductor device and semiconductor manufacturing and to perform laser drilling of electronic substrates.
Subsequent to the acquisition of Orbotech, we changed our organizational structure, resulting in four reportable segments: Semiconductor Process Control; Specialty Semiconductor Process; PCB, Display and Component Inspection; and Other.
Within the Semiconductor Process Control segment, our comprehensive portfolio of inspection, metrology and data analytics products, and related service helps integrated circuit manufacturers achieve target yield throughout the entire semiconductor fabrication process—from research and development (“R&D”) to final volume production. Our differentiated products and services are designed to provide comprehensive solutions that help our customers accelerate development and production ramp cycles, achieve higher and more stable semiconductor die yields and improve their overall profitability.
In the Specialty Semiconductor Process segment, we develop and sell advanced vacuum deposition and etching process tools, which are used by a broad range of specialty semiconductor customers, including manufacturers of microelectromechanical systems (“MEMS”), radio frequency (“RF”) communication chips, and power semiconductors for automotive and industrial applications.
In the PCB, Display and Component Inspection segment, we enable electronic device manufacturers to inspect, test and measure printed circuit boards (“PCBs”) and flat panel displays (“FPDs”) and ICs to verify their quality, pattern the desired electronic circuitry on the relevant substrate and perform three-dimensional shaping of metalized circuits on multiple surfaces.
Our advanced products, coupled with our unique yield management services, allow us to deliver the solutions our semiconductor, printed circuit board and display customers need to achieve their productivity goals, by significantly reducing their risks and costs.
Certain industry and technical terms used in this section are defined in the subsection entitled “Glossary” found at the end of this Item 1.
KLA (then KLA-Tencor) was formed in April 1997 through the merger of KLA Instruments Corporation and Tencor Instruments, two long-time leaders in the semiconductor equipment industry that began operations in 1975 and 1976, respectively.
Additional information about KLA is available on our website at www.kla.com. Our Annual Report on Form 10-K, our Quarterly Reports on Form 10-Q, Current Reports on Form 8-K and amendments to those reports filed or furnished pursuant to Section 13(a) or 15(d) of the Securities Exchange Act of 1934, as amended, are available free of charge on our website as soon as reasonably practicable after we electronically file them with or furnish them to the Securities and Exchange Commission (“SEC”). Information contained on our website is not part of this Annual Report on Form 10-K or our other filings with the SEC. Additionally, these filings may be obtained through the SEC’s website (www.sec.gov), which contains reports, proxy and information statements, and other information regarding issuers that file electronically.
Investors and others should note that we announce material financial information to our investors using our investor relations web site (ir.kla.com), SEC filings, press releases, public conference calls and webcasts. We use these channels as well as social media to communicate with the public about our company, our products and services and other matters. It is possible that the information we post on social media could be deemed to be material information. Therefore, we encourage investors, the media, and others interested in our company to review the information we post on the social media channels listed on our investor relations website.
Industry
General Background
KLA’s core focus is the semiconductor industry. The semiconductor fabrication process begins with a bare silicon wafer—a round disk that is typically 200 millimeters or 300 millimeters in diameter, about as thick as a credit card and gray in color. The process of manufacturing wafers is highly sophisticated, involving the creation of large ingots of silicon by pulling them out of a vat of molten silicon. The ingots are then sliced into wafers. Prime silicon wafers are then polished to a mirror finish. Other, more specialized wafers, such as epitaxial silicon (“epi”), silicon on insulator (“SOI”), gallium nitride (“GaN”) and silicon carbide (“SiC”) are also common in the semiconductor industry.
The manufacturing cycle of an IC is grouped into three phases: design, fabrication and testing. IC design involves the architectural layout of the circuit, as well as design verification and reticle generation. The fabrication of a chip is accomplished by depositing a series of film layers that act as conductors, semiconductors or insulators on bare wafers. The deposition of these film layers is interspersed with numerous other process steps that create circuit patterns, remove portions of the film layers, and perform other functions such as heat treatment, measurement and inspection. Most advanced chip designs require hundreds of individual steps, many of which are performed multiple times. Most chips consist of two main structures: the lower structure, typically consisting of transistors or capacitors which perform the “smart” functions of the chip; and the upper “interconnect” structure, typically consisting of circuitry which connects the components in the lower structure. When the layers on the wafer have been fabricated, each chip on the wafer is tested for functionality. The wafer is then cut into individual chips, and the chips that pass functional testing are packaged. Final testing is performed on all packaged chips. Packaged chips are mounted onto printed circuit boards (“PCBs”) for connection to the outside world. Additionally, flat panel displays are manufactured using processes similar to ICs (e.g., film deposition, photolithography, etching) except using glass as the starting substrate.
The semiconductor equipment industry is currently experiencing growth from multiple drivers, such as demand for chips providing computational power and connectivity for Artificial Intelligence (“AI”) applications and continued need for chips from leading edge foundry and logic chip manufacturers that support mobile devices. Qualification of early extreme ultraviolet (“EUV”) lithography processes and equipment is driving growth at leading logic/foundry and dynamic random-access memory (“DRAM”) manufacturers. Expansion of the Internet of Things (“IoT”) together with the increasing adoption of electrical vehicles and the need for automobile conne
Showing the first 8K of 81K characters. Open the full section
Item 1A. RISK FACTORS
A description of factors that could materially affect our business, financial condition or operating results is provided below.
Risks Associated with Our Industry
Ongoing changes in the technology industry, as well as the semiconductor industry in particular, could expose our business to significant risks.
The industries that we serve, including the semiconductor, flat panel display and printed circuit board industries, are constantly developing and changing over time. Many of the risks associated with operating in these industries are comparable to the risks faced by all technology companies, such as the uncertainty of future growth rates in the industries that we serve, pricing trends in the end-markets for consumer electronics and other products (which place a growing emphasis on our customers’ cost of ownership), changes in our customers’ capital spending patterns and, in general, an environment of constant change and development, including decreasing product and component dimensions; use of new materials; and increasingly complex device structures, applications and process steps. If we fail to appropriately adjust our cost structure and operations to adapt to any of these trends, or, with respect to technological advances, if we do not timely develop new technologies and products that successfully anticipate and address these changes, we could experience a material adverse effect on our business, financial condition and operating results.
In addition, we face a number of risks specific to ongoing changes in the semiconductor industry, as significant majority of our sales are our process control and yield management products sold to semiconductor manufacturers. Some of the trends that our management monitors in operating our business include the following:
| • | the potential for reversal of the long-term historical trend of declining cost per transistor with each new generation of technological advancement within the semiconductor industry, and the adverse impact that such reversal may have upon our business; |
| • | the increasing cost of building and operating fabrication facilities and the impact of such increases on our customers’ capital equipment investment decisions; |
| • | differing market growth rates and capital requirements for different applications, such as memory, logic and foundry; |
| • | lower level of process control adoption by our memory customers compared to our foundry and logic customers; |
| • | our customers’ reuse of existing and installed products, which may decrease their need to purchase new products or solutions at more advanced technology nodes; |
| • | the emergence of disruptive technologies that change the prevailing semiconductor manufacturing processes (or the economics associated with semiconductor manufacturing) and, as a result, also impact the inspection and metrology requirements associated with such processes; |
| • | the higher design costs for the most advanced integrated circuits, which could economically constrain leading-edge manufacturing technology customers to focus their resources on only the large, technologically advanced products and applications; |
| • | the possible introduction of integrated products by our larger competitors that offer inspection and metrology functionality in addition to managing other semiconductor manufacturing processes; |
| • | changes in semiconductor manufacturing processes that are extremely costly for our customers to implement and, accordingly, our customers could reduce their available budgets for process control equipment by reducing inspection and metrology sampling rates for certain technologies; |
| • | the bifurcation of the semiconductor manufacturing industry into (a) leading edge manufacturers driving continued research and development into next-generation products and technologies and (b) other manufacturers that are content with existing (including previous generation) products and technologies; |
| • | the ever escalating cost of next-generation product development, which may result in joint development programs between us and our customers or government entities to help fund such programs that could restrict our control of, ownership of and profitability from the products and technologies developed through those programs; and |
| • | the entry by some semiconductor manufacturers into collaboration or sharing arrangements for capacity, cost or risk with other manufacturers, as well as increased outsourcing of their manufacturing activities, and greater focus only on specific markets or applications, whether in response to adverse market conditions or other market pressures. |
Any of the changes described above may negatively affect our customers’ rate of investment in the capital equipment that we produce, which could result in downward pressure on our prices, customer orders, revenues and gross margins. If we do not successfully manage the risks resulting from any of these or other potential changes in our industries, our business, financial condition and operating results could be adversely impacted.
We are exposed to risks associated with a highly concentrated customer base.
Our customer base, particularly in the semiconductor industry, historically has been highly concentrated due to corporate consolidation, acquisitions and business closures. In this environment, orders from a relatively limited number of manufacturers have accounted for, and are expected to continue to account for, a substantial portion of our sales. This increasing concentration exposes our business, financial condition and operating results to a number of risks, including the following:
| • | The mix and type of customers, and sales to any single customer, may vary significantly from quarter to quarter and from year to year, which exposes our business and operating results to increased volatility tied to individual customers. |
| • | New orders from our foundry customers in the past several years have constituted a significant portion of our total orders. This concentration increases the impact that future business or technology changes within the foundry industry may have on our business, financial condition and operating results. |
| • | In a highly concentrated business environment, if a particular customer does not place an order, or if they delay or cancel orders, we may not be able to replace the business. Furthermore, because our process control and yield management products are configured to each customer’s specifications, any changes, delays or cancellations of orders may result in significant, non-recoverable costs. |
| • | As a result of this consolidation, the customers that survive the consolidation represent a greater portion of our sales and, consequently, have greater commercial negotiating leverage. Many of our large customers have more aggressive policies regarding engaging alternative, second-source suppliers for the products we offer and, in addition, may seek and, on occasion, receive pricing, payment, intellectual property-related or other commercial terms that may have an adverse impact on our business. Any of these changes could negatively impact our prices, customer orders, revenues and gross margins. |
| • | Certain customers have undergone significant ownership changes, created alliances with other companies, experienced management changes or have outsourced manufacturing activities, any of which may result in additional complexities in managing customer relationships and transactions. Any future change in ownership or management of our existing customers |
Showing the first 8K of 92K characters. Open the full section
Item 1B. UNRESOLVED STAFF COMMENTS
None.
Item 2. PROPERTIES
Our headquarters are located in Milpitas, California. As of June 30, 2019, we owned or leased a total of approximately 3.4 million square feet of space for research, engineering, marketing, service, sales and administration worldwide primarily in U.S., Israel, China, Singapore, Germany and Taiwan. Our operating leases expire at various times through November 7, 2028, subject to renewal, with some of the leases containing renewal option clauses at the fair market value, for additional periods up to five years. Additional information regarding these leases is incorporated herein by reference to Note 14, “Commitments and Contingencies” to the Consolidated Financial Statements. We believe our properties are adequately maintained and suitable for their intended use and that our production facilities have capacity adequate for our current needs.
Information regarding our principal properties as of June 30, 2019 is set forth below:
| (Square Feet) | United States | Other Countries | Total | |||||
| Owned(1) | 727,302 | 695,048 | 1,422,350 | |||||
| Leased | 426,535 | 1,519,614 | 1,946,149 | |||||
| Total | 1,153,837 | 2,214,662 | 3,368,499 |
| (1) | Includes 248,155 square feet of property owned at out location in Serangoon, Singapore, where the land on which this building resides is leased. |
Item 3. LEGAL PROCEEDINGS
The information set forth below under Note 15, “Litigation and Other Legal Matters” to the Consolidated Financial Statements is incorporated herein by reference.
Item 4. MINE SAFETY DISCLOSURES
Not applicable.
PART II
Item 5. MARKET FOR REGISTRANT’S COMMON EQUITY, RELATED STOCKHOLDER MATTERS AND ISSUER PURCHASES OF EQUITY SECURITIES
Our common stock is listed and traded on the NASDAQ Global Select Market under the symbol “KLAC.”
On August 1, 2019, we announced that our Board of Directors had declared a quarterly cash dividend of $0.75 per share to be paid on September 3, 2019 to stockholders of record as of the close of business on August 15, 2019.
As of July 19, 2019, there were 383 holders of record of our common stock.
Equity Repurchase Plans
The following is a summary of stock repurchases for each month during the fourth quarter of the fiscal year ended June 30, 2019(1):
| Period | Total Number of Shares Purchased (1) | Average Price Paid per Share | Approximate Dollar Value that May Yet Be Purchased Under the Plans or Programs (2) | |||||||
| April 1, 2019 to April 30, 2019 | 507,700 | $ | 123.81 | $ | 1,142,833,354 | |||||
| May 1, 2019 to May 31, 2019 | 1,693,619 | $ | 109.10 | $ | 958,067,283 | |||||
| June 1, 2019 to June 30, 2019 | 899,092 | $ | 110.53 | $ | 858,692,904 | |||||
| Total | 3,100,411 | $ | 111.92 |
| (1) | Our Board of Directors authorized a program which permits us to repurchase up to $2.00 billion of our common stock, reflecting an increase from $1.00 billion upon the close of the Orbotech Acquisition. Shares are reported based on the trade date of the applicable repurchase. |
| (2) | The stock repurchase program has no expiration date and may be suspended at any time. Future repurchases of our common stock under our repurchase program may be effected through various different repurchase transaction structures, including isolated open market transactions or systematic repurchase plans. |
Stock Performance Graph and Cumulative Total Return
Notwithstanding any statement to the contrary in any of our previous or future filings with the Securities and Exchange Commission, the following information relating to the price performance of our common stock shall not be deemed “filed” with the Commission or “soliciting material” under the Securities Exchange Act of 1934 and shall not be incorporated by reference into any such filings.
The following graph compares the cumulative 5-year total return attained by stockholders on our common stock relative to the cumulative total returns of the S&P 500 Index and the Philadelphia Semiconductor Index (PHLX). The graph tracks the performance of a $100 investment in our common stock and in each of the indices (with the reinvestment of all dividends) from June 30, 2014 to June 30, 2019.
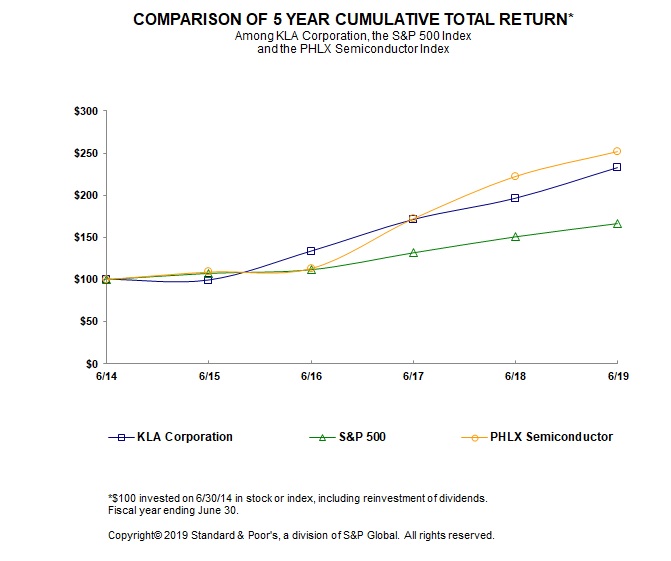
| June 2014 | June 2015 | June 2016 | June 2017 | June 2018 | June 2019 | ||||||
| KLA Corporation | $100.00 | $99.11 | $133.57 | $171.34 | $196.71 | $233.26 | |||||
| S&P 500 | $100.00 | $107.42 | $111.71 | $131.70 | $150.64 | $166.33 | |||||
| PHLX Semiconductor | $100.00 | $108.97 | $113.07 | $172.12 | $222.22 | $251.80 |
Our fiscal year ends June 30. The comparisons in the graph above are based upon historical data and are not necessarily indicative of, nor intended to forecast, future stock price performance.
Item 6. SELECTED FINANCIAL DATA
The following tables include selected consolidated summary financial data for each of our last five fiscal years. This data should be read in conjunction with Item 8, “Financial Statements and Supplementary Data,” and Item 7, “Management’s Discussion and Analysis of Financial Condition and Results of Operations” in this Annual Report on Form 10-K.
| Year ended June 30, | |||||||||||||||||||
| (In thousands, except per share amounts) | 2019 | 2018 | 2017 | 2016 | 2015 | ||||||||||||||
| Consolidated Statements of Operations(1)(2): | |||||||||||||||||||
| Total revenues | $ | 4,568,904 | $ | 4,036,701 | $ | 3,480,014 | $ | 2,984,493 | $ | 2,814,049 | |||||||||
| Net income attributable to KLA(3) | $ | 1,175,617 | $ | 802,265 | $ | 926,076 | $ | 704,422 | $ | 366,158 | |||||||||
| Cash dividends declared per share (including a special cash dividend of $16.50 per share declared during the three months ended December 31, 2014) | $ | 3.00 | $ | 2.52 | $ | 2.14 | $ | 2.08 | $ | 18.50 | |||||||||
| Net income per share attributable to KLA: | |||||||||||||||||||
| Basic | $ | 7.53 | $ | 5.13 | $ | 5.92 | $ | 4.52 | $ | 2.26 | |||||||||
| Diluted | $ | 7.49 | $ | 5.10 | $ | 5.88 | $ | 4.49 | $ | 2.24 | |||||||||
| As of June 30, | |||||||||||||||||||
| 2019 | 2018 | 2017 | 2016 | 2015 | |||||||||||||||
| Consolidated Balance Sheets(1)(2): | |||||||||||||||||||
| Cash, cash equivalents and marketable securities | $ | 1,739,385 | $ | 2,880,318 | $ | 3,016,740 | $ | 2,491,294 | $ | 2,387,111 | |||||||||
| Working capital(4) | $ | 2,546,589 | $ | 3,334,730 | $ | 3,102,094 | $ | 2,868,062 | $ | 2,904,758 | |||||||||
| Total assets | $ | 9,008,516 | $ | 5,638,619 | $ | 5,550,334 | $ | 4,977,076 | $ | 4,841,023 | |||||||||
| Long-term debt(5) | $ | 3,173,383 | $ | 2,237,402 | $ | 2,680,474 | $ | 3,057,936 | $ | 3,173,435 | |||||||||
| Total KLA stockholders’ equity(5) | $ | 2,659,108 | $ | 1,620,511 | $ | 1,326,417 | $ | 689,114 | $ | 421,439 |
| (1) | On July 1, 2018, we adopted ASC 606 using the modified retrospective transition approach. Results for reporting periods beginning after June 30, 2018 are presented under ASC 606, while prior period amounts are not adjusted and continue to be reported in accordance with the previous revenue guidance in ASC 605. Refer to Note 2, “Revenue” to our Consolidated Financial Statements for additional details. |
| (2) | On February 20, 2019, we completed the acquisition of Orbotech for total purchase consideration of approximately $3.26 billion. The operating results of Orbotech have been included in our Consolidated Financial Statements for the fiscal year ended June 30, 2019 from the Acquisition Date. For additional details, refer to Note 6 “Business Combinations” to our Consolidated Financial Statements. |
| (3) | Our net income decreased to $802.3 million in the fiscal year ended June 30, 2018, primarily as a result of the income tax effects from the enacted tax reform legislation through the Tax Cuts and Jobs Act, which was signed into law on December 22, 2017. Our net income was $366.2 million in the fiscal year ended June 30, 2015, primarily as a result of the impact of the pre-tax net loss of $131.7 million for the loss on extinguishment of debt and certain one-time expenses of $2.5 million associated with the leveraged recapitalization that was completed during the three months ended December 31, 2014. |
| (4) | We adopted the accounting standards update regarding classification of deferred taxes on a prospective basis at the beginning of the fourth quarter of fiscal year ended 2016. Upon adoption, approximately $218.0 million in net current deferred tax assets were reclassified to noncurrent. No prior periods were retrospectively adjusted. |
| (5) | Our long-term debt increased to $3.17 billion at the end of fiscal year ended June 30, 2019, because we issued $1.20 billion aggregate principal amount of senior, unsecured long-term notes. Refer to Note 8, “Debt” to our Consolidated Financial Statements for additional details. Our total stockholders’ equity decreased to $421.4 million at the end of fiscal year ended June 30, 2015, because, as part of our leveraged recapitalization plan, we declared a special cash dividend of approximately $2.76 billion. Refer to Note 9, “Equity, Long-term Incentive Compensation Plans and Non-Controlling Interest” to the Consolidated Financial Statements for additional details. |
Item 7. MANAGEMENT’S DISCUSSION AND ANALYSIS OF FINANCIAL CONDITION AND RESULTS OF OPERATIONS
The following discussion of our financial condition and results of operations should be read in conjunction with our Consolidated Financial Statements and the related notes included in Item 8, “Financial Statements and Supplementary Data,” in this Annual Report on Form 10-K. This discussion contains forward-looking statements, which involve risks and uncertainties. Our actual results could differ materially from those anticipated in the forward-looking statements as a result of certain factors, including but not limited to those discussed in Item 1A, “Risk Factors” and elsewhere in this Annual Report on Form 10-K. (See “Special Note Regarding Forward-Looking Statements”). Pursuant to the FAST Act Modernization and Simplification of Regulation S-K, discussions related to the changes in results of operations from fiscal year 2018 to fiscal year 2017 have been omitted. Such omitted discussion can be found under Item 7 of our annual Form 10-K for the fiscal year ended June 30, 2018, filed with the SEC.
EXECUTIVE SUMMARY
We are a leading supplier of process control and yield management solutions for the semiconductor and related nanoelectronics industries. Our broad portfolio of inspection and metrology products, and related service, software and other offerings primarily supports integrated circuit (“IC” or “chip”) manufacturers throughout the entire semiconductor fabrication process, from research and development to final volume production. We provide leading edge equipment, software and support that enable IC manufacturers to identify, resolve and manage significant advanced technology manufacturing process challenges and obtain higher finished product yields at lower overall cost. In addition to serving the semiconductor industry, we also provide a range of technology solutions to a number of other high technology industries, including advanced packaging, light emitting diode (“LED”), power devices, compound semiconductor, and data storage industries, as well as general materials research.
Our products and services are used by the vast majority of bare wafer, IC, lithography reticle (“reticle” or “mask”) and hard disk drive manufacturers around the world. Our products, services and expertise are used by our customers to measure, detect, analyze and resolve critical product defects that arise in that environment in order to control nanometric level manufacturing processes.
Our revenues are driven largely by our customers’ spending on capital equipment and related maintenance services necessary to support key transitions in their underlying product technologies, or to increase their production volumes in response to market demand or expansion plans. Our semiconductor customers generally operate in one or more of the three major semiconductor markets - memory, foundry and logic. All three of these markets are characterized by rapid technological changes and sudden shifts in end-user demand, which influence the level and pattern of our customers’ spending on our products and services. Although capital spending in all three semiconductor markets has historically been very cyclical, the demand for more advanced and lower cost chips used in a growing number of consumer electronics, communications, data processing, and industrial and automotive products has resulted over the long term in a favorable demand environment for our process control and yield management solutions, particularly in the foundry and logic markets, which have higher levels of process control adoption than the memory market.
Through the acquisition of Orbotech, Ltd. (“Orbotech”), we have expanded our reach in the electronics value chain to include technologically advanced, yield-enhancing and process-enabling solutions to address various manufacturing stages of Printed Circuit Boards (“PCB”), Flat Panel Displays (“FPD”), Specialty Semiconductor Devices (“SD”) and other electronic components. The products include Automated Optical Inspection (“AOI”), Automated Optical Shaping (“AOS”), Direct Imaging (“DI”), additive printing, laser drilling, laser plotters, Computer aided manufacturing (“CAM”) and engineering solutions for PCB and additional adjacent electronics component manufacturing, as well as AOI, test, repair and process monitoring systems for FPD manufacturing and vacuum process tools for etch, Physical Vapor Deposition (“PVD”), Molecular Vapor Deposition (“MVD”) and Chemical Vapor Deposition (“CVD”) solutions for SD manufacturing.
In our newly acquired Orbotech business, consumer end markets have been experiencing a fundamental shift in technology complexity, driven primarily by the proliferation of high-end mobile devices and automotive devices, as well as by the demand for large area FPDs such as large-size LCD televisions and OLED displays. The shift towards 5G connectivity and the fast-paced growth of the Internet of Things (“IoT”) services is expected to continue to further accelerate this shift as more devices become connected and dependent upon other electronic devices.
As a supplier to the global semiconductor, semiconductor-related and electronics industries, our customer base continues to become more highly concentrated over time, thereby increasing the potential impact of a sudden change in capital spending by a major customer on our revenues and profitability. As our customer base becomes increasingly more concentrated, large orders from a relatively limited number of customers account for a substantial portion of our sales, which potentially exposes us to more volatility for revenues and earnings. In the global semiconductor and electronics related industries, China is emerging as a major region for manufacturing of logic and memory chips, adding to its role as the world’s largest consumer of ICs. Additionally, a significant portion of global FPD and PCB manufacturing has migrated to China. Government initiatives are propelling China to expand its domestic manufacturing capacity and attracting semiconductor manufacturers from Taiwan, Korea, Japan and the US. China is currently seen as an important long-term growth region for the semiconductor and electronics capital equipment sector. We are also subject to the cyclical capital spending that has historically characterized the semiconductor, semiconductor-related and electronics industries. The timing, length, intensity and volatility of the capacity-oriented capital spending cycles of our customers are unpredictable.
The semiconductor and electronics industries have also been characterized by constant technological innovation. Currently, there are multiple drivers for growth in the industry with increased demand for chips providing computation power and connectivity for Artificial Intelligence (“AI”) applications and support for mobile devices at the leading edge of foundry and logic chip manufacturing. Qualification of early extreme ultraviolet (“EUV”) lithography processes and equipment is driving growth at leading logic/foundry and dynamic random-access memory (“DRAM”) manufacturers. Expansion of IoT together with increasing acceptance of advanced driver assistance systems (“ADAS”) in anticipation of the introduction of autonomous cars have begun to accelerate legacy-node technology conversions and capacity expansions. Intertwined in these areas, spurred by data storage and connectivity needs, is the growth in demand for memory chips. On the other hand, higher design costs for the most advanced ICs could economically constrain leading-edge manufacturing technology customers to focus their resources on only the large technologically advanced products and applications. We believe that, over the long term, our customers will continue to invest in advanced technologies and new materials to enable smaller design rules and higher density applications that fuel demand for process control equipment, although the growth for such equipment may be adversely impacted by higher design costs for advanced ICs, reuse of ins
Showing the first 8K of 93K characters. Open the full section
Item 7A. QUANTITATIVE AND QUALITATIVE DISCLOSURES ABOUT MARKET RISK
We are exposed to financial market risks, including changes in interest rates, foreign currency exchange rates and marketable equity security prices. To mitigate these risks, we utilize derivative financial instruments, such as foreign currency hedges. All of the potential changes noted below are based on sensitivity analysis performed on our financial position as of June 30, 2019. Actual results may differ materially.
As of June 30, 2019, we had an investment portfolio of fixed income securities of $813.5 million These securities, as with all fixed income instruments, are subject to interest rate risk and will decline in value if market interest rates increase. If market interest rates were to increase immediately and uniformly by 100 bps from levels as of June 30, 2019, the fair value of the portfolio would have declined by $4.3 million.
In March 2019 and November 2014, we issued $1.20 billion and $2.50 billion, respectively, (each, a “2019 Senior Notes”, a “2014 Senior Notes”, and collectively the “Senior Notes”) aggregate principal amount of fixed rate senior, unsecured long-term notes. The fair market value of long-term fixed interest rate notes is subject to interest rate risk. Generally, the fair market value of fixed interest rate notes will increase as interest rates fall and decrease as interest rates rise. As of June 30, 2019, the fair value and the book value of our Senior Notes were $3.70 billion and $3.45 billion, respectively, due in various fiscal years ranging from 2020 to 2049. Additionally, the interest expense for the 2014 Senior Notes is subject to interest rate adjustments following a downgrade of our credit ratings below investment grade by the credit rating agencies. Following a rating change below investment grade, the stated interest rate for each series of the 2014 Senior Notes may increase between 25 bps to 100 bps based on the adjusted credit rating. Refer to Note 8, “Debt” to our Consolidated Financial Statements in Part II, Item 8 and Management’s Discussion and Analysis of Financial Condition and Results of Operations, “Liquidity and Capital Resources,” in Part II, Item 7 for additional details. Factors that can affect our credit ratings include changes in our operating performance, the economic environment, conditions in the semiconductor, semiconductor-related, and electronics industries, our financial position, and changes in our business strategy. As of June 30, 2019, if our credit rating was downgraded below investment grade by Moody’s and S&P, the maximum potential increase to our annual interest expense on the 2014 Senior Notes, considering a 200 bps increase to the stated interest rate for each series of our 2014 Senior Notes, is estimated to be approximately $41.7 million. Unlike the 2014 Senior Notes, the interest rate for each series of the 2019 Senior Notes will not be subject to such adjustments.
In November 2017, we entered into a Credit Agreement (the “Credit Agreement”) for a $750.0 million five-year unsecured Revolving Credit Facility (the “Revolving Credit Facility”), which replaced our prior Credit Agreement. Subject to the terms of the Credit Agreement, the Revolving Credit Facility may be increased in an amount up to $250.0 million in the aggregate. In November 2018, we entered into an Incremental Facility, Extension and Amendment Agreement (the “Amendment”), which amends the Credit Agreement to (a) extend the Maturity Date (the “Maturity Date”) from November 30, 2022 to November 30, 2023, (b) increase the total commitment by $250.0 million and (c) effect certain other amendments to the Credit Agreement as set forth in the Amendment. After giving effect to the Amendment, the total commitments under the Credit Agreement are $1.00 billion. As of June 30, 2019, we do not have any outstanding floating rate debts that are subject to an increase in interest rates. We are obligated to pay an annual commitment fee of 12.5 bps on the daily undrawn balance of the Revolving Credit Facility which is subject to an adjustment in conjunction with our credit rating downgrades or upgrades. The annual commitment fee ranges from 10 bps to 25 bps on the daily undrawn balance of the Revolving Credit Facility, depending upon the then effective credit rating. As of June 30, 2019, if our credit ratings were downgraded to be below investment grade, the maximum potential increase to our annual commitment fee for the Revolving Credit Facility, using the highest range of the ranges discussed above, is estimated to be approximately $0.8 million.
See Note 5, “Marketable Securities” to our Consolidated Financial Statements in Part II, Item 8; Management’s Discussion and Analysis of Financial Condition and Results of Operations, “Liquidity and Capital Resources,” in Part II, Item 7; and Risk Factors in Part I, Item 1A of this Annual Report on Form 10-K for a description of recent market events that may affect the value of the investments in our portfolio that we held as of June 30, 2019.
As of June 30, 2019, we had net forward and option contracts to sell $97.6 million in foreign currency in order to hedge certain currency exposures (see Note 16, “Derivative Instruments and Hedging Activities” to our Consolidated Financial Statements for additional details). If we had entered into these contracts on June 30, 2019, the U.S. dollar equivalent would have been $98.3 million. A 10% adverse move in all currency exchange rates affecting the contracts would decrease the fair value of the contracts by $48.3 million. However, if this occurred, the fair value of the underlying exposures hedged by the contracts would increase by a similar amount. Accordingly, we believe that, as a result of the hedging of certain of our foreign currency exposure, changes in most relevant foreign currency exchange rates should have no material impact on our results of operations or cash flows.
Item 8. FINANCIAL STATEMENTS AND SUPPLEMENTARY DATA
KLA CORPORATION
(formerly known as KLA-TENCOR CORPORATION)
Consolidated Balance Sheets
| As of June 30, | |||||||
| (In thousands, except par value) | 2019 | 2018 | |||||
| ASSETS | |||||||
| Current assets: | |||||||
| Cash and cash equivalents | $ | 1,015,994 | $ | 1,404,382 | |||
| Marketable securities | 723,391 | 1,475,936 | |||||
| Accounts receivable, net | 990,113 | 651,678 | |||||
| Inventories | 1,262,500 | 931,845 | |||||
| Other current assets | 323,077 | 85,159 | |||||
| Total current assets | 4,315,075 | 4,549,000 | |||||
| Land, property and equipment, net | 448,799 | 286,306 | |||||
| Goodwill | 2,211,858 | 354,698 | |||||
| Deferred income taxes | 206,141 | 193,200 | |||||
| Purchased intangible assets, net | 1,560,670 | 19,333 | |||||
| Other non-current assets | 265,973 | 236,082 | |||||
| Total assets | $ | 9,008,516 | $ | 5,638,619 | |||
| LIABILITIES, NON-CONTROLLING INTEREST AND STOCKHOLDERS’ EQUITY | |||||||
| Current liabilities: | |||||||
| Accounts payable | $ | 202,416 | $ | 169,354 | |||
| Deferred system revenue | 282,348 | — | |||||
| Deferred service revenue | 206,669 | 69,255 | |||||
| Deferred system profit | — | 279,581 | |||||
| Current portion of long-term debt | 249,999 | — | |||||
| Other current liabilities | 827,054 | 696,080 | |||||
| Total current liabilities | 1,768,486 | 1,214,270 | |||||
| Non-current liabilities: | |||||||
| Long-term debt | 3,173,383 | 2,237,402 | |||||
| Deferred tax liabilities | 702,285 | 1,197 | |||||
| Deferred service revenue | 98,772 | 71,997 | |||||
| Other non-current liabilities | 587,897 | 493,242 | |||||
| Total liabilities | 6,330,823 | 4,018,108 | |||||
| Commitments and contingencies (Notes 14 and 15) | |||||||
| Stockholders’ equity: | |||||||
| Preferred stock, $0.001 par value, 1,000 shares authorized, none outstanding | — | — | |||||
| Common stock, $0.001 par value, 500,000 shares authorized, 276,202 and 262,718 shares issued, 159,475 and 156,048 shares outstanding, as of June 30, 2019 and June 30, 2018, respectively | 159 | 156 | |||||
| Capital in excess of par value | 2,017,153 | 617,843 | |||||
| Retained earnings | 714,825 | 1,056,445 | |||||
| Accumulated other comprehensive income (loss) | (73,029 | ) | (53,933 | ) | |||
| Total KLA stockholders’ equity | 2,659,108 | 1,620,511 | |||||
| Non-controlling interest in consolidated subsidiaries | 18,585 | — | |||||
| Total stockholders’ equity | 2,677,693 | 1,620,511 | |||||
| Total liabilities and stockholders’ equity | $ | 9,008,516 | $ | 5,638,619 |
See accompanying notes to Consolidated Financial Statements.
KLA CORPORATION
(formerly known as KLA-TENCOR CORPORATION)
Consolidated Statements of Operations
| Year ended June 30, | |||||||||||
| (In thousands, except per share amounts) | 2019 | 2018 | 2017 | ||||||||
| Revenues: | |||||||||||
| Product | $ | 3,392,243 | $ | 3,160,671 | $ | 2,703,934 | |||||
| Service | 1,176,661 | 876,030 | 776,080 | ||||||||
| Total revenues | 4,568,904 | 4,036,701 | 3,480,014 | ||||||||
| Costs and expenses: | |||||||||||
| Costs of revenues | 1,869,377 | 1,446,041 | 1,286,215 | ||||||||
| Research and development | 711,030 | 608,531 | 526,688 | ||||||||
| Selling, general and administrative | 599,124 | 442,304 | 388,211 | ||||||||
| Interest expense | 124,604 | 114,376 | 122,476 | ||||||||
| Other expense (income), net | (31,462 | ) | (30,482 | ) | (16,822 | ) | |||||
| Income before income taxes | 1,296,231 | 1,455,931 | 1,173,246 | ||||||||
| Provision for income taxes | 121,214 | 653,666 | 247,170 | ||||||||
| Net income | 1,175,017 | 802,265 | 926,076 | ||||||||
| Less: Net loss attributable to non-controlling interest | (600 | ) | — | — | |||||||
| Net income attributable to KLA | $ | 1,175,617 | $ | 802,265 | $ | 926,076 | |||||
| Net income per share attributable to KLA | |||||||||||
| Basic | $ | 7.53 | $ | 5.13 | $ | 5.92 | |||||
| Diluted | $ | 7.49 | $ | 5.10 | $ | 5.88 | |||||
| Weighted-average number of shares: | |||||||||||
| Basic | 156,053 | 156,346 | 156,468 | ||||||||
| Diluted | 156,949 | 157,378 | 157,481 |
See accompanying notes to Consolidated Financial Statements.
KLA CORPORATION
(formerly known as KLA-TENCOR CORPORATION)
Consolidated Statements of Comprehensive Income
| Year ended June 30, | |||||||||||
| (In thousands) | 2019 | 2018 | 2017 | ||||||||
| Net income | $ | 1,175,017 | $ | 802,265 | $ | 926,076 | |||||
| Other comprehensive income (loss): | |||||||||||
| Currency translation adjustments: | |||||||||||
| Change in currency translation adjustments | (5,190 | ) | 1,358 | 2,332 | |||||||
| Change in income tax benefit or expense | 117 | (678 | ) | (562 | ) | ||||||
| Net change related to currency translation adjustments | (5,073 | ) | 680 | 1,770 | |||||||
| Cash flow hedges: | |||||||||||
| Change in net unrealized gains or losses | (9,119 | ) | (1,934 | ) | 10,138 | ||||||
| Reclassification adjustments for net gains or losses included in net income | (4,018 | ) | (3,846 | ) | (3,222 | ) | |||||
| Change in income tax benefit or expense | 2,033 | 2,491 | (2,470 | ) | |||||||
| Net change related to cash flow hedges | (11,104 | ) | (3,289 | ) | 4,446 | ||||||
| Net change related to unrecognized losses and transition obligations in connection with defined benefit plans | (1,824 | ) | 7,162 | (1,534 | ) | ||||||
| Available-for-sale securities: | |||||||||||
| C |
Showing the first 8K of 251K characters. Open the full section
Item 9. CHANGES IN AND DISAGREEMENTS WITH ACCOUNTANTS ON ACCOUNTING AND FINANCIAL DISCLOSURE
None.
Item 9A. CONTROLS AND PROCEDURES
Evaluation of Disclosure Controls and Procedures
We conducted an evaluation of the effectiveness of the design and operation of our disclosure controls and procedures (as defined in Rules 13a-15(e) and 15d-15(e) under the Securities Exchange Act of 1934, as amended (the “Exchange Act”)) (“Disclosure Controls”) as of the end of the period covered by this Annual Report on Form 10-K (this “Report”) required by Exchange Act Rules 13a-15(b) or 15d-15(b). The controls evaluation was conducted under the supervision and with the participation of our management, including our Chief Executive Officer (“CEO”) and Chief Financial Officer (“CFO”). Based on this evaluation, the CEO and CFO have concluded that as of the end of the period covered by this Report our Disclosure Controls were effective at a reasonable assurance level.
Attached as exhibits to this Report are certifications of the CEO and CFO, which are required in accordance with Rule 13a-14 of the Exchange Act. This Controls and Procedures section includes the information concerning the controls evaluation referred to in the certifications, and it should be read in conjunction with the certifications for a more complete understanding of the topics presented.
Definition of Disclosure Controls
Disclosure Controls are controls and procedures designed to reasonably assure that information required to be disclosed in our reports filed under the Exchange Act, such as this Report, is recorded, processed, summarized and reported within the time periods specified in the SEC’s rules and forms. Disclosure Controls are also designed to reasonably assure that such information is accumulated and communicated to our management, including our CEO and CFO, as appropriate to allow timely decisions regarding required disclosure. Our Disclosure Controls include components of our internal control over financial reporting, which consists of control processes designed to provide reasonable assurance regarding the reliability of our financial reporting and the preparation of financial statements in accordance with generally accepted accounting principles in the United States. To the extent that components of our internal control over financial reporting are included within our Disclosure Controls, they are included in the scope of our annual controls evaluation.
Management’s Report on Internal Control over Financial Reporting
Our management is responsible for establishing and maintaining adequate internal control over financial reporting as defined in Rules 13a-15(f) and 15d-15(f) under the Exchange Act. Under the supervision and with the participation of our management, including our CEO and CFO, we conducted an evaluation of the effectiveness of our internal control over financial reporting based on criteria established in the framework in Internal Control—Integrated Framework (2013) issued by the Committee of Sponsoring Organizations of the Treadway Commission. Based on this evaluation, our management concluded that our internal control over financial reporting was effective as of June 30, 2019.
Management excluded Orbotech, Ltd (“Orbotech”), which was acquired by us on February 20, 2019, from its assessment of internal control over financial reporting as of June 30, 2019. Total assets and revenues of Orbotech excluded from our assessment of internal control over financial reporting, were $917.6 million as of June 30, 2019, and $388.9 million for the year ended June 30, 2019, respectively.
The effectiveness of our internal control over financial reporting as of June 30, 2019 has been audited by PricewaterhouseCoopers LLP, an independent registered public accounting firm, as stated in their report which appears in Item 8, “Financial Statements and Supplementary Data” in this Annual Report on Form 10-K.
Limitations on the Effectiveness of Controls
Our management, including the CEO and CFO, does not expect that our Disclosure Controls or internal control over financial reporting will prevent all error and all fraud. A control system, no matter how well designed and operated, can provide only reasonable, not absolute, assurance that the control system’s objectives will be met. Further, the design of a control system must reflect the fact that there are resource constraints, and the benefits of controls must be considered relative to their costs. Because of the inherent limitations in all control systems, no evaluation of controls can provide absolute assurance that all control issues and instances of fraud, if any, within the Company have been detected. These inherent limitations include the realities that judgments in decision making can be faulty and that breakdowns can occur because of simple error or mistake. Controls can also be circumvented by the individual acts of some persons, by collusion of two or more people, or by management override of the controls. The design of any system of controls is based in part on certain assumptions about the likelihood of future events, and there can be no assurance that any design will succeed in achieving our stated goals under all potential future conditions. Over time, controls may become inadequate because of changes in conditions or deterioration in the degree of compliance with policies or procedures. Because of the inherent limitations in a cost-effective control system, misstatements due to error or fraud may occur and not be detected.
Changes in Internal Control over Financial Reporting
There were no changes in our internal control over financial reporting identified in connection with the evaluation required by Rule 13a-15(d) and 15d-15(d) of the Exchange Act that occurred during the fourth quarter of the fiscal year ended June 30, 2019 that has materially affected, or is reasonably likely to materially affect, our internal control over financial reporting.
Item 9B. OTHER INFORMATION
None.
PART III
Item 10. DIRECTORS, EXECUTIVE OFFICERS AND CORPORATE GOVERNANCE
For the information required by this Item, see “Information About the Directors and the Nominees,” “Information About Executive Officers,” “Security Ownership of Certain Beneficial Owners and Management—Section 16(a) Beneficial Ownership Reporting Compliance,” “Our Corporate Governance Practices—Standards of Business Conduct; Whistleblower Hotline and Website” and “Information About the Board of Directors and Its Committees—Audit Committee” in the Proxy Statement, which is incorporated herein by reference.
Item 11. EXECUTIVE COMPENSATION
For the information required by this Item, see “Executive Compensation and Other Matters,” “Director Compensation” and “Information About the Board of Directors and Its Committees—Compensation Committee—Risk Considerations in Our Compensation Programs” in the Proxy Statement, which is incorporated herein by reference.
Item 12. SECURITY OWNERSHIP OF CERTAIN BENEFICIAL OWNERS AND MANAGEMENT AND RELATED STOCKHOLDER MATTERS
For the information required by this Item, see “Security Ownership of Certain Beneficial Owners and Management” and “Equity Compensation Plan Information” in the Proxy Statement, which is incorporated herein by reference.
Item 13. CERTAIN RELATIONSHIPS AND RELATED TRANSACTIONS, AND DIRECTOR INDEPENDENCE
For the information required by this Item, see “Certain Relationships and Related Transactions” and “Information About the Board of Directors and Its Committees —The Board of Directors” in the Proxy Statement, which is incorporated herein by reference.
Item 14. PRINCIPAL ACCOUNTING FEES AND SERVICES
For the information required by this Item, see “Proposal Two: Ratification of Appointment of PricewaterhouseCoopers LLP as Our Independent Registered Public Accounting Firm for the Fiscal Year Ending June 30, 2020” in the Proxy Statement, which is incorporated herein by reference.
PART IV
Item 15. EXHIBITS, FINANCIAL STATEMENT SCHEDULES
(a) The following documents are filed as part of this Annual Report on Form 10-K:
- Financial Statements:
The following financial statements and schedules of the Registrant are contained in Item 8, “Financial Statements and Supplementary Data” of this Annual Report on Form 10-K:
- Financial Statement Schedule:
The following financial statement schedule of the Registrant is filed as part of this Annual Report on Form 10-K and should be read in conjunction with the financial statements:
| Schedule II—Valuation and Qualifying Accounts for the years ended June 30, 2019, 2018 and 2017 | 125 |
All other schedules are omitted because they are either not applicable or the required information is shown in the Consolidated Financial Statements or notes thereto.
- Exhibits
The information required by this Item is set forth in the Exhibit Index following Schedule II included in this Annual Report.
SIGNATURES
Pursuant to the requirements of Section 13 or 15(d) of the Securities Exchange Act of 1934, the registrant has duly caused this report to be signed on its behalf by the undersigned, thereunto duly authorized.
| KLA Corporation | ||||
| August 16, 2019 | By: | /S/ RICHARD P. WALLACE | ||
| (Date) | Richard P. Wallace | |||
| President and Chief Executive Officer |
Pursuant to the requirements of the Securities Exchange Act of 1934, this report has been signed below by the following persons on behalf of the registrant and in the capacities and on the dates indicated.
| Signature | Title | Date | ||
| /s/ RICHARD P. WALLACE | President, Chief Executive Officer and Director (principal executive officer) | August 16, 2019 | ||
| Richard P. Wallace | ||||
| /s/ BREN D. HIGGINS | Executive Vice President and Chief Financial Officer (principal financial officer) | August 16, 2019 | ||
| Bren D. Higgins | ||||
| /s/ VIRENDRA A. KIRLOSKAR | Senior Vice President and Chief Accounting Officer (principal accounting officer) | August 16, 2019 | ||
| Virendra A. Kirloskar | ||||
| /s/ EDWARD W. BARNHOLT | Chairman of the Board and Director | August 15, 2019 | ||
| Edward W. Barnholt | ||||
| /s/ ROBERT M. CALDERONI | Director | August 14, 2019 | ||
| Robert M. Calderoni | ||||
| /s/ JOHN T. DICKSON | Director | August 14, 2019 | ||
| John T. Dickson | ||||
| /s/ JENEANNE HANLEY | Director | August 15, 2019 | ||
| Jeneanne Hanley | ||||
| /s/ EMIKO HIGASHI | Director | August 15, 2019 | ||
| Emiko Higashi | ||||
| /s/ KEVIN J. KENNEDY | Director | August 15, 2019 | ||
| Kevin J. Kennedy | ||||
| /s/ GARY B. MOORE | Director | August 15, 2019 | ||
| Gary B. Moore | ||||
| /s/ KIRAN M. PATEL | Director | August 14, 2019 | ||
| Kiran M. Patel | ||||
| Director | ||||
| Victor Peng | ||||
| /s/ ANA G. PINCZUK | Director | August 14, 2019 | ||
| Ana G. Pinczuk | ||||
| /s/ ROBERT A. RANGO | Director | August 15, 2019 | ||
| Robert A. Rango |
SCHEDULE II
Valuation and Qualifying Accounts
| (In thousands) | Balance at Beginning of Period | Charged to Expense | Deductions/ Adjustments | Balance at End of Period | |||||||||||
| Fiscal Year Ended June 30, 2017: | |||||||||||||||
| Allowance for Doubtful Accounts | $ | 21,672 | $ | — | $ | (36 | ) | $ | 21,636 | ||||||
| Allowance for Deferred Tax Assets | $ | 104,968 | $ | — | $ | 15,740 | $ | 120,708 | |||||||
| Fiscal Year Ended June 30, 2018: | |||||||||||||||
| Allowance for Doubtful Accounts | $ | 21,636 | $ | — | $ | (9,997 | ) | $ | 11,639 | ||||||
| Allowance for Deferred Tax Assets | $ | 120,708 | $ | 1,152 | $ | 41,710 | $ | 163,570 | |||||||
| Fiscal Year Ended June 30, 2019: | |||||||||||||||
| Allowance for Doubtful Accounts | $ | 11,639 | $ | 364 | $ | (2 | ) | $ | 12,001 | ||||||
| Allowance for Deferred Tax Assets | $ | 163,570 | $ | — | $ | 3,001 | $ | 166,571 |
KLA CORPORATION
EXHIBIT INDEX
| * | Denotes a management contract, plan or arrangement. |
| + | Confidential treatment has been requested as to a portion of this exhibit. |
Item 16. FORM 10-K SUMMARY
None.