 filings.tools
Item 5. MARKET FOR REGISTRANT’S COMMON EQUITY, RELATED STOCKHOLDER MATTERS AND ISSUER PURCHASES OF EQUITY SECURITIES
4K characters. Original on sec.gov · Markdown
Item 5. MARKET FOR REGISTRANT’S COMMON EQUITY, RELATED STOCKHOLDER MATTERS AND ISSUER PURCHASES OF EQUITY SECURITIES
Our common stock is listed and traded on the NASDAQ Global Select Market under the symbol “KLAC.”
On August 3, 2020, we announced that our Board of Directors had approved an increase in the quarterly cash dividend level to $0.90 per share. On August 6, 2020, we announced that our Board of Directors had declared a quarterly cash dividend of $0.90 per share to be paid on September 1, 2020 to stockholders of record as of the close of business on August 17, 2020.
As of July 20, 2020, there were 393 holders of record of our common stock.
Equity Repurchase Plans
Our Board of Directors has authorized a program which permits us to repurchase up to $3.00 billion of our common stock, reflecting an increase of $1.00 billion authorized by our Board of Directors during the fiscal year ended June 30, 2020. These repurchases may be effected through various different repurchase transaction structures, including isolated open market transactions or systematic repurchase plans, in all cases, subject to compliance with applicable law. This repurchase program has no termination date and may be suspended or discontinued at any time. We did not repurchase any shares under this authorization in the fourth quarter of fiscal year ended June 30, 2020. As of June 30, 2020, we have approximately $1.04 billion that may yet be purchased under this authorization.
Stock Performance Graph and Cumulative Total Return
Notwithstanding any statement to the contrary in any of our previous or future filings with the Securities and Exchange Commission, the following information relating to the price performance of our common stock shall not be deemed “filed” with the Commission or “soliciting material” under the Securities Exchange Act of 1934 and shall not be incorporated by reference into any such filings.
The following graph compares the cumulative 5-year total return attained by stockholders on our common stock relative to the cumulative total returns of the S&P 500 Index and the Philadelphia Semiconductor Index (PHLX). The graph tracks the performance of a $100 investment in our common stock and in each of the indices (with the reinvestment of all dividends) from June 30, 2015 to June 30, 2020.
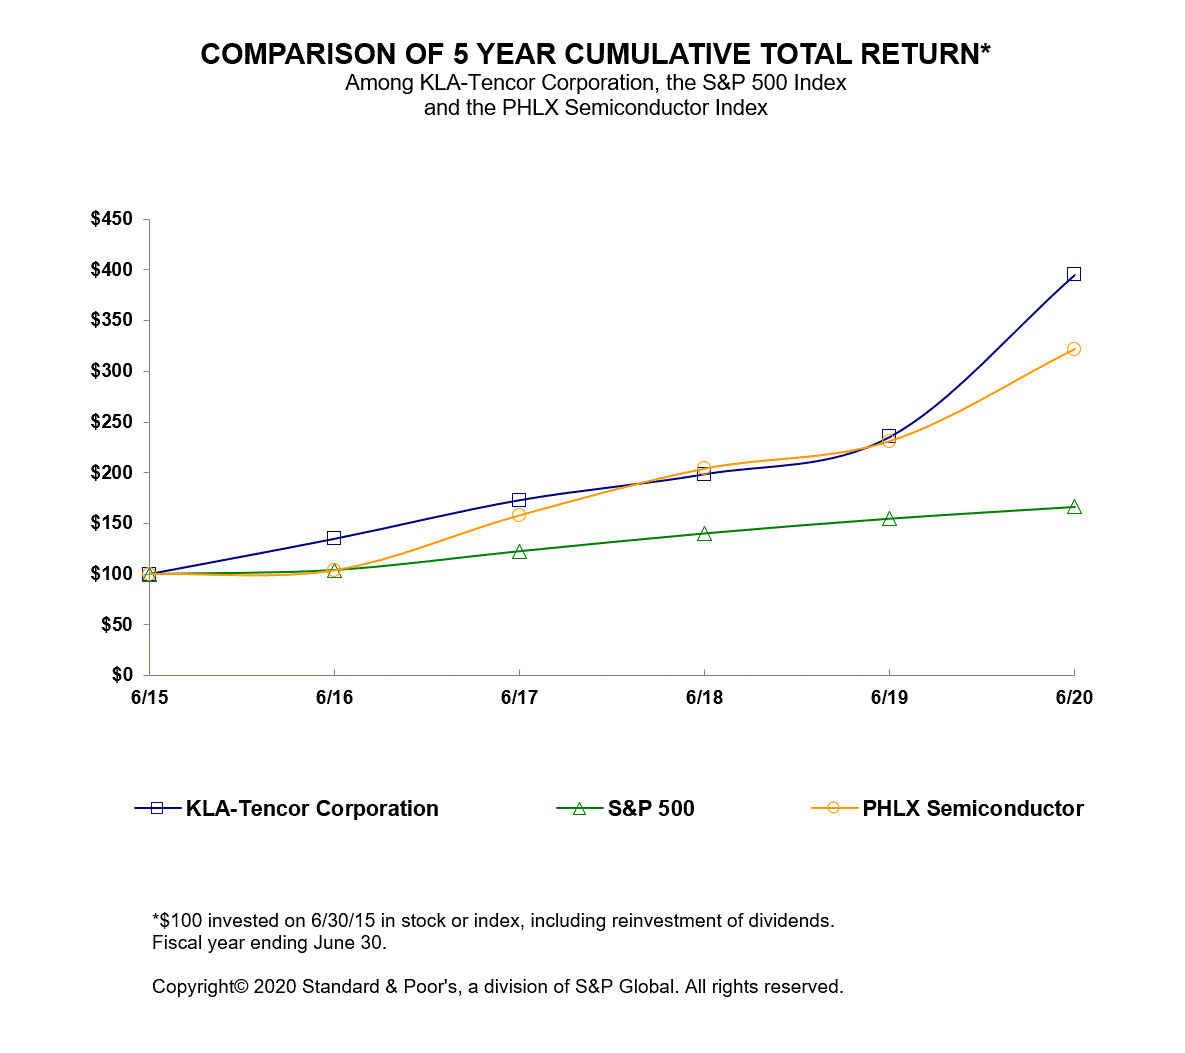
| June 2015 | June 2016 | June 2017 | June 2018 | June 2019 | June 2020 | ||||||||||||||||||||||||||||||
| KLA Corporation | $100.00 | $134.78 | $172.89 | $198.49 | $235.36 | $395.31 | |||||||||||||||||||||||||||||
| S&P 500 | $100.00 | $103.99 | $122.60 | $140.23 | $154.83 | $166.45 | |||||||||||||||||||||||||||||
| PHLX Semiconductor | $100.00 | $103.77 | $157.95 | $203.93 | $231.07 | $321.96 |
Our fiscal year ends June 30. The comparisons in the graph above are based upon historical data and are not necessarily indicative of, nor intended to forecast, future stock price performance.
Previous: Item 4. MINE SAFETY DISCLOSURES · Next: Item 6. SELECTED FINANCIAL DATA