 filings.tools
Item 5. MARKET FOR REGISTRANT’S COMMON EQUITY, RELATED STOCKHOLDER MATTERS AND ISSUER PURCHASES OF EQUITY SECURITIES
6K characters. Original on sec.gov · Markdown
Item 5. MARKET FOR REGISTRANT’S COMMON EQUITY, RELATED STOCKHOLDER MATTERS AND ISSUER PURCHASES OF EQUITY SECURITIES
The principal United States market in which the Company’s common stock is listed and traded is the New York Stock Exchange and the corresponding trading symbol is “KO.”
While we have historically paid dividends to holders of our common stock on a quarterly basis, the declaration and payment of future dividends will depend on many factors, including, but not limited to, our earnings, financial condition, business development needs and regulatory considerations, and are at the discretion of our Board of Directors.
As of February 17, 2023, there were 187,325 shareowner accounts of record. This figure does not include a substantially greater number of “street name” holders or beneficial holders of our common stock, whose shares are held of record by banks, brokers and other financial institutions.
The information under the subheading “Equity Compensation Plan Information” under the principal heading “Compensation” in the Company’s Proxy Statement for the 2023 Annual Meeting of Shareowners (“Company’s 2023 Proxy Statement”), to be filed with the SEC, is incorporated herein by reference.
During the year ended December 31, 2022, no equity securities of the Company were sold by the Company that were not registered under the Securities Act of 1933, as amended.
The following table presents information with respect to purchases of common stock of the Company made during the three months ended December 31, 2022 by the Company or any “affiliated purchaser” of the Company as defined in Rule 10b-18(a)(3) under the Exchange Act:
| Period | Total Number of Shares Purchased | 1 | Average Price Paid Per Share | Total Number of Shares Purchased as Part of the Publicly Announced Plan | 2 | Maximum Number of Shares That May Yet Be Purchased Under the Publicly Announced Plan | ||||||||||||||
| October 1, 2022 through October 28, 2022 | 2,142 | $ | 55.18 | — | 139,705,526 | |||||||||||||||
| October 29, 2022 through November 25, 2022 | — | — | — | 139,705,526 | ||||||||||||||||
| November 26, 2022 through December 31, 2022 | 94,298 | 63.46 | — | 139,705,526 | ||||||||||||||||
| Total | 96,440 | $ | 63.28 | — |
1The total number of shares purchased includes: (1) shares purchased, if any, pursuant to the 2019 Plan described in footnote 2 below, and (2) shares surrendered, if any, to the Company to pay the exercise price and/or to satisfy tax withholding obligations in connection with so-called stock swap exercises of employee stock options and/or the vesting of restricted stock issued to employees.
2In February 2019, the Company publicly announced that our Board of Directors had authorized a plan (“2019 Plan”) for the Company to purchase up to 150 million shares of our common stock. This column discloses the number of shares purchased, if any, pursuant to the 2019 Plan during the indicated time periods (including shares purchased pursuant to the terms of preset trading plans meeting the requirements of Rule 10b5-1 under the Exchange Act).
Performance Graph
Comparison of Five-Year Cumulative Total Shareowner Return
Among The Coca-Cola Company, the Prior Peer Group,
the Dow Jones Food & Beverage Total Return Index and the S&P 500 Index
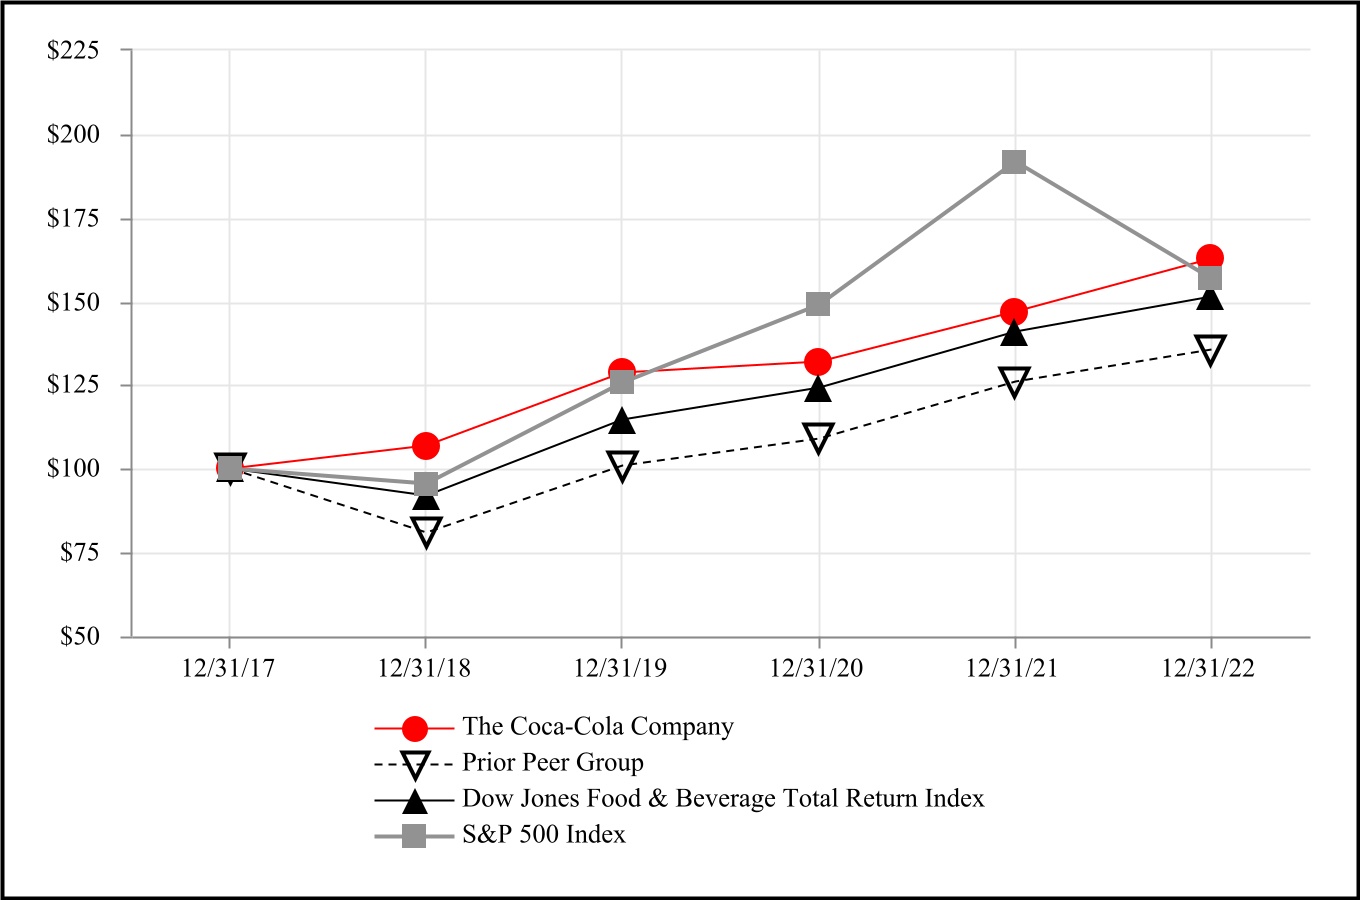
| December 31, | 2017 | 2018 | 2019 | 2020 | 2021 | 2022 | ||||||||||||||
| The Coca-Cola Company | $ | 100 | $ | 107 | $ | 129 | $ | 132 | $ | 147 | $ | 163 | ||||||||
| Prior Peer Group | 100 | 81 | 101 | 109 | 126 | 136 | ||||||||||||||
| Dow Jones Food & Beverage Total Return Index | 100 | 92 | 115 | 124 | 141 | 151 | ||||||||||||||
| S&P 500 Index | 100 | 96 | 126 | 149 | 192 | 157 |
The total shareowner return is based on a $100 investment on December 31, 2017 and assumes that dividends were reinvested on the day of issuance.
To better align with the Company’s direct competitors, the Company has chosen to change the peer group for the performance graph above. A self-constructed peer group (“Prior Peer Group”), which consisted of the companies included in the Dow Jones Food & Beverage Index (from which the Company has been excluded) and the Dow Jones Tobacco Index, was replaced with the Dow Jones Food & Beverage Total Return Index. Accordingly, the performance graph presents the total shareowner return for both the Prior Peer Group and the Dow Jones Food & Beverage Total Return Index.
In 2022, the Prior Peer Group consisted of the following companies: Altria Group, Inc., Archer Daniels Midland Company, The Boston Beer Company, Inc., Brown-Forman Corporation, Bunge Limited, Campbell Soup Company, Celsius Holdings, Inc., ConAgra Brands, Inc., Constellation Brands, Inc., Darling Ingredients Inc., Flowers Foods, Inc., General Mills, Inc., The Hershey Company, Hormel Foods Corporation, Ingredion Incorporated, Kellogg Company, Keurig Dr Pepper Inc., The Kraft Heinz Company, Lamb Weston Holdings, Inc., Lancaster Colony Corporation, McCormick & Company, Incorporated, Molson Coors Brewing Company, Mondelēz International, Inc., Monster Beverage Corporation, National Beverage Corp., PepsiCo, Inc., Performance Food Group Company, Philip Morris International Inc., Pilgrim’s Pride Corporation, Post Holdings, Inc., Seaboard Corporation, The J.M. Smucker Company, Tyson Foods, Inc. and US Foods Holding Corp.
Companies included in the Dow Jones Food & Beverage Index and the Dow Jones Tobacco Index change periodically. As a result, in 2022, Celsius Holdings, Inc. was added to the Prior Peer Group, and Beyond Meat, Inc., Freshpet Inc., The Hain Celestial Group, Inc. and Herbalife Nutrition Ltd. were removed from the Prior Peer Group.
Previous: Item 4. MINE SAFETY DISCLOSURES · Next: Item 6. RESERVED