 filings.tools
Loews 10-K 2018-12-31
Filed 2019-02-13. 22 sections, 761K characters. Original on sec.gov · Markdown · JSON
Cover and table of contents
10-K 1 d685868d10k.htm 10-K
UNITED STATES
SECURITIES AND EXCHANGE COMMISSION
WASHINGTON, D.C. 20549
FORM 10-K
[X] ANNUAL REPORT PURSUANT TO SECTION 13 OR 15(d) OF
THE SECURITIES EXCHANGE ACT OF 1934
For the Fiscal Year Ended December 31, 2018
OR
[ ] TRANSITION REPORT PURSUANT TO SECTION 13 OR 15(d)
OF THE SECURITIES EXCHANGE ACT OF 1934
For the Transition Period From to
Commission File Number 1-6541
LOEWS CORPORATION
(Exact name of registrant as specified in its charter)
| Delaware | 13-2646102 | |
| (State or other jurisdiction of | (I.R.S. Employer | |
| incorporation or organization) | Identification No.) |
667 Madison Avenue, New York, N.Y. 10065-8087
(Address of principal executive offices) (Zip Code)
(212) 521-2000
(Registrant’s telephone number, including area code)
Securities registered pursuant to Section 12(b) of the Act:
| Title of each class | Name of each exchange on which registered | |
| Common Stock, par value $0.01 per share | New York Stock Exchange |
Securities registered pursuant to Section 12(g) of the Act: None
Indicate by check mark if the registrant is a well-known seasoned issuer, as defined in Rule 405 of the Securities Act.
| Yes X | No |
Indicate by check mark if the registrant is not required to file reports pursuant to Section 13 or Section 15(d) of the Act.
| Yes | No X |
Indicate by check mark whether the registrant (1) has filed all reports required to be filed by Section 13 or 15 (d) of the Securities Exchange Act of 1934 during the preceding 12 months (or for such shorter period that the registrant was required to file such reports), and (2) has been subject to such filing requirements for the past 90 days.
| Yes X | No |
Indicate by check mark whether the registrant has submitted electronically every Interactive Data File required to be submitted pursuant to Rule 405 of Regulation S-T during the preceding 12 months (or for such shorter period that the registrant was required to submit such files).
| Yes X | No |
Indicate by check mark if disclosure of delinquent filers pursuant to Item 405 of Regulation S-K is not contained herein, and will not be contained, to the best of registrant’s knowledge, in definitive proxy or information statements incorporated by reference in Part III of this Form 10-K or any amendment to this Form 10-K. [ ].
Indicate by check mark whether the registrant is a large accelerated filer, an accelerated filer, a non-accelerated filer, a smaller reporting company, or an emerging growth company. See the definitions of “large accelerated filer,” “accelerated filer,” “smaller reporting company,” and “emerging growth company” in Rule 12b-2 of the Exchange Act.
| Large accelerated filer X Accelerated filer Non-accelerated filer Smaller reporting company |
| Emerging growth company |
If an emerging growth company, indicate by check mark if the registrant has elected not to use the extended transition period for complying with any new or revised financial accounting standards provided pursuant to Section 13(a) of the Exchange Act.
Indicate by check mark whether the registrant is a shell company (as defined in Rule 12b-2 of the Exchange Act).
| Yes | No X |
The aggregate market value of common stock held by non-affiliates of the registrant as of June 29, 2018, the last business day of the registrant’s most recently completed second fiscal quarter, was approximately $13,382,000,000.
As of February 1, 2019, there were 311,299,326 shares of the registrant’s common stock outstanding.
Documents Incorporated by Reference:
Portions of the registrant’s definitive proxy statement for the 2019 annual meeting of shareholders intended to be filed by the registrant with the Commission not later than 120 days after the close of its fiscal year are incorporated by reference into Part III of this Report.
LOEWS CORPORATION
INDEX TO ANNUAL REPORT ON
FORM 10-K FILED WITH THE
SECURITIES AND EXCHANGE COMMISSION
For the Year Ended December 31, 2018
PART I
Item 1. Business.
Loews Corporation was incorporated in 1969 and is a holding company. Our subsidiaries are engaged in the following lines of business:
| 🌑 | commercial property and casualty insurance (CNA Financial Corporation, a 89% owned subsidiary); |
|---|
| 🌑 | operation of offshore oil and gas drilling rigs (Diamond Offshore Drilling, Inc., a 53% owned subsidiary); |
|---|
| 🌑 | transportation and storage of natural gas and natural gas liquids (Boardwalk Pipeline Partners, LP, a wholly owned subsidiary); |
|---|
| 🌑 | operation of a chain of hotels (Loews Hotels Holding Corporation, a wholly owned subsidiary); and |
|---|
| 🌑 | manufacture of rigid plastic packaging solutions (Consolidated Container Company LLC, a 99% owned subsidiary). |
|---|
Unless the context otherwise requires, references in this Report to “Loews Corporation,” “the Company,” “Parent Company,” “we,” “our,” “us” or like terms refer to the business of Loews Corporation excluding its subsidiaries.
On June 29, 2018, Boardwalk GP, LP (“General Partner”), the general partner of Boardwalk Pipeline Partners LP and an indirect wholly owned subsidiary of the Company, elected to exercise its right to purchase all of the issued and outstanding common units representing limited partnership interests in Boardwalk Pipeline Partners LP not already owned by the General Partner or its affiliates pursuant to Section 15.1(b) of Boardwalk Pipeline Partners LP’s Third Amended and Restated Agreement of Limited Partnership, as amended (“Limited Partnership Agreement”). On July 18, 2018, the General Partner completed the transaction for a cash purchase price, determined in accordance with the Limited Partnership Agreement, of $12.06 per unit, or approximately $1.5 billion, in the aggregate. For further information on this transaction, see Note 2 of the Notes to the Consolidated Financial Statements, included under Item 8.
We have five reportable segments comprised of CNA Financial Corporation, Diamond Offshore Drilling, Inc., Boardwalk Pipeline Partners, LP, Loews Hotels Holding Corporation and the Corporate segment. The operations of Consolidated Container since the acquisition date in the second quarter of 2017 are included in the Corporate segment. Each of our operating subsidiaries is headed by a chief executive officer who is responsible for the operation of its business and has the duties and authority commensurate with that position. Additional financial information on each of our segments is included under Item 7, Management’s Discussion and Analysis of Financial Condition and Results of Operations (“MD&A”).
CNA FINANCIAL CORPORATION
CNA Financial Corporation (together with its subsidiaries, “CNA”) is an insurance holding company. CNA’s property and casualty and remaining life and group insurance operations are primarily conducted by Continental Casualty Company (“CCC”), The Continental Insurance Company, Western Surety Company, CNA Insurance Company Limited and Hardy Underwriting Bermuda Limited and its subsidiaries (“Hardy”). CNA accounted for 72.0%, 69.8% and 71.6% of our consolidated total revenue for the years ended December 31, 2018, 2017 and 2016.
CNA’s insurance products primarily include commercial property and casualty coverages, including surety. CNA’s services include warranty, risk management, information services, and claims administration. CNA’s products and services are primarily marketed through independent agents, brokers and managing general underwriters to a wide variety of customers, including small, medium and large businesses, insurance companies, associations, professionals and other groups.
Property & Casualty Operations
CNA’s commercial property and casualty insurance operations (“Property & Casualty Operations”) includes its Specialty, Commercial and International lines of business.
Specialty
Specialty provides management and professional liability and other coverages through property and casualty products and services using a network of brokers, independent agencies and managing general underwriters. Specialty includes the following business groups:
Management & Professional Liability: Management & Professional Liability consists of the following coverages and products:
| 🌑 | professional liability coverages and risk management services to various professional firms, including architects, real estate agents, accounting firms and law firms; |
|---|
| 🌑 | directors and officers (“D&O”), employment practices, fiduciary and fidelity coverages. Specific areas of focus include small and mid-size firms, public as well as privately held firms and not-for-profit organizations; |
|---|
| 🌑 | insurance products to serve the health care industry including professional and general liability as well as associated standard property and casualty coverages. Key customer groups include aging services, allied medical facilities, dentists, physicians, hospitals, nurses and other medical practitioners. |
|---|
Surety: Surety offers small, medium and large contract and commercial surety bonds. Surety provides surety and fidelity bonds in all 50 states.
Warranty and Alternative Risks: Warranty and Alternative Risks provides extended service contracts and insurance products that provide protection from the financial burden associated with mechanical breakdown and other related losses, primarily for vehicles, portable electronic communication devices and other consumer goods. Service contracts are generally distributed by commission-based independent representatives and sold by auto dealerships and retailers in North America to customers in conjunction with the purchase of a new or used vehicle or new consumer goods. Additionally, CNA’s insurance companies may issue contractual liability insurance policies or guaranteed asset protection reimbursement insurance policies to cover the liabilities of these service contracts issued by affiliated entities or third parties.
Commercial
Commercial works with a network of brokers and independent agents to market a broad range of property and casualty insurance products and services to small, middle-market and large businesses. Property products include standard and excess property, marine and boiler and machinery coverages. Casualty products include standard casualty insurance products such as workers’ compensation, general and product liability, commercial auto and umbrella coverages. Most insurance programs are provided on a guaranteed cost basis; however, CNA also offers specialized loss-sensitive insurance programs and total risk management services relating to claim and information services to the large commercial insurance marketplace. These property and casualty products are offered through CNA’s Middle Market, Small Business and Other Commercial insurance groups.
International
International underwrites property and casualty coverages on a global basis through its United Kingdom-based insurance company, a branch operation in Canada as well as through its presence at Lloyd’s of London (“Lloyd’s”) through Hardy Syndicate 382. Effective January 1, 2019, European Economic Area (“EEA”) business will be written through a Luxembourg-based insurance company. Underwriting activities are managed through three business units that operate across all locations: Property, Energy & Marine, Casualty and Specialty and managed from headquarters in London.
Property & Casualty Structure
CNA’s Property & Casualty Operations field structure in the United States of America (“U.S.”) consists of 49 underwriting locations. In addition, there are five centralized processing operations which handle policy processing, billing and collection activities and also act as call centers to optimize service. CNA’s claim presence consists of six primary locations where it handles multiple claim types and key business functions. Additionally, regional claim offices are aligned with CNA’s underwriting field structure. CNA also has a presence in Canada and Europe consisting of 17 branch operations and access to business placed at Lloyd’s through Hardy.
Other Insurance Operations
Other Insurance Operations include CNA’s long term care business that is in run-off, certain corporate expenses, including interest on CNA corporate debt, and certain property and casualty businesses in run-off, including CNA Re and asbestos and environmental pollution (“A&EP”).
Other
Competition: The property and casualty insurance industry is highly competitive both as to rate and service. CNA competes with a large number of stock and mutual insurance companies and other entities for both distributors and customers. Insurers compete on the basis of factors including products, price, services, ratings and financial strength. Accordingly, CNA must continuously allocate resources to refine and improve its insurance products and services. CNA is one of the largest commercial property and casualty insurance companies in the U.S.
Current Regulation: The insurance industry is subject to comprehensive and detailed regulation and supervision. Regulatory oversight by applicable agencies is exercised through review of submitted filings and information, examinations (both financial and market conduct), direct inquiries and interviews. Each domestic and foreign jurisdiction has established supervisory agencies with broad administrative powers relative to licensing insurers and agents, approving policy forms, establishing reserve requirements, prescribing the form and content of statutory financial reports and regulating capital adequacy and the type, quality and amount of investments permitted. Such regulatory powers also extend to corporate governance requirements, risk management practices and disclosures and premium rate regulations requiring rates not be excessive, inadequate or unfairly discriminatory. In addition to regulation of dividends by insurance subsidiaries, intercompany transfers of assets or payments may be subject to prior notice or approval by insurance regulators, depending on the size of such transfers and payments in relation to the financial position of the insurance subsidiaries making the transfers or payments.
As CNA’s insurance operations are conducted in both domestic and foreign jurisdictions, CNA is subject to a number of regulatory agency requirements applicable to a portion, or all, of CNA’s operations. These include but are not limited to, the State of Illinois Department of Insurance (which is CNA’s global group-wide supervisor), the U.K. Prudential Regulatory Authority and Financial Conduct Authority, the Office of Superintendent of Financial Institutions of Canada and the Bermuda Monetary Authority.
Domestic insurers are also required by state insurance regulators to provide coverage to certain insureds who would not otherwise be considered eligible by the insurers. Each state dictates the types of insurance and the level of coverage that must be provided to such involuntary risks. CNA’s share of these involuntary risks is mandatory and generally a function of its respective share of the voluntary market by line of insurance in each state.
Further, domestic insurance companies are subject to state guaranty fund and other insurance-related assessments. Guaranty funds are governed by state insurance guaranty associations which levy assessments to meet the funding needs of insolvent insurer estates. Other insurance-related assessments are generally levied by state agencies to fund various organizations including disaster relief funds, rating bureaus, insurance departments, and workers’ compensation second injury funds, or by industry organizations that assist in the statistical analysis and ratemaking process and CNA has the ability to recoup certain of these assessments from policyholders.
Although the U.S. federal government does not currently directly regulate the business of insurance, federal legislative and regulatory initiatives can affect the insurance industry. These initiatives and legislation include proposals relating to terrorism and natural catastrophe exposures, cybersecurity risk management, federal financial services reforms and certain tax reforms.
The Terrorism Risk Insurance Program Reauthorization Act of 2015 provides for a federal government backstop for insured terrorism risks through 2020. The mitigating effect of such law is part of the analysis of CNA’s overall risk posture for terrorism and, accordingly, CNA’s risk positioning may change if such law were modified.
CNA also continues to invest in the security of its systems and network on an enterprise-wide basis. This requires investment of a significant amount of resources by CNA on an ongoing basis. Potential implications of possible cybersecurity legislation on such current investment, if any, are uncertain.
The foregoing laws, regulations and proposals, either separately or in the aggregate, create a regulatory and legal environment that may require changes in CNA’s business plan or significant investment of resources in order to operate in an effective and compliant manner.
Additionally, various legislative and regulatory efforts to reform the tort liability system have, and will continue to, affect the industry. Although there has been some tort reform with positive impact to the insurance industry, new causes of action and theories of damages continue to be proposed in court actions and by federal and state legislatures that continue to expand liability for insurers and their policyholders.
Hardy, a specialized Lloyd’s underwriter, is also supervised by the Council of Lloyd’s, which is the franchisor for all Lloyd’s operations. The Council of Lloyd’s has wide discretionary powers to regulate Lloyd’s underwriting, such as establishing the capital requirements for syndicate participation. In addition, the annual business plan of each syndicate is subject to the review and approval of the Lloyd’s Franchise Board, which is responsible for business planning and monitoring for all syndicates.
Capital adequacy and risk management regulations, referred to as Solvency II, apply to CNA’s European operations and are enacted by the European Commission, the executive body of the European Union (“E.U.”). Additionally, the International Association of Insurance Supervisors (“IAIS”) continues to consider regulatory proposals addressing group supervision, capital requirements and enterprise risk management.
Regulation Outlook: The IAIS has developed a Common Framework for the Supervision of Internationally Active Insurance Groups (“ComFrame”) which is focused on the effective group-wide supervision of internationally active insurance groups, such as CNA. As part of ComFrame, the IAIS is developing an international capital standard for insurance groups. While the details of ComFrame including a global group capital standard and its applicability to CNA are uncertain at this time, certain jurisdictional regulatory regimes are subject to revision in response to these global developments.
There have also been definitive developments with respect to prudential insurance supervision unrelated to the IAIS activities. On September 22, 2017, the U.S. Treasury Department, the U.S. Trade Representative (“USTR”) and the E. U. announced they had formally signed a covered agreement on Prudential Measures Regarding Insurance and Reinsurance (“U.S.-E.U. Covered Agreement”). The U.S.-E.U. Covered Agreement requires U.S. states to prospectively eliminate the requirement that domestic insurance companies must obtain collateral from E.U. reinsurance companies that are not licensed in their state (alien reinsurers) in order to obtain reserve credit under statutory accounting. In exchange, the E.U. will not impose local presence requirements on U.S. firms operating in the E.U., and effectively must defer to U.S. group capital regulation for these firms. On December 18, 2018, the U.S. Treasury Department, the USTR, and the United Kingdom (“U.K.”) announced they formally signed the Bilateral Agreement on Prudential Measures Regarding Insurance and Reinsurance (“U.S.-U.K. Covered Agreement”). This Agreement has similar terms as the U.S.-E.U. Covered Agreement, and will become effective upon the U.K.’s exit from the E.U.
Because these covered agreements are not self-executing, U.S. state laws will need to be revised to change reinsurance collateral requirements to conform to the provisions within each of the agreements. Before any such revision to state laws can be advanced, the National Association of Insurance Commissioners (“NAIC”) must develop a new approach for determination of the appropriate reserve credit under statutory accounting for E.U. and U.K. based alien reinsurers. In addition, the NAIC is currently developing an approach to group capital regulation as the current U.S. regulatory regime is based on legal entity regulation. Both the reinsurance collateral requirement change and adoption of group capital regulation must be effected by the states within five years from the signing of the Covered Agreements, or states risk federal preemption. CNA will monitor the modification of state laws and regulations in order to comply with the provisions of the Covered Agreements and assess potential effects on its operations and prospects.
Properties: CNA’s principal executive offices are based in Chicago, Illinois. CNA’s subsidiaries maintain office space in various cities throughout the United States and various countries. CNA leases all of its office space.
DIAMOND OFFSHORE DRILLING, INC.
Diamond Offshore Drilling, Inc. (together with its subsidiaries, “Diamond Offshore”) provides contract drilling services to the energy industry around the world with a fleet of 17 offshore drilling rigs consisting of four drillships and 13 semisubmersible rigs. Diamond Offshore accounted for 7.8%, 10.9% and 12.1% of our consolidated total revenue for the years ended December 31, 2018, 2017 and 2016.
A floater rig is a type of mobile offshore drilling rig that floats and does not rest on the seafloor. This asset class includes self-propelled drillships and semisubmersible rigs. Semisubmersible rigs are comprised of an upper working and living deck resting on vertical columns connected to lower hull members. Such rigs operate in a “semi-submerged” position, remaining afloat, off bottom, in a position in which the lower hull is approximately 55 feet to 90 feet below the water line and the upper deck protrudes well above the surface. Semisubmersibles hold position while drilling by use of a series of small propulsion units or thrusters that provide dynamic positioning (“DP”) to keep the rig on location, or with anchors tethered to the seabed. Although DP semisubmersibles are self-propelled, such rigs may be moved long distances with the assistance of tug boats. Non-DP, or moored, semisubmersibles require tug boats or the use of a heavy lift vessel to move between locations.
A drillship is an adaptation of a maritime vessel that is designed and constructed to carry out drilling operations by means of a substructure with a moon pool centrally located in the hull. Drillships are typically self-propelled and are positioned over a drillsite through the use of a DP system similar to those used on semisubmersible rigs.
Fleet Enhancements and Additions: Diamond Offshore’s long-term strategy is to upgrade its fleet to meet customer demand for advanced, efficient and high-tech rigs by acquiring or building new rigs when possible to do so at attractive prices. Diamond Offshore’s most recent fleet enhancement cycle was completed in 2016 with the delivery of the Ocean GreatWhite. During 2018, Diamond Offshore began reactivation of the Ocean Endeavor. The rig is currently in the U.K., where it is completing its reactivation and is undergoing contract preparation activities in advance of its upcoming contract in the second quarter of 2019. In addition, in late 2018, Diamond Offshore initiated the reactivation and upgrade of the Ocean Onyx to increase the rig’s marketability by expanding its lower deck load, reducing rig motion response and making other technologically desirable enhancements sought by Diamond Offshore’s customers. The Ocean Onyx has been moved to Singapore, where Diamond Offshore expects its upgrade to be completed in the later part of 2019.
Diamond Offshore continues to evaluate further rig acquisition and enhancement opportunities as they arise. However, Diamond Offshore can provide no assurance whether, or to what extent, it will continue to make rig acquisitions or enhancements to its fleet.
Markets: The principal markets for Diamond Offshore’s contract drilling services are:
| 🌑 | the Gulf of Mexico, including the U.S. and Mexico; |
|---|
| 🌑 | South America, principally offshore Brazil and Trinidad and Tobago; |
|---|
| 🌑 | Australia and Southeast Asia, including Malaysia, Indonesia, Myanmar and Vietnam; |
|---|
| 🌑 | Europe, principally offshore the U.K. and Norway; |
|---|
| 🌑 | East and West Africa; and |
|---|
| 🌑 | the Mediterranean. |
|---|
Drilling Contracts: Diamond Offshore’s contracts to provide offshore drilling services vary in their terms and provisions. Diamond Offshore typically obtains its contracts through a competitive bid process, although it is not unusual for Diamond Offshore to be awarded drilling contracts following direct negotiations. Drilling contracts generally provide for a basic dayrate regardless of whether or not drilling results in a productive well. Drilling contracts generally also provide for reductions in rates during periods when the rig is being moved or when drilling operations are interrupted or restricted by equipment breakdowns, adverse weather conditions or other circumstances. Under dayrate contracts, Diamond Offshore generally pays the operating expenses of the rig, including wages and the cost of incidental supplies. Historically, dayrate contracts have accounted for the majority of Diamond Offshore’s revenues. In addition, from time to time, Diamond Offshore’s dayrate contracts may also provide for the ability to earn an incentive bonus from its customer based upon performance.
The duration of a dayrate drilling contract is generally tied to the time required to drill a single well or a group of wells, which Diamond Offshore refers to as a well-to-well contract, or a fixed period of time, in what Diamond Offshore refers to as a term contract. Diamond Offshore’s drilling contracts may be terminated by the customer in the event the drilling rig is destroyed or lost or if drilling operations are suspended for an extended period of time as a result of a breakdown of equipment or, in some cases, due to events beyond the control of either party to the contract. Certain of Diamond Offshore’s contracts also permit the customer to terminate the contract early by giving notice; in most circumstances, this requires the payment of an early termination fee by the customer. The contract term in many instances may also be extended by the customer exercising options for the drilling of additional wells or for an additional length of time, generally subject to mutually agreeable terms and rates at the time of the extension. In periods of decreasing demand for offshore rigs, drilling contractors may prefer longer term contracts to preserve dayrates at existing levels and ensure utilization, while customers may prefer shorter contracts that allow them to more quickly obtain the benefit of declining dayrates. Moreover, drilling contractors may accept lower dayrates in a declining market in order to obtain longer-term contracts and add backlog.
Customers: Diamond Offshore provides offshore drilling services to a customer base that includes major and independent oil and gas companies and government-owned oil companies. During 2018, 2017 and 2016, Diamond Offshore performed services for 13, 14 and 18 different customers. During 2018, 2017 and 2016, Anadarko accounted for 34%, 25% and 22% of Diamond Offshore’s annual total consolidated revenues and Petróleo Brasileiro S.A. accounted for 16%, 19% and 18% of Diamond Offshore’s annual total consolidated revenues. During 2018 and 2017, Hess Corporation accounted for 25% and 16% of Diamond Offshore’s annual total consolidated revenues and BP accounted for 11% and 16% of Diamond Offshore’s annual total consolidated revenues. No other customer accounted for 10% or more of Diamond Offshore’s annual total consolidated revenues during 2018, 2017 or 2016.
As of January 1, 2019, Diamond Offshore’s contract backlog was $2.0 billion attributable to 12 customers. All four of its drillships are currently contracted to work in the U.S. Gulf of Mexico (“GOM”). As of January 1, 2019, contract backlog attributable to Diamond Offshore’s expected operations in the GOM was $471 million, $372 million, $217 million and $36 million for the years 2019, 2020, 2021 and 2022, all of which was attributable to three customers.
Competition: Based on industry data as of the date of this Report, there are approximately 760 mobile drilling rigs in service worldwide, including approximately 240 floater rigs. Despite consolidation in previous years, the offshore contract drilling industry remains highly competitive with numerous industry participants, none of which at the present time has a dominant market share. Some of Diamond Offshore’s competitors may have greater financial or other resources than it does.
Drilling contracts are traditionally awarded on a competitive bid basis. Price is typically the primary factor in determining which qualified contractor is awarded a job. Customers may also consider rig availability and location, a drilling contractor’s operational and safety performance record, and condition and suitability of equipment. Diamond Offshore believes it competes favorably with respect to these factors.
Diamond Offshore competes on a worldwide basis, but competition may vary significantly by region at any particular time. Competition for offshore rigs generally takes place on a global basis, as these rigs are highly mobile and may be moved, although at a cost that may be substantial, from one region to another. It is characteristic of the offshore drilling industry to move rigs from areas of low utilization and dayrates to areas of greater activity and relatively higher dayrates. The current oversupply of offshore drilling rigs also intensifies price competition.
Governmental Regulation: Diamond Offshore’s operations are subject to numerous international, foreign, U.S., state and local laws and regulations that relate directly or indirectly to its operations, including regulations controlling the discharge of materials into the environment, requiring removal and clean-up under some circumstances, or otherwise relating to the protection of the environment, and may include laws or regulations pertaining to climate change, carbon emissions or energy use.
Properties: Diamond Offshore owns an office building in Houston, Texas, where its corporate headquarters are located, and offices and other facilities in New Iberia, Louisiana, Aberdeen, Scotland, Macae, Brazil and Ciudad del Carmen, Mexico. Additionally, Diamond Offshore currently leases various office, warehouse and storage facilities in Australia, Louisiana, Malaysia, Singapore and the U.K. to support its offshore drilling operations.
BOARDWALK PIPELINE PARTNERS, LP
Boardwalk Pipeline Partners, LP (together with its subsidiaries, “Boardwalk Pipeline”) is engaged in the business of natural gas and natural gas liquids and hydrocarbons (herein referred to together as “NGLs”) transportation and storage. Boardwalk Pipeline accounted for 8.7%, 9.6% and 10.0% of our consolidated total revenue for the years ended December 31, 2018, 2017 and 2016.
A wholly owned subsidiary of ours, Boardwalk Pipelines Holding Corp. (“BPHC”) owns, directly and indirectly, the General Partner interest and all of the limited partnership interests of Boardwalk Pipeline.
Boardwalk Pipeline owns and operates approximately 13,805 miles of interconnected natural gas pipelines directly serving customers in 13 states and indirectly serving customers throughout the northeastern and southeastern U.S. through numerous interconnections with unaffiliated pipelines. Boardwalk Pipeline also owns and operates approximately 425 miles of NGL pipelines in Louisiana and Texas. In 2018, its pipeline systems transported approximately 2.7 trillion cubic feet of natural gas and approximately 70.8 million barrels (“MMBbls”) of NGLs. Average daily throughput on Boardwalk Pipeline’s natural gas pipeline systems during 2018 was approximately 7.3 billion cubic feet (“Bcf”). Boardwalk Pipeline’s natural gas storage facilities are comprised of 14 underground storage fields located in four states with aggregate working gas capacity of approximately 205.0 Bcf and Boardwalk Pipeline’s NGL storage facilities consist of 11 salt dome storage caverns located in Louisiana with an aggregate storage capacity of approximately 31.8 MMBbls. Boardwalk Pipeline also owns five salt dome caverns and related brine infrastructure for use in providing brine supply services and to support the NGL storage operations.
Boardwalk Pipeline’s pipeline and storage systems are described below:
The Gulf South Pipeline Company, LP (“Gulf South”) pipeline system runs approximately 7,190 miles along the Gulf Coast in the states of Texas, Louisiana, Mississippi, Alabama and Florida. The pipeline system has a peak-day delivery capacity of 9.7 Bcf per day and average daily throughput for the year ended December 31, 2018 was 3.1 Bcf per day. Gulf South has ten natural gas storage facilities. The two natural gas storage facilities located in Louisiana and Mississippi have approximately 83.5 Bcf of working gas storage capacity and the eight salt dome natural gas storage caverns in Mississippi have approximately 46.0 Bcf of total storage capacity, of which approximately 29.6 Bcf is working gas capacity. Gulf South also owns undeveloped land which is suitable for up to five additional storage caverns.
The Texas Gas Transmission, LLC (“Texas Gas”) pipeline system runs approximately 5,975 miles and is located in Louisiana, East Texas, Arkansas, Mississippi, Tennessee, Kentucky, Indiana and Ohio with smaller diameter lines extending into Illinois. The pipeline system has a peak-day delivery capacity of 5.7 Bcf per day and average daily throughput for the year ended December 31, 2018 was 2.8 Bcf per day. Texas Gas owns nine natural gas storage fields with 84.3 Bcf of working gas storage capacity.
The Gulf Crossing Pipeline Company LLC (“Gulf Crossing”) pipeline system is located in Texas and runs approximately 375 miles into Louisiana. The pipeline system has a peak-day delivery capacity of 1.9 Bcf per day and average daily throughput for the year ended December 31, 2018 was 1.4 Bcf per day.
Boardwalk Louisiana Midstream, LLC and Boardwalk Petrochemical Pipeline, LLC (collectively “Louisiana Midstream”) provide transportation and storage services for natural gas, NGLs and ethylene, fractionation services for NGLs and brine supply services. These assets provide approximately 49.5 MMBbls of salt dome storage capacity, including approximately 7.6 Bcf of working natural gas storage capacity, significant brine supply infrastructure, and approximately 260 miles of pipeline assets. Louisiana Midstream owns and operates the Evangeline Pipeline (“Evangeline”), which is an approximately 175 mile interstate ethylene pipeline that is capable of transporting approximately 3.3 billion pounds of ethylene per year between Texas and Louisiana, where it interconnects with its ethylene distribution system. Throughput for Louisiana Midstream was 70.8 MMBbls for the year ended December 31, 2018.
Boardwalk Texas Intrastate, LLC (“Texas Intrastate”) provides intrastate natural gas transportation services on approximately 255 miles of pipeline located in South Texas. Texas Intrastate is situated to provide access to industrial and liquefied natural gas (“LNG”) export markets, proposed power plants and third-party pipelines for exports to Mexico.
Boardwalk Pipeline has been engaged in several growth projects. Since 2016, Boardwalk Pipeline has placed into service several growth projects that represent more than $1.5 billion of total capital expenditures and provide more than 2.9 Bcf of natural gas transportation capacity to producers, power plants and an LNG export facility. These projects include Boardwalk Pipeline’s Northern Supply Access, Coastal Bend Header, Sulphur Storage and Pipeline Expansion and a power plant project in Louisiana. Boardwalk Pipeline expects to spend approximately $480 million on its growth projects currently under construction through 2022 that are expected to serve increased demand from natural gas end-users such as power generation plants and industrials, as well as liquids demand from petrochemical facilities. Collectively, these projects represent more than 1.3 Bcf per day of natural gas transportation to end-users. These growth projects include three projects that will provide firm transportation services to new power plant customers, one each in Louisiana, Texas and Indiana. Boardwalk Pipeline is also progressing with the construction of several NGL growth projects that are expected to provide transportation and storage services and brine supply services to petrochemical and industrial customers in southern Louisiana. All of Boardwalk Pipeline’s growth projects are secured by long-term firm contracts.
Customers: Boardwalk Pipeline serves a broad mix of customers, including producers of natural gas, and with end-use customers, including local distribution companies, marketers, electric power generators, industrial users and interstate and intrastate pipelines who, in turn, provide transportation and storage services for end-users. These customers are located throughout the Gulf Coast, Midwest and Northeast regions of the U.S.
Competition: Boardwalk Pipeline competes with numerous other pipelines that provide transportation, storage and other services at many locations along its pipeline systems. Boardwalk Pipeline also competes with pipelines that are attached to natural gas supply sources that are closer to some of its traditional natural gas market areas. In addition, regulators’ continuing efforts to increase competition in the natural gas industry have increased the natural gas transportation options of Boardwalk Pipeline’s traditional customers. For example, as a result of regulators’ policies, capacity segmentation and capacity release have created an active secondary market which increasingly competes with Boardwalk Pipeline’s natural gas pipeline services. Further, natural gas competes with other forms of energy available to Boardwalk Pipeline’s customers, including electricity, coal, fuel oils and alternative fuel sources.
The principal elements of competition among pipelines are availability of capacity, rates, terms of service, access to gas supplies, flexibility and reliability of service. In many cases, the elements of competition, in particular, flexibility, terms of service and reliability, are key differentiating factors between competitors. This is especially the case with capacity being sold on a longer term basis. Boardwalk Pipeline is focused on finding opportunities to enhance its competitive profile in these areas by increasing the flexibility of its pipeline systems, such as modifying them to allow for bi-directional flows, to meet the demands of customers, such as power generators and industrial users, and is continually reviewing its services and terms of service to offer customers enhanced service options.
Governmental Regulation: The Federal Energy Regulatory Commission (“FERC”) regulates Boardwalk Pipeline’s interstate natural gas operating subsidiaries under the Natural Gas Act of 1938 (“NGA”) and the Natural Gas Policy Act of 1978 (“NGPA”). The FERC regulates, among other things, the rates and charges for the transportation and storage of natural gas in interstate commerce and the extension, enlargement or abandonment of facilities under its jurisdiction. Where required, Boardwalk Pipeline’s natural gas pipeline subsidiaries hold certificates of public convenience and necessity issued by the FERC covering certain of their facilities, activities and services. The maximum rates that may be charged by Boardwalk Pipeline’s subsidiaries operating under the FERC’s jurisdiction, for all aspects of the natural gas transportation services they provide, are established through the FERC’s cost-based rate-making process. Key determinants in the FERC’s cost-based rate-making process are the costs of providing service, the volumes of gas being transported, the rate design, the allocation of costs between services, the capital structure and the rate of return a pipeline is permitted to earn. The maximum rates that may be charged by Boardwalk Pipeline for storage services on Texas Gas, with the exception of services associated with a portion of the working gas capacity on that system, are also established through the FERC’s cost-based rate-making process. The FERC has authorized Boardwalk Pipeline to charge market-based rates for its firm and interruptible storage services for the majority of its other natural gas storage facilities. None of Boardwalk Pipeline’s FERC-regulated entities currently have an obligation to file a new rate case and Gulf South is prohibited from filing a rate case until May 1, 2023, subject to certain exceptions. Texas Intrastate transports natural gas in intrastate commerce under the rules and regulations established by the Texas Railroad Commission and in interstate commerce that is subject to FERC jurisdiction under Section 311 of the NGPA. The maximum rates for services are established under Section 311 of the NGPA and are generally subject to review every five years by the FERC.
Boardwalk Pipeline is also regulated by the U.S. Department of Transportation (“DOT”) through the Pipeline and Hazardous Material Safety Administration (“PHMSA”) under the Natural Gas Pipeline Safety Act of 1968, as amended (“NGPSA”) and the Hazardous Liquids Pipeline Safety Act of 1979, as amended (“HLPSA”). The NGPSA and HLPSA govern the design, installation, testing, construction, operation, replacement and management of interstate natural gas and NGL pipeline facilities. Boardwalk Pipeline has authority from PHMSA to operate certain natural gas pipeline assets under issued permits with specific conditions that allow it to operate those pipeline assets at higher than normal operating pressures of up to 0.80 of the pipeline’s Specified Minimum Yield Strength (“SMYS”). Operating at these pressures allows these pipelines to transport all of the existing natural gas volumes Boardwalk Pipeline has contracted for with its customers. PHMSA retains discretion whether to grant or maintain authority for Boardwalk Pipeline to operate its natural gas pipeline assets at higher pressures and, in the event that PHSMA should elect not to allow Boardwalk Pipeline to operate at these higher pressures, it could affect its ability to transport all of its contracted quantities of natural gas on these pipeline assets, and Boardwalk Pipeline could incur significant additional costs to reinstate this authority or to develop alternate ways to meet its contractual obligations.
PHMSA’s regulations also require transportation pipeline operators to implement integrity management programs to comprehensively evaluate certain high risk areas, known as high consequence areas (“HCAs”) along Boardwalk Pipeline’s pipelines and take additional safety measures to protect people and property in these highly populated areas. Recent legislation has resulted in more stringent mandates for pipeline safety and has charged PHMSA with
developing and adopting regulations that impose increased pipeline safety requirements on pipeline operators. The NGPSA and HLPSA were amended by the Pipeline Safety, Regulatory Certainty, and Job Creation Act of 2011 (“2011 Act”). The 2011 Act increased the penalties for safety violations, established additional safety requirements for newly constructed pipelines and required studies of safety issues that could result in the adoption of new regulatory requirements by PHMSA for existing pipelines. In 2016, the NGPSA and HLPSA were amended by the Protecting Our Infrastructure of Pipelines and Enhancing Safety Act of 2016 (“2016 Act”), extending PHMSA’s statutory mandate through 2019 and, among other things, requiring PHMSA to complete certain of its outstanding mandates under the 2011 Act and developing new safety standards for natural gas storage facilities in 2018. Subsequently, in December of 2016, PHMSA published an interim final rule that addresses certain safety issues related to natural gas storage facilities, including wells, wellbore tubing and casing. However, in June of 2017, PHMSA temporarily suspended specified enforcement actions pertaining to provisions of the December 2016 interim final rule, as PHMSA announced it would reconsider the interim final rule, and subsequently re-opened the rule to public comment in October of 2017. The rule has yet to be finalized. The 2016 Act also empowers PHMSA to address imminent hazards by imposing emergency restrictions, prohibitions and safety measures on owners and operators of gas or hazardous liquid pipeline facilities without prior notice or an opportunity for a hearing. PHMSA issued interim final regulations in 2016 to implement the agency’s expanded authority to address unsafe pipeline conditions or practices that pose an imminent hazard to life, property, or the environment. New legislation or any new regulations adopted by PHMSA may impose more stringent requirements applicable to integrity management programs and other pipeline safety aspects of Boardwalk Pipeline’s operations, which could cause it to incur increased capital and operating costs and operational delays. For example, in 2016, PHMSA published a proposed rulemaking that would impose new or more stringent requirements for certain natural gas pipelines including, among other things, expanding certain of PHMSA’s current regulatory safety programs for natural gas lines in newly defined “moderate consequence areas” that do not qualify as HCAs and requiring maximum allowable operating pressure validation through re-verification of all historical records for pipelines in service, which may require natural gas pipelines installed before 1970 (previously excluded from certain pressure testing obligations) to be pressure tested. PHMSA has split this proposed rule into three separate rulemaking proceedings and expects to publish these proceedings in 2019.
The Surface Transportation Board (“STB”) regulates the rates Boardwalk Pipeline charges for interstate service on its ethylene pipelines. The Louisiana Public Service Commission (“LPSC”) regulates the rates Boardwalk Pipeline charges for intrastate service within the state of Louisiana on its petrochemical and NGL pipelines. The STB and LPSC require that Boardwalk Pipeline’s transportation rates are reasonable and that its practices cannot unreasonably discriminate among its shippers.
Boardwalk Pipeline’s operations are also subject to extensive federal, state, and local laws and regulations relating to protection of the environment and occupational health and safety. Such laws and regulations impose, among other things, restrictions, liabilities and obligations in connection with the generation, handling, use, storage, transportation, treatment and disposal of hazardous substances and waste and in connection with spills, releases, discharges and emissions of various substances into the environment. Environmental regulations also require that Boardwalk Pipeline’s facilities, sites and other properties be operated, maintained, abandoned and reclaimed to the satisfaction of applicable regulatory authorities. Occupational health and safety regulations establish standards protective of workers, both generally and within the pipeline industry.
Many states where Boardwalk Pipeline operates also have, or are developing, similar environmental or occupational health and safety legal requirements governing many of the same types of activities and those requirements can be more stringent than those adopted under federal laws and regulations. Failure to comply with these federal, state and local laws and regulations may result in the assessment of administrative, civil and criminal penalties, the imposition of corrective or remedial obligations, the incurrence of capital expenditures, the occurrence of delays, denials or cancellations in permitting or the development or expansion of projects and the issuance of orders enjoining performance of some or all of Boardwalk Pipeline’s operations in the affected areas. Historically, Boardwalk Pipeline’s environmental compliance costs have not had a material adverse effect on its business, but there can be no assurance that continued compliance with existing requirements will not materially affect them, or that the current regulatory standards will not become more onerous in the future, resulting in more significant costs to maintain compliance or increased exposure to significant liabilities.
Properties: Boardwalk Pipeline is headquartered in approximately 103,000 square feet of leased office space located in Houston, Texas. Boardwalk Pipeline also leases approximately 60,000 square feet of office space in Owensboro, Kentucky. Boardwalk Pipeline’s operating subsidiaries own their respective pipeline systems in fee. However, substantial portions of these systems are constructed and maintained on property owned by others pursuant to rights-of-way, easements, permits, licenses or consents.
LOEWS HOTELS HOLDING CORPORATION
Loews Hotels Holding Corporation (together with its subsidiaries, “Loews Hotels & Co”) operates a chain of 24 hotels. Twelve of these hotels are owned by Loews Hotels & Co, eight are owned by joint ventures in which Loews Hotels & Co has equity interests and four are managed for unaffiliated owners. Loews Hotels & Co’s earnings are derived from the operation of its wholly owned hotels, its share of earnings in joint venture hotels and hotel management fees earned from both joint venture and managed hotels. Loews Hotels & Co accounted for 5.4%, 5.0% and 5.1% of our consolidated total revenue for the years ended December 31, 2018, 2017 and 2016. The hotels are described below.
| Number of | ||||
| Name and Location | Rooms | |||
| Owned: | ||||
| Loews Chicago Hotel, Chicago, Illinois | 400 | |||
| Loews Chicago O’Hare Hotel, Chicago, Illinois | 556 | |||
| Loews Coronado Bay Resort, San Diego, California (a) | 439 | |||
| Loews Hotel 1000, Seattle, Washington | 120 | |||
| Loews Hotel Vogue, Montreal, Canada | 142 | |||
| Loews Miami Beach Hotel, Miami Beach, Florida | 790 | |||
| Loews Minneapolis Hotel, Minneapolis, Minnesota | 251 | |||
| Loews Philadelphia Hotel, Philadelphia, Pennsylvania | 581 | |||
| Loews Regency New York Hotel, New York, New York (a) | 379 | |||
| Loews San Francisco Hotel, San Francisco, California | 155 | |||
| Loews Vanderbilt Hotel, Nashville, Tennessee | 340 | |||
| Loews Ventana Canyon Resort, Tucson, Arizona | 398 | |||
| Joint Venture: | ||||
| Hard Rock Hotel, at Universal Orlando, Orlando, Florida | 650 | |||
| Loews Atlanta Hotel, Atlanta, Georgia | 414 | |||
| Loews Hollywood Hotel, Hollywood, California | 628 | |||
| Loews Portofino Bay Hotel, at Universal Orlando, Orlando, Florida | 750 | |||
| Loews Royal Pacific Resort, at Universal Orlando, Orlando, Florida | 1,000 | |||
| Loews Sapphire Falls Resort, at Universal Orlando, Orlando, Florida | 1,000 | |||
| Universal’s Aventura Hotel, Orlando, Florida | 600 | |||
| Universal’s Cabana Bay Beach Resort, Orlando, Florida | 2,200 | |||
| Management Contract: | ||||
| Bisha Hotel and Residences, Toronto, Canada | 96 | |||
| Loews Boston Hotel, Boston, Massachusetts | 225 | |||
| Loews New Orleans Hotel, New Orleans, Louisiana | 285 | |||
| Loews Santa Monica Beach Hotel, Santa Monica, California | 347 |
| (a) | Owned hotels subject to a land lease. |
|---|
Competition: Competition from other hotels and lodging facilities is vigorous in all locations in which Loews Hotels & Co operates. The demand for hotel rooms is seasonal and dependent on general and local economic conditions. Loews Hotels & Co properties also compete with facilities offering similar services in locations other than those in which its hotels are located. Competition among hotels is based primarily on quality of location, facilities, price and service. Because of the competitive nature of the industry, hotels must continually make expenditures for updating, refurnishing and repairs and maintenance in order to prevent competitive obsolescence and remain competitive.
Recent Developments and Growth Projects:
| 🌑 | In 2018, Universal’s Aventura Hotel in Orlando Florida, a 600 guestroom hotel, opened. As with Loews Hotels & Co’s other properties at Universal Orlando, Loews Hotels & Co serves as manager and has a 50% joint venture interest in this hotel; |
|---|
| 🌑 | In 2018, the sale of Loews Annapolis Hotel in Annapolis, Maryland, was completed; |
|---|
| 🌑 | In 2018, the sale of an equity interest in Loews Boston Hotel in Boston Massachusetts was completed; |
|---|
| 🌑 | In 2019, Live! by Loews in Arlington, Texas, an approximately 300 guestroom hotel in which Loews Hotels & Co serves as manager and has a joint venture interest, is expected to be completed; |
|---|
| 🌑 | In 2019 and 2020, Universal’s Endless Summer Resort – Surfside Inn and Suites and Universal’s Endless Summer Resort – Dockside Inn and Suites at Universal Orlando, with an aggregate of approximately 2,800 guestrooms, are expected to open. As with Loews Hotels & Co’s other properties at Universal Orlando, Loews Hotels & Co serves as manager and has a 50% joint venture interest in these hotels; |
|---|
| 🌑 | In 2020, Loews Kansas City Hotel in Kansas City, Missouri, an approximately 800 guestroom hotel in which Loews Hotels & Co serves as manager and has a majority equity interest, is expected to be completed; and |
|---|
| 🌑 | In 2020, Live! by Loews in St. Louis, Missouri, an approximately 216 guestroom hotel in which Loews Hotels & Co serves as manager and has a joint venture interest, is expected to be completed. |
|---|
CONSOLIDATED CONTAINER COMPANY LLC
Consolidated Container manufactures rigid plastic packaging to provide packaging solutions to end markets such as beverage, food and household chemicals through a network of manufacturing locations across North America. Consolidated Container develops, manufactures and markets a wide range of extrusion blow-molded and injection molded plastic containers for target markets. In addition, Consolidated Container manufactures commodity and differentiated plastic resins from recycled plastic materials for a variety of end markets. Consolidated Container accounted for 6.2% and 3.6% of our consolidated total revenue for the years ended December 31, 2018 and 2017.
Customers: Consolidated Container sells its products to approximately 1,570 customers throughout North America. Consolidated Container’s largest customers for rigid packaging include a diverse customer base of many nationally recognized branded food, beverage and consumer products companies. The recycled resins customer base is primarily domestic with customers in several end markets such as packaging, automotive, industrial and consumer goods. Dean Foods Company represented approximately 11% of Consolidated Container’s net sales for the year ended December 31, 2018 and 11% of its net sales, since the date of acquisition, for the year ended December 31, 2017. No other customer accounted for 10% or more of Consolidated Container’s net sales during 2018 or 2017.
Competition: Consolidated Container faces competition throughout its product lines from a number of regional and local manufacturers, including smaller firms operating in similar geographic regions and well-established businesses operating nationally. Consolidated Container believes that its long term success is largely dependent on its ability to continue to address logistically complex and technically demanding customer needs, maintain strong relationships with current customers, attract new customers, develop product innovations, provide superior service to its customers and reduce its cost structure.
Properties: Consolidated Container leases its corporate offices in Atlanta, Georgia and Omaha, Nebraska. It operates 57 manufacturing facilities located throughout the United States and five facilities located in Canada, of which 57 are leased and five are owned. In addition, Consolidated Container utilizes eight warehouse facilities, of which seven are leased and one is owned.
EMPLOYEE RELATIONS
Including our operating subsidiaries as described below, we employed approximately 17,900 persons at December 31, 2018. CNA employed approximately 6,100 persons. Diamond Offshore employed approximately 2,300 persons, including international crew personnel furnished through independent labor contractors. Boardwalk Pipeline employed approximately 1,240 persons, approximately 110 of whom are union members covered under collective bargaining agreements. Loews Hotels & Co employed approximately 5,460 persons, approximately 1,770 of whom are union members covered under collective bargaining agreements. Consolidated Container employed approximately 2,600 persons, approximately 230 of whom are covered under collective bargaining agreements. We and our subsidiaries have satisfactory labor relations.
EXECUTIVE OFFICERS OF THE REGISTRANT
| First | ||||||||
| Became | ||||||||
| Name | Position and Offices Held | Age | Officer | |||||
| Marc A. Alpert | Senior Vice President, General Counsel and Secretary | 56 | 2016 | |||||
| David B. Edelson | Senior Vice President and Chief Financial Officer | 59 | 2005 | |||||
| Richard W. Scott | Senior Vice President and Chief Investment Officer | 65 | 2009 | |||||
| Kenneth I. Siegel | Senior Vice President | 61 | 2009 | |||||
| Andrew H. Tisch | Office of the President, Co-Chairman of the Board and Chairman of the Executive Committee | 69 | 1985 | |||||
| James S. Tisch | Office of the President, President and Chief Executive Officer | 66 | 1981 | |||||
| Jonathan M. Tisch | Office of the President and Co-Chairman of the Board | 65 | 1987 |
Andrew H. Tisch and James S. Tisch are brothers and are cousins of Jonathan M. Tisch. None of our other executive officers or directors is related to any other.
All of our executive officers, except for Marc A. Alpert and David B. Edelson, have served in their current roles at the Company for at least the past five years. Prior to assuming his current role at the Company in July of 2016, Mr. Alpert served as a partner and head of the Public Companies Practice Group at the law firm of Chadbourne & Parke LLP. Mr. Edelson served as our Senior Vice President prior to May of 2014, when he assumed his current role.
Officers are elected annually and hold office until their successors are elected and qualified, and are subject to removal by the Board of Directors.
AVAILABLE INFORMATION
Our website address is www.loews.com. We make available, free of charge, through the website our Annual Report on Form 10-K, Quarterly Reports on Form 10-Q, Current Reports on Form 8-K and amendments to those reports filed or furnished pursuant to Section 13(a) or 15(d) of the Securities Exchange Act of 1934, as amended, as soon as reasonably practicable after these reports are electronically filed with or furnished to the SEC. Copies of our Code of Business Conduct and Ethics, Corporate Governance Guidelines, Audit Committee charter, Compensation Committee charter and Nominating and Governance Committee charter are also available on our website. Information on or accessible through our website is not incorporated by reference into this Report. This Annual Report on Form 10-K and other SEC filings made by the Company are also accessible through the SEC’s website at www.sec.gov.
Item 1A. Risk Factors.
Our business and the businesses of our subsidiaries face many risks and uncertainties. These risks and uncertainties could lead to events or circumstances that have a material adverse effect on our business, results of operations, cash flows, financial condition or equity and/or the business, results of operations, financial condition or equity of one or more of our subsidiaries. We have described below the most significant risks facing us and our subsidiaries. There may be additional risks that we do not yet know of or that we do not currently perceive to be as significant that may also impact our business or the businesses of our subsidiaries.
You should carefully consider and evaluate all of the information included in this Report and any subsequent reports we may file with the Securities and Exchange Commission (“SEC”) and the information we make available to the public before investing in any securities issued by us. Our subsidiaries, CNA Financial Corporation, Diamond Offshore Drilling, Inc. and Boardwalk Pipeline Partners, LP, also file reports with the SEC. You are also cautioned to carefully review and consider the information contained in the reports filed by those subsidiaries with the SEC and the information they make available to the public before investing in any of their securities.
Risks Related to Us and Our Subsidiary, CNA Financial Corporation
If CNA determines that its recorded insurance reserves are insufficient to cover its estimated ultimate unpaid liability for claim and claim adjustment expenses, CNA may need to increase its insurance reserves which would result in a charge to CNA’s earnings.
CNA maintains insurance reserves to cover its estimated ultimate unpaid liability for claim and claim adjustment expenses, including the estimated cost of the claims adjudication process, for reported and unreported claims. Insurance reserves are not an exact calculation of liability but instead are complex management estimates developed utilizing a variety of actuarial reserve estimation techniques as of a given reporting date. The reserve estimation process involves a high degree of judgment and variability and is subject to a number of factors which are highly uncertain. These variables can be affected by both changes in internal processes and external events. Key variables include frequency of claims, claim severity, mortality, morbidity, discount rates, inflation, claim handling policies and procedures, case reserving approach, underwriting and pricing policies, changes in the legal and regulatory environment and the lag time between the occurrence of an insured event and the time of its ultimate settlement. Mortality is the relative incidence of death. Morbidity is the frequency and severity of injury, illness, sickness and diseases contracted.
There is generally a higher degree of variability in estimating required reserves for long-tail coverages, such as general liability and workers’ compensation, as they require a relatively longer period of time for claims to be reported and settled. The impact of changes in inflation and medical costs are also more pronounced for long-tail coverages due to the longer settlement period. Certain risks and uncertainties associated with CNA’s insurance reserves are outlined in the Insurance Reserves and Critical Accounting Estimates sections of MD&A in Item 7.
CNA is subject to the uncertain effects of emerging or potential claims and coverage issues that arise as industry practices and legal, judicial, social, economic and other environmental conditions change. These issues have had, and may continue to have, a negative effect on CNA’s business by either extending coverage beyond the original underwriting intent or by increasing the number or size of claims, resulting in further increases in CNA’s reserves. The effects of unforeseen emerging claim and coverage issues are extremely difficult to predict.
In light of the many uncertainties associated with establishing the estimates and making the judgments necessary to establish reserve levels, CNA continually reviews and changes its reserve estimates in a regular and ongoing process as experience develops from the actual reporting and settlement of claims and as the legal, regulatory and economic environment evolves. If CNA’s recorded reserves are insufficient for any reason, the required increase in reserves would be recorded as a charge against its earnings in the period in which reserves are determined to be insufficient. These charges could be substantial.
CNA’s actual experience could vary from the key assumptions used to determine active life reserves for long term care policies.
CNA’s active life reserves for long term care policies are based on CNA’s best estimate assumptions as of December 31, 2015 due to a reserve unlocking at that date. Key assumptions include morbidity, persistency (the percentage of policies remaining in force), discount rate and future premium rate increases. These assumptions, which are critical bases for its reserve estimates are inherently uncertain. If actual experience varies from these assumptions or the future outlook for these assumptions changes, CNA may be required to increase its reserves. See the Long Term Care Policyholder Reserves portion of the Insurance Reserves section of MD&A in Item 7 for more information.
Estimating future experience for long term care policies is highly uncertain because the required projection period is very long and there is limited claim history. Morbidity and persistency experience, inclusive of mortality, can be volatile and may be negatively affected by many factors including, but not limited to, policyholder behavior, judicial decisions regarding policy terms, socioeconomic factors, cost of care inflation, changes in health trends and advances in medical care.
A prolonged period during which interest rates remain at levels lower than those anticipated in CNA’s reserving would result in shortfalls in investment income on assets supporting CNA’s obligations under long term care policies, which may require changes to its reserves. This risk is more significant for CNA’s long term care products because the long potential duration of the policy obligations exceeds the duration of the supporting investment assets. Further, changes to the corporate tax code may also affect the rate at which CNA discounts its reserves. In addition, CNA may not receive regulatory approval for the level of premium rate increases it requests. Any adverse deviation between the level of future premium rate increases approved and the level included in CNA’s reserving assumptions may require an increase to its reserves.
If CNA’s estimated reserves are insufficient for any reason, including changes in assumptions, the required increase in reserves would be recorded as a charge against earnings in the period in which reserves are determined to be insufficient. These charges could be substantial.
Catastrophe and systemic losses are unpredictable and could result in material losses.
Catastrophe losses are an inevitable part of CNA’s business. Various events can cause catastrophe losses. These events can be natural or man-made, and may include hurricanes, windstorms, earthquakes, hail, severe winter weather, fires, floods, riots, strikes, civil commotion, cyber attacks, pandemics and acts of terrorism. The frequency and severity of these catastrophe events are inherently unpredictable. In addition, longer-term natural catastrophe trends may be changing and new types of catastrophe losses may be developing due to climate change, a phenomenon that has been associated with extreme weather events linked to rising temperatures, and includes effects on global weather patterns, greenhouse gases, sea, land and air temperatures, sea levels, rain, hail and snow.
The extent of CNA’s losses from catastrophes is a function of the total amount of its insured exposures in the affected
Showing the first 8K of 125K characters. Open the full section
Item 1B. Unresolved Staff Comments.
None.
Item 2. Properties.
Our corporate headquarters is located in approximately 136,000 square feet of leased office space in two buildings in New York City. We also lease approximately 21,000 square feet of office space in one building in White Plains, New York. Information relating to our subsidiaries’ properties is contained under Item 1.
Item 3. Legal Proceedings.
Information on our legal proceedings is included in Notes 18 and 19 of the Notes to Consolidated Financial Statements, included under Item 8.
Item 4. Mine Safety Disclosures.
Not applicable.
PART II
Item 5. Market for the Registrant’s Common Equity, Related Stockholder Matters and Issuer Purchases of Equity Securities.
Our common stock is listed on the New York Stock Exchange under the symbol “L”.
The following graph compares annual total return of our Common Stock, the Standard & Poor’s 500 Composite Stock Index (“S&P 500 Index”) and our peer group set forth below (“Loews Peer Group”) for the five years ended December 31, 2018. The graph assumes that the value of the investment in our Common Stock, the S&P 500 Index and the Loews Peer Group was $100 on December 31, 2013 and that all dividends were reinvested.
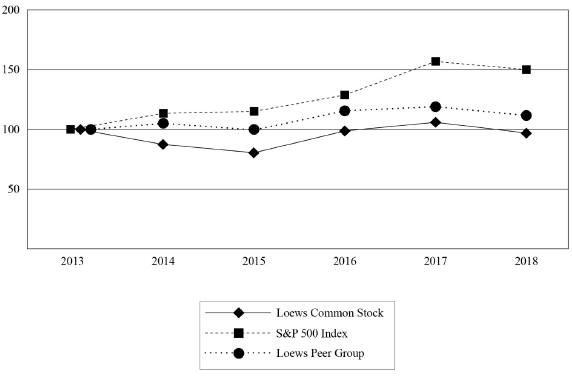
| 2013 | 2014 | 2015 | 2016 | 2017 | 2018 | |||||||||||||||||||
| Loews Common Stock | 100.0 | 87.61 | 80.58 | 98.88 | 106.19 | 97.11 | ||||||||||||||||||
| S&P 500 Index | 100.0 | 113.69 | 115.26 | 129.05 | 157.22 | 150.33 | ||||||||||||||||||
| Loews Peer Group (a) | 100.0 | 105.32 | 99.71 | 115.75 | 119.22 | 111.86 |
| (a) | The Loews Peer Group consists of the following companies that are industry competitors of our principal operating subsidiaries: Chubb Limited (name change from ACE Limited after it acquired The Chubb Corporation on January 15, 2016), W.R. Berkley Corporation, The Chubb Corporation (included through January 15, 2016 when it was acquired by ACE Limited), Energy Transfer Partners L.P. (included through October 18, 2018 when it merged with Energy Transfer Equity, L.P.), Ensco plc, The Hartford Financial Services Group, Inc., Kinder Morgan Energy Partners, L.P. (included through November 26, 2014 when it was acquired by Kinder Morgan Inc.), Noble Corporation plc, Spectra Energy Corp (included through February 24, 2017 when it was acquired by Enbridge Inc.), Transocean Ltd. and The Travelers Companies, Inc. |
|---|
Securities Authorized for Issuance Under Equity Compensation Plans
The following table provides certain information as of December 31, 2018 with respect to our equity compensation plans under which our equity securities are authorized for issuance.
| Plan category | Number of securities to be issued upon exercise of outstanding options, warrants and rights | Weighted average exercise price of outstanding options, warrants and rights | Number of securities remaining available for future issuance under equity compensation plans (excluding securities reflected in the first column) | |||
| Equity compensation plans approved by security holders (a) | 4,088,037 | $ 39.90 | 5,697,124 | |||
| Equity compensation plans not approved by security holders (b) | N/A | N/A | N/A |
| (a) | Reflects 3,470,953 outstanding stock appreciation rights awarded under the Loews Corporation 2000 Stock Option Plan, 598,254 outstanding unvested time-based and performance-based restricted stock units (“RSUs”) and 18,830 deferred vested time-based RSUs awarded under the Loews Corporation 2016 Incentive Compensation Plan. The weighted average exercise price does not take into account RSUs as they do not have an exercise price. |
|---|
| (b) | We do not have equity compensation plans that have not been approved by our shareholders. |
|---|
Approximate Number of Equity Security Holders
As of February 1, 2019, we had approximately 750 holders of record of our common stock.
Common Stock Repurchases
During the fourth quarter of 2018, we purchased shares of our common stock as follows:
| Period | (a) Total number of shares purchased | (b) Average price paid per share | (c) Total number of shares purchased as part of publicly announced plans or programs | (d) Maximum number of shares (or approximate dollar value) of shares that may yet be purchased under the plans or programs (in millions) | ||||
| October 1, 2018 - October 31, 2018 | 905,317 | $ 47.14 | N/A | N/A | ||||
| November 1, 2018 - November 30, 2018 | 938,458 | 48.25 | N/A | N/A | ||||
| December 1, 2018 - December 31, 2018 | 1,043,116 | 45.27 | N/A | N/A |
Item 6. Selected Financial Data.
The following table presents selected financial data. The table should be read in conjunction with Item 7. Management’s Discussion and Analysis of Financial Condition and Results of Operations and Item 8. Financial Statements and Supplementary Data of this Form 10-K.
| Year Ended December 31 | 2018 | 2017 (a) | 2016 (a) | 2015 (a) | 2014 (a) | |||||||||||||||
| (In millions, except per share data) | ||||||||||||||||||||
| Results of Operations: | ||||||||||||||||||||
| Revenues | $ | 14,066 | $ | 13,735 | $ | 13,105 | $ | 13,415 | $ | 14,325 | ||||||||||
| Income before income tax | $ | 834 | $ | 1,582 | $ | 936 | $ | 244 | $ | 1,810 | ||||||||||
| Income from continuing operations | $ | 706 | $ | 1,412 | $ | 716 | $ | 287 | $ | 1,353 | ||||||||||
| Discontinued operations, net | (391 | ) | ||||||||||||||||||
| Net income | 706 | 1,412 | 716 | 287 | 962 | |||||||||||||||
| Amounts attributable to noncontrolling interests | (70 | ) | (248 | ) | (62 | ) | (27 | ) | (371 | ) | ||||||||||
| Net income attributable to Loews Corporation | $ | 636 | $ | 1,164 | $ | 654 | $ | 260 | $ | 591 | ||||||||||
| Net income attributable to Loews Corporation: | ||||||||||||||||||||
| Income from continuing operations | $ | 636 | $ | 1,164 | $ | 654 | $ | 260 | $ | 962 | ||||||||||
| Discontinued operations, net | (371 | ) | ||||||||||||||||||
| Net income | $ | 636 | $ | 1,164 | $ | 654 | $ | 260 | $ | 591 | ||||||||||
| Diluted Net Income Per Share: | ||||||||||||||||||||
| Income from continuing operations | $ | 1.99 | $ | 3.45 | $ | 1.93 | $ | 0.72 | $ | 2.52 | ||||||||||
| Discontinued operations, net | (0.97 | ) | ||||||||||||||||||
| Net income | $ | 1.99 | $ | 3.45 | $ | 1.93 | $ | 0.72 | $ | 1.55 | ||||||||||
| Financial Position: | ||||||||||||||||||||
| Investments | $ | 48,186 | $ | 52,226 | $ | 50,711 | $ | 49,400 | $ | 52,032 | ||||||||||
| Total assets | 78,316 | 79,586 | 76,594 | 76,006 | 78,342 | |||||||||||||||
| Debt | 11,376 | 11,533 | 10,778 | 10,560 | 10,643 | |||||||||||||||
| Shareholders’ equity | 18,518 | 19,204 | 18,163 | 17,561 | 19,280 | |||||||||||||||
| Cash dividends per share | 0.25 | 0.25 | 0.25 | 0.25 | 0.25 | |||||||||||||||
| Book value per share | 59.34 | 57.83 | 53.96 | 51.67 | 51.70 | |||||||||||||||
| Shares outstanding | 312.07 | 332.09 | 336.62 | 339.90 | 372.93 |
| (a) | Prior period revenues have not been adjusted under the modified retrospective method of adoption for Accounting Standard Update (“ASU”) 2014-09, “Revenue from Contracts with Customer (Topic 606)” or ASU 2016-01, “Financial Instruments – Overall (Subtopic 825-10); Recognition and Measurement of Financial Assets and Financial Liabilities.” For further information, see Note 1 of the Notes to the Consolidated Financial Statements, included under Item 8. |
|---|
Item 7. Management’s Discussion and Analysis of Financial Condition and Results of Operations.
Management’s discussion and analysis of financial condition and results of operations is comprised of the following sections:
OVERVIEW
We are a holding company and have five reportable segments comprised of four individual operating subsidiaries, CNA Financial Corporation (“CNA”), Diamond Offshore Drilling, Inc. (“Diamond Offshore”), Boardwalk Pipeline Partners, LP (“Boardwalk Pipeline”) and Loews Hotels Holding Corporation (“Loews Hotels & Co”); and the Corporate segment. The operations of Consolidated Container Company LLC (“Consolidated Container”) since the acquisition date in the second quarter of 2017 are included in the Corporate segment. Each of our operating subsidiaries is headed by a chief executive officer who is responsible for the operation of its business and has the duties and authority commensurate with that position.
We rely upon our invested cash balances and distributions from our subsidiaries to generate the funds necessary to meet our obligations and to declare and pay any dividends to our shareholders. The ability of our subsidiaries to pay dividends is subject to, among other things, the availability of sufficient earnings and funds in such subsidiaries, applicable state laws, including in the case of the insurance subsidiaries of CNA, laws and rules governing the payment of dividends by regulated insurance companies (see Note 14 of the Notes to Consolidated Financial Statements included under Item 8) and compliance with covenants in their respective loan agreements. Claims of creditors of our subsidiaries will generally have priority as to the assets of such subsidiaries over our claims and those of our creditors and shareholders.
Unless the context otherwise requires, references in this Report to “Loews Corporation,” “the Company,” “Parent Company,” “we,” “our,” “us” or like terms refer to the business of Loews Corporation excluding its subsidiaries.
The following discussion should be read in conjunction with Item 1A, Risk Factors, and Item 8, Financial Statements and Supplementary Data of this Form 10-K.
RESULTS OF OPERATIONS
Consolidated Financial Results
The following table summarizes net income attributable to Loews Corporation by segment and net income per share attributable to Loews Corporation for the years ended December 31, 2018, 2017 and 2016:
| Year Ended December 31 | 2018 | 2017 (a) | 2016 | |||||||||
| (In millions) | ||||||||||||
| CNA Financial | $ | 726 | $ | 801 | $ | 774 | ||||||
| Diamond Offshore | (112 | ) | (27 | ) | (186 | ) | ||||||
| Boardwalk Pipeline | 135 | 380 | 89 | |||||||||
| Loews Hotels & Co | 48 | 64 | 12 | |||||||||
| Corporate | (161 | ) | (54 | ) | (35 | ) | ||||||
| Net income attributable to Loews Corporation | $ | 636 | $ | 1,164 | $ | 654 | ||||||
| Basic net income per common share | $ | 1.99 | $ | 3.46 | $ | 1.93 | ||||||
| Diluted net income per common share | $ | 1.99 | $ | 3.45 | $ | 1.93 | ||||||
| (a) | Net income for the year ended December 31, 2017 includes a significant net benefit of $200 million, resulting from the Tax Cuts and Jobs Act of 2017 (“Tax Act”). This net benefit primarily relates to the remeasurement of Loews’s net deferred tax liability precipitated by the lowering of the U.S. federal corporate tax rate from 35% to 21%. This net benefit is comprised of a net benefit of $294 million and $27 million at Boardwalk Pipeline and Loews Hotels & Co partially offset by charges of $78 million, $36 million and $7 million at CNA, Diamond Offshore and Corporate. |
|---|
2018 Compared with 2017
Consolidated net income attributable to Loews Corporation for 2018 was $636 million, or $1.99 per share, compared to $1.16 billion, or $3.45 per share, in 2017.
Net income attributable to Loews Corporation in 2018 decreased as compared to the prior year primarily due to the prior year net benefit of $200 million from the Tax Act. Excluding the impact of the Tax Act, earnings decreased due to lower results at CNA and Diamond Offshore partially offset by higher earnings at Loews Hotels & Co and Boardwalk Pipeline.
2017 Compared with 2016
Consolidated net income attributable to Loews Corporation for 2017 was $1.16 billion, or $3.45 per share, compared to $654 million, or $1.93 per share, in 2016.
Net income attributable to Loews Corporation in 2017 increased as compared to the prior year partially due to the net benefit from the Tax Act discussed above. Absent this benefit, net income increased $310 million primarily from higher earnings at CNA, Loews Hotels & Co and Diamond Offshore. Net income for 2017 and 2016 included asset impairment charges at Diamond Offshore of $32 million and $267 million (both after tax and noncontrolling interests).
CNA Financial
The following table summarizes the results of operations for CNA for the years ended December 31, 2018, 2017 and 2016 as presented in Note 20 of the Notes to Consolidated Financial Statements included under Item 8. For further discussion of Net investment income and Net realized investment results, see the Investments section of this MD&A.
| Year Ended December 31 | 2018 | 2017 | 2016 | |||||||||
| (In millions) | ||||||||||||
| Revenues: | ||||||||||||
| Insurance premiums | $ | 7,312 | $ | 6,988 | $ | 6,924 | ||||||
| Net investment income | 1,817 | 2,034 | 1,988 | |||||||||
| Investment gains (losses) | (57 | ) | 122 | 62 | ||||||||
| Non-insurance warranty revenue (Notes 1 and 13) | 1,007 | 390 | 361 | |||||||||
| Operating revenues and other | 55 | 49 | 49 | |||||||||
| Total | 10,134 | 9,583 | 9,384 | |||||||||
| Expenses: | ||||||||||||
| Insurance claims and policyholders’ benefits | 5,572 | 5,310 | 5,283 | |||||||||
| Amortization of deferred acquisition costs | 1,335 | 1,233 | 1,235 | |||||||||
| Non-insurance warranty expense (Notes 1 and 13) | 923 | 299 | 271 |
Showing the first 8K of 147K characters. Open the full section
Item 7A. Quantitative and Qualitative Disclosures about Market Risk.
We are a large diversified holding company. As such, we and our subsidiaries have significant amounts of financial instruments that involve market risk. Our measure of market risk exposure represents an estimate of the change in fair value of our financial instruments. Changes in the trading portfolio are recognized in the Consolidated Statements of Income. Market risk exposure is presented for each class of financial instrument held by us at December 31, assuming immediate adverse market movements of the magnitude described below. We believe that the various rates of adverse market movements represent a measure of exposure to loss under hypothetically assumed adverse conditions. The estimated market risk exposure represents the hypothetical loss to future earnings and does not represent the maximum possible loss nor any expected actual loss, even under adverse conditions, because actual adverse fluctuations would likely differ. In addition, since our investment portfolio is subject to change based on our portfolio management strategy as well as in response to changes in the market, these estimates are not necessarily indicative of the actual results which may occur.
Exposure to market risk is managed and monitored by senior management. Senior management approves our overall investment strategy and has responsibility to ensure that the investment positions are consistent with that strategy with an acceptable level of risk. We may manage risk by buying or selling instruments or entering into offsetting positions.
Interest Rate Risk – We have exposure to interest rate risk arising from changes in the level or volatility of interest rates. We attempt to mitigate our exposure to interest rate risk by utilizing instruments such as interest rate swaps, commitments to purchase securities, options, futures and forwards. We monitor our sensitivity to interest rate changes by revaluing financial assets and liabilities using a variety of different interest rates. The Company uses duration and convexity at the security level to estimate the change in fair value that would result from a change in each security’s yield. Duration measures the price sensitivity of an asset to changes in the yield rate. Convexity measures how the duration of the asset changes with interest rates. The duration and convexity analysis takes into account the unique characteristics (e.g., call and put options and prepayment expectations) of each security, in determining the hypothetical change in fair value. The analysis is performed at the security level and is aggregated up to the asset category level.
The evaluation is performed by applying an instantaneous change in the yield rates by varying magnitudes on a static balance sheet to determine the effect such a change in rates would have on the recorded market value of our investments and the resulting effect on shareholders’ equity. The analysis presents the sensitivity of the market value
of our financial instruments to selected changes in market rates and prices which we believe are reasonably possible over a one year period.
The sensitivity analysis estimates the change in the fair value of our interest sensitive assets and liabilities that were held on December 31, 2018 and 2017 due to an instantaneous change in the yield of the security at the end of the period of 100 basis points, with all other variables held constant.
The interest rates on certain types of assets and liabilities may fluctuate in advance of changes in market interest rates, while interest rates on other types may lag behind changes in market rates. Accordingly, the analysis may not be indicative of, is not intended to provide, and does not provide a precise forecast of the effect of changes of market interest rates on our earnings or shareholders’ equity. Further, the computations do not contemplate any actions we could undertake in response to changes in interest rates.
Our debt is primarily denominated in U.S. dollars and has been primarily issued at fixed rates, therefore, interest expense would not be impacted by interest rate shifts. The impact of a 100 basis point increase in interest rates on fixed rate debt would result in a decrease in market value of $492 million and $630 million at December 31, 2018 and 2017. The impact of a 100 basis point decrease would result in an increase in market value of $537 million and $694 million at December 31, 2018 and 2017. Consolidated Container has entered into interest rate swaps for a notional amount of $500 million to hedge its exposure to fluctuations in LIBOR on a portion of its variable rate debt. These swaps effectively fix the interest rate on the hedged portion of the term loan at approximately 2.1% plus an applicable margin. At December 31, 2018 and 2017, the impact of a 100 basis point increase in interest rates on variable rate debt, net of the effects of the swaps, would increase interest expense by approximately $7 million and $5 million on an annual basis.
Equity Price Risk – We have exposure to equity price risk as a result of our investment in equity securities and equity derivatives. Equity price risk results from changes in the level or volatility of equity prices which affect the value of equity securities or instruments that derive their value from such securities or indexes. Equity price risk was measured assuming an instantaneous 25% decrease in the underlying reference price or index from its level at December 31, 2018 and 2017, with all other variables held constant. A model was developed to analyze the observed changes in the value of limited partnerships held by the Company over a multiple year period along with the corresponding changes in various equity indices. The result of the model allowed us to estimate the change in value of limited partnerships when equity markets decline by 25%.
Foreign Exchange Rate Risk – Foreign exchange rate risk arises from the possibility that changes in foreign currency exchange rates will impact the value of financial instruments. We have foreign exchange rate exposure when we buy or sell foreign currencies or financial instruments denominated in a foreign currency, which is reduced through the use of forward contracts. The sensitivity analysis assumes an instantaneous 20% decrease in the foreign currency exchange rates versus the U.S. dollar from their levels at December 31, 2018 and 2017, with all other variables held constant.
Commodity Price Risk – We have exposure to price risk as a result of our investments in commodities. Commodity price risk results from changes in the level or volatility of commodity prices that impact instruments which derive their value from such commodities. Commodity price risk was measured assuming an instantaneous decrease of 20% from their levels at December 31, 2018 and 2017.
We have exposure to price risk as a result of Consolidated Container’s purchases of certain raw materials, such as high-density polyethylene, polycarbonate, polypropylene and polyethylene terephthalate resins in connection with the production of its products. The purchase prices of these raw materials are determined based on prevailing market conditions. While Consolidated Container’s operations are affected by fluctuations in resin prices, its net income over time is generally unaffected by these changes as these costs are generally passed through to its customers.
Credit Risk – We are exposed to credit risk relating to the risk of loss resulting from the nonperformance by a customer of its contractual obligations. Although nearly all of the Company’s customers pay for its services on a timely basis, the Company actively monitors the credit exposure to its customers. Certain of the Company’s subsidiaries may perform credit reviews of customers and may require customers to provide cash collateral, post a letter of credit, prepay for services or provide other credit enhancements.
The following tables present the estimated effects on the fair value of our financial instruments as of December 31, 2018 and 2017 due to an increase in yield rates of 100 basis points, a 20% decline in foreign currency exchange rates and a 25% decline in the S&P 500, with all other variables held constant, on the basis of those entered into for trading purposes and other than trading purposes.
Trading portfolio:
| Increase (Decrease) | |||||||||||||||
| December 31, 2018 | Fair Value Asset (Liability) | Interest Rate Risk | Equity Price Risk | ||||||||||||
| (In millions) | |||||||||||||||
| Fixed maturities – long | $ | 157 | $ | (1) | |||||||||||
| Equity securities – long | 495 | $ | (124 | ) | |||||||||||
| – short | (6 | ) | 2 | ||||||||||||
| Options – purchased | 18 | 28 | |||||||||||||
| – written | (17 | ) | (19 | ) | |||||||||||
| Other invested assets | 5 | ||||||||||||||
| Short term investments | 1,926 | (4) |
Other than trading portfolio:
| Increase (Decrease) | ||||||||||||||||
| December 31, 2018 | Fair Value Asset (Liability) | Interest Rate Risk | Foreign Currency Risk | Equity Price Risk | ||||||||||||
| (In millions) | ||||||||||||||||
| Fixed maturities | $ | 39,542 | $ | (2,440 | ) | $ | (406 | ) | ||||||||
| Equity securities | 780 | (29 | ) | (3 | ) | $ | (46 | ) | ||||||||
| Limited partnership investments | 2,424 | (308 | ) | |||||||||||||
| Other invested assets | 53 | (9 | ) | |||||||||||||
| Mortgage loans | 827 | (36 | ) | |||||||||||||
| Short term investments | 1,943 | (1 | ) | (24 | ) | |||||||||||
| Interest rate swaps (a) | 11 | 22 | ||||||||||||||
| Other derivatives | 4 | 15 |
| (a) | The market risk at December 31, 2018 will generally be offset by recognition of the underlying hedged transaction. |
|---|
Trading portfolio:
| Increase (Decrease) | ||||||||||||
| December 31, 2017 | Fair Value Asset (Liability) | Interest Rate Risk | Equity Price Risk | |||||||||
| (In millions) | ||||||||||||
| Fixed maturities – long | $ | 649 | $ | (1 | ) | |||||||
| Equity securities – long | 517 | $ | (129 | ) | ||||||||
| – short | (5 | ) | 1 | |||||||||
| Options – purchased | 12 | 16 | ||||||||||
| – written | (7 | ) | (15 | ) | ||||||||
| Other invested assets | 60 | (1 | ) | |||||||||
| Short term investments | 2,745 | |||||||||||
| Other derivatives | 1 | 67 |
Other than trading portfolio:
| Increase (Decrease) | ||||||||||||||||
| December 31, 2017 | Fair Value Asset (Liability) | Interest Rate Risk | Foreign Currency Risk | Equity Price Risk | ||||||||||||
| (In millions) | ||||||||||||||||
| Fixed maturities | $ | 41,484 | $ | (2,559 | ) | $ | (429 | ) | ||||||||
| Equity securities | 695 | (26 | ) | (4 | ) | $ | (16 | ) | ||||||||
| Limited partnership investments | 3,278 | (464 | ) | |||||||||||||
| Other invested assets | 44 | (7 | ) | |||||||||||||
| Mortgage loans | 844 | (40 | ) | |||||||||||||
| Short term investments | 1,901 | (1 | ) | (20 | ) | |||||||||||
| Interest rate swaps (a) | 4 | 26 | ||||||||||||||
| Other derivatives | (3 | ) | 17 |
| (a) | The market risk at December 31, 2017 will generally be offset by recognition of the underlying hedged transaction. |
|---|
Item 8. Financial Statements and Supplementary Data.
Financial Statements and Supplementary Data are comprised of the following sections:
MANAGEMENT’S REPORT ON INTERNAL CONTROL OVER FINANCIAL REPORTING
Our management is responsible for establishing and maintaining adequate internal control over financial reporting (as defined in Exchange Act Rules 13a-15(f) and 15d-15(f)) for us. Our internal control system was designed to provide reasonable assurance to our management and Board of Directors regarding the preparation and fair presentation of published financial statements.
There are inherent limitations to the effectiveness of any control system, however well designed, including the possibility of human error and the possible circumvention or overriding of controls. Further, the design of a control system must reflect the fact that there are resource constraints, and the benefits of controls must be considered relative to their costs. Management must make judgments with respect to the relative cost and expected benefits of any specific control measure. The design of a control system also is based in part upon assumptions and judgments made by management about the likelihood of future events, and there can be no assurance that a control will be effective under all potential future conditions. As a result, even an effective system of internal control over financial reporting can provide no more than reasonable assurance with respect to the fair presentation of financial statements and the processes under which they were prepared.
Our management assessed the effectiveness of our internal control over financial reporting as of December 31, 2018. In making this assessment, management used the criteria set forth by the Committee of Sponsoring Organizations of the Treadway Commission in Internal Control – Integrated Framework (2013). Based on this assessment, our management believes that, as of December 31, 2018, our internal control over financial reporting was effective.
Our independent registered public accounting firm, Deloitte & Touche LLP, has issued an audit report on the Company’s internal control over financial reporting. The report of Deloitte & Touche LLP follows this Report.
REPORT OF INDEPENDENT REGISTERED PUBLIC ACCOUNTING FIRM
To the shareholders and the Board of Directors of Loews Corporation
Opinion on Internal Control over Financial Reporting
We have audited the internal control over financial reporting of Loews Corporation and subsidiaries (the “Company”) as of December 31, 2018, based on criteria established in Internal Control — Integrated Framework (2013) issued by the Committee of Sponsoring Organizations of the Treadway Commission (COSO). In our opinion, the Company maintained, in all material respects, effective internal control over financial reporting as of December 31, 2018, based on criteria established in Internal Control — Integrated Framework (2013) issued by COSO.
We have also audited, in accordance with the standards of the Public Company Accounting Oversight Board (United States) (PCAOB), the consolidated financial statements as of and for the year ended December 31, 2018, of the Company and our report dated February 13, 2019, expressed an unqualified opinion on those financial statements and included an explanatory paragraph regarding the Company’s change in its method of accounting for recognition and measurement of equity securities in 2018.
Basis for Opinion
The Company’s management is responsible for maintaining effective internal control over financial reporting and for its assessment of the effectiveness of internal control over financial reporting, included in the accompanying management’s report on internal control over financial reporting. Our responsibility is to express an opinion on the Company’s internal control over financial reporting based on our audit. We are a public accounting firm registered with the PCAOB and are required to be independent with respect to the Company in accordance with the U.S. federal securities laws and the applicable rules and regulations of the Securities and Exchange Commission and the PCAOB.
We conducted our audit in accordance with the standards of the PCAOB. Those standards require that we plan and perform the audit to obtain reasonable assurance about whether effective internal control over financial reporting was maintained in all material respects. Our audit included obtaining an understanding of internal control over financial reporting, assessing the risk that a material weakness exists, testing and evaluating the design and operating effectiveness of internal control based on the assessed risk, and performing such other procedures as we considered necessary in the circumstances. We believe that our audit provides a reasonable basis for our opinion.
Definition and Limitations of Internal Control over Financial Reporting
A company’s internal control over financial reporting is a process designed to provide reasonable assurance regarding the reliability of financial reporting and the preparation of financial statements for external purposes in accordance with generally accepted accounting principles. A company’s internal control over financial reporting includes those policies and procedures that (1) pertain to the maintenance of records that, in reasonable detail, accurately and fairly reflect the transactions and dispositions of the assets of the company; (2) provide reasonable assurance that transactions are recorded as necessary to permit preparation of financial statements in accordance with generally accepted accounting principles, and that receipts and expenditures of the company are being made only in accordance with authorizations of management and directors of the company; and (3) provide reasonable assurance regarding prevention or timely detection of unauthorized acquisition, use, or disposition of the company’s assets that could have a material effect on the financial statements.
Because of its inherent limitations, internal control over financial reporting may no
Showing the first 8K of 372K characters. Open the full section
Item 9. Changes in and Disagreements with Accountants on Accounting and Financial Disclosure.
None.
Item 9A. Controls and Procedures.
Disclosure Controls and Procedures
The Company maintains a system of disclosure controls and procedures (as defined in Rules 13a-15(e) and 15d-15(e) under the Securities Exchange Act of 1934, as amended (the “Exchange Act”)), which is designed to ensure that information required to be disclosed by the Company in reports that it files or submits under the Exchange Act, including this Report, is recorded, processed, summarized and reported on a timely basis. These disclosure controls and procedures include controls and procedures designed to ensure that information required to be disclosed by the Company under the Exchange Act is accumulated and communicated to the Company’s management on a timely basis to allow decisions regarding required disclosure.
The Company’s management, including the Company’s principal executive officer (“CEO”) and principal financial officer (“CFO”) conducted an evaluation of the effectiveness of the Company’s disclosure controls and procedures as of the end of the period covered by this Report and, based on that evaluation, the CEO and CFO concluded that the Company’s disclosure controls and procedures were effective as of December 31, 2018.
Internal Control Over Financial Reporting
Pursuant to Section 404 of the Sarbanes-Oxley Act of 2002, and the implementing rules of the Securities and Exchange Commission, the Company included a report of management’s assessment of the design and effectiveness of its internal control over financial reporting as part of this Annual Report on Form 10-K for the year ended December 31, 2018. The independent registered public accounting firm of the Company also reported on the effectiveness of the Company’s internal control over financial reporting as of December 31, 2018. Management’s report and the independent registered public accounting firm’s report are included under Item 8 of this Report under the captions entitled “Management’s Report on Internal Control Over Financial Reporting” and “Report of Independent Registered Public Accounting Firm.”
There were no changes in the Company’s internal control over financial reporting (as defined in Rules 13a-15(f) and 15d-15(f) under the Exchange Act) that occurred during the quarter ended December 31, 2018 that have materially affected or that are reasonably likely to materially affect the Company’s internal control over financial reporting.
Item 9B. Other Information.
None.
PART III
Item 10. Directors, Executive Officers and Corporate Governance.
Information about our directors and persons nominated to become directors is contained under the caption “Election of Directors” in our Proxy Statement for our 2019 Annual Meeting of Shareholders to be filed with the SEC within 120 days of the fiscal year ended December 31, 2018 (the “2019 Proxy Statement”) and is incorporated herein by reference. Information about our executive officers is reported under the caption “Executive Officers of the Registrant” in Part I of this Report.
Information about beneficial ownership reporting compliance is contained under the caption “Section 16(a) Beneficial Ownership Reporting Compliance” in our 2019 Proxy Statement and is incorporated herein by reference.
We have a Code of Business Conduct and Ethics which applies to all of our directors, officers and employees, including our principal executive officer, principal financial officer and principal accounting officer. This Code can be found on our website at www.loews.com and is available in print to any shareholder who requests a copy by writing to our Corporate Secretary at Loews Corporation, 667 Madison Avenue, New York, N.Y. 10065-8087. We intend to post any changes to or waivers of this Code for our directors and executive officers, including our principal executive officer, principal financial officer, principal accounting officer or persons performing similar functions on our website. Any amendment to this Code and any waiver applicable to our executive officers or senior financial officers will be posted on our website within the time period required by the SEC and New York Stock Exchange.
Information about the procedures by which security holders may recommend nominees to our Board of Directors can be found in our 2019 Proxy Statement under the caption “Submissions or Nominations for Our 2020 Annual Meeting” and is incorporated herein by reference.
Information about the composition of the Audit Committee and our Audit Committee financial experts is contained in our 2019 Proxy Statement under the caption “Board Committees – Audit Committee” and is incorporated herein by reference.
Item 11. Executive Compensation.
Information about director and executive officer compensation, Compensation Committee interlocks and the Compensation Committee Report is contained in our 2019 Proxy Statement under the captions “Director Compensation,” “Compensation Discussion and Analysis,” “2018 Executive Compensation Tables,” “Compensation Committee Report on Executive Compensation” and “Compensation Committee Interlocks and Insider Participation” and is incorporated herein by reference.
Item 12. Security Ownership of Certain Beneficial Owners and Management and Related Stockholder Matters.
Information about securities authorized for issuance under equity compensation plans can be found under the caption “Securities Authorized for Issuance Under Equity Compensation Plans” under Item 5 of this Report.
Information about the number of shares of our common stock beneficially owned by each director and named executive officer, by all directors and executive officers as a group and on each beneficial owner of more than 5% of our common stock is contained under the captions “Principal Shareholders” and “Director and Officer Holdings” in our 2019 Proxy Statement and is incorporated herein by reference.
Item 13. Certain Relationships and Related Transactions, and Director Independence.
Information about certain relationships and related transactions and director independence is contained under the captions “Transactions With Related Persons” and “Director Independence” in our 2019 Proxy Statement and is incorporated herein by reference.
Item 14. Principal Accounting Fees and Services.
Information about our Audit Committee’s pre-approval policy and procedures for audit and other services and information about our principal accountant fees and services is contained in our 2019 Proxy Statement under the caption “Ratification of the Appointment of Our Independent Auditors – Audit Fees and Services” and “ – Auditor Engagement Pre-Approval Policy” and is incorporated herein by reference.
PART IV
Item 15. Exhibits and Financial Statement Schedules.
(a) 1. Financial Statements:
The financial statements above appear under Item 8. The following additional financial data should be read in conjunction with those financial statements. Schedules not included with these additional financial data have been omitted because they are not applicable or the required information is shown in the consolidated financial statements or notes to consolidated financial statements.
- Filed herewith.
- Management contract or compensatory plan or arrangement.
Item 16. Form 10-K Summary.
Not included.
SIGNATURES
Pursuant to the requirements of Section 13 or 15(d) of the Securities Exchange Act of 1934, the Registrant has duly caused this Report to be signed on its behalf by the undersigned, thereunto duly authorized.
| LOEWS CORPORATION | ||||||
| Dated: February 13, 2019 | By | * | ||||
| (David B. Edelson, Senior Vice President and | ||||||
| Chief Financial Officer) |
Pursuant to the requirements of the Securities Exchange Act of 1934, this Report has been signed below by the following persons on behalf of the Registrant and in the capacities and on the dates indicated.
| Dated: February 13, 2019 | By | * | ||||
| (James S. Tisch, President, | ||||||
| Chief Executive Officer and Director) | ||||||
| Dated: February 13, 2019 | By | * | ||||
| (David B. Edelson, Senior Vice President and | ||||||
| Chief Financial Officer) | ||||||
| Dated: February 13, 2019 | By | * | ||||
| (Mark S. Schwartz, Vice President and | ||||||
| Chief Accounting Officer) | ||||||
| Dated: February 13, 2019 | By | * | ||||
| (Ann E. Berman, Director) | ||||||
| Dated: February 13, 2019 | By | * | ||||
| (Joseph L. Bower, Director) | ||||||
| Dated: February 13, 2019 | By | * | ||||
| (Charles D. Davidson, Director) |
| By | ||||||
| (Charles M. Diker, Director) | ||||||
| Dated: February 13, 2019 | By | * | ||||
| (Jacob A. Frenkel, Director) | ||||||
| Dated: February 13, 2019 | By | * | ||||
| (Paul J. Fribourg, Director) | ||||||
| Dated: February 13, 2019 | By | * | ||||
| (Walter L. Harris, Director) | ||||||
| Dated: February 13, 2019 | By | * | ||||
| (Philip A. Laskawy, Director) | ||||||
| Dated: February 13, 2019 | By | * | ||||
| (Susan P. Peters, Director) | ||||||
| Dated: February 13, 2019 | By | * | ||||
| (Andrew H. Tisch, Director) | ||||||
| Dated: February 13, 2019 | By | * | ||||
| (Jonathan M. Tisch, Director) | ||||||
| Dated: February 13, 2019 | By | * | ||||
| (Anthony Welters, Director) |
| *By: | /s/ Marc A. Alpert | |||||||
| (Marc A. Alpert, Senior Vice President, General | ||||||||
| Counsel and Secretary) | ||||||||
| Attorney-in-Fact |
SCHEDULE I
Condensed Financial Information of Registrant
LOEWS CORPORATION
BALANCE SHEETS
ASSETS
| December 31 | 2018 | 2017 | ||||||
| (In millions) | ||||||||
| Current assets, principally investment in short term instruments | $ | 2,050 | $ | 2,755 | ||||
| Investments in securities | 1,112 | 2,144 | ||||||
| Investments in capital stocks of subsidiaries, at equity | 17,556 | 16,303 | ||||||
| Other assets | 402 | 506 | ||||||
| Total assets | $ | 21,120 | $ | 21,708 | ||||
| LIABILITIES AND SHAREHOLDERS’ EQUITY | ||||||||
| Current liabilities | $ | 109 | $ | 182 | ||||
| Long term debt | 1,778 | 1,776 | ||||||
| Deferred income tax and other | 715 | 546 | ||||||
| Total liabilities | 2,602 | 2,504 | ||||||
| Shareholders’ equity | 18,518 | 19,204 | ||||||
| Total liabilities and shareholders’ equity | $ | 21,120 | $ | 21,708 | ||||
STATEMENTS OF INCOME AND COMPREHENSIVE INCOME (LOSS)
| Year Ended December 31 | 2018 | 2017 | 2016 | |||||||||
| (In millions) | ||||||||||||
| Revenues: | ||||||||||||
| Equity in income of subsidiaries (a) | $ | 819 | $ | 1,199 | $ | 655 | ||||||
| Interest and other | (11 | ) | 167 | 165 | ||||||||
| Total | 808 | 1,366 | 820 | |||||||||
| Expenses: | ||||||||||||
| Administrative | 127 | 134 | 127 | |||||||||
| Interest | 72 | 72 | 72 | |||||||||
| Total | 199 | 206 | 199 | |||||||||
| Income before income tax | 609 | 1,160 | 621 | |||||||||
| Income tax benefit | 27 | 4 | 33 | |||||||||
| Net income | 636 | 1,164 | 654 | |||||||||
| Equity in other comprehensive income (loss) of subsidiaries | (797 | ) | 197 | 134 | ||||||||
| Total comprehensive income (loss) | $ | (161 | ) | $ | 1,361 | $ | 788 | |||||
SCHEDULE I
(Continued)
Condensed Financial Information of Registrant
LOEWS CORPORATION
STATEMENTS OF CASH FLOWS
| Year Ended December 31 | 2018 | 2017 | 2016 | |||||||||
| (In millions) | ||||||||||||
| Operating Activities: | ||||||||||||
| Net income | $ | 636 | $ | 1,164 | $ | 654 | ||||||
| Adjustments to reconcile net income to net cash provided (used) by operating activities: | ||||||||||||
| Equity method investees | 401 | (405 | ) | 115 | ||||||||
| Provision for deferred income taxes | 113 | 77 | 10 | |||||||||
| Changes in operating assets and liabilities, net: | ||||||||||||
| Receivables | 3 | 4 | 2 | |||||||||
| Accounts payable and accrued liabilities | 92 | (20 | ) | 52 | ||||||||
| Trading securities | 1,702 | 100 | (614) | |||||||||
| Other, net | 19 | (41 | ) | (15) | ||||||||
| 2,966 | 879 | 204 | ||||||||||
| Investing Activities: | ||||||||||||
| Investments in and advances to subsidiaries | (135 | ) | 12 | 50 | ||||||||
| Change in investments, primarily short term | (187 | ) | 30 | (127) | ||||||||
| Purchase of Boardwalk Pipeline common units | (1,504 | ) | ||||||||||
| Acquisition | (620 | ) | ||||||||||
| Other | (2 | ) | (1 | ) | (2) | |||||||
| (1,828 | ) | (579 | ) | (79) | ||||||||
| Financing Activities: | ||||||||||||
| Dividends paid | (80 | ) | (84 | ) | (84) | |||||||
| Purchases of treasury shares | (1,026 | ) | (216 | ) | (134) | |||||||
| Principal payments in debt | (400) | |||||||||||
| Issuance of debt | 495 | |||||||||||
| Other | (3 | ) | (2) | |||||||||
| (1,109 | ) | (300 | ) | (125) | ||||||||
| Net change in cash | 29 | - | - | |||||||||
| Cash, beginning of year | ||||||||||||
| Cash, end of year | $ | 29 | $ | - | $ | - | ||||||
| (a) | Cash dividends paid to the Company by affiliates amounted to $878, $804 and $780 for the years ended December 31, 2018, 2017 and 2016. |
|---|
SCHEDULE V
LOEWS CORPORATION AND SUBSIDIARIES
Supplemental Information Concerning Property and Casualty Insurance Operations
| Consolidated Property and Casualty Operations | ||||||||
| December 31 | 2018 | 2017 | ||||||
| (In millions) | ||||||||
| Deferred acquisition costs | $ | 632 | $ | 632 | ||||
| Reserves for unpaid claim and claim adjustment expenses | 21,984 | 22,004 | ||||||
| Discount deducted from claim and claim adjustment expense reserves above (based on interest rates ranging from 3.5% to 8.0%) | 1,388 | 1,434 | ||||||
| Unearned premiums | 4,183 | 4,029 |
| Year Ended December 31 | 2018 | 2017 | 2016 | |||||||||
| (In millions) | ||||||||||||
| Net written premiums | $ | 7,345 | $ | 7,069 | $ | 6,988 | ||||||
| Net earned premiums | 7,312 | 6,988 | 6,924 | |||||||||
| Net investment income | 1,751 | 1,992 | 1,952 | |||||||||
| Incurred claim and claim adjustment expenses related to current year | 5,358 | 5,201 | 5,025 | |||||||||
| Incurred claim and claim adjustment expenses related to prior years | (179 | ) | (381 | ) | (342) | |||||||
| Amortization of deferred acquisition costs | 1,335 | 1,233 | 1,235 | |||||||||
| Paid claim and claim adjustment expenses | 5,331 | 5,341 | 5,134 |