 filings.tools
Lumentum Holdings 10-K 2018-06-30
Filed 2018-08-28. 22 sections, 480K characters. Original on sec.gov · Markdown · JSON
Cover and table of contents
10-K 1 lumentumfy1810k.htm 10-K
UNITED STATES
SECURITIES AND EXCHANGE COMMISSION
Washington, D.C. 20549
Form 10-K
(Mark One)
x ANNUAL REPORT PURSUANT TO SECTION 13 OR 15 (d) OF THE SECURITIES EXCHANGE ACT OF 1934
For the fiscal year ended June 30, 2018
OR
o TRANSITION REPORT PURSUANT TO SECTION 13 OR 15(d) OF THE SECURITIES EXCHANGE ACT OF 1934
For the transition period from
to
Commission File Number 001-36861
Lumentum Holdings Inc.
(Exact name of Registrant as specified in its charter)
| Delaware | 47-3108385 | |
| (State or other jurisdiction of incorporation or organization) | (I.R.S. Employer Identification Number) |
400 North McCarthy Boulevard, Milpitas, California 95035
(Address of principal executive offices including Zip code)
(408) 546-5483
(Registrant’s telephone number, including area code)
Securities registered pursuant to Section 12(b) of the Act:
| Title of each class | Name of exchange on which registered | |
| Common Stock, par value of $0.001 per share | Nasdaq Global Select Market |
Securities registered pursuant to Section 12(g) of the Act:
None
Indicate by check mark if the registrant is a well-known seasoned issuer, as defined in Rule 405 of the Securities Act.
Yes o No x
Indicate by check mark if the registrant is not required to file reports pursuant to Section 13 or 15(d) of the Act. Yes o No x
Indicate by check mark whether the Registrant (1) has filed all reports required to be filed by Section 13 or 15(d) of the Securities Exchange Act of 1934 during the preceding 12 months (or for such shorter period that the Registrant was required to file such reports), and (2) has been subject to such filing requirements for the past 90 days. Yes x No o
Indicate by check mark whether the registrant has submitted electronically and posted on its corporate Web site, if any, every Interactive Data File required to be submitted and posted pursuant to Rule 405 of Regulation S-T during the preceding 12 months (or for such shorter period that the registrant was required to submit and post such files). Yes x No o
Indicate by check mark if disclosure of delinquent filers pursuant to Item 405 of Regulation S-K is not contained herein, and will not be contained to the best of the Registrant’s knowledge, in definitive proxy or information statements incorporated by reference in Part III of this Form 10-K or any amendment to this Form 10-K. o
Indicate by check mark whether the registrant is a large accelerated filer, an accelerated filer, a non-accelerated filer, a smaller reporting company, or an emerging growth company. See definition of “large accelerated filer,” “accelerated filer,” “smaller reporting company,” and “emerging growth company” in Rule 12b-2 of the Exchange Act. (Check one):
| Large accelerated filer | x | Accelerated filer | o | Non-accelerated filer (Do not check if a smaller reporting company) | o | Smaller reporting company | o |
| Emerging Growth company | o |
If an emerging growth company, indicate by check mark if the registrant has elected not to use the extended transition period for complying with any new or revised financial accounting standards provided pursuant to Section 13(a) of the Exchange Act. o
Indicate by check mark whether the registrant is a shell company (as defined in Rule 12b-2 of the Exchange Act). Yes o No x
As of December 30, 2017, the aggregate market value of the voting and non-voting common equity held by non-affiliates of the registrant was approximately $1,678 million based on the closing sales price of the registrant’s common stock as reported on the NASDAQ Stock Market on December 29, 2017 of $48.90 per share. Shares of common stock held by officers, directors and holders of more than five percent of the outstanding common stock have been excluded from this calculation because such persons may be deemed to be affiliates.
As of August 23, 2018, the Registrant had 63.3 million shares of common stock outstanding.
DOCUMENTS INCORPORATED BY REFERENCE
Portions of the information called for by Part III of this Annual Report on Form 10-K is hereby incorporated by reference from the definitive proxy statement for the Registrant’s annual meeting of stockholders, which will be filed with the Securities and Exchange Commission not later than 120 days after the Registrant’s fiscal year ended June 30, 2018.
FORWARD-LOOKING STATEMENTS
This Annual Report on Form 10-K (this “Annual Report”) contains forward-looking statements within the meaning of Section 27A of the Securities Act of 1933, as amended, and Section 21E of the Securities Exchange Act of 1934, as amended, (the “Exchange Act”). These statements are based on our current expectations and involve risks, uncertainties and assumptions that, if they never materialize or prove incorrect, could cause our results to differ materially from those expressed or implied by such forward-looking statements. These statements relate to, among other things, our markets, products and strategy, sales, gross margins, operating expenses, capital expenditures and requirements, liquidity, product development and R&D efforts, manufacturing plans, litigation, effective tax rates and tax reserves, our corporate and financial reporting structure, our plans for growth and innovation, the successful integration of Oclaro’s business (including personnel) after closing, and expected synergies and non-GAAP earnings accretion from the acquisition of Oclaro, and are often identified by the use of words such as, but not limited to, “anticipate,” “believe,” “can,” “continue,” “could,” “estimate,” “expect,” “intend,” “may,” “might,” “plan,” “project,” “seek,” “should,” “target,” “will,” “would” and similar expressions or variations intended to identify forward-looking statements. These statements are based on the beliefs and assumptions of our management, which are in turn based on information currently available to management. Such forward-looking statements are subject to risks, uncertainties and other important factors that could cause actual results and the timing of certain events to differ materially from future results expressed or implied by such forward-looking statements. Factors that could cause or contribute to such differences include, but are not limited to, those discussed in the section entitled “Risk Factors” included under Part I, Item 1A below. Furthermore, such forward-looking statements speak only as of the date of this report. Except as required by law, we undertake no obligation to update any forward-looking statements to reflect events or circumstances after the date of such statements.
PART I
Item 1. BUSINESS
General
Overview
Lumentum Holdings Inc. (“we”, “our”, “Lumentum” or the “Company”) is an industry-leading provider of optical and photonic products defined by revenue and market share addressing a range of end market applications including Optical Communications and Commercial Lasers for manufacturing, inspection and life-science applications. We seek to use our core optical and photonic technology and our volume manufacturing capability to expand into attractive emerging markets that benefit from advantages that optical or photonics-based solutions provide, including 3D sensing for consumer electronics and diode light sources for a variety of consumer and industrial applications. The majority of our customers tend to be original equipment manufacturers (“OEMs”) that incorporate our products into their products which then address end-market applications. For example, we sell fiber optic components that our network equipment manufacturer (“NEM”) customers assemble into communications networking systems, which they sell to network service providers or enterprises with their own networks. Similarly, many of our customers for our Lasers products incorporate our products into tools they produce, which are used for manufacturing processes by their customers. For 3D sensing, we sell diode lasers to manufacturers of consumer electronics products for mobile, personal computing, and gaming who then integrate our devices within their products, for eventual resale to consumers and also into other industrial applications.
We operate in two reportable segments: Optical Communications (“OpComms”) and Commercial Lasers (“Lasers”).
We have a global marketing and sales footprint that enables us to address global market opportunities for our products. We have manufacturing capabilities and facilities in North America, Asia-Pacific, and Europe, with employees engaged in R&D, administration, manufacturing, support and sales and marketing activities. Our headquarters are located in Milpitas, California, and we employed approximately 2,930 full-time employees around the world as of June 30, 2018.
Lumentum was incorporated in Delaware as a wholly owned subsidiary of JDS Uniphase Corporation (“JDSU”) on February 10, 2015, and is comprised of the former communications and commercial optical products (“CCOP”) segment and WaveReady product lines of JDSU. In August 2015, we became an independent publicly-traded company through the distribution by JDSU to its stockholders of 80.1% of our outstanding common stock (the “Separation”). Each JDSU stockholder of record as of the close of business on July 27, 2015, received one share of Lumentum common stock for every five shares of JDSU common stock held on such date. JDSU was renamed Viavi Solutions Inc. (“Viavi”) and at the time of distribution, retained ownership of 19.9% of Lumentum’s outstanding shares. Since the Separation, Viavi has sold a significant portion of its shares and is no longer a significant shareholder of Lumentum.
Our business traces its origins to Uniphase Corporation, which was formed in 1979, and became publicly traded in 1992. Uniphase was originally a supplier of commercial lasers, and later, a leading supplier of optical transmission products. In 1999, JDS Fitel Inc., a pioneer in products for fiber optic networking which was formed in 1981, merged with Uniphase to become JDSU, a global leader in optical networking. Subsequent acquisitions by JDSU broadened the depth and breadth of the OpComms and Lasers businesses, as well as the intellectual property, technology and product offerings, of what is now Lumentum. Notable amongst these acquisitions in the OpComms business were Agility Communications, Inc. in 2005 and Picolight, Inc. in 2007 which respectively brought widely tunable, long wavelength laser technology for metro and long haul networking applications and short wavelength vertical-cavity surface-emitting lasers (“VCSELs”) for enterprise, datacenter networking, and 3D sensing applications. The fundamental laser component technologies which we acquired through these acquisitions, form the basis of virtually all optical networks today and we believe will continue to do so for the foreseeable future. These technologies will enable us to develop highly integrated products to satisfy our communications customers’ ever increasing needs for smaller, lower power and lower cost optical products. Notable acquisitions in the Lasers business were Lightwave Electronics Corporation in 2005 and Time-Bandwidth Products Inc. (“Time-Bandwidth”) in 2014. Both of these Lasers acquisitions brought high power pulsed solid-state laser products and technology to our business, which address the micro laser machining market and expanded our addressable market.
Industry Trends and Business Risks
Our business is driven by end-market applications which benefit from the performance advantages that optical solutions enable.
The OpComms markets we serve are experiencing continually increasing needs for higher data transmission speeds, fiber optic network capacity and network agility. This is driven by rapid growth in both the number of higher bandwidth broadband connections, notably those associated with mobile devices, such as high-definition video, online gaming, cloud computing and the number and scale of datacenters that require fiber optic links to enable the higher speeds and increased scale necessary to deliver high bandwidth video and other services. Our technology, which was originally developed for communications applications is also finding use in other emerging market opportunities including 3D sensing applications that employ our laser technology in mobile devices, computers, augmented and virtual reality and other consumer electronics devices. Additionally, our products are used in emerging automotive, industrial, security, safety and surveillance applications.
In the Lasers markets, customer demand is driven by the need to enable faster, higher precision volume manufacturing techniques with lower power consumption, reduced manufacturing footprint and increased productivity. These capabilities are critical as industries develop products that are smaller and lighter, increasing productivity and yield and lowering their energy consumption.
Our optical and laser solutions, developed in close collaboration with OEM partners, are well positioned to meet demand resulting from these trends. We do, however, expect to continue to encounter a number of industry and market risks and uncertainties. These risks and uncertainties may limit our visibility, and consequently, our ability to predict future revenue, profitability and general financial performance, and could create quarter over quarter variability in our financial measures. For example, the demand environment in China has fluctuated significantly in recent years, and has created volatility and uncertainty in our future demand. We cannot predict when or to what extent these uncertainties will be resolved. Our revenues, profitability and general financial performance may also be affected by: (i) pricing pressures, particularly within our OpComms markets, due to, among other things, a highly concentrated customer base, increasing competition, particularly from Asia-Pacific-based competitors, and a general commoditization trend for certain products; (ii) high product mix variability which affects revenue and gross margin; (iii) fluctuations in customer buying patterns, which cause volatility in demand, revenue and profitability; and (iv) the current trend of communication industry consolidation, which is expected to continue, that directly affects our customer bases and adds additional risk and uncertainty to our financial and business projections.
Reportable Segments
We are an industry leading provider of optical and photonic products defined by revenue and market share addressing a range of end-market applications including optical communications and commercial lasers. We have two operating segments: OpComms and Lasers. The two operating segments were primarily determined based on how the Chief Operating Decision Maker (“CODM”) views and evaluates our operations. Operating results are regularly reviewed by the CODM to make decisions about resources to be allocated to the segments and to assess their performance. Other factors, including market separation and customer specific applications, go-to-market channels, products and manufacturing, are considered in determining the formation of these operating segments. We do not track all of our property, plant, and equipment by operating segments. For the geographic identification of these assets, refer to “Note 19. Operating Segments and Geographic Information”.
The table below discloses the percentage of our total net revenue attributable to our two reportable segments. In addition, it discloses the percentage of our total net revenue attributable to product offerings within the OpComms segment:
| Years Ended | |||||||||
| June 30, 2018 | July 1, 2017 | July 2, 2016 | |||||||
| Optical Communications: | 84.9 | % | 85.6 | % | 84.3 | % | |||
| Telecom | 38.1 | % | 61.0 | % | 61.5 | % | |||
| Datacom | 12.1 | % | 20.1 | % | 18.1 | % | |||
| Consumer and Industrial | 34.7 | % | 4.5 | % | 4.7 | % | |||
| Lasers | 15.1 | % | 14.4 | % | 15.7 | % |
For further information regarding our operating segments, please refer to “Note 19. Operating Segments and Geographic Information” in the Notes to Consolidated Financial Statements.
OpComms
Markets
Our OpComms products address the following markets: telecommunications (“Telecom”), data communications (“Datacom”) and consumer and industrial (“Consumer and Industrial”).
Our OpComms products include a wide range of components, modules and subsystems to support and maintain customers including carrier networks for access (local), metro (intracity), long-haul (city-to-city and worldwide) and submarine (undersea). Additionally, our products address enterprise, cloud, and data center applications, including storage-access networks (“SANs”), local-area networks (“LANs”) and wide-area networks (“WANs”). These products enable the transmission and transport of video, audio and text data over high-capacity fiber-optic cables. We maintain leading positions in these fast growing OpComms markets through our extensive product portfolio, including reconfigurable optical add/drop multiplexers (“ROADMs”), tunable 10-gigabit small form-factor pluggable transceivers and tunable small form-factor pluggable transceivers. Our 10G, 40G legacy transceivers and a growing portfolio of 100G pluggable transceivers support LAN/SAN/WAN needs and the cloud for customers building enterprise and hyperscale data center networks. Additionally, we are engaging customers in the sale of laser chips for use in the manufacture of high-speed transceivers.
In the Consumer and Industrial market, our OpComms products include laser light sources, which are integrated into 3D sensing platforms being used in applications for mobile devices, gaming, computers, and other consumer electronics devices. New emerging applications include virtual and augmented reality, as well as automotive and industrial segments. Our products include VCSELs and edge emitting lasers which are used in 3D sensing depth imaging systems. These systems simplify the way people interact with technology by enabling the use of natural user interfaces. Systems are used for biometric identification, surveillance, and process efficiency, among numerous other application spaces. Emerging applications for this technology include various mobile device applications, autonomous vehicles, self-navigating robotics and drones in industrial applications and 3D capture of objects coupled with 3D printing. In addition, our industrial diode lasers are used primarily as pump sources for pulsed and CW Fiber Lasers.
Customers
Our OpComms customers include Accelink, Alphabet (formerly Google), Apple, Arista, Arris, Ciena, Cisco Systems, Coriant, ECI, Facebook, FiberHome, Fujitsu, HiSilicon, Huawei Marine, Huawei Technologies, Infinera, Microsoft, NEC, Nokia Networks (including Alcatel-Lucent International), O-Net, Oplink, Padtec, TE Subcom, and Yahoo. During fiscal 2018, 2017, and 2016, net revenue generated from a single customer which represented 10% or more of our total net revenue of the applicable fiscal year is summarized in the table below:
| Years Ended | ||||||||
| June 30, 2018 | July 1, 2017 | July 2, 2016 | ||||||
| APPLE | 30.0 | % | * | * | ||||
| HUAWEI | 11.0 | % | 16.7 | % | 17.1 | % | ||
| CIENA | 11.0 | % | 18.5 | % | 17.1 | % | ||
| CISCO | * | 12.4 | % | 13.0 | % | |||
| *Represents less than 10% of total net revenue |
Trends
To remain competitive, network operators worldwide must offer broader suites of digital services. To do this, they are migrating to Internet-protocol (“IP”) networks and expanding long-haul, metro regional and metro access networks, which effectively deliver broadband services while lowering capital and operating costs of dense-wavelength-division multiplexing networks.
The growing demand for capacity encourages the adoption of OpComms products across the Datacom and Telecom markets. Demand for capacity in the Datacom market is driven by the growing needs of LANs and WANs. Growth in Datacom is also driven by web and cloud services companies that are expanding data center infrastructure, increasing the need for network capacity within and between these data centers.
Demand in the Telecom market is driven by new bandwidth-intensive applications that can result in sudden and severe changes in demand almost anywhere on the network. Increasing agility in optical networks by employing ROADMs, wavelength selective switches, wavelength tunable transmission products and other agile optical products provides an effective way to respond to unpredictable bandwidth demands and to manage expenses. With more agile optical networks, a network operator can add capacity by using remote management applications rather than dispatching technicians to perform manual operations in the field.
In addition, the high-end routers, switches and cross-connect equipment that must handle legacy and internet-protocol traffic are becoming increasingly complex in order to meet higher bandwidth, scalability, speed and reliability needs. Products must provide higher levels of functionality and performance in compact designs that must also meet requirements for quality, reliability, and cost.
Deployment of fiber closer to the end user increases the availability of high-bandwidth services and we expect it will result in increased demand on the metro regional and long-haul networks into which these services feed. The dynamically reconfigurable nature of today’s agile networks enables lower operating costs and other competitive advantages, allowing service providers to use and scale network capacity more flexibly, streamline service provisioning, accelerate rerouting around points of failure and modify network topology through simple point-and-click network management systems.
Our optical products are well positioned to meet these demands. Our innovation has resulted in products that have more functionality, are less than half the size, require less power and are more cost-effective than our historical products, particularly in the area of photonic integrated circuits. Higher levels of integration have also led to development of our Super Transport Blade, which delivers all transport functions (wavelength switching, pre-amplification, post-amplification, optical supervisory channel and monitoring) in a single, integrated platform, essentially replacing three blades with one.
Strategy
In our OpComms segment, we are focused on technology leadership through collaborative innovation with our customers, cost leadership and functional integration. We endeavor to align the latest technologies with industry leading, scalable manufacturing and operations to drive the next phase of optical communications technologies and products for Telecom and Datacom applications that are faster, more agile and more reliable, making us a valuable business and technology partner for NEMs, consumer electronic companies, cloud service providers and data center operators.
Competition
We compete against various public and private companies in the markets we serve. Publicly traded companies providing optical communications components include II-VI, Acacia Communications, Accelink, ams AG, Applied Optoelectronic, Finisar, Foxconn Interconnect Technology, Furukawa Electric, Neophotonics, Oclaro, and Sumitomo Electric Industries. Private companies and subsidiaries of public companies providing optical communications components include Fujitsu Optical Components - a subsidiary of Fujitsu, Innolight Technology, Nistica - a subsidiary of Fujikura, and O-Net.
Offerings
In addition to a full selection of active and passive components, we offer increasing levels of functionality and integration in modules, circuit packs and subsystems for transmission, amplification, wavelength management and more.
In the Telecom market, we provide transmission and transport solutions for optical networks that make up the backbone of the wireline Telecom infrastructure, thereby enabling the internet. Transmission products, such as our tunable transponder, transceiver and transmitter modules, transmit and receive high-speed data signals at the ingress/egress points of the network. These products use dense wavelength division multiplexing technology to enable high capacity (from 20 to 40Tb/s in the C-Band) links driven by increasing internet demand. We also offer components including tunable lasers, receivers and modulators to address the higher end of these same network applications.
Our transport products, such as ROADMs, amplifiers and optical channel monitors provide switching, routing and conditioning of signals. We also make components for transport, including 980nm, multi-mode and Raman pumps for optical amplifiers, and passive components. Passive components include switches, attenuators, photodetectors, gain flattening filters, isolators, wavelength-division multiplexing (“WDM”) filters, arrayed waveguide gratings (“AWGs”), multiplex/de-multiplexers and integrated passive modules.
Our innovation led to the Super Transport Blade, which integrates all major optical transport functions into a single-slot blade. This all-in-one solution reduces the size, cost and power requirements of optical components, incorporates nano wavelength selective switch technology and enables greater chassis density and a smaller footprint.
In the Datacom market, which relies on storing, moving and manipulating vast amounts of data, we offer transmission products, such as our optical transceivers for Fiber Channel and Ethernet applications. Our transceivers are also used to connect servers, switches, routers and other information technology infrastructure critical for today’s email, enterprise resource planning and other cloud services such as streaming of high definition and 4k video.
Our integrated fiber optic transceivers provide cost effective and scalable connectivity and are used in the hardware that runs many of the applications people use daily such as email, social networking, cloud storage, online gaming and streaming video. They are available in several hot-pluggable form factors and allow for very compact, high-density hardware designs.
For the high 100G data rate, we offer several technologies to balance technical and commercial requirements. For high volume, short distance applications we developed our VCSELs. VCSELs are ideal for short reaches because they are low power consumption, low cost and highly scalable. For high-performance, longer distance applications we have our distributed feedback laser (“DFB”)
and electro-absorption modulated laser (“EML”). Our individual lasers and compact laser arrays offer an innovative solution for the LANs, SANs, broadband Internet and metro-area network as well as hyperscale datacenter applications.
Our 3D sensing technology enables real time depth information to any photo or video image. This represents a fundamental transition for image capture akin to the transition from monochrome to color and gives devices the ability to see the world around them in three dimensions. The immediate applications include full body imaging for gaming, 3D scanning for space mapping and facial recognition for security. Emerging applications for this technology include various mobile device applications, autonomous vehicles, self-navigating robotics and drones in industrial applications and 3D capture of objects coupled with 3D printing. 3D sensing can be applied to any device with a camera. The technologies to achieve accurate and stable 3D sensing are converging to laser based solutions. We are a leading supplier of the critical laser illumination sources for 3D sensing systems being used in applications for gaming, computing, mobile devices, and home entertainment.
Lasers
Markets
Our Lasers products serve our customers in markets and applications such as sheet metal processing, general manufacturing, biotechnology, graphics and imaging, remote sensing, and precision machining such as drilling in printed circuit boards, wafer singulation, glass cutting and solar cell scribing.
Our Lasers products are used in a variety of OEM applications including diode-pumped solid-state, fiber, diode, direct-diode and gas lasers such as argon-ion and helium-neon lasers. Fiber lasers provide kW-class output powers combined with excellent beam quality and are used in sheet metal processing and metal welding applications. Diode-pumped solid-state lasers provide excellent beam quality, low noise and exceptional reliability and are used in biotechnology, graphics and imaging, remote sensing, materials processing and precision machining applications. Diode and direct-diode lasers address a wide variety of applications, including laser pumping, thermal exposure, illumination, ophthalmology, image recording, printing, plastic welding and selective soldering. Gas lasers such as argon-ion and helium-neon lasers provide a stable, low-cost and reliable solution over a wide range of operating conditions, making them well suited for complex, high-resolution OEM applications such as flow cytometry, DNA sequencing, graphics and imaging and semiconductor inspection.
We also provide high-powered and ultrafast lasers for the industrial and scientific markets. Manufacturers use high-power, ultrafast lasers to create micro parts for consumer electronics and to process semiconductor, LED, and other types of chips. Use of ultrafast lasers for micromachining applications is being driven primarily by the increasing use of consumer electronics and connected devices globally.
Our portfolio of Lasers products includes components and subsystems used in a variety of OEM applications that range in output power from milliwatts to kilowatts and include ultraviolet, visible and infrared wavelengths. We support customer applications in the biotechnology, graphics and imaging, remote sensing, materials processing and other precision machining areas.
Customers
Our Lasers customers include Amada, ASML Holding, Beckman Coulter, Becton, Dickinson and Company, DISCO, Electro Scientific Industries, EO Technics, Han’s Laser Technology, and KLA-Tencor. During fiscal 2018, 2017, and 2016, we did not have any single customer attributable to our Lasers segment that generated net revenue of 10% or more of our total net revenue for the applicable fiscal year.
Trends
As technology advances, industries such as consumer electronics manufacturing increasingly turn to lasers when they need more precision, higher productivity and energy efficient, or “green,” alternatives for problems that cannot be solved by mechanical, electronic or other means. For example, these industries are using lasers to develop products that are smaller and lighter to increase productivity and yield and to lower their energy consumption. Lasers have been used for years to help achieve the scale and precision needed in semiconductor processing. In biotech applications, lasers have been instrumental for advances (and new standard procedures) in cytology, hematology, genome sequencing and crime scene investigations, among others. We believe the long-term trends in these industries will likely lead to increased demand for lasers.
Sheet metal processing and metal welding applications are increasingly using kW-class fiber lasers instead of kW-class CO2 lasers. Fiber lasers generate higher productivity at lower cost in such applications because they exhibit lower power consumption, better quality and generally lower user maintenance costs.
In addition, demand continues for electronic products, as well as products and components in other industries, with greater functionality while becoming smaller, lighter and less expensive. Innovative / Next generation product designs require precise
micromachining and materials processing, such as micro bending, soldering and welding. At the scale and processing speed needed, lasers are replacing mature mechanical tools such as drills for minute holes, or “vias,” in printed circuit boards and saws and scribes for singulating silicon wafers, resulting in greater precision and productivity. As these trends continue, we believe that manufacturers and other industries will increase their reliance on lasers in order to maintain or increase their competitiveness.
We believe we are well-positioned with key OEM providers of laser solutions to these industries. We continue to develop our laser portfolio to offer smaller and more cost-effective products designed specifically for the performance, integration, reliability and support needs of our OEM customers.
Strategy
In our Lasers segment, we leverage our long-term relationships with OEM customers to drive commercial laser innovation. Using established manufacturing, engineering, lasers and photonics expertise, we deliver products that meet cost-of-ownership and reliability needs while delivering on volume production demands.
Competition
We compete against various public and private companies in the commercial laser markets we serve. Publicly traded companies providing commercial laser products include Coherent and IPG Photonics.
Offerings
Our broad range of Lasers products includes diode-pumped solid-state, fiber, diode, direct-diode and gas lasers such as argon-ion and helium-neon lasers. Diode-pumped solid-state and fiber lasers that provide excellent beam quality, low noise and exceptional reliability are used in biotechnology, graphics and imaging, remote sensing, materials processing and precision machining applications. Diode and direct-diode lasers address a wide variety of applications, including laser pumping, thermal exposure, illumination, ophthalmology, image recording, printing, plastic welding and selective soldering. Gas lasers such as argon-ion and helium-neon lasers provide a stable, low-cost and reliable solution over a wide range of operating conditions, making them well suited for complex, high-resolution OEM applications such as flow cytometry, DNA sequencing, graphics and imaging and semiconductor inspection.
Acquisitions
We evaluate strategic opportunities regularly and, where appropriate, may acquire additional businesses, products, or technologies that are complementary to, or broaden the markets for our products. We believe we have strengthened our business model by expanding our addressable markets, customer base and expertise, diversifying our product portfolio and fortifying our core businesses from acquisitions as well as through organic initiatives.
On March 11, 2018, we entered into an Agreement and Plan of Merger (the “Merger Agreement”) with Oclaro, Inc. (“Oclaro”), Prota Merger Sub, Inc., and Prota Merger, LLC, pursuant to which we will acquire Oclaro and Oclaro will become a wholly-owned subsidiary of Lumentum. In accordance with the terms of the Merger Agreement, each issued and outstanding share of Oclaro common stock will be exchanged for $5.60 in cash and 0.0636 of a share of Lumentum common stock, subject to the conditions and restrictions set forth in the Merger Agreement. The total transaction consideration was approximately $1.8 billion as of the date of the Merger Agreement. Oclaro stockholders will own approximately 16% of the combined company following the closing. Oclaro’s stockholders approved the Merger Agreement on July 10, 2018 and we have received approval for the transaction under the Hart-Scott Rodino Act in the United States. We are in the process of obtaining antitrust approval in China. The Merger Agreement contains certain termination rights for both Lumentum and Oclaro. The Merger Agreement further provides that upon termination of the Merger Agreement under specified circumstances relating to failure to obtain regulatory approvals, Lumentum may be required to pay Oclaro a termination fee of $80 million.
As of August 23, 2018, the total transaction consideration was expected to be approximately $1.7 billion, which would be funded by a combination of $700 million in Lumentum common stock, $500 million in new debt, and the remaining amount from the cash balances of the combined company.
In February 2017, we completed the acquisition of a privately held company to enhance our manufacturing and vertical integration capabilities. We acquired all of the outstanding shares of the company for a total purchase consideration of $8.7 million. In connection with the acquisition, we paid upfront cash consideration of $5.1 million, incurred liabilities of $2.7 million contingent upon the achievement of certain production targets being achieved within 36 months following the acquisition date, and retained $0.9 million of the purchase price as security for the seller’s indemnification obligations, which was fully paid to the seller subsequent to the year ended June 30, 2018.
Restructuring Programs
We continue to engage in targeted restructuring plans primarily intended to reduce costs, consolidate our operations, rationalize the manufacturing of our products and align our business in response to market needs. We have focused on improving efficiencies and reducing costs by consolidating operations where appropriate, while taking into consideration our current investment strategy, product offerings, core competencies, opportunities to enhance cost efficiency and the availability of alternative manufacturers, as appropriate.
Please refer to “Management’s Discussion and Analysis of Financial Condition and Results of Operations” and “Note 14. Restructuring and Related Charges” in the Notes to Consolidated Financial Statements for information on restructuring charges.
Research and Development
During fiscal 2018, 2017 and 2016, we incurred R&D expenses of $156.8 million, $148.3 million and $141.1 million, respectively. The number of employees engaged in R&D was approximately 587 as of June 30, 2018, 598 as of July 1, 2017 and 570 as of July 2, 2016.
We devote substantial resources to R&D for the development of new and enhanced products to serve our markets. Once the design of a product is complete, our engineering efforts shift to enhancing both product performance and our ability to manufacture it in greater volume and at lower cost.
In our OpComms segment, we are maintaining our capability to provide products throughout the network, while focusing on several important sub-segments. We are increasing our emphasis on Datacom products, such as 100G and 400G transceivers while we continue to maintain strong investments in Telecom components and modules such as ROADMs and tunable devices needed for long-haul and metro markets. We are also responding to our customers’ requests for higher levels of integration, including the integration of optics, electronics and software in our modules, subsystems and circuit packs. We are providing optical technology for 3D sensing systems that simplify the way that people interact with technology. These solutions are initially being used in computing, mobile, and industrial applications, including automotive applications.
In our Lasers segment, we continue to develop new product offerings in both solid-state and fiber lasers that take advantage of technologies and components we develop. These products are targeted at serving customers engaging in biotechnology, graphics and imaging, remote sensing, and materials processing and precision micromachining markets.
Manufacturing
Our significant manufacturing facilities are located in the United States, Thailand, and Switzerland. In March 2017, we completed the purchase of a property in Thailand for additional manufacturing capacity for our future growth.
On March 30, 2018, we entered into a Transition Services Agreement (“TSA”) with one of our contract manufacturers to wind down the production of our products at their facility in China and to facilitate an orderly transition of manufacturing to our manufacturing facility in Thailand, including the purchase of the manufacturing equipment. Under the terms of the TSA, we are required to pay $5.3 million in cash upon completion of certain milestones related to the purchase of equipment. We are also required to share cost of retention and severance, and to reimburse for certain other direct and indirect costs incurred by our contract manufacturer for transition services provided. As of June 30, 2018, we have not acquired any assets under this TSA. Please refer to “Note 6. Asset Acquisition” in the Notes to Consolidated Financial Statements.
Our significant contract manufacturing partners are located primarily in Thailand, Taiwan and China. Contract manufacturers can save a significant amount of dollars on labor, material and other related production expenses. We rely on the capabilities of our contract manufactures to procure the components and manage the inventory in these locations.
Sources and Availability of Raw Materials
We use various suppliers and contract manufacturers to supply parts and components for the manufacture and support of multiple product lines. Although our intention is to establish at least two sources of supply for materials whenever possible, for certain components we have sole or limited source supply arrangements. We may not be able to procure these components from alternative sources at acceptable prices and quality within a reasonable time, or at all; therefore, the risk of loss or interruption of such arrangements could impact our ability to deliver certain products on a timely basis.
Intellectual Property
Intellectual property rights that apply to our various products include patents, trade secrets and trademarks. We do not intend to broadly license our intellectual property rights unless we can obtain adequate consideration or enter into acceptable patent cross-license agreements. As of June 30, 2018, we owned 636 U.S. patents and 255 foreign patents with expiration dates ranging from July 2018 through June 2037, and had 193 patent applications pending throughout the world.
Seasonality
Our revenue may be influenced on a quarter to quarter basis by customer demand patterns and new product introductions. Some of our products may be incorporated into consumer electronic products, which are subject to seasonality and fluctuations in demand.
Backlog
Backlog consists of purchase orders for products for which we have assigned shipment dates.
As of June 30, 2018, our backlog was $370.6 million, as compared to $218.4 million as of July 1, 2017. Due to possible changes in product delivery schedules and cancellation of product orders, and because our sales often reflect orders shipped in the same quarter in which they are received, our backlog at any particular date is not necessarily indicative of actual revenue or the level of orders for any succeeding period.
Employees
As of June 30, 2018, we employed approximately 2,930 full-time employees including approximately 1,900 employees in manufacturing, 587 employees in R&D and 443 employees in SG&A.
Outside of the United States, our business is subject to labor laws that differ from those in the United States. We follow the statutory requirements of those countries where we operate. We consider our employee relations to be good.
Environmental
Our R&D, manufacturing and distribution operations involve the use of hazardous substances and are regulated under international, federal, state and local laws governing health and safety and the environment. We apply strict standards for protection of the environment and occupational health and safety to sites inside and outside the United States, even if not subject to regulation imposed by foreign governments. We believe that our properties and operations at our facilities comply in all material respects with applicable environmental laws and occupational health and safety laws. However, the risk of environmental liabilities cannot be completely eliminated and there can be no assurance that the application of environmental and health and safety laws will not require us to incur significant expenditures. We are also regulated under a number of international, federal, state and local laws regarding recycling, product packaging and product content requirements. The environmental, product content/disposal and recycling laws are gradually becoming more stringent and may cause us to incur significant expenditures in the future.
In connection with the Separation, we agreed to indemnify Viavi for any liability associated with contamination from past operations at all properties transferred to us from Viavi, to the extent the resulting issues primarily related to our business. We have not been presented with any claims to date.
International Operations
During fiscal 2018, 2017 and 2016, net revenue from customers outside the United States based on the geographic region and country where our product is initially shipped, represented 90.8%, 85.2% and 82.0% of net revenue, respectively. In certain circumstances customers may request shipment of our products to a contract manufacturer in one country, which may differ from the location of their end customers. During fiscal 2018, our net revenue from Hong Kong, Mexico, South Korea, and Japan represented 14.7%, 11.7%, 11.7%, and 15.6% of our consolidated net revenue, respectively. During fiscal 2017, our net revenue from Hong Kong, Mexico, and Japan represented 22.6%, 18.5% and 9.9% of our consolidated net revenue, respectively. During fiscal 2016, our net revenue from Hong Kong, Mexico and Japan represented 23.7%, 12.5% and 10.3% of our consolidated net revenue, respectively. Our net revenue is primarily denominated in U.S. dollars, including our net revenue from customers outside the United States based on customer shipment locations as presented above.
As of June 30, 2018 and July 1, 2017, long-lived assets, namely our net property, plant and equipment, located outside of the United States comprised 68.2% and 67.8% of our total property, plant and equipment, net, respectively. As of June 30, 2018,
22.8% and 35.0% of our net property, plant and equipment were located in China and Thailand, respectively. As of July 1, 2017, 30.1% and 31.2% of our net property, plant and equipment were located in China and Thailand, respectively.
Please refer to “Note 19. Operating Segments and Geographic Information” in the Notes to Consolidated Financial Statements. For information regarding risks associated with our international operations, see “Item 1A. Risk Factors.”
Available Information
Our website is located at www.lumentum.com, and our investor relations website is located at www.investor.lumentum.com. Copies of our Annual Reports on Form 10-K, Quarterly Reports on Form 10-Q, Current Reports on Form 8-K and amendments to these reports filed or furnished pursuant to Section 13(a) or 15(d) of the Exchange Act, as amended, are available free of charge on our investor relations website as soon as reasonably practicable after we file such material electronically with or furnish it to the Securities and Exchange Commission (the “SEC”). The SEC also maintains a website that contains our SEC filings at www.sec.gov.
Investors and others should note that we routinely use the Investors section of our website to announce material information to investors and the marketplace. While not all of the information that the Company posts on its corporate website is of a material nature, some information could be deemed to be material. Accordingly, the Company encourages investors, the media and others interested in the Company to review the information that it shares on www.lumentum.com. Information in, or that can be accessed through, our website is not incorporated into this Form 10-K.
Item 1A. RISK FACTORS
Investors in our securities should carefully consider all of the relevant factors disclosed by us, including the following factors that could affect our results of operations, financial condition or stock price.
Risks Related to Our Business
Changing technology and intense competition require us to continuously innovate while controlling product costs, and our failure to do so may result in decreased revenues and profitability.
The markets in which we operate are dynamic and complex, and our success depends upon our ability to deliver both our current product offerings and new products and technologies on time and at acceptable prices to our customers. The markets for our products are characterized by rapid technological change, frequent new product introductions, substantial capital investment, changes in customer requirements, continued price pressures and a constantly evolving industry. Historically, these pricing pressures have led to a continued decline of average selling prices across our business. The development of new, technologically advanced products is a complex and uncertain process requiring high levels of innovation and the accurate prediction of technological and market trends. The introduction of new products also requires significant investment to ramp up production capacity, for which benefit may not be realized if we are not successful in the production of such products or if customer demand does not develop as expected. Ramping of production capacity also entails risks of delays which can limit our ability to realize the full benefit of new product introductions. We cannot assure you that we will be able to identify, develop, manufacture, market or support new or enhanced products successfully, if at all, or on a timely basis. We also cannot assure you that potential markets for our new products will materialize on the timelines we anticipate, or at all, or that our technology will meet our customers’ specifications. Our future performance will depend on the successful development, introduction, deployment and market acceptance of new and enhanced features and products that meet our customers’ current and future needs.
The market for optical communications products in particular has matured over time and these products have increasingly become subject to commoditization. Both legacy competitors as well as new entrants, predominantly Asia-based competitors, have intensified market competition in recent years leading to pricing pressure. To preserve our revenues and product margin structures, we remain reliant on an integrated customer and market approach that anticipates end customer needs as Telecom and Datacom requirements evolve. We also must continue to develop more advanced, differentiated products that command a premium with customers, while conversely continuing to focus on streamlining product costs for established legacy products. If we fail to continue to develop enhanced or new products, or over time are unable to adjust our cost structure to continue to competitively price more mature products, our financial condition and results of operations could be materially and adversely affected.
Continued competition in our markets may lead to an accelerated reduction in our prices, revenues and market share.
The end markets for optical products have experienced significant industry consolidation during the past few years. As a result, the markets for optical subsystems and components are highly competitive. Our current competitors include a number of domestic and international public and private companies, many of which may have substantially greater financial, technical, marketing and distribution resources and brand name recognition than we have. These competitors include II-VI, Acacia Communications, Applied Optoelectronics, Coherent, Finisar, Foxconn Interconnect Technology, Fujitsu Optical Components, Furukawa Electric, InnoLight Technology, IPG Photonics, Neophotonics, Source Photonics, and Sumitomo Electric Industries. We may not be able to compete successfully against either current or future competitors. Our competitors may continue to enter markets or gain or retain market share through introduction of new or improved products or with aggressive low pricing strategies that may impact the efficacy of our approach. Additionally, if significant competitors were to merge or consolidate, they may be able to offer a lower cost structure through economies of scale that we may be unable to match and which may intensify competition in the various markets. Increased competition could result in significant price erosion, reduced revenue, lower margins or loss of market share, any of which would significantly harm our business.
We rely on a limited number of customers for a significant portion of our sales; and the majority of our customers do not have contractual purchase commitments.
We have consistently relied on a small number of customers for a significant portion of our sales and in certain of our markets, such as 3D sensing, this customer concentration is particularly acute. We expect that this customer concentration will continue in the future and we expect that our growth prospects will continue to be concentrated in a small number of customers. Many of our customers purchase products under purchase orders or under contracts that do not contain volume purchase commitments. Some customers provide us with their expected forecasts for our products several months in advance, but these customers may decrease, cancel or delay purchase orders already in place, including on short notice, and the impact of any such actions may be intensified given our dependence on a limited number of large customers. In addition, changes in the business requirements, vendor selection, project prioritization, financial prospects, capital resources, and expenditures, or purchasing behavior (including product mix
purchased or timing of purchases) of our key customers, or any real or perceived quality issues related to the products that we sell to such customers, could significantly decrease our sales to such customers or could lead to delays or cancellations of planned purchases of our products or services, which increases the risk of quarterly fluctuations in our revenues and operating results. Further, we may be required to purchase raw materials, increase production capacity or make other changes to our business to accommodate certain large customers. If forecasted orders do not materialize, we may need to reduce investment in R&D activities, we may fail to optimize our manufacturing capacity, we may incur liabilities with our suppliers for reimbursement of capital expenditures, or we may have excess inventory. In addition, if we incur expenses in response to forecasted demand and do not have a corresponding increase in revenue, our profitability may suffer. Any of these factors could adversely affect our business, financial condition and results of operations.
The manufacturing of our products may be adversely affected if our contract manufacturers and suppliers fail to meet our production requirements or if we are unable to manufacture certain products in our manufacturing facilities.
We rely on several independent contract manufacturers to supply us with certain products. For many products, a particular contract manufacturer may be the sole source of the finished-good products. We depend on these manufacturers to meet our production and capacity requirements and to provide quality products to our customers. Despite rigorous testing for quality, both by us and the contract manufacturers to whom we sell products, we may receive and ship defective products. We may incur significant costs to correct defective products which could result in the loss of future sales, indemnification costs or costs to replace or repair the defective products, litigation and damage to our reputation and customer relations. Defective products may also ca
Showing the first 8K of 106K characters. Open the full section
Item 1B. UNRESOLVED STAFF COMMENTS
None.
Item 2. PROPERTIES
We own and lease various properties in the United States and nine other countries around the world. We use the properties for executive and administrative offices, data centers, product development offices, customer service offices and manufacturing facilities. Our corporate headquarters of approximately 126,000 square feet is located in Milpitas, California. As of June 30, 2018, our leased and owned properties in total were approximately 1,200,000 square feet, of which we owned approximately 650,000 square feet, including a 560,000 square feet manufacturing site in Thailand. Larger leased sites include properties located in Canada, China and the United States. We believe our existing properties, including both owned and leased sites, are in good condition and suitable for the conduct of our business.
From time to time we consider various alternatives related to our long-term facilities’ needs. While we believe our existing facilities are adequate to meet our immediate needs, it may become necessary to lease, acquire, or sell additional or alternative space to accommodate future business needs.
Item 3. LEGAL PROCEEDINGS
We are subject to a variety of claims and suits that arise from time to time in the ordinary course of our business. While management currently believes that resolving claims against us, individually or in the aggregate, will not have a material adverse impact on our financial position, results of operations or cash flows, these matters are subject to inherent uncertainties and management’s view of these matters may change in the future. Were an unfavorable final outcome to occur, there exists the possibility of a material adverse impact on our financial position, results of operations or cash flows for the period in which the effect becomes reasonably estimable.
In connection with our acquisition of Oclaro, seven lawsuits were filed by purported stockholders of Oclaro challenging the proposed merger (the “Merger”). Two of the seven suits were putative class actions filed against Oclaro, its directors, Lumentum, Prota Merger Sub, Inc. and Prota Merger, LLC: Nicholas Neinast v. Oclaro, Inc., et al., No. 3:18-cv-03112-VC, in the United States District Court for the Northern District of California (filed May 24, 2018) (the “Neinast Lawsuit”); and Adam Franchi v. Oclaro, Inc., et al., No. 1:18-cv-00817-GMS, in the United States District Court for the District of Delaware (filed June 9, 2018) (the “Franchi Lawsuit). Both the Neinstat Lawsuit and the Franchi Lawsuit were voluntarily dismissed with prejudice.
The other five suits, styled as Gerald F. Wordehoff v. Oclaro, Inc., et al., No. 5:18-cv-03148-NC (the “Wordehoff Lawsuit”), Walter Ryan v. Oclaro, Inc., et al., No. 3:18-cv-03174-VC (the “Ryan Lawsuit”), Jayme Walker v. Oclaro, Inc., et al., No. 5:18-cv-03203-EJD (the “Walker Lawsuit”), Kevin Garcia v. Oclaro, Inc., et al., No. 5:18-cv-03262-VKD (the “Garcia Lawsuit”), and SaiSravan B. Karri v. Oclaro, Inc., et al., No. 3:18-cv-03435-JD (the “Karri Lawsuit” and, together with the other six lawsuits, the “Lawsuits”), were filed in the United States District Court for the Northern District of California on May 25, 2018, May 29, 2018, May 30, 2018, May 31, 2018, and June 9, 2018, respectively. These five Lawsuits named Oclaro and its directors as defendants only and did not name Lumentum. The Wordehoff, Ryan, Walker, and Garcia Lawsuits have been voluntarily dismissed, and the Wordehoff, Ryan, and Walker dismissals were with prejudice. The Karri Lawsuit has not yet been dismissed. The Ryan Lawsuit was, and the Karri Lawsuit is, a putative class action.
The Lawsuits generally alleged, among other things, that Oclaro and its directors violated Section 14(a) of the Securities Exchange Act of 1934, as amended (the “Exchange Act”), and Rule 14a-9 promulgated thereunder by disseminating an incomplete and misleading Form S-4, including proxy statement/prospectus. The Lawsuits further alleged that Oclaro’s directors violated Section 20(a) of the Exchange Act by failing to exercise proper control over the person(s) who violated Section 14(a) of the Exchange Act.
The remaining Lawsuit (the Karri Lawsuit) currently purports to seek, among other things, injunctive relief preventing the parties from consummating the Merger, damages to be awarded to the plaintiff and any class if the Merger is consummated, and litigation costs, including attorneys’ fees. The defendants intend to defend the Karri Lawsuit vigorously.
Item 4. MINE SAFETY DISCLOSURES
None.
PART II
Item 5. MARKET FOR REGISTRANT’S COMMON EQUITY, RELATED STOCKHOLDER MATTERS AND ISSUER PURCHASES OF EQUITY SECURITIES
Market Information for Common Stock and Stockholders
From August 4, 2015, our common stock has traded on the NASDAQ Stock Market under the symbol “LITE”. The following table sets forth the range of high and low closing prices of our common stock per the NASDAQ Global Select Market for the periods indicated:
| High | Low | ||||||
| Fiscal 2018 Quarter Ended: | |||||||
| June 30, 2018 | $ | 64.50 | $ | 50.20 | |||
| March 31, 2018 | $ | 73.20 | $ | 42.60 | |||
| December 30, 2017 | $ | 64.75 | $ | 46.40 | |||
| September 30, 2017 | $ | 67.95 | $ | 50.80 | |||
| Fiscal 2017 Quarter Ended: | |||||||
| July 1, 2017 | $ | 65.10 | $ | 42.75 | |||
| April 1, 2017 | $ | 54.70 | $ | 34.40 | |||
| December 31, 2016 | $ | 44.50 | $ | 33.60 | |||
| October 1, 2016 | $ | 41.99 | $ | 23.30 |
According to records of our transfer agent, we had 2,530 stockholders of record as of August 23, 2018 and we believe there is a substantially greater number of beneficial holders.
Dividends
Our subsidiary, Lumentum Inc., issued $35.8 million in Series A Preferred Stock to Viavi, which was sold to Amada following the Separation. Holders of Series A Preferred Stock, in preference to holders of Lumentum Inc.’s common stock or any other class or series of its outstanding capital stock ranking in any such event junior to the Series A Preferred Stock, are entitled to receive, when and as declared by the board of directors, quarterly cumulative cash dividends at the annual rate of 2.5% of the Issuance Value per share on each outstanding share of Series A Preferred Stock. The accrued dividends are payable on March 31, June 30, September 30 and December 31 of each year commencing on September 30, 2015. During fiscal 2018, Lumentum Inc. paid $0.7 million in dividends to the holders of Series A Preferred Stock.
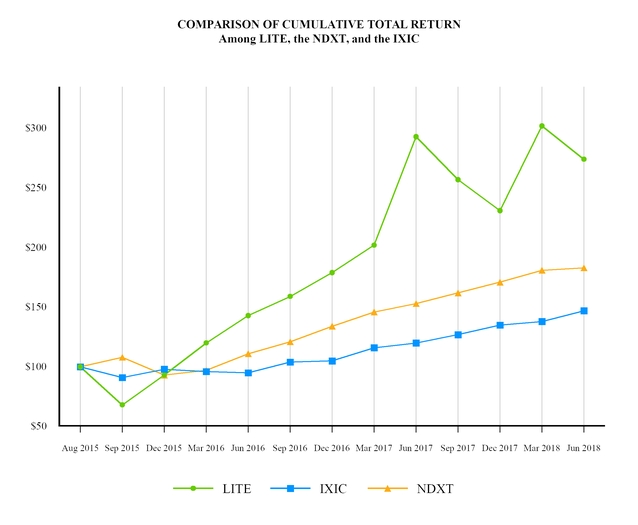
Stock Performance Graph
This performance graph shall not be deemed “filed” for purposes of Section 18 of the Securities Exchange Act of 1934, as amended (the Exchange Act), or incorporated by reference into any filing of Lumentum Holdings Inc. under the Securities Act of 1933, as amended, or the Exchange Act, except as shall be expressly set forth by specific reference in such filing.
The following graph compares the cumulative total return of our common stock with the total return for the NASDAQ Composite Index (the “IXIC”) and the NASDAQ 100 Technology Sector Index (the “NDXT”) from August 4, 2015 through June 30, 2018. The stock price performance on the following graph is not necessarily indicative of future stock price performance.
Recent Sale of Unregistered Equity Securities
None.
Issuer Purchases of Equity Securities
None.
Item 6. SELECTED FINANCIAL DATA
This table sets forth selected financial data of Lumentum (in millions, except share and per share amounts) for the periods indicated. This data should be read in conjunction with the discussion in “Management’s Discussion and Analysis of Financial Condition and Results of Operations” included in Item 7 of this Annual Report and our audited consolidated financial statements included in Item 8 of this Annual Report. The selected data in this section are not intended to replace the Consolidated Financial Statements included in this Annual Report.
Our historical consolidated financial statements include allocations of expenses arising from shared services and infrastructure provided by Viavi to us, including costs of information technology, human resources, accounting, legal, real estate and facilities, corporate marketing, insurance, treasury and other corporate and infrastructure services. There were no allocations of expenses from Viavi for the fiscal years ended June 30, 2018 or July 1, 2017. The financial information included here may not necessarily reflect our financial position and results of operations or what our financial position and results of operations would have been had we been an independent, publicly-traded company during the entirety of the periods presented or be indicative of our future performance as an independent company.
| Years Ended | |||||||||||||||||||
| June 30, 2018 | July 1, 2017 (4) | July 2, 2016 | June 27, 2015 (1) | June 28, 2014 (2) | |||||||||||||||
| Consolidated Statements of Operations Data: | |||||||||||||||||||
| Net revenue | $ | 1,247.7 | $ | 1,001.6 | $ | 903.0 | $ | 837.1 | $ | 817.9 | |||||||||
| Gross profit | 432.1 | 318.1 | 277.3 | 257.9 | 256.6 | ||||||||||||||
| Income (loss) from operations | 139.9 | 47.6 | 11.5 | (23.4 | ) | 8.7 | |||||||||||||
| Net (loss) income | 248.1 | (102.5 | ) | 9.3 | (3.4 | ) | 10.7 | ||||||||||||
| Cumulative dividends on Series A Preferred Stock | (0.9 | ) | (0.9 | ) | (0.8 | ) | — | — | |||||||||||
| Accretion of Series A Preferred Stock | — | — | (11.7 | ) | — | — | |||||||||||||
| Earnings allocated to Series A Preferred Stock | (5.7 | ) | — | — | — | — | |||||||||||||
| Net income (loss) attributable to common stockholders | $ | 241.5 | $ | (103.4 | ) | $ | (3.2 | ) | $ | (3.4 | ) | $ | 10.7 | ||||||
| Net income (loss) per share attributable to common stockholders(3): | |||||||||||||||||||
| Basic | $ | 3.88 | $ | (1.71 | ) | $ | (0.05 | ) | $ | (0.06 | ) | $ | 0.18 | ||||||
| Diluted | $ | 3.82 | $ | (1.71 | ) | $ | (0.05 | ) | $ | (0.06 | ) | $ | 0.18 | ||||||
| Shares used to compute net income (loss) per share attributable to common stockholders(3): | |||||||||||||||||||
| Basic | 62.3 | 60.6 | 59.1 | 58.8 | 58.8 | ||||||||||||||
| Diluted | 63.3 | 60.6 | 59.1 | 58.8 | 58.8 |
| Balance as of | |||||||||||||||||||
| June 30, 2018 | July 1, 2017 (4) | July 2, 2016 | June 27, 2015 (1) | June 28, 2014 (2) | |||||||||||||||
| Consolidated Balance Sheet Data: | |||||||||||||||||||
| Cash and cash equivalents | $ | 397.3 | $ | 272.9 | $ | 157.1 | $ | 14.5 | $ | 19.9 | |||||||||
| Total assets | 1,581.5 | 1,232.9 | 726.3 | 512.6 | 492.1 | ||||||||||||||
| Convertible notes | 334.2 | 317.5 | — | — | — | ||||||||||||||
| Derivative liability | 52.4 | 51.6 | 10.3 | — | — | ||||||||||||||
| Other non-current liabilities | 19.0 | 25.0 | 9.1 | 9.8 | 19.6 | ||||||||||||||
| Total redeemable convertible preferred stock | 35.8 | 35.8 | 35.8 | — | — | ||||||||||||||
| Total stockholders’ equity | 926.1 | 618.8 | 497.4 | 380.6 | 335.6 |
| (1) | During the third quarter of fiscal 2015, we settled an audit in a non-U.S. jurisdiction which resulted in the recognition of a $21.8 million tax benefit. In addition, we recognized $14.1 million of additional deferred tax assets which were fully offset by a corresponding increase in the deferred tax valuation allowance. |
| (2) | During the third quarter of fiscal 2014, we acquired Time-Bandwidth in a transaction accounted for in accordance with the authoritative guidance on business combinations. The Consolidated Statement of Operations for fiscal 2014 included the results of operations from Time-Bandwidth subsequent to the date of acquisition, and the Consolidated Balance Sheets as of June 28, 2014 included Time-Bandwidth’s financial position. |
| (3) | On August 1, 2015, JDSU distributed 47.1 million shares, or 80.1% of the outstanding shares of Lumentum common stock to existing holders of JDSU common stock. JDSU was renamed Viavi and at the time of distribution, retained 11.7 million shares, or 19.9% of Lumentum’s outstanding shares. Basic and diluted net income (loss) per share for all periods through June 27, 2015 is calculated using the shares of Lumentum common stock outstanding on August 1, 2015. Refer to “Note 4. Earnings Per Share” in the Notes to Consolidated Financial Statements. |
| (4) | During the third quarter of fiscal 2017, we completed the acquisition of a privately held company in accordance with the authoritative guidance on business combinations. Results of operations and financial position of the business acquired have been included in our consolidated financial statements subsequent to the date of acquisition. |
Item 7. Management’s Discussion and Analysis of Financial Condition and Results of Operations
You should read the following discussion in conjunction with the audited consolidated financial statements and the corresponding notes included elsewhere in this Annual Report. This Management’s Discussion and Analysis of Financial Condition and Results of Operations contains forward-looking statements. The matters discussed in these forward-looking statements are subject to risk, uncertainties and other factors that could cause actual results to differ materially from those made, projected or implied in the forward-looking statements. Please see “Risk Factors” and “Forward-Looking Statements” for a discussion of the uncertainties, risks and assumptions associated with these statements.
Overview
We are an industry leading provider of optical and photonic products defined by revenue and market share addressing a range of end-market applications including optical communications and commercial lasers. We have two operating segments: OpComms and Lasers. The two operating segments were primarily determined based on how the Chief Operating Decision Maker (“CODM”) views and evaluates our operations. Operating results are regularly reviewed by the CODM to make decisions about resources to be allocated to the segments and to assess their performance. Other factors, including market separation and customer specific applications, go-to-market channels, products and manufacturing, are considered in determining the formation of these operating segments.
We see the world as becoming more reliant on ever-increasing amounts of data flowing through optical networks and data centers, which demand new networks and data centers to be built to satisfy this insatiable demand for data. As higher levels of precision, new materials, factory and energy efficiency are being demanded by manufacturers, suppliers of manufacturing tools globally are turning more and more to laser based approaches, including the types of lasers Lumentum supplies. Laser based 3D sensing is a rapidly developing market. The technology enables computer vision applications that enhance security, safety, and new functionality in the electronic devices that people rely on every day. We believe the global markets in which Lumentum participates have fundamentally robust, long-term trends that increase the need for our photonics products and technologies.
During fiscal 2018, we made good progress on our key strategic objectives that accelerated growth, margin expansion, and customer and end-market diversification. We ramped new major product lines in 3D sensing for mobile devices and engaged numerous customers globally, which we believe will facilitate future product and customer expansion.
OpComms
Our OpComms products address the following markets: Telecom, Datacom and Consumer and Industrial.
Our OpComms products include a wide range of components, modules and subsystems to support and maintain customers including carrier networks for access (local), metro (intracity), long-haul (city-to-city and worldwide) and, submarine (undersea). Additionally, our products address enterprise, cloud, and data center applications, including SANs, LANs, and WANs. These products enable the transmission and transport of video, audio and text data over high-capacity fiber-optic cables. We maintain leading positions in these fast growing OpComms markets through our extensive product portfolio, including ROADMs, tunable 10-gigabit small form-factor pluggable transceivers and tunable small form-factor pluggable transceivers. Our 10G, 40G legacy transceivers and a growing portfolio of 100G pluggable transceivers support LAN/SAN/WAN needs and the cloud for customers building enterprise and hyperscale data center networks. Additionally, we are engaging customers in the sale of laser chips for use in the manufacture of high-speed transceivers.
In the Consumer and Industrial market, our OpComms products include laser light sources, which are integrated into 3D sensing platforms being used in applications for mobile devices, gaming, computers, and other consumer electronics devices. New emerging applications include virtual and augmented reality, as well as automotive and industrial segments. Our products include VCSELs and edge emitting lasers which are used in 3D sensing depth imaging systems. These systems simplify the way people interact with technology by enabling the use of natural user interfaces. Systems are used for biometric identification, surveillance, and process efficiency, among numerous other application spaces. Emerging applications for this technology include various mobile device applications, autonomous vehicles, self-navigating robotics and drones in industrial applications and 3D capture of objects coupled with 3D printing. In addition, our industrial diode lasers are used primarily as pump sources for pulsed and CW Fiber Lasers.
Our OpComms customers include Accelink, Alphabet (formerly Google), Apple, Arista, Arris, Ciena, Cisco Systems, Coriant, ECI, Facebook, FiberHome, Fujitsu, HiSilicon, Huawei Marine, Huawei Technologies, Infinera, Microsoft, NEC, Nokia Networks (including Alcatel-Lucent International), O-Net, Oplink, Padtec, TE Subcom, and Yahoo.
Lasers
Our Lasers products serve our customers in markets and applications such as sheet metal processing, general manufacturing, biotechnology, graphics and imaging, remote sensing, and precision machining such as drilling in printed circuit boards, wafer singulation, glass cutting and solar cell scribing.
Our Lasers products are used in a variety of OEM applications including diode-pumped solid-state, fiber, diode, direct-diode and gas lasers such as argon-ion and helium-neon lasers. Fiber lasers provide kW-class output powers combined with excellent beam quality and are used in sheet metal processing and metal welding applications. Diode-pumped solid-state lasers provide excellent beam quality, low noise and exceptional reliability and are used in biotechnology, graphics and imaging, remote sensing, materials processing and precision machining applications. Diode and direct-diode lasers address a wide variety of applications, including laser pumping, thermal exposure, illumination, ophthalmology, image recording, printing, plastic welding and selective soldering. Gas lasers such as argon-ion and helium-neon lasers provide a stable, low-cost and reliable solution over a wide range of operating conditions, making them well suited for complex, high-resolution OEM applications such as flow cytometry, DNA sequencing, graphics and imaging and semiconductor inspection.
We also provide high-powered and ultrafast lasers for the industrial and scientific markets. Manufacturers use high-power, ultrafast lasers to create micro parts for consumer electronics and to process semiconductor, LED, and other types of chips. Use of ultrafast lasers for micromachining applications is being driven primarily by the increasing use of consumer electronics and connected devices globally.
Our Lasers customers include Amada, ASML Holding, Beckman Coulter, Becton, Dickinson and Company, DISCO, Electro Scientific Industries, EO Technics, Han’s Laser Technology, and KLA-Tencor.
Acquisition of Oclaro
On March 11, 2018, we entered into an Agreement and Plan of Merger (the “Merger Agreement”) with Oclaro, Inc. (“Oclaro”), Prota Merger Sub, Inc., and Prota Merger, LLC, pursuant to which we will acquire Oclaro and Oclaro will become a wholly-owned subsidiary of Lumentum. In accordance with the terms of the Merger Agreement, each issued and outstanding share of Oclaro common stock will be exchanged for $5.60 in cash and 0.0636 of a share of Lumentum common stock, subject to the conditions and restrictions set forth in the Merger Agreement. The total transaction consideration was approximately $1.8 billion as of the date of the Merger Agreement. Oclaro stockholders will own approximately 16% of the combined company following the closing. Oclaro’s stockholders approved the Merger
Showing the first 8K of 73K characters. Open the full section
Item 7A. QUANTITATIVE AND QUALITATIVE DISCLOSURES ABOUT MARKET RISK
Foreign Exchange Risk
We conduct our business and sell our products to customers primarily in Asia, Europe, and North America. Due to the impact of changes in foreign currency exchange rates between the U.S. Dollar and foreign currencies, for the fiscal years ended June 30, 2018, July 1, 2017, and July 2, 2016, we recorded unrealized gain (loss) of $0.3 million, $0.6 million and $(0.9) million, respectively, in the interest and other income (expense), net in the Consolidated Statements of Operations included in this Annual Report.
Although we sell primarily in U.S. Dollar, we have foreign currency exchange risks related to our operating expenses denominated in currencies other than the U.S. Dollar, principally the Thai Baht, Taiwan Dollar, Canadian Dollar, Japanese Yen, Swiss Franc, Euro, and Chinese Yuan. The volatility of exchange rates depends on many factors that we cannot forecast with reliable accuracy. In the event our foreign currency denominated assets, liabilities, sales or expenses increase, our operating results may be more greatly affected by fluctuations in the exchange rates of the currencies in which we do business.
Equity Price Risk
We are exposed to equity price risk related to the conversion options embedded in our Series A Preferred Stock and the 2024 Notes. Our Series A Preferred Stock is convertible, at the option of the holder, into shares of our common stock commencing on the second anniversary of the closing of the securities purchase (absent a change of control of us or similar event) using a conversion price of $24.63.
In March 2017, we issued the 2024 Notes in a private placement with an aggregate principal amount of $450 million. We carry the 2024 Notes at face value less amortized discount on the consolidated balance sheet. The 2024 Notes bear interest at a rate of 0.25% per year. Since the 2024 Notes bear interest at fixed rates, we have no financial statement risk associated with changes in interest rates. However, the potential value of the shares to be distributed to the holders of 2024 Notes changes when the market price of our stock fluctuates. The 2024 Notes will mature on March 15, 2024, unless earlier repurchased by us or converted pursuant to their terms, at a conversion price of approximately $60.62 per share.
The conversion feature is bifurcated from the Series A Preferred Stock and accounted for separately as a derivative liability. On a quarterly basis, the derivative liability is marked to market based on the fair values of the conversion feature, with the resulting income or loss recorded as unrealized gain (loss) on a derivative liability on our consolidated statements of operations. The determination of fair values includes various inputs, including volatility and interest rate assumptions (see “Note 12. Derivative Liability”). However, the change in the fair value of our common stock has the largest impact to the fair value of the derivative. Based on a hypothetical $10.00 per share increase or decrease in the fair value of our common stock, our net income would be reduced or increased by approximately ($14.5) million or $14.5 million, respectively, for the Series A Preferred Stock derivative.
Interest Rate Fluctuation Risk
As of June 30, 2018, we had cash, cash equivalents, and short-term investments of $711.5 million. Cash equivalents and short-term investments are primarily comprised of highly liquid investment grade fixed income securities. Our investment policy and strategy is focused on the preservation of capital and supporting our liquidity requirements. We do not enter into investments for trading or speculative purposes. As of June 30, 2018, the weighted-average duration of our investment portfolio was less than six months. Our fixed-income portfolio is subject to fluctuations in interest rates, which could affect our results of operations. Based on our investment portfolio balance as of June 30, 2018, a hypothetical increase or decrease in interest rates of 1% (100 basis points) would have resulted in a decrease or an increase in the fair value of our portfolio of approximately $2.5 million, and a hypothetical increase or decrease of 0.5% (50 basis points) would have resulted in a decrease or an increase in the fair value of our portfolio of approximately $1.2 million.
Item 8. FINANCIAL STATEMENTS AND SUPPLEMENTARY DATA
REPORT OF INDEPENDENT REGISTERED PUBLIC ACCOUNTING FIRM
To the Board of Directors and Stockholders of Lumentum Holdings Inc.
Opinion on the Financial Statements
We have audited the accompanying consolidated balance sheets of Lumentum Holdings Inc. and subsidiaries (the “Company”) as of June 30, 2018 and July 1, 2017, the related consolidated statements of operations, comprehensive income (loss), cash flows, and redeemable convertible preferred stock, stockholders’ equity and invested equity for each of the two years in the period ended June 30, 2018, and the related notes and the schedule listed in the Index at Item 15 (collectively referred to as the “financial statements”). In our opinion, the financial statements present fairly, in all material respects, the financial position of the Company as of June 30, 2018 and July 1, 2017, and the results of its operations and its cash flows for each of the two years in the period ended June 30, 2018, in conformity with accounting principles generally accepted in the United States of America.
We have also audited, in accordance with the standards of the Public Company Accounting Oversight Board (United States) (PCAOB), the Company's internal control over financial reporting as of June 30, 2018, based on criteria established in Internal Control - Integrated Framework (2013) issued by the Committee of Sponsoring Organizations of the Treadway Commission and our report dated August 28, 2018, expressed an unqualified opinion on the Company's internal control over financial reporting.
Basis for Opinion
These financial statements are the responsibility of the Company's management. Our responsibility is to express an opinion on the Company's financial statements based on our audits. We are a public accounting firm registered with the PCAOB and are required to be independent with respect to the Company in accordance with the U.S. federal securities laws and the applicable rules and regulations of the Securities and Exchange Commission and the PCAOB.
We conducted our audits in accordance with the standards of the PCAOB. Those standards require that we plan and perform the audit to obtain reasonable assurance about whether the financial statements are free of material misstatement, whether due to error or fraud. Our audits included performing procedures to assess the risks of material misstatement of the financial statements, whether due to error or fraud, and performing procedures that respond to those risks. Such procedures included examining, on a test basis, evidence regarding the amounts and disclosures in the financial statements. Our audits also included evaluating the accounting principles used and significant estimates made by management, as well as evaluating the overall presentation of the financial statements. We believe that our audits provide a reasonable basis for our opinion.
/s/ DELOITTE & TOUCHE LLP
San Jose, California
August 28, 2018
We have served as the Company's auditor since 2017.
Report of Independent Registered Public Accounting Firm
To the Board of Directors and Stockholders of Lumentum Holdings Inc.
In our opinion, the consolidated statements of operations, of comprehensive income (loss), of redeemable convertible preferred stock, stockholders’ equity, and invested equity and of cash flows for the year ended July 2, 2016 present fairly, in all material respects, the results of operations and cash flows of Lumentum Holdings Inc. and its subsidiaries for the year ended July 2, 2016, in conformity with accounting principles generally accepted in the United States of America. In addition, in our opinion, the financial statement schedule for the year ended July 2, 2016, appearing under Item 15(2), presents fairly, in all material respects, the information set forth therein when read in conjunction with the related consolidated financial statements. These financial statements and financial statement schedule are the responsibility of the Company's management. Our responsibility is to express an opinion on these financial statements and financial statement schedule based on our audit. We conducted our audit of these financial statements in accordance with the standards of the Public Company Accounting Oversight Board (United States). Those standards require that we plan and perform the audit to obtain reasonable assurance about whether the financial statements are free of material misstatement. An audit includes examining, on a test basis, evidence supporting the amounts and disclosures in the financial statements, assessing the accounting principles used and significant estimates made by management, and evaluating the overall financial statement presentation. We believe that our audit provides a reasonable basis for our opinion.
/s/ PricewaterhouseCoopers LLP
San Jose, California
September 2, 2016
LUMENTUM HOLDINGS INC.
CONSOLIDATED STATEMENTS OF OPERATIONS
(in millions, except per share data)
| Years Ended | |||||||||||
| June 30, 2018 | July 1, 2017 | July 2, 2016 | |||||||||
| Net revenue | $ | 1,247.7 | $ | 1,001.6 | $ | 903.0 | |||||
| Cost of sales | 812.4 | 677.0 | 618.9 | ||||||||
| Amortization of acquired developed technologies | 3.2 | 6.5 | 6.8 | ||||||||
| Gross profit | 432.1 | 318.1 | 277.3 | ||||||||
| Operating expenses: | |||||||||||
| Research and development | 156.8 | 148.3 | 141.1 | ||||||||
| Selling, general and administrative | 128.2 | 110.2 | 117.3 | ||||||||
| Restructuring and related charges | 7.2 | 12.0 | 7.4 | ||||||||
| Total operating expenses | 292.2 | 270.5 | 265.8 | ||||||||
| Income from operations | 139.9 | 47.6 | 11.5 | ||||||||
| Unrealized loss on derivative liabilities | (0.8 | ) | (104.2 | ) | (0.6 | ) | |||||
| Interest and other income (expense), net | (9.7 | ) | (3.2 | ) | (1.2 | ) | |||||
| Income (loss) before income taxes | 129.4 | (59.8 | ) | 9.7 | |||||||
| Provision for (benefit from) income taxes | (118.7 | ) | 42.7 | 0.4 | |||||||
| Net income (loss) | 248.1 | (102.5 | ) | 9.3 | |||||||
| Items reconciling net income (loss) to net income (loss) attributable to common stockholders: | |||||||||||
| Cumulative dividends on Series A Preferred Stock | (0.9 | ) | (0.9 | ) | (0.8 | ) | |||||
| Accretion of Series A Preferred Stock | — | — | (11.7 | ) | |||||||
| Earnings allocated to Series A Preferred Stock | (5.7 | ) | — | — | |||||||
| Net income (loss) attributable to common stockholders - Basic | $ | 241.5 | $ | (103.4 | ) | $ | (3.2 | ) | |||
| Net income (loss) attributable to common stockholders - Diluted | $ | 241.5 | $ | (103.4 | ) | $ | (3.2 | ) | |||
| Net income (loss) per share attributable to common stockholders: | |||||||||||
| Basic | $ | 3.88 | $ | (1.71 | ) | $ | (0.05 | ) | |||
| Diluted | $ | 3.82 | $ | (1.71 | ) | $ | (0.05 | ) | |||
| Shares used to compute net income (loss) per share attributable to common stockholders: | |||||||||||
| Basic | 62.3 | 60.6 | 59.1 | ||||||||
| Diluted | 63.3 | 60.6 | 59.1 |
See accompanying notes to consolidated financial statements.
LUMENTUM HOLDINGS INC.
CONSOLIDATED STATEMENTS OF COMPREHENSIVE INCOME (LOSS)
(in millions)
| Years Ended |
Showing the first 8K of 207K characters. Open the full section
Item 9. CHANGES IN AND DISAGREEMENTS WITH ACCOUNTANTS ON ACCOUNTING AND FINANCIAL DISCLOSURE
None.
Item 9A. CONTROLS AND PROCEDURES
(a) EVALUATION OF DISCLOSURE CONTROLS AND PROCEDURES
Our management is responsible for establishing and maintaining adequate internal control over financial reporting. Management, with the participation of our chief executive officer and our chief financial officer, evaluated the effectiveness of our disclosure controls and procedures as of June 30, 2018. The term “disclosure controls and procedures,” as defined in Rules 13a-15 and 15d-15 under the Exchange Act, means controls and other procedures of a company that are designed to ensure that information required to be disclosed by a company in the reports that it files or submits under the Exchange Act is recorded, processed, summarized and reported within the time periods specified in the SEC’s rules and forms. Disclosure controls and procedures include, without limitation, controls and procedures designed to ensure that information required to be disclosed by a company in the reports that it files or submits under the Exchange Act is accumulated and communicated to the company’s management, including its principal executive and principal financial officers, as appropriate to allow timely decisions regarding required disclosure. Management recognizes that any controls and procedures, no matter how well designed and operated, can provide only reasonable assurance of achieving their objectives, and management necessarily applies its judgment in evaluating the cost-benefit relationship of possible controls and procedures. Based on the evaluation of our disclosure controls and procedures as of June 30, 2018, our chief executive officer and chief financial officer concluded that our disclosure controls and procedures were effective at a reasonable assurance level.
(b) MANAGEMENT’S REPORT ON INTERNAL CONTROL OVER FINANCIAL REPORTING
Our management is responsible for establishing and maintaining adequate internal control over financial reporting (as defined in Rule 13a-15(f) under the Exchange Act). Management conducted an assessment of the effectiveness of our internal control over financial reporting based on the criteria set forth in Internal Control—Integrated Framework issued by the Committee of Sponsoring Organizations of the Treadway Commission (2013 framework). Based on the assessment, management has concluded that its internal control over financial reporting was effective as of June 30, 2018 to provide reasonable assurance regarding the reliability of financial reporting and the preparation of financial statements in accordance with U.S. GAAP.
Deloitte & Touche LLP, the independent registered public accounting firm that audited the consolidated financial statements included in this Form 10-K, has issued a report, included herein, on the effectiveness of the Company’s internal control over financial reporting as of June 30, 2018.
(c) CHANGES IN INTERNAL CONTROL OVER FINANCIAL REPORTING
There were no changes in our internal control over financial reporting identified in connection with the evaluation required by Rule 13a-15 and 15d-15 of the Exchange Act that occurred during the quarter ended June 30, 2018 that have materially affected, or are reasonably likely to materially affect, our internal control over financial reporting.
INHERENT LIMITATIONS ON EFFECTIVENESS OF CONTROLS
Our management, including the CEO and CFO, recognizes that our disclosure controls and procedures or our internal control over financial reporting cannot prevent or detect all possible instances of errors and all fraud. A control system, no matter how well designed and operated, can provide only reasonable, not absolute, assurance that the control system’s objectives will be met. The design of a control system must reflect the fact that there are resource constraints, and the benefits of controls must be considered relative to their costs.
REPORT OF INDEPENDENT REGISTERED PUBLIC ACCOUNTING FIRM
To the stockholders and the Board of Directors of Lumentum Holdings Inc.
Opinion on Internal Control over Financial Reporting
We have audited the internal control over financial reporting of Lumentum Holdings Inc. and subsidiaries (the “Company”) as of June 30, 2018, based on criteria established in Internal Control - Integrated Framework (2013) issued by the Committee of Sponsoring Organizations of the Treadway Commission (COSO). In our opinion, the Company maintained, in all material respects, effective internal control over financial reporting as of June 30, 2018, based on criteria established in Internal Control - Integrated Framework (2013) issued by COSO.
We have also audited, in accordance with the standards of the Public Company Accounting Oversight Board (United States) (PCAOB), the consolidated financial statements as of and for the year ended June 30, 2018, of the Company and our report dated August 28, 2018, expressed an unqualified opinion on those financial statements.
Basis for Opinion
The Company’s management is responsible for maintaining effective internal control over financial reporting and for its assessment of the effectiveness of internal control over financial reporting, included in the accompanying Management's Annual report on Internal control over Financial Reporting. Our responsibility is to express an opinion on the Company’s internal control over financial reporting based on our audit. We are a public accounting firm registered with the PCAOB and are required to be independent with respect to the Company in accordance with the U.S. federal securities laws and the applicable rules and regulations of the Securities and Exchange Commission and the PCAOB.
We conducted our audit in accordance with the standards of the PCAOB. Those standards require that we plan and perform the audit to obtain reasonable assurance about whether effective internal control over financial reporting was maintained in all material respects. Our audit included obtaining an understanding of internal control over financial reporting, assessing the risk that a material weakness exists, testing and evaluating the design and operating effectiveness of internal control based on the assessed risk, and performing such other procedures as we considered necessary in the circumstances. We believe that our audit provides a reasonable basis for our opinion.
Definition and Limitations of Internal Control over Financial Reporting
A company’s internal control over financial reporting is a process designed to provide reasonable assurance regarding the reliability of financial reporting and the preparation of financial statements for external purposes in accordance with generally accepted accounting principles. A company’s internal control over financial reporting includes those policies and procedures that (1) pertain to the maintenance of records that, in reasonable detail, accurately and fairly reflect the transactions and dispositions of the assets of the company; (2) provide reasonable assurance that transactions are recorded as necessary to permit preparation of financial statements in accordance with generally accepted accounting principles, and that receipts and expenditures of the company are being made only in accordance with authorizations of management and directors of the company; and (3) provide reasonable assurance regarding prevention or timely detection of unauthorized acquisition, use, or disposition of the company’s assets that could have a material effect on the financial statements.
Because of its inherent limitations, internal control over financial reporting may not prevent or detect misstatements. Also, projections of any evaluation of effectiveness to future periods are subject to the risk that controls may become inadequate because of changes in conditions, or that the degree of compliance with the policies or procedures may deteriorate.
/s/ DELOITTE & TOUCHE LLP
San Jose, California
August 28, 2018
Item 9B. OTHER INFORMATION
None.
PART III
The SEC allows us to include information required in this report by referring to other documents or reports we have already filed or will soon be filing. This is called “incorporation by reference.” We intend to file our definitive proxy statement for our 2018 annual meeting of stockholders (the “Proxy Statement”) pursuant to Regulation 14A not later than 120 days after the end of the fiscal year covered by this report, and certain information to be contained therein is incorporated in this report by reference.
Item 10. DIRECTORS, EXECUTIVE OFFICERS AND CORPORATE GOVERNANCE
The information required for this Item is set forth in the Proxy Statement and incorporated herein by reference.
Item 11. EXECUTIVE COMPENSATION
The information required for this Item is set forth in the Proxy Statement and incorporated herein by reference.
Item 12. SECURITY OWNERSHIP OF CERTAIN BENEFICIAL OWNERS AND MANAGEMENT AND RELATED STOCKHOLDER MATTERS
The information required for this Item is set forth in the Proxy Statement and incorporated herein by reference.
Item 13. CERTAIN RELATIONSHIPS AND RELATED TRANSACTIONS, AND DIRECTOR INDEPENDENCE
The information required for this Item is set forth in the Proxy Statement and incorporated herein by reference.
Item 14. PRINCIPAL ACCOUNTING FEES AND SERVICES
The information required for this Item is set forth in the Proxy Statement and incorporated herein by reference.
PART IV
Item 15. EXHIBITS, FINANCIAL STATEMENTS SCHEDULES
- Financial Statements
The financial statements filed as part of this report are listed in the “Index to Financial Statements” under Part II, Item 8 of this report.
- Financial Statement Schedules
The following additional financial statement schedules should be considered in conjunction with our consolidated financial statements. All other financial statement schedules have been omitted because the required information is not present in amounts sufficient to require submission of the schedule, not applicable, or because the required information is included in the Consolidated Financial Statements or Notes thereto.
LUMENTUM HOLDINGS INC.
FINANCIAL STATEMENT SCHEDULES
SCHEDULE II - VALUATION AND QUALIFYING ACCOUNTS
| (in millions) | |||||||||||||||
| Balance at Beginning of Period | Increase (decrease) to Income Statement | Write Offs | Balance at End of Period | ||||||||||||
| Accounts receivable allowance: | |||||||||||||||
| Fiscal year ended June 30, 2018 | $ | 1.8 | $ | 0.9 | $ | (0.1 | ) | $ | 2.6 | ||||||
| Fiscal year ended July 1, 2017 | $ | 0.9 | $ | 1.0 | $ | (0.1 | ) | $ | 1.8 | ||||||
| Fiscal year ended July 2, 2016 | $ | 1.2 | $ | 0.6 | $ | (0.9 | ) | $ | 0.9 |
| (in millions) | ||||||||||||||||
| Description | Balance at Beginning of Period | Additions Charged to Expenses or Other Accounts* | Deductions Credited to Expenses or Other Accounts** | Balance at End of Period | ||||||||||||
| Deferred tax valuation allowance: | ||||||||||||||||
| Fiscal year ended June 30, 2018 | $ | 296.4 | $ | 234.1 | $ | (431.1 | ) | $ | 99.4 | |||||||
| Fiscal year ended July 1, 2017 | $ | 321.4 | $ | 16.7 | $ | (41.7 | ) | $ | 296.4 | |||||||
| Fiscal year ended July 2, 2016 | $ | 160.0 | $ | 214.3 | $ | (52.9 | ) | $ | 321.4 |
- Additions include current year additions charged to expenses and current year build due to increases in net deferred tax assets, return to provision true-ups, other adjustments to deferred taxes.
** Deductions include current year releases credited to expenses and current year reductions due to decreases in net deferred tax assets, return to provision true-ups, other adjustments to deferred taxes.
- Exhibits
The following exhibits are filed herewith or are incorporated by reference to exhibits previously filed with the Securities and Exchange Commission.
| Incorporated by Reference | Filed | |||||||||
| Exhibit No. | Exhibit Description | Form | Exhibit | Filing Date | Herewith | |||||
| 2.1 | Contribution Agreement | 8-K | 2.1 | 8/6/2015 | ||||||
| 2.1 | Agreement and Plan of Merger, dated as of March 11, 2018, by and among Lumentum Holdings Inc., Oclaro, Inc., Prota Merger Sub, Inc. and Prota Merger, LLC | 8-K | 2.1 | 3/12/2018 | ||||||
| 2.2 | Separation and Distribution Agreement | 8-K | 2.2 | 8/6/2015 | ||||||
| 3.1 | Amended and Restated Certificate of Incorporation | 8-K | 3.1 | 8/6/2015 | ||||||
| 3.2 | Amended and Restated Bylaws | 8-K | 3.2 | 8/6/2015 | ||||||
| 4.1 | Stockholder’s and Registration Rights Agreement | 8-K | 4.1 | 8/6/2015 | ||||||
| 4.2 | Indenture, dated March 8, 2017, between Lumentum Holdings Inc. and U.S. Bank National Association | 8-K | 4.1 | 3/9/2017 | ||||||
| 4.3 | Form of 0.250% Convertible Senior Notes due 2024 (included in Exhibit 4.2) | 8-K | 4.2 | 3/9/2017 | ||||||
| 10.1 | Tax Matters Agreement | 8-K | 10.1 | 8/6/2015 |
*Indicates management contract or compensatory plan or arrangement.
† The certifications furnished in Exhibits 32.1 and 32.2 that accompany this Amendment, are not deemed filed with the Securities and Exchange Commission and are not to be incorporated by reference into any filing of the Registrant under the Securities Act of 1933, as amended, or the Securities Exchange Act of 1934, as amended, whether made before or after the date of this Amendment, irrespective of any general incorporation language contained in such filing.
Item 16. FORM 10-K SUMMARY.
None.
SIGNATURES
Pursuant to the requirements of Section 13 or 15(d) of the Securities Exchange Act of 1934, the Registrant has duly caused this Annual Report to report on Form 10-K to be signed on its behalf by the undersigned, thereunto duly authorized.
| Date: | August 28, 2018 | LUMENTUM HOLDINGS INC. | |
| /s/ Christopher W. Coldren | |||
| By: | Christopher W. Coldren | ||
| Senior Vice President, Interim Chief Financial Officer |
POWER OF ATTORNEY
KNOW ALL PERSONS BY THESE PRESENTS, that each person whose signature appears below hereby constitutes and appoints Christopher W. Coldren and Judy Hamel, and each of them individually, as his or her attorney-in-fact, each with full power of substitution, for him or her in any and all capacities to sign any and all amendments to this Annual Report on Form 10-K, and to file the same with, with exhibits thereto and other documents in connection therewith, with the Securities and Exchange Commission, hereby ratifying and confirming all that said attorney-in-fact, or his or her substitute, may do or cause to be done by virtue hereof.
Pursuant to the requirements of the Securities Exchange Act of 1934, this Annual Report on Form 10-K has been signed below by the following persons on behalf of the Registrant and in the capacities and on the dates indicated.
| Signature | Title | Date | ||
| /s/ ALAN LOWE | President, Chief Executive Officer and Director (principal executive officer) | August 28, 2018 | ||
| Alan Lowe | ||||
| /s/ CHRISTOPHER W. COLDREN | Senior Vice President, Interim Chief Financial Officer (principal financial officer) | August 28, 2018 | ||
| Christopher W. Coldren | ||||
| /s/ MATTHEW SEPE | Chief Accounting Officer (principal accounting officer) | August 28, 2018 | ||
| Matthew Sepe | ||||
| /s/ HAROLD COVERT | Director | August 28, 2018 | ||
| Harold Covert | ||||
| /s/ JULIE JOHNSON | Director | August 28, 2018 | ||
| Julie Johnson | ||||
| /s/ PENELOPE HERSCHER | Director | August 28, 2018 | ||
| Penelope Herscher | ||||
| /s/ MARTIN KAPLAN | Chairman | August 28, 2018 | ||
| Martin Kaplan | ||||
| /s/ BRIAN LILLIE | Director | August 28, 2018 | ||
| Brian Lillie | ||||
| /s/ SAMUEL THOMAS | Director | August 28, 2018 | ||
| Samuel Thomas |