 filings.tools
Item 5. Market for Registrant’s Common Equity, Related Stockholder Matters and Issuer Purchases of Equity Securities
5K characters. Original on sec.gov · Markdown
Item 5. Market for Registrant’s Common Equity, Related Stockholder Matters and Issuer Purchases of Equity Securities
Lowe’s common stock is traded on the New York Stock Exchange (NYSE). The ticker symbol for Lowe’s is “LOW”. As of March 29, 2018, there were 22,926 holders of record of Lowe’s common stock. The following table sets forth, for the periods indicated, the high and low sales prices per share of the common stock as reported by the NYSE Composite Tape and the dividends per share declared on the common stock during such periods.
| Fiscal 2017 | Fiscal 2016 | ||||||||||||||||||||||
| High | Low | Dividend | High | Low | Dividend | ||||||||||||||||||
| 1st Quarter | $ | 86.00 | $ | 72.11 | $ | 0.35 | $ | 77.63 | $ | 62.62 | $ | 0.28 | |||||||||||
| 2nd Quarter | 86.25 | 71.58 | 0.41 | 83.65 | 74.56 | 0.35 | |||||||||||||||||
| 3rd Quarter | 82.74 | 70.76 | 0.41 | 82.68 | 66.71 | 0.35 | |||||||||||||||||
| 4th Quarter | 108.98 | 77.14 | 0.41 | 76.47 | 64.87 | 0.35 |
Total Return to Shareholders
The following information in Item 5 of this Annual Report is not deemed to be “soliciting material” or to be “filed” with the SEC or subject to Regulation 14A or 14C under the Securities Exchange Act of 1934 or to the liabilities of Section 18 of the Securities Exchange Act of 1934, and will not be deemed to be incorporated by reference into any filing under the Securities Act of 1933 or the Securities Exchange Act of 1934, except to the extent we specifically incorporate it by reference into such a filing.
The following table and graph compare the total returns (assuming reinvestment of dividends) of the Company’s common stock, the S&P 500 Index (S&P 500) and the S&P Retailing Industry Group Index (S&P Retail Index). The graph assumes $100 invested on February 1, 2013 in the Company’s common stock and each of the indices.
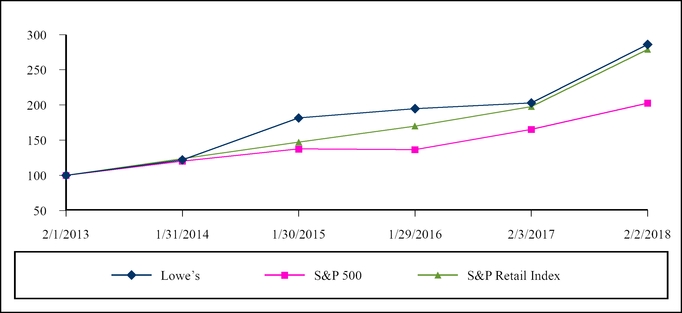
| 2/1/2013 | 1/31/2014 | 1/30/2015 | 1/29/2016 | 2/3/2017 | 2/2/2018 | ||||||||||||||||||
| Lowe’s | $ | 100.00 | $ | 121.96 | $ | 181.46 | $ | 194.85 | $ | 202.83 | $ | 286.15 | |||||||||||
| S&P 500 | 100.00 | 120.30 | 137.42 | 136.50 | 165.26 | 202.66 | |||||||||||||||||
| S&P Retail Index | $ | 100.00 | $ | 123.90 | $ | 147.13 | $ | 170.01 | $ | 197.77 | $ | 278.96 |
Issuer Purchases of Equity Securities
The following table sets forth information with respect to purchases of the Company’s common stock made during the fourth quarter of fiscal 2017:
| Total Number of Shares Purchased 1 | Average Price Paid per Share | Total Number of Shares Purchased as Part of Publicly Announced Plans or Programs 2 | Dollar Value of Shares that May Yet Be Purchased Under the Plans or Programs 2 | ||||||||||
| November 4, 2017 – December 1, 2017 | 1,677,589 | $ | 79.14 | 1,677,580 | $ | 1,943,395,179 | |||||||
| December 2, 2017 – January 5, 2018 | 931 | 88.59 | — | 1,943,395,179 | |||||||||
| January 6, 2018 – February 2, 2018 | 570 | 103.70 | — | 6,943,395,179 | |||||||||
| As of February 2, 2018 | 1,679,090 | $ | 79.16 | 1,677,580 | $ | 6,943,395,179 |
| 1 | The total number of shares purchased includes shares withheld from employees to satisfy either the exercise price of stock options or the statutory withholding tax liability upon the vesting of share-based awards. |
| 2 | On January 27, 2017, the Company announced that its Board of Directors authorized a $5.0 billion repurchase program with no expiration. On January 26, 2018, the Company announced that its Board of Directors authorized an additional $5.0 billion of share repurchases with no expiration. |
Previous: Item 4. Mine Safety Disclosures · Next: Item 6. Selected Financial Data