 filings.tools
Lam Research (LRCX) 10-K risk factor changes: FY2016 vs FY2015
The 2016-06-26 10-K against the 2015-06-28 one, compared heading by heading and sentence by sentence. One of these filings carries no fiscal year tag, so its year is the calendar year of the period end.
Item 1A133 rewritten296 added10 removed161 unchanged
All filing items1,329 rewritten1,513 added391 removed1,000 unchanged
Summary
counted, not written
- Item 1A headings could not be compared: only 0 carried over between the two years, which usually means one filing was read wrongly, so none is reported as new or removed.
- Sentence by sentence, 1,513 added, 391 removed, 1,329 rewritten and 1,000 unchanged across 21 items that differ.
Sentences by item
21 items, with every count and a link to each item that changed
Underlined words on a shaded ground are new in FY2016; struck-through words were in FY2015. Sentences that are wholly new or wholly gone are labelled rather than marked.
Item 1A. Risk Factors
133 rewritten, 296 added, 10 removed, 161 unchanged
In addition to the other information in this Annual Report on Form 10-K [removed: (“2015] [added: (“2016] Form 10-K”), the following risk factors should be carefully considered in evaluating the Company and its business because such factors may significantly impact our business, operating results, and financial condition.
[removed: _The] [added: The] Semiconductor Capital Equipment Industry is Subject to Variability and, as a Result, We Face Risks Related to Our Strategic Resource Allocation [removed: Decisions_][added: Decisions]
[removed: Despite the recent reduction in cyclicality, the] [added: The] semiconductor capital equipment industry has historically been characterized by rapid changes in demand.
Variability in our customers’ business plans may lead to changes in demand for our equipment and [removed: services] [added: services,] which could negatively impact our results.
During periods of rapid growth or decline in demand for our products and services, we face significant challenges in maintaining adequate financial and business controls, management processes, information systems, procedures for training and managing our work force, and in appropriately sizing our supply chain infrastructure, [added: work force, and other components of our business on a timely basis.]
[removed: _Future] [added: Future] Declines in the Semiconductor Industry, and the Overall World Economic Conditions on Which it is Significantly Dependent, Could Have a Material Adverse Impact on Our Results of Operations and Financial [removed: Condition_][added: Condition]
Our business depends on the capital equipment expenditures of semiconductor manufacturers, which in turn depend on the current and anticipated market demand for [removed: ICs.][added: integrated circuits.]
With the consolidation of customers within the [removed: industry] [added: industry,] the semiconductor capital equipment market may experience rapid changes in demand driven both by changes in the market generally and the plans and requirements of particular customers.
| [removed: |] • | [removed: |] a decline in demand for our products or services; |
| [removed: |] • | [removed: |] an increase in reserves on accounts receivable due to our customers’ inability to pay us; |
| [removed: |] • | [removed: |] an increase in reserves on inventory balances due to excess or obsolete inventory as a result of our inability to sell such inventory; |
| [removed: |] • | [removed: |] valuation allowances on deferred tax assets; |
| [removed: |] • | [removed: |] restructuring charges; |
| [removed: |] • | [removed: |] asset impairments including the potential impairment of goodwill and other intangible assets; |
| [removed: |] • | [removed: |] a decline in the value of our investments; |
| [removed: |] • | [removed: |] exposure to claims from our suppliers for payment on inventory that is ordered in anticipation of customer purchases that do not come to fruition; |
| [removed: |] • | [removed: |] a decline in the value of certain facilities we lease to less than our residual value guarantee with the lessor; and |
| [removed: |] • | [removed: |] challenges maintaining reliable and uninterrupted sources of supply. |
[removed: _Our] [added: Our] Quarterly Revenues and Operating Results Are [removed: Variable_][added: Variable]
| [removed: |] • | [removed: |] economic conditions in the electronics and semiconductor industries in general and specifically the semiconductor equipment industry; |
| [removed: |] • | [removed: |] the size and timing of orders from customers; |
| [removed: |] • | [removed: | Consolidation] [added: consolidation] of the customer [removed: base] [added: base, which] may result in the investment decisions of one customer or market [removed: to] having a significant effect on demand for our products or services; |
| [removed: |] • | [removed: |] procurement shortages; |
| [removed: |] • | [removed: |] the failure of our suppliers or outsource providers to perform their obligations in a manner consistent with our expectations; |
| [removed: |] • | [removed: |] manufacturing difficulties; |
| [removed: |] • | [removed: |] customer cancellations or delays in shipments, installations, and/or customer acceptances; |
| [removed: |] • | [removed: |] the extent that customers continue to purchase and use our products and services in their business; |
| [removed: |] • | [removed: |] our customers’ reuse of existing and installed products, to the extent that such reuse decreases their need to purchase new products or services; |
| [removed: |] • | [removed: |] changes in average selling prices, customer mix, and product mix; |
| [removed: |] • | [removed: |] our ability in a timely manner to develop, introduce and market new, enhanced, and competitive products; |
| [removed: |] • | [removed: |] our competitors’ introduction of new products; |
| [removed: |] • | [removed: |] legal or technical challenges to our products and technology; |
| [removed: |] • | [removed: |] transportation, communication, demand, information technology or supply disruptions based on factors outside our control such as strikes, acts of God, wars, terrorist activities, and natural or man-made disasters; |
| [removed: |] • | [removed: |] legal, tax, accounting, or regulatory changes (including but not limited to change in import/export regulations) or changes in the interpretation or enforcement of existing requirements; |
| [removed: |] • | [removed: |] changes in our estimated effective tax rate; |
| [removed: |] • | [removed: |] foreign currency exchange rate fluctuations; and |
| [removed: |] • | [removed: | convertibility and] the dilutive impact of our Convertible Notes [added: (as defined below)] and related warrants on our earnings per share. |
[removed: _We] [added: We] May Incur Impairments to Goodwill or Long-Lived [removed: Assets_][added: Assets]
[removed: _Our] [added: Our] Leverage and Debt Service Obligations and Potential Note Conversion or Related Hedging Activities May Adversely Affect Our Financial Condition, Results of Operations and Earnings Per [removed: Share_][added: Share]
We may, in the future, decide to borrow amounts under [removed: this facility,] [added: the revolving credit agreement,] or to enter into additional debt arrangements.
Continues on next page
Lam Research Corporation 2016 10-K 13

| | |
| | |
| --- | --- |
| | |
| --- | --- |
| | |
| --- | --- |
| | |
| --- | --- |
| | |
| --- | --- |
| | |
| --- | --- |
| | |
| --- | --- |
| | |
| --- | --- |
| | |
| --- | --- |
| | |
| --- | --- |
| | |
| --- | --- |
| | |
| --- | --- |
| | |
| --- | --- |
| | |
| --- | --- |
| | |
| --- | --- |
| | |
| --- | --- |
| | |
| --- | --- |
| | |
| --- | --- |
##### [Table of Contents](#toc)
work force, and other components of our business on a timely basis.
| --- | --- | --- | --- |
As a result of the issuance of our 2020 and 2025 Senior Notes, our 2016 and 2018 Convertible Notes, and the assumption of the 2041 Convertible Notes in connection with our acquisition of Novellus Systems, Inc. (collectively the “Notes”), we have a greater amount of debt than we have maintained in the past.
Furthermore, in March 2014, we entered into an unsecured credit agreement providing us with the ability to borrow up to $300 million (and, under certain circumstances, to increase such availability to $500 million).
System sales constitute a significant portion of our total revenue.
Many of
maintained by us, our outsourced providers or third parties such as vendors and contractors.
product lines or technologies, or reduction in personnel or that our management, personnel, or systems will be adequate to support continued operations.
covenants, other third party claims that our products when used for their intended purposes infringe the intellectual property rights of such other third parties, or other claims made against certain parties.
An excerpt. Shown here: 40 of 133 rewritten, 40 of 296 added and all 10 removed. The counts are complete. For every sentence, read Item 1A. Risk Factors in the FY2016 filing and the FY2015 filing.
Item 7. Management’s Discussion and Analysis of Financial Condition and Results of Operations
157 rewritten, 222 added, 95 removed, 100 unchanged
[removed: _The] [added: The] following discussion of our financial condition and results of operations contains forward-looking statements, which are subject to risks, uncertainties and changes in condition, significance, value and effect.
Our actual results could differ materially from those anticipated in the forward-looking statements as a result of certain factors, including but not limited to those discussed in “Risk Factors” and elsewhere in this [removed: 2015] [added: 2016] Form 10-K and other documents we file from time to time with the Securities and Exchange Commission.
(See “Cautionary Statement Regarding Forward-Looking Statements” in Part I of this [removed: 2015] [added: 2016] Form [removed: 10-K)._][added: 10-K).]
Management’s Discussion and Analysis of Financial Condition and Results of Operations (“MD&A”) provides a description of our results of operations and should be read in conjunction with our Consolidated Financial Statements and accompanying Notes to Consolidated Financial Statements included in this [removed: 2015] [added: 2016] Form 10-K.
[removed: _Executive Summary_] [added: Executive Summary] provides a summary of the key highlights of our results of operations and our management’s assessment of material trends and uncertainties relevant to our business.
[removed: _Results] [added: Results] of [removed: Operations_] [added: Operations] provides an analysis of operating results.
[removed: _Critical] [added: Critical] Accounting Policies and [removed: Estimates_] [added: Estimates] discusses accounting policies that reflect the more significant judgments and estimates used in the preparation of our Consolidated Financial Statements.
[removed: _Liquidity] [added: Liquidity] and Capital [removed: Resources_] [added: Resources] provides an analysis of cash flows, contractual obligations and financial position.
[removed: _Executive Summary_][added: Executive Summary]
Our customers include semiconductor manufacturers that make memory, microprocessors, and other logic integrated circuits for a wide range of electronics; including [removed: cell] [added: mobile] phones, computers, tablets, [added: wearables, automotive features,] storage devices, and networking equipment.
With a reduced number of customers, variability in their business plans [removed: may] lead to changes in demand for Lam’s equipment and services.
[removed: Demand] [added: During the most recent fiscal year, demand] for our products [removed: was strong throughout the fiscal year] [added: improved] as semiconductor device [removed: manufacturers] [added: manufacturers, particularly non volatile memory customers,] made capacity and technology investments.
Technology inflections in our industry, including [removed: FinFET transistors, 3D NAND,] [added: 3DNAND,] multiple patterning, [added: FINFET] and advanced packaging have led to an increase in [removed: the] [added: our served addressable market for our] deposition and etch [removed: market sizes.][added: products.]
The following summarizes certain key [removed: annual] financial information for the periods indicated below:
| | [removed: | Year Ended | |] [added: Year Ended] | | | | | | | | | | | | | | | | | | | | | | | | |
| [removed: | | June 28, 2015] [added: June 26, 2016] | | | | [removed: June 29, 2014] [added: June 28, 2015] | | | | [removed: June 30, 2013] [added: June 29, 2014] | | | | [removed: FY15] [added: FY16] vs. [removed: FY14 |] [added: FY15] | | | | | | | [removed: FY14] [added: FY15] vs. [removed: FY13] [added: FY14] | | | | | | |
| | [removed: | (in] [added: (in] thousands, except per share data and [removed: percentages) | |] [added: percentages)] | | | | | | | | | | | | | | | | | | | | | | | | |
| Gross margin | [removed: |] $ | [removed: 2,284,336] [added: 2,618,922] | | | $ | [removed: 2,007,481] [added: 2,284,336] | | | $ | [removed: 1,403,059] [added: 2,007,481] | | | $ | [removed: 276,855 |] [added: 334,586] | | | [removed: 13.8%] [added: 14.6] | [added: %] | | $ | [removed: 604,422 |] [added: 276,855] | | | [removed: 43.1%] [added: 13.8] | [added: %] |
| Total operating expenses | [removed: |] $ | [removed: 1,496,297] [added: 1,544,666] | | | $ | [removed: 1,329,812] [added: 1,496,297] | | | $ | [removed: 1,284,988] [added: 1,329,812] | | | $ | [removed: 166,485 |] [added: 48,369] | | | [removed: 12.5%] [added: 3.2] | [added: %] | | $ | [removed: 44,824 |] [added: 166,485] | | | [removed: 3.5%] [added: 12.5] | [added: %] |
| [removed: Diluted net] [added: Net] income per [added: diluted] share | [removed: |] $ | [removed: 3.70] [added: 5.22] | | | $ | [removed: 3.62] [added: 3.70] | | | $ | [removed: 0.66] [added: 3.62] | | | $ | [removed: 0.08 |] [added: 1.52] | | | [removed: 2.2%] [added: 41.1] | [added: %] | | $ | [removed: 2.96 |] [added: 0.08] | | | [removed: 448.5%] [added: 2.2] | [added: %] |
Fiscal year 2015 revenues increased 14% compared to fiscal year 2014, reflecting the steady increase in [added: spending on] technology [removed: inflections’ spending, as well as incremental market share gains.][added: inflections.]
Operating expenses in fiscal year 2015 increased as compared to fiscal year 2014 primarily [removed: related to] [added: as a result of] continued investments in the next-generation research and development.
Our cash and cash equivalents, [removed: short-term] investments, and restricted cash and investments balances totaled approximately [removed: $4.2] [added: $7.1] billion as of June [removed: 28, 2015] [added: 26, 2016] compared to [removed: $3.2] [added: $4.2] billion as of June [removed: 29, 2014.][added: 28, 2015.]
Cash [removed: flows] [added: flow] provided from operating activities was [removed: $786 million] [added: $1.4 billion] for fiscal year [removed: 2015] [added: 2016] compared to [removed: $717] [added: $786] million for fiscal year [removed: 2014.][added: 2015.]
Cash [removed: flows] [added: flow] provided from operating activities in fiscal [removed: 2015] [added: 2016] was primarily used for [removed: $573] [added: $451.5] million [added: of principal payments on debt instruments, $158.4 million] in treasury stock purchases, [removed: $116] [added: $190.4] million in dividends paid to our stockholders, and [removed: $198] [added: $175.3] million of capital expenditures, and are partially offset by [removed: $66] [added: $59.4] million of treasury stock reissuance and common stock issuance resulting from our employee equity-based compensation programs.
[removed: _Results] [added: Results] of [removed: Operations_][added: Operations]
[removed: _Shipments] [added: Shipments] and [removed: Backlog_][added: Backlog]
Shipments for fiscal year 2015 were approximately $5.5 [removed: billion and increased by] [added: billion, an increase of] 20% compared to fiscal year 2014.
Shipments for fiscal year [removed: 2014] [added: 2016] were approximately [removed: $4.6 billion and increased by 23%] [added: $5.9 billion, an increase of 8%] compared to fiscal year [removed: 2013.][added: 2015.]
[added: The] increase in shipments during [added: the] fiscal year [removed: 2014] [added: 2016] as compared to [added: the last two] fiscal [removed: year 2013] [added: years is] related to continued strengthening of customer demand for semiconductor equipment.
| | [removed: | Year Ended] [added: Year Ended] | | | | | | | | | | |
| [removed: |] [added: June 26, 2016] | [removed: June 28, 2015] | | | [added: June 28, 2015] | [removed: June 29, 2014] | | | [added: June 29, 2014] | [removed: June 30, 2013] | | |
| Shipments (in millions) | [removed: |] $ | [removed: 5,472] [added: 5,901] | | | $ | [removed: 4,551] [added: 5,472] | | | $ | [removed: 3,714] [added: 4,551] | |
| United States | [removed: |] [added: 8] | [removed: 15%] | [added: %] | | [added: 15] | [removed: 15%] | [added: %] | | [added: 15] | [removed: 20%] | [added: %] |
| Europe | [removed: |] [added: 3] | [removed: 6%] | [added: %] | | [added: 6] | [removed: 7%] | [added: %] | | [added: 7] | [removed: 8%] | [added: %] |
| Southeast Asia | [removed: |] [added: 11] | [removed: 5%] | [added: %] | | [added: 5] | [removed: 5%] | [added: %] | | [added: 5] | [removed: 7%] | [added: %] |
The percentage of total semiconductor processing system shipments to each of the markets we serve were as follows for fiscal years [added: 2016,] 2015, [removed: 2014,] and [removed: 2013.][added: 2014.]
| Memory | [removed: | | 58] [added: 68] | % | | [removed: | 60] [added: 58] | % | | [removed: | 36] [added: 60] | % |
| Foundry | [removed: | | 30] [added: 23] | % | | [removed: |] 30 | % | | [removed: | 49] [added: 30] | % |
| Logic/integrated device manufacturing | [removed: | | 12] [added: 9] | % | | [removed: | 10] [added: 12] | % | | [removed: | 15] [added: 10] | % |
Continues on next page
Lam Research Corporation 2016 10-K 32

In October 2015, as further described in Note 19 to our Consolidated Financial Statements, we announced that we had entered into an agreement to acquire KLA-Tencor Corporation.
| | | | | | | | | | | | | | | | | | | | | | | | | | |
| --- | --- | --- | --- | --- | --- | --- | --- | --- | --- | --- | --- | --- | --- | --- | --- | --- | --- | --- | --- | --- | --- | --- | --- | --- | --- |
| | | | | | | | | | | | | | | | | | | | | | | | | | |
| Revenue | $ | 5,885,893 | | | $ | 5,259,312 | | | $ | 4,607,309 | | | $ | 626,581 | | | 11.9 | % | | $ | 652,003 | | | 14.2 | % |
| Gross margin as a percent of total revenue | 44.5 | | % | | 43.4 | | % | | 43.6 | | % | | 1.1 | | % | | | | | (0.2 | | )% | | | |
| Net income | $ | 914,049 | | | $ | 655,577 | | | $ | 632,289 | | | $ | 258,472 | | | 39.4 | % | | $ | 23,288 | | | 3.7 | % |
Fiscal year 2016 revenues increased 12% compared to fiscal year 2015, reflecting an increase in technology and capacity investments by our customers.
Gross margin as a percentage of revenue improved 1.1%, which was primarily due to a more favorable customer and product mix.
Operating expenses in fiscal year 2016 increased as compared to fiscal year 2015 primarily as a result of continued investments in research and development and increased employee headcount.
Fiscal year 2016 also included KLA-Tencor acquisition related costs.
Continues on next page
Lam Research Corporation 2016 10-K 33

This increase was primarily the result of approximately $2.4 billion proceeds from June 2016 senior notes issuance, net of related issuance costs combined with cash flow provided from operating activities.
| | | | | | | | | | | | |
| --- | --- | --- | --- | --- | --- | --- | --- | --- | --- | --- | --- |
| | | | | | | | | | | | |
| Taiwan | 25 | | % | | 22 | | % | | 21 | | % |
| Korea | 17 | | % | | 26 | | % | | 24 | | % |
| China | 20 | | % | | 12 | | % | | 15 | | % |
| Japan | 16 | | % | | 14 | | % | | 13 | | % |
| | | | | | | | | |
| --- | --- | --- | --- | --- | --- | --- | --- | --- |
| | | | | | | | | |
| | Year Ended | | | | | | | |
| June 26, 2016 | | | June 28, 2015 | | | June 29, 2014 | | |
Our shipments to memory customers increased during fiscal year 2016 primarily due to higher demand from mobile, enterprise and client solid state drives.
Foundry and logic spending decreased due to relatively lower spending levels at leading edge process nodes.
Continues on next page
Lam Research Corporation 2016 10-K 34

| | | | | | | | | | | | |
| --- | --- | --- | --- | --- | --- | --- | --- | --- | --- | --- | --- |
| | | | | | | | | | | | |
| | Year Ended | | | | | | | | | | |
| June 26, 2016 | | | | June 28, 2015 | | | | June 29, 2014 | | | |
We expect growth in the overall wafer fabrication equipment market in calendar year 2015 compared to calendar year 2014 related to leading edge investments by our customers.
##### [Table of Contents](#toc)
| | | | | | | | | | | | | | | | | | | | | | | | | | | | | |
| --- | --- | --- | --- | --- | --- | --- | --- | --- | --- | --- | --- | --- | --- | --- | --- | --- | --- | --- | --- | --- | --- | --- | --- | --- | --- | --- | --- | --- |
| Revenue | | $ | 5,259,312 | | | $ | 4,607,309 | | | $ | 3,598,916 | | | $ | 652,003 | | | | 14.2% | | | $ | 1,008,393 | | | | 28.0% | |
| Gross margin as a percent of total revenue | | | 43.4% | | | | 43.6% | | | | 39.0% | | | | \-0.2% | | | | | | | | 4.6% | | | | | |
| Net income | | $ | 655,577 | | | $ | 632,289 | | | $ | 113,879 | | | $ | 23,288 | | | | 3.7% | | | $ | 518,410 | | | | 455.2% | |
This increase was primarily the result of $992 million net proceeds from March 2015 Senior Notes issuance.
The increase in shipments during fiscal year 2015 as compared to fiscal year 2014, as well as the
| | | | | | | | | | | | | |
| --- | --- | --- | --- | --- | --- | --- | --- | --- | --- | --- | --- | --- |
| Korea | | | 26% | | | | 24% | | | | 16% | |
| Taiwan | | | 22% | | | | 21% | | | | 29% | |
| Japan | | | 14% | | | | 13% | | | | 11% | |
| China | | | 12% | | | | 15% | | | | 9% | |
Our shipments to memory customers remained strong during fiscal year 2015 driven by mobile and enterprise demands.
During fiscal year 2014, memory customer demand was higher due to node transitions in memory manufacturing, stable pricing for memory, and tight industry supply.
| Korea | | | 27% | | | | 24% | | | | 17% | |
| Taiwan | | | 21% | | | | 23% | | | | 29% | |
| Japan | | | 12% | | | | 14% | | | | 10% | |
| China | | | 12% | | | | 14% | | | | 9% | |
The revenue increase in fiscal year 2014 as compared to fiscal year 2013 reflected increased customer and industry demand.
| Percent of total revenue | | | 43.4% | | | | 43.6% | | | | 39.0% | | | | \-0.2% | | | | | | | | 4.6% | | | | | |
Additionally, the Novellus acquisition related inventory fair value impact and cost associated with rationalization of certain product configurations decreased by $78 million and $15 million, respectively, in fiscal year 2014 as compared to fiscal year 2013.
| Percent of total revenue | | | 15.7% | | | | 15.6% | | | | 19.0% | | | | 0.1% | | | | | | | | \-3.4% | | | | | |
The increase in R&D expense during fiscal year 2014 compared to fiscal year 2013 was primarily due to a $41 million increase in salaries and benefits related to higher headcount and higher incentive and equity compensation offset by a reduction of $7 million in supplies.
| Percent of total revenue | | | 11.2% | | | | 13.3% | | | | 16.7% | | | | \-2.1% | | | | | | | | \-3.4% | | | | | |
The increase in SG&A expense during fiscal year 2014 compared to fiscal year 2013 was due primarily to a net increase of $11 million in salaries, benefits and incentive compensation, $20 million increase in marketing expenses and outside services, $7 million in costs associated with rationalization of certain product configurations, $8 million of impairment of long lived assets, and a $5 million cost related to the renewal of our Fremont and Livermore buildings’ operating leases.
This increase was offset by a $34 million reduction in integration costs and a $10 million reduction in amortization of intangible assets related to the Novellus integration.
Other, net expenses during fiscal year 2013 included a $4 million other-than-temporary impairment of a public equity investment recognized during the March 2013 quarter.
| Effective tax rate | | | 11.5% | | | | 12.6% | | | | \-70.8% | |
The increase in the effective tax rate in fiscal year 2014 as compared to fiscal year 2013 was primarily due to the change in the level of income and geographic mix of income between higher and lower tax jurisdictions, U.S. income and applicable foreign withholding taxes on undistributed foreign earnings of certain of our foreign subsidiaries for 2014, reduced tax benefit in fiscal year 2014 due to the expiration of the federal research and development tax credit as of December 31, 2013, and tax benefits in fiscal year 2013 related to the recognition of previously unrecognized tax benefits due to the lapse of the statute of limitations and successful resolution of certain tax matters.
Our fiscal years 2015 and 2014 valuation allowance of $86 million and $74 million primarily relate to California and certain foreign deferred tax assets.
Actual results could differ significantly from those estimates.
The significant accounting policies used in the preparation of our financial statements are described in Note 2 of our Consolidated Financial Statements.
Some of these significant accounting policies are considered to be critical accounting policies.
_Inventory Valuation:_ Inventories are stated at the lower of cost or market using standard costs that approximate actual costs on a first-in, first-out basis.
Finished goods are reported as inventories until the point of title transfer to the customer.
Unless specified in the terms of sale, title generally transfers at the physical transfer of the products to the freight carriers.
Transfer of title for shipments to Japanese customers occurs at the time of customer acceptance.
An excerpt. Shown here: 40 of 157 rewritten, 40 of 222 added and 40 of 95 removed. The counts are complete. For every sentence, read Item 7. Management’s Discussion and Analysis of Financial Condition and Results of Operations in the FY2016 filing and the FY2015 filing.
Item 7A. Quantitative and Qualitative Disclosures About Market Risk
28 rewritten, 84 added, 27 removed, 27 unchanged
[removed: Investments][added: Investments]
As of June [removed: 28, 2015,] [added: 26, 2016,] our mutual funds are classified as trading securities.
All of our other [removed: short-term] investments are classified as available-for-sale and consequently are recorded in the Consolidated Balance Sheets at fair value with unrealized gains or losses reported as a separate component of accumulated other comprehensive income, net of tax.
[removed: _Interest] [added: Interest] Rate [removed: Risk_][added: Risk]
[removed: Fixed] [added: Fixed] Income [removed: Securities][added: Securities]
[added: Market changes reflect immediate hypothetical parallel shifts in] the yield curve of plus or minus 50 basis points (“BPS”), 100 BPS, and 150 BPS.
The hypothetical fair values as of June [removed: 28, 2015] [added: 26, 2016] were as follows:
| | [removed: | Valuation] [added: Valuation] of [removed: Securities Given] [added: Securities Given] an Interest [removed: Rate Decrease] [added: Rate Decrease] of X Basis [removed: Points] [added: Points] | | | | | | | | | | | | [removed: Fair Value as of June 28, 2015] [added: Fair Value as of] | | | | [removed: Valuation] [added: Valuation] of [removed: Securities Given] [added: Securities Given] an Interest [removed: Rate Increase] [added: Rate Increase] of X Basis [removed: Points] [added: Points] | | | | | | | | | | |
| [removed: |] [added: (150 BPS)] | [removed: (150 BPS)] | | | [added: (100 BPS)] | [removed: (100 BPS)] | | | [added: (50 BPS)] | [removed: (50 BPS)] | | | [added: —%] | [removed: 0.00%] | | | [added: 50 BPS] | [removed: 50 BPS] | | | [added: 100 BPS] | [removed: 100 BPS] | | | [added: 150 BPS] | [removed: 150 BPS] | | |
| | [removed: | (in thousands)] [added: (in thousands)] | | | | | | | | | | | | | | | | | | | | | | | | | | |
[removed: Long-Term Debt][added: Long-Term Debt]
As of June [removed: 28, 2015,] [added: 26, 2016,] we had [removed: $3.6] [added: $4.55] billion in principal amount of fixed-rate long-term debt outstanding, with a fair value of [removed: $3.9] [added: $5.88] billion.
[removed: _Equity] [added: Equity] Price [removed: Risk_][added: Risk]
[removed: Publicly] [added: Publicly] Traded [removed: Securities][added: Securities]
| | [removed: | Valuation] [added: Valuation] of [removed: Securities Given] [added: Securities Given] an X% [removed: Decrease in] [added: Decrease in] Stock [removed: Price] [added: Price] | | | | | | | | | | | | [removed: Fair] [added: Fair] Value as of [removed: June 28, 2015] | | | [removed: | Valuation] [added: Valuation] of [removed: Securities Given] [added: Securities Given] an X% [removed: Increase in] [added: Increase in] Stock [removed: Price] [added: Price] | | | | | | | | | | |
| [removed: | | (25%)] [added: (25)%] | | | | [removed: (15%)] [added: (15)%] | | | | [removed: (10%)] [added: (10)%] | | | | [removed: 0.00%] [added: —%] | | | [added: 10%] | [removed: 10%] | | | [added: 15%] | [removed: 15%] | | | [added: 25%] | [removed: 25%] | | |
[removed: _Foreign] [added: Foreign] Currency Exchange (“FX”) [removed: Risk_][added: Risk]
We enter into foreign currency forward [added: and option] contracts to minimize the short-term impact of [removed: foreign currency] exchange rate fluctuations on certain foreign currency denominated monetary assets and liabilities, primarily third party accounts receivables, accounts payables and intercompany receivables and payables.
To protect against the reduction in value of anticipated revenues denominated in Japanese yen and euro-denominated and Korean won-denominated expenses, we enter into foreign currency forward [added: and option] contracts that generally expire within 12 months, and no later than 24 months.
These foreign currency [removed: forward] [added: hedge] contracts are designated as cash flow hedges and are carried on our balance sheet at fair value, with the effective portion of the contracts’ gains or losses included in accumulated other comprehensive income (loss) and subsequently recognized in earnings in the same period the hedged revenue and/or expense is recognized.
The notional amount and unrealized gain of our outstanding forward [added: and option] contracts that are designated as cash flow hedges, as of June [removed: 28, 2015] [added: 26, 2016] are shown in the table below.
[removed: This table also] shows the change in fair value of these cash flow hedges assuming a hypothetical foreign currency exchange rate movement of plus-or-minus 10 percent and plus-or-minus 15 percent.
| | | [removed: | | Notional Amount] [added: Notional Amount] | | | | [removed: Unrealized] [added: Unrealized] FX Gain / (Loss) [removed: June 28, 2015] | | | | [removed: Valuation] [added: | Valuation] of [removed: Fx] [added: FX] Contracts Given an X% Increase (+)/Decrease(-) in [removed: Each] [added: Each] | | | | | | |
| [removed: | |] [added: June 26, 2016] | | | | [removed: \+] [added: \=+] / - [removed: (10%)] [added: (10%)] | | | | [removed: \+] [added: \=+] / - [removed: (15%)] [added: (15%)] | | | | | | | | | [added: |]
| | | [removed: | | (in] [added: (in] $ [removed: Millions)] [added: Millions)] | | | | | | | | | | | | | | | [added: |]
| Buy | [removed: |] Korean Won | [added: 8.6] | [removed: $] | [removed: 7.3] | | [added: 0.1] | [removed: ($] | [removed: 0.1] | [removed: )] | | [removed: $] [added: 0.9] | [removed: 0.7] | | | [removed: $] [added: 1.3] | [removed: 1.1] | |
The notional amount and unrealized loss of our outstanding foreign currency forward contracts that are designated as balance sheet hedges, as of June [removed: 28, 2015] [added: 26, 2016] are shown in the table below.
| [removed: Balance Sheet Hedge |] [added: Forward contracts, balance sheet hedge] | | | | | | | | | | | | | | | | | |
| | | | | | | | | | | | | | | | | | | | | | | | | | | | |
| --- | --- | --- | --- | --- | --- | --- | --- | --- | --- | --- | --- | --- | --- | --- | --- | --- | --- | --- | --- | --- | --- | --- | --- | --- | --- | --- | --- |
| | | | | | | | | | | | | | | | | | | | | | | | | | | | |
| | June 26, 2016 | | | | | | | | | | | | | | | | | | | | | | | | | | |
| Time Deposit | $ | 904,243 | | | $ | 904,243 | | | $ | 904,243 | | | $ | 904,243 | | | $ | 904,243 | | | $ | 904,243 | | | $ | 904,243 | |
| Municipal Notes and Bonds | 266,956 | | | | 266,857 | | | | 266,532 | | | | 265,725 | | | | 264,913 | | | | 264,101 | | | | 263,290 | | |
| US Treasury & Agencies | 461,378 | | | | 461,378 | | | | 460,090 | | | | 456,788 | | | | 453,313 | | | | 449,837 | | | | 446,361 | | |
| Government-Sponsored Enterprises | 32,316 | | | | 32,309 | | | | 32,201 | | | | 31,963 | | | | 31,726 | | | | 31,488 | | | | 31,250 | | |
| Foreign Government Bonds | 42,093 | | | | 42,037 | | | | 41,789 | | | | 41,512 | | | | 41,233 | | | | 40,956 | | | | 40,678 | | |
| Bank and Corporate Notes | 1,000,189 | | | | 996,383 | | | | 989,991 | | | | 983,341 | | | | 976,693 | | | | 970,045 | | | | 963,397 | | |
| Mortgage Backed Securities - Residential | 17,715 | | | | 17,626 | | | | 17,458 | | | | 17,280 | | | | 17,100 | | | | 16,922 | | | | 16,743 | | |
| Mortgage Backed Securities - Commercial | 55,947 | | | | 55,635 | | | | 55,317 | | | | 54,999 | | | | 54,681 | | | | 54,363 | | | | 54,045 | | |
| Total | $ | 2,780,837 | | | $ | 2,776,468 | | | $ | 2,767,621 | | | $ | 2,755,851 | | | $ | 2,743,902 | | | $ | 2,731,955 | | | $ | 2,720,007 | |
Continues on next page
Lam Research Corporation 2016 10-K 47

The hypothetical fair values as of June 26, 2016 were as follows:
| | | | | | | | | | | | | | | | | | | | | | | | | | | |
| --- | --- | --- | --- | --- | --- | --- | --- | --- | --- | --- | --- | --- | --- | --- | --- | --- | --- | --- | --- | --- | --- | --- | --- | --- | --- | --- |
| | | | | | | | | | | | | | | | | | | | | | | | | | | |
| | June 26, 2016 | | | | | | | | | | | | | | | | | | | | | | | | | |
| | | | | | | | | | | | | | | | | | | | | | | | | | | |
| Mutual Funds | $ | 30,241 | | | $ | 34,273 | | | $ | 36,289 | | | 40,321 | | | $ | 44,353 | | | $ | 46,369 | | | $ | 50,401 | |
This table also
Continues on next page
Lam Research Corporation 2016 10-K 48

| | | | | | | | | | | | | | | | | | |
| --- | --- | --- | --- | --- | --- | --- | --- | --- | --- | --- | --- | --- | --- | --- | --- | --- | --- |
| | | | | | | | | | | | | | | | | | |
| Forward contracts | | | | | | | | | | | | | | | | | |
| Sell | Japanese Yen | $ | 219.1 | | | $ | (11.8 | | ) | | $ | 23.0 | | | $ | 34.5 | |
| Buy | Euro | 36.3 | | | | 0.8 | | | | | 3.7 | | | | 5.5 | | |
| | | | | | | $ | (10.9 | | ) | | $ | 27.6 | | | $ | 41.3 | |
| Option contracts | | | | | | | | | | | | | | | | | |
| Buy Put (1) | Japanese Yen | $ | 39.1 | | | $ | (0.4 | | ) | | $ | 0.5 | | | $ | 0.8 | |
| Sell put (2) | Japanese Yen | 39.1 | | | | — | | | | | 0.1 | | | | 0.3 | | |
| | | | | | | $ | (0.4 | | ) | | $ | 0.6 | | | $ | 1.1 | |
(1) Contracts were entered into and designated as cash flow hedges under ASC 815, during the fiscal year as part of our cash flow hedge program.
The contracts were subsequently de-designated during the year ended June 26, 2016.
| --- | --- |
Market changes reflect immediate hypothetical parallel shifts in
##### [Table of Contents](#toc)
| | | | | | | | | | | | | | | | | | | | | | | | | | | | | |
| --- | --- | --- | --- | --- | --- | --- | --- | --- | --- | --- | --- | --- | --- | --- | --- | --- | --- | --- | --- | --- | --- | --- | --- | --- | --- | --- | --- | --- |
| Time Deposit | | $ | 177,567 | | | $ | 177,567 | | | $ | 177,567 | | | $ | 177,567 | | | $ | 177,567 | | | $ | 177,567 | | | $ | 177,567 | |
| Municipal Notes and Bonds | | | 664,269 | | | | 663,950 | | | | 662,706 | | | | 659,644 | | | | 656,254 | | | | 652,863 | | | | 649,473 | |
| US Treasury & Agencies | | | 360,447 | | | | 359,598 | | | | 356,415 | | | | 352,223 | | | | 347,915 | | | | 343,611 | | | | 339,307 | |
| Government-Sponsored Enterprises | | | 54,961 | | | | 54,678 | | | | 54,032 | | | | 53,365 | | | | 52,696 | | | | 52,025 | | | | 51,355 | |
| Foreign Government Bonds | | | 51,364 | | | | 51,170 | | | | 50,719 | | | | 50,206 | | | | 49,694 | | | | 49,181 | | | | 48,668 | |
| Bank and Corporate Notes | | | 1,355,199 | | | | 1,347,658 | | | | 1,337,307 | | | | 1,326,475 | | | | 1,315,444 | | | | 1,304,414 | | | | 1,293,385 | |
| Mortgage Backed Securities - Residential | | | 32,523 | | | | 32,372 | | | | 32,200 | | | | 32,011 | | | | 31,815 | | | | 31,619 | | | | 31,423 | |
| Mortgage Backed Securities - Commercial | | | 143,246 | | | | 142,688 | | | | 142,066 | | | | 141,426 | | | | 140,788 | | | | 140,148 | | | | 139,509 | |
| Total | | $ | 2,839,576 | | | $ | 2,829,681 | | | $ | 2,813,012 | | | $ | 2,792,917 | | | $ | 2,772,173 | | | $ | 2,751,428 | | | $ | 2,730,687 | |
| Mutual Funds | | $ | 25,097 | | | $ | 28,444 | | | $ | 30,117 | | | | 33,463 | | | $ | 36,809 | | | $ | 38,482 | | | $ | 41,829 | |
| | | | | | | | | | | | | | | | | | | |
| --- | --- | --- | --- | --- | --- | --- | --- | --- | --- | --- | --- | --- | --- | --- | --- | --- | --- | --- |
| Cash Flow Hedge | | | | | | | | | | | | | | | | | | |
| Sell | | Japanese Yen | | $ | 18.9 | | | $ | 2.8 | | | $ | 1.6 | | | $ | 2.4 | |
| Buy | | Euro | | $ | 34.4 | | | ($ | 0.2 | ) | | $ | 3.4 | | | $ | 5.1 | |
| | | | | | | | | $ | 2.5 | | | $ | 5.7 | | | $ | 8.6 | |
| Sell | | Japanese Yen | | $ | 49.9 | | | $ | — | | | $ | 5.0 | | | $ | 7.5 | |
| Buy | | Korean Won | | $ | 8.9 | | | $ | — | | | $ | 0.9 | | | $ | 1.3 | |
| Sell | | Swiss Francs | | $ | 3.3 | | | $ | — | | | $ | 0.3 | | | $ | 0.5 | |
| Buy | | Taiwan Dollar | | $ | 22.1 | | | ($ | 0.4 | ) | | $ | 2.1 | | | $ | 3.2 | |
| Buy | | Euro | | $ | 4.0 | | | $ | — | | | $ | 0.4 | | | $ | 0.6 | |
| | | | | | | | | ($ | 0.4 | ) | | $ | 8.7 | | | $ | 13.1 | |
An excerpt. Shown here: all 28 rewritten, 40 of 84 added and all 27 removed. The counts are complete. For every sentence, read Item 7A. Quantitative and Qualitative Disclosures About Market Risk in the FY2016 filing and the FY2015 filing.
Item 1. Business
105 rewritten, 46 added, 9 removed, 190 unchanged
We maintain a network of facilities throughout Asia, Europe, and the United States [removed: of America] in order to meet the needs of our dynamic customer base.
Our market-leading products are designed to help our customers build smaller, faster, more powerful, and more power-efficient devices that are used in a variety of electronic products, including [removed: cell] [added: mobile] phones, [added: wearables,] tablets, computers, [added: automotive devices,] storage devices, and networking equipment.
Our customer base includes leading semiconductor memory, foundry, and integrated device manufacturers (“IDMs”) that make products such as [removed: DRAM, NAND] [added: NAND, DRAM] memory, and logic devices.
Semiconductor manufacturing, our customers’ business, involves the complete fabrication of multiple [removed: die] [added: dies] or ICs on a wafer.
We leverage our expertise in semiconductor device processing to develop [removed: enabling] technology [removed: and] [added: and/or] productivity solutions that typically benefit our customers through lower defect rates, enhanced yields, faster processing time, [removed: and/or] [added: and] reduced [removed: cost.][added: cost as well as by facilitating their ability to meet more stringent performance and design standards.]
Market demand for [removed: ever-smaller] IC designs is driving the development of and migration to fabrication strategies such as three-dimensional (“3D”) architectures and multiple patterning.
[removed: Products][added: Products]
[removed: _Thin] [added: Thin] Film [removed: Deposition_][added: Deposition]
For tungsten chemical vapor deposition [removed: (“CVD”)/atomic] [added: (“CVD”) / atomic] layer deposition (“ALD”) processes, key requirements are minimizing contact resistance to meet lower power consumption requirements and achieving void-free fill for narrow nanoscale structures.
For example, atomic layer deposition [removed: (“ALD”)] is required for front-end-of-line (“FEOL”) transistor structures and back-end-of-line (“BEOL”) self-aligned multiple patterning schemes to deposit highly conformal and uniform films.
[removed: _Copper] [added: Copper] Metal Films — SABRE® Product [removed: Family_][added: Family]
The SABRE ECD product family is the industry’s [removed: productivity-leading platform] [added: leading system] for copper damascene manufacturing.
Electrofill® technology [removed: provides] [added: is designed to provide] high-throughput, void-free fill with superior defect density performance for advanced technology nodes.
SABRE chemistry packages provide leading-edge fill performance for [removed: the lowest] [added: low] defectivity, [removed: widest] [added: wide] process window, and [removed: highest] [added: high] rates of bottom-up growth to fill the most challenging HAR features.
The number of yielding ICs per wafer is optimized by increasing the usable die area through [removed: industry-leading] process edge exclusion engineering.
[removed: _Tungsten] [added: Tungsten] Metal Films — ALTUS® Product [removed: Family_][added: Family]
Our [removed: market-leading] ALTUS systems deposit highly conformal atomic layer films for advanced tungsten metallization applications.
[removed: _PECVD] [added: PECVD] Dielectric Films — VECTOR® Product [removed: Family_][added: Family]
The VECTOR family of PECVD and ALD systems delivers [removed: superior] [added: advanced] thin film quality, wafer-to-wafer uniformity, productivity, and low cost of ownership.
The MSSD architecture [removed: enables industry-leading] [added: combines the required film] performance with both sequential and parallel processing to provide flexibility for a range of applications.
[added: VECTOR products include] specialized systems for logic and memory applications with multiple platform options.
Applications include deposition of oxides, nitrides, and carbides for [removed: hardmasks;] [added: hardmasks,] multiple patterning [removed: films;] [added: films,] anti-reflective [removed: layers;] [added: layers,] multi-layer stack [removed: films;] [added: films,] and diffusion barriers.
[removed: _Gapfill] [added: Gapfill] Dielectric Films — SPEED® Product [removed: Family_][added: Family]
The SPEED HDP-CVD products [added: are designed to] provide void-free gapfill of high-quality dielectric films with superior throughput and reliability.
The unique source design provides [removed: excellent] [added: for] particle performance, while the ability to customize the deposition and in situ etching profile ensures [removed: best-of-breed] across-wafer thickness and gapfill uniformity.
[removed: _Film] [added: Film] Treatment — SOLA® Product [removed: Family_][added: Family]
[removed: This] [added: We believe this] enables delivery of best-in-class film properties, within-wafer and wafer-to-wafer uniformity, and productivity.
[removed: _Plasma Etch_][added: Plasma Etch]
[removed: _Conductor] [added: Conductor] Etch — Kiyo® Product Family, Versys® Metal Product [removed: Family_][added: Family]
The Kiyo product family [removed: delivers] [added: is designed to deliver] high-performance, high-productivity, low-risk solutions for conductor etch applications.
[removed: Superior uniformity,] [added: Uniformity,] uniformity control, and repeatability are enabled by a symmetrical chamber design, [removed: leading] electrostatic chuck technology, and independent tuning features.
The products’ proprietary chamber cleaning technology [removed: ensures high availability, high]
[added: ensures high availability, high] yield, and exceptional process repeatability for BEOL processing.
[removed: _Dielectric] [added: Dielectric] Etch — [removed: Flex™] [added: FlexTM] Product [removed: Family_][added: Family]
[removed: Exceptional uniformity,] [added: Uniformity,] repeatability, and tunability are enabled by a [removed: unique] multi-frequency, small-volume, confined plasma design.
Applications include low-k and ultra low-k dual damascene, [removed: self-aligned contacts, capacitor cell,] mask open, [added: and high aspect ratio applications for DRAM capacitor cell,] 3D NAND [removed: HAR] hole, trench, and contact.
[removed: _TSV] [added: TSV] Etch — Syndion® Product [removed: Family_][added: Family]
[removed: _Single-Wafer Clean_][added: Single-Wafer Clean]
In addition, cleaning steps that target the bevel region can help eliminate the potential source of yield-limiting defects at the wafer’s edge, [removed: as well as,] [added: in order to] increase the number of good die at the wafer’s edge [removed: to] [added: and] improve yield.
[removed: _Wet] [added: Wet] Clean — EOS®, Da Vinci®, DV-Prime®, SP [removed: Series_][added: Series]
The content on any website referred to in this Form 10-K is not a part of or incorporated by reference in this Form 10-K unless expressly noted.
Continues on next page
Lam Research Corporation 2016 10-K 3

Continues on next page
Lam Research Corporation 2016 10-K 4

Continues on next page
Lam Research Corporation 2016 10-K 5

To address technology inflections in patterning, the Kiyo family offers state-of-the-art technology with the Hydra patterning system; this capacity enables within wafer uniformity for FEOL/BEOL process modules in 3D NAND, DRAM and logic devices.
Continues on next page
Lam Research Corporation 2016 10-K 6

In addition, Flex systems can be configured to perform ALE, which delivers atomic-scale variability control to enable next-generation wafer processing for applications such as self-aligned contacts.
Continues on next page
Lam Research Corporation 2016 10-K 7

| | | | | | | |
| | | Dielectric Films | | PECVD, ALD Gapfill HDP-CVD | | VECTOR® family SPEED® family |
| | | Film Treatment | | UVTP | | SOLA® family |
| | | Dielectric Etch | | Reactive Ion Etch | | FlexTM family |
| | | TSV Etch | | Deep Reactive Ion Etch | | Syndion® family |
| | | Bevel Cleaning | | Dry Plasma Clean | | Coronus® family |
Continues on next page
Lam Research Corporation 2016 10-K 8

| | | | | | | | | | | | |
| --- | --- | --- | --- | --- | --- | --- | --- | --- | --- | --- | --- |
| | | | | | | | | | | | |
Continues on next page
Lam Research Corporation 2016 10-K 9

Continues on next page
Lam Research Corporation 2016 10-K 10

Continues on next page
Lam Research Corporation 2016 10-K 11

| | | | | |
##### [Table of Contents](#toc)
VECTOR products include
individual customers to develop solutions for their wafer processing needs.
| | | | | | | | | | | | | |
| --- | --- | --- | --- | --- | --- | --- | --- | --- | --- | --- | --- | --- |
In fiscal years 2014 and 2013, the customers individually representing greater than 10% of total assets were Samsung Electronics Company, Ltd., SK Hynix Inc., and Taiwan Semiconductor Manufacturing Company, Ltd.
These regulations could
Douglas R.
Bettinger is our Executive Vice President, Chief Financial Officer.
An excerpt. Shown here: 40 of 105 rewritten, 40 of 46 added and all 9 removed. The counts are complete. For every sentence, read Item 1. Business in the FY2016 filing and the FY2015 filing.
Item 3. Legal Proceedings
4 rewritten, 4 added, 1 removed, 1 unchanged
While [removed: the Company is] [added: we are] not currently party to any legal proceedings that [removed: it believes] [added: we believe are] material, [removed: the Company is] [added: we are] either a defendant or plaintiff in various actions that have arisen from time to time in the normal course of business, including intellectual property claims.
[removed: The Company accrues] [added: We accrue] for a liability when it is both probable that a liability has been incurred and the amount of the loss can be reasonably estimated.
[removed: These accruals are reviewed at] least quarterly and adjusted to reflect the effects of negotiations, settlements, rulings, advice of legal counsel, and other information and events pertaining to a particular matter.
To the extent there is a reasonable possibility that the losses could exceed the amounts already accrued, [removed: the Company believes] [added: we believe] that the amount of any such additional loss would be immaterial to [removed: the Company’s] [added: our] business, financial condition, and results of operations.
These accruals are reviewed at
Continues on next page
Lam Research Corporation 2016 10-K 27

| --- | --- |
Cover and table of contents
60 rewritten, 25 added, 5 removed, 34 unchanged
[removed: 10-K 1 d937085d10k.htm] [added: |] FORM 10-K [added: |]
[removed: ##### [Table of Contents](#toc)][added: TABLE OF CONTENTS]
[removed: UNITED STATES][added: UNITED STATES]
[removed: SECURITIES] [added: SECURITIES] AND EXCHANGE [removed: COMMISSION][added: COMMISSION]
[removed: WASHINGTON,] [added: WASHINGTON,] D.C. [removed: 20549][added: 20549]
| x | [removed: ANNUAL] [added: ANNUAL] REPORT PURSUANT TO SECTION 13 OR 15(d) OF THE SECURITIES EXCHANGE ACT OF [removed: 1934] [added: 1934] |
[removed: For] [added: For] the fiscal year ended June [removed: 28, 2015][added: 26, 2016]
| ¨ | [removed: TRANSITION] [added: TRANSITION] REPORT PURSUANT TO SECTION 13 OR 15(d) OF THE SECURITIES EXCHANGE ACT OF [removed: 1934] [added: 1934] |
[removed: For] [added: For] the transition period from to [removed: .][added: .]
[removed: Commission] [added: Commission] file number: [removed: 0-12933][added: 0-12933]
[removed: LAM] [added: LAM] RESEARCH [removed: CORPORATION][added: CORPORATION]
[removed: (Exact] [added: | LAM RESEARCH CORPORATION (Exact] name of registrant as specified in its [removed: charter)][added: charter) |]
| [removed: Delaware] [added: Delaware] | | [removed: 94-2634797] [added: 94-2634797] |
| [removed: (State] [added: (State] or other jurisdiction of incorporation or [removed: organization)] [added: organization)] | | [removed: (I.R.S.] [added: (I.R.S.] Employer Identification [removed: No.)] [added: No.)] |
| [removed: 4650] [added: 4650] Cushing [removed: Parkway Fremont, California] [added: Parkway, Fremont, California] | | [removed: 94538] [added: 94538] |
| [removed: (Address] [added: (Address] of principal executive [removed: offices)] [added: offices)] | | [removed: (Zip code)] [added: (Zip code)] |
[removed: Registrant’s] [added: Registrant’s] telephone number, including area code: (510) [removed: 572-0200][added: 572-0200]
[removed: Securities] [added: Securities] registered pursuant to Section 12(b) of the [removed: Act:][added: Act:]
| [removed: Title] [added: Title] of [removed: class] [added: class] | | [removed: Name] [added: Name] of exchange on which [removed: registered] [added: registered] |
| [removed: Common] [added: Common] Stock, Par Value $0.001 Per [removed: Share] [added: Share] | | [removed: The NASDAQ] [added: The Nasdaq] Stock Market [removed: LLC (NASDAQ] [added: (Nasdaq] Global Select [removed: Market)] [added: Market)] |
[removed: Securities] [added: Securities] registered pursuant to Section 12(g) of the [removed: Act:][added: Act:]
[removed: None][added: None]
[removed: (Title] [added: (Title] of [removed: class)][added: class)]
The aggregate market value of the Registrant’s Common Stock, $0.001 par value, held by non-affiliates of the Registrant, as of December [removed: 28, 2014,] [added: 27, 2015,] the last business day of the most recently completed second fiscal quarter with respect to the fiscal year covered by this Form 10-K, was [removed: $8,838,403,605.][added: $8,074,598,541.]
As of August [removed: 5, 2015,] [added: 10, 2016,] the Registrant had [removed: 158,186,976] [added: 160,260,009] outstanding shares of Common Stock.
[removed: Documents] [added: Documents] Incorporated by [removed: Reference][added: Reference]
Parts of the Registrant’s Proxy Statement for the Annual Meeting of Stockholders expected to be held on or about November [removed: 4, 2015] [added: 9, 2016] are incorporated by reference into Part III of this Form 10-K.
[removed: 2015] [added: 2016] ANNUAL REPORT ON FORM [removed: 10-K][added: 10-K]
| | | [removed: | | Page | |] [added: Page] |
[removed: | [Part I.](#tx937085_1) | | | | | | |][added: PART I]
| Item 1. | [removed: | [Business](#tx937085_2) | | | 3] [added: [Business](#sE9816C89F20900EF998B3B6893DE71C3)] | [added: [3](#sE9816C89F20900EF998B3B6893DE71C3)] |
| Item 1A. | [removed: |] [Risk [removed: Factors](#tx937085_3) | | | 13] [added: Factors](#s3BC13D88FEF4C40480CC3B68A6BDD95C)] | [added: [13](#s3BC13D88FEF4C40480CC3B68A6BDD95C)] |
| Item 1B. | [removed: |] [Unresolved Staff [removed: Comments](#tx937085_4) | | | 25] [added: Comments](#s1B266C553A2A5ADB3E713B68A6E28B50)] | [added: [27](#s1B266C553A2A5ADB3E713B68A6E28B50)] |
| Item 2. | [removed: | [Properties](#tx937085_5) | | | 25] [added: [Properties](#sC0360DF692D61B49044F3B68A70FDBCB)] | [added: [27](#sC0360DF692D61B49044F3B68A70FDBCB)] |
| Item 3. | [removed: |] [Legal [removed: Proceedings](#tx937085_6) | | | 25] [added: Proceedings](#s4A52FEAE7DB9D521E0693B68A72E7B1C)] | [added: [27](#s4A52FEAE7DB9D521E0693B68A72E7B1C)] |
| Item 4. | [removed: |] [Mine Safety [removed: Disclosures](#tx937085_7) | | | 25] [added: Disclosures](#s1DDED394C29F88725CD23B68A7645661)] | [added: [28](#s1DDED394C29F88725CD23B68A7645661)] |
| [removed: [Part II.](#tx937085_8) | | | |] [added: [Part II.](#s12C3ED782EF6CCC7A44C3B68A784D8EC)] | | |
| Item 5. | [removed: |] [Market for the Registrant’s Common Equity, Related Stockholder Matters and Issuer Purchases of Equity [removed: Securities](#tx937085_9) | | | 26] [added: Securities](#sCDA89F582A19B7C7225C3B6896275642)] | [added: [28](#sCDA89F582A19B7C7225C3B6896275642)] |
| Item 6. | [removed: |] [Selected Financial [removed: Data](#tx937085_10) | | | 29] [added: Data](#s9667652F2EBB298D16453B68A7DE0EB4)] | [added: [31](#s9667652F2EBB298D16453B68A7DE0EB4)] |
| Item 7. | [removed: |] [Management’s Discussion and Analysis of Financial Condition and Results of [removed: Operations](#tx937085_11) | | | 31] [added: Operations](#sC441172CB9EB1706A5B93B68A808077C)] | [added: [32](#sF218504CB3690102641F3B689330A76C)] |
10-K 1 lrcx_10kx2016xdocument.htm 10-K
| |
| --- |
| |
| | |
| | |
OR
| | |
| | |
| |
| --- |
| |
| | | |
_________________________
_________________________

| | | |
| --- | --- | --- |
| | | |
| [Signatures](#sBAB2570AB9C3E1D90DB33B6895399E8A) | | [103](#sBAB2570AB9C3E1D90DB33B6895399E8A) |
Continues on next page
Lam Research Corporation 2016 10-K 2

| | |
| --- | --- |
FORM 10-K
OR
| --- | --- | --- | --- | --- | --- | --- |
TABLE OF CONTENTS
| [Signatures](#tx937085_25) | | | | | 94 | |
An excerpt. Shown here: 40 of 60 rewritten, all 25 added and all 5 removed. The counts are complete. For every sentence, read Cover and table of contents in the FY2016 filing and the FY2015 filing.
Item 1B. Unresolved Staff Comments
0 rewritten, 1 added, 0 removed, 2 unchanged
| | |
Item 2. Properties
2 rewritten, 2 added, 0 removed, 6 unchanged
The majority of the Fremont and Livermore facilities are held under operating leases expiring [removed: in] 2020 and 2021, in addition the Villach facilities are held under capital leases expiring in [added: calendar year] 2016.
The company owns [removed: one property] [added: two properties] in Fremont, as well as, the [removed: San Jose and] Tualatin facilities.
During fiscal year 2016 we sold our San Jose facilities and entered into an operating lease for use of the buildings for a portion of calendar year 2016.
| | |
Item 4. Mine Safety Disclosures
1 rewritten, 1 added, 1 removed, 2 unchanged
[removed: PART II][added: PART II]
| | |
##### [Table of Contents](#toc)
Item 5. Market for the Registrant’s Common Equity, Related Stockholder Matters and Issuer Purchases of Equity Securities
19 rewritten, 49 added, 35 removed, 10 unchanged
[removed: _Stock Information_][added: Stock Information]
As of August [removed: 5, 2015,] [added: 10, 2016,] we had [removed: 479] [added: 454] stockholders of record.
In fiscal year [removed: 2015] [added: 2016] we paid our stockholders [removed: a] quarterly [removed: dividend] [added: dividends] of [added: $0.30 per share, and in fiscal year 2015, quarterly dividends of] $0.18 per share.
The table below sets forth the high and low prices of our Common Stock as reported by The [removed: NASDAQ] [added: Nasdaq] Stock [removed: Market LLC,] [added: Market,] for the period indicated:
| | [removed: | 2015] [added: 2015] | | | | | | |
| [removed: |] [added: High] | [removed: High] | | | [added: Low] | [removed: Low] | | |
| First Quarter | [removed: |] $ | 77.35 | | | $ | 66.70 | |
| Second Quarter | [removed: |] $ | 85.70 | | | $ | 65.78 | |
| Third Quarter | [removed: |] $ | 84.49 | | | $ | 69.92 | |
| Fourth Quarter | [removed: |] $ | 84.39 | | | $ | 69.07 | |
[removed: _Repurchase] [added: Repurchase] of Company [removed: Shares_][added: Shares]
| [removed: Period |] [added: Period] | [removed: Total] [added: Total] Number of Shares Repurchased [removed: (1) |] [added: (1)] | | | [removed: Average] [added: Average] Price Paid Per Share [removed: (2)] | | | | [removed: Total] [added: Total] Number of Shares Purchased as Part of Publicly Announced Plans or [removed: Programs |] [added: Programs] | | | [removed: Amount] [added: Amount] Available Under Repurchase [removed: Program] [added: Program] | | |
| | [removed: | (in] [added: (in] thousands, except per share [removed: data) | |] [added: data)] | | | | | | | | | | | | |
| [removed: May 25, 2015 -] [added: Available balance as of] June 28, 2015 | | | [removed: 321] | | | [removed: $] | [removed: 82.66] | | | | [removed: 312 | | |] $ | 316,587 | |
| (1) | In addition to shares repurchased under the Board-authorized repurchase [removed: program shown above,] [added: program,] we acquired [removed: 761,883] [added: 924,823] shares at a total cost of [removed: $58.8] [added: $67.6] million which we withheld through net share settlements to cover minimum tax withholding obligations upon the vesting of restricted stock unit awards granted under our equity compensation plans. The shares retained through these net share settlements are not a part of the Board-authorized repurchase program but instead are authorized under our equity compensation plans. |
[removed: _Cumulative] [added: Cumulative] 5-year [removed: Return_][added: Return]
The graph below compares Lam Research Corporation’s cumulative 5-year total shareholder return on Common Stock with the cumulative total returns of the NASDAQ Composite index, [removed: the Research Data Group, Incorporated (“RDG”) Semiconductor Composite index,] and the Philadelphia (“PHLX”) Semiconductor Sector Index.
The graph tracks the performance of a $100 investment in our Common Stock and in each of the indices (with the reinvestment of all dividends) from June 30, [removed: 2010] [added: 2011] to June 30, [removed: 2015.][added: 2016.]
[removed: 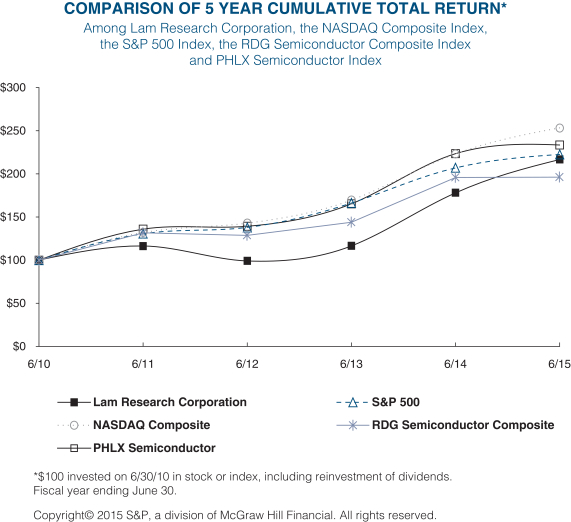][added: ]
| | | | | | | | |
| --- | --- | --- | --- | --- | --- | --- | --- |
| | | | | | | | |
| | 2016 | | | | | | |
| First Quarter | $ | 84.13 | | | $ | 61.20 | |
| Second Quarter | $ | 80.85 | | | $ | 61.65 | |
| Third Quarter | $ | 81.29 | | | $ | 63.10 | |
| Fourth Quarter | $ | 87.19 | | | $ | 72.00 | |
| High | | | | Low | | | |
We currently are restricted from repurchasing our common stock pursuant to the KLA-Tencor merger agreement.
Continues on next page
Lam Research Corporation 2016 10-K 28
| | | | | | | | | | | | | | |
| --- | --- | --- | --- | --- | --- | --- | --- | --- | --- | --- | --- | --- | --- |
| | | | | | | | | | | | | | |
| Quarter Ended September 27, 2015 | 1,413 | | | $ | 72.69 | | | 1,205 | | | $ | 229,094 | |
| Quarter Ended December 27, 2015 | 184 | | | $ | 69.76 | | | — | | | $ | 229,094 | |
| Quarter Ended March 27, 2016 | 297 | | | $ | 67.63 | | | — | | | $ | 229,094 | |
| March 28, 2016 - April 24, 2016 | 127 | | | $ | 82.54 | | | — | | | $ | 229,094 | |
| April 25, 2016 - May 22, 2016 | 10 | | | $ | 75.03 | | | — | | | $ | 229,094 | |
| May 23, 2016 - June 26, 2016 | 99 | | | $ | 83.63 | | | — | | | $ | 229,094 | |
| Total | 2,130 | | | $ | 72.84 | | | 1,205 | | | $ | 229,094 | |
__________________________________
| | |
Continues on next page
Lam Research Corporation 2016 10-K 29

| | | | |
| --- | --- | --- | --- |
| | | | |
| COMPARISON OF 5 YEAR CUMULATIVE TOTAL RETURN* | | | |
| | Among Lam Research Corporation, the NASDAQ Composite Index, the S&P 500 Index, and the PHLX Semiconductor Index | | |

*$100 invested on 6/30/2011 in stock or index, including reinvestment of dividends.
Fiscal Year ending June 30.
Copyright© 2016 S&P, a division of McGraw Hill Financial.
All rights reserved.
| | | | | | | | | | | | | | | | | | |
| --- | --- | --- | --- | --- | --- | --- | --- | --- | --- | --- | --- | --- | --- | --- | --- | --- | --- |
| | | | | | | | | | | | | | | | | | |
| --- | --- |
In May 2015, we announced an increase in our quarterly dividend to $0.30 per share, which is payable in the first quarter of fiscal year 2016.
| | | | | | | | | |
| --- | --- | --- | --- | --- | --- | --- | --- | --- |
| | | 2014 | | | | | | |
| First Quarter | | $ | 52.31 | | | $ | 44.11 | |
| Second Quarter | | $ | 55.48 | | | $ | 49.54 | |
| Third Quarter | | $ | 57.16 | | | $ | 48.45 | |
| Fourth Quarter | | $ | 67.85 | | | $ | 50.54 | |
During the three months ended September 28, 2014, we entered into a collared accelerated share repurchase (“ASR”) transaction under a master repurchase arrangement.
Under the ASR, we made an up-front cash payment of $250 million, in exchange for an initial delivery of approximately 3.2 million shares of our Common Stock.
The number of shares repurchased was based on the volume-weighted average price (“VWAP”) of the Common Stock during the term of the ASR minus a pre-determined discount set at inception of the ASR, subject to collar provisions that provided a minimum and maximum number of shares that we could repurchase under the agreements.
The minimum and maximum thresholds for the transaction were established based on the average of the VWAP prices for the Common Stock during an initial hedge period.
The ASR was scheduled to end at any time on or after October 8, 2014 and on or before December 8, 2014.
The counterparty designated October 9, 2014 as the termination date, at which time we settled the ASR.
Approximately 0.3 million shares were received at final settlement, which represented a weighted-average share price of approximately $72.90 for the transaction period.
##### [Table of Contents](#toc)
| | | | | | | | | | | | | | | | | |
| --- | --- | --- | --- | --- | --- | --- | --- | --- | --- | --- | --- | --- | --- | --- | --- | --- |
| Amount available at June 29, 2014 | | | | | | | | | | | | | | $ | 830,895 | |
| Quarter ending September 28, 2014 | | | 3,938 | | | $ | 69.86 | | | | 3,818 | | | $ | 534,174 | |
| Quarter ending December 28, 2014 | | | 1,158 | | | $ | 78.10 | | | | 869 | | | $ | 488,480 | |
| Quarter ended March 29, 2015 | | | 1,550 | | | $ | 78.57 | | | | 1,434 | | | $ | 376,002 | |
| March 30, 2015 - April 26, 2015 | | | 192 | | | $ | 73.51 | | | | 178 | | | $ | 362,898 | |
| April 27, 2015 - May 24, 2015 | | | 478 | | | $ | 77.33 | | | | 264 | | | $ | 342,377 | |
| Total | | | 7,637 | | | $ | 75.04 | | | | 6,875 | | | $ | 316,587 | |
| (2) | Average price paid per share excludes accelerated share repurchases for which cost was incurred during the September 2014 quarter, but that did not settle until the December 2014 quarter. See the section above for details regarding average price associated with these transactions. |
| | | | | | | | | | | | | | | | | | | | | | | | | |
| --- | --- | --- | --- | --- | --- | --- | --- | --- | --- | --- | --- | --- | --- | --- | --- | --- | --- | --- | --- | --- | --- | --- | --- | --- |
| | | 6/10 | | | | 6/11 | | | | 6/12 | | | | 6/13 | | | | 6/14 | | | | 6/15 | | |
| Lam Research Corporation | | | 100.00 | | | | 116.34 | | | | 99.16 | | | | 116.50 | | | | 178.05 | | | | 216.61 | |
| NASDAQ Composite | | | 100.00 | | | | 132.14 | | | | 142.90 | | | | 169.55 | | | | 223.20 | | | | 253.21 | |
| S&P 500 | | | 100.00 | | | | 130.69 | | | | 137.81 | | | | 166.20 | | | | 207.10 | | | | 222.47 | |
| RDG Semiconductor Composite | | | 100.00 | | | | 131.61 | | | | 128.78 | | | | 143.95 | | | | 195.98 | | | | 196.30 | |
| PHLX Semiconductor | | | 100.00 | | | | 135.83 | | | | 139.10 | | | | 165.22 | | | | 223.35 | | | | 233.52 | |
An excerpt. Shown here: all 19 rewritten, 40 of 49 added and all 35 removed. The counts are complete. For every sentence, read Item 5. Market for the Registrant’s Common Equity, Related Stockholder Matters and Issuer Purchases of Equity Securities in the FY2016 filing and the FY2015 filing.
Item 6. Selected Financial Data
39 rewritten, 30 added, 14 removed, 4 unchanged
| | [removed: | Year Ended] [added: Year Ended(1)] | | | | | | | | | | | | | | | | | | |
| [added: June 26, 2016] | | [removed: June] [added: | | June] 28, 2015 [removed: (1)] | | | | [removed: June] [added: June] 29, 2014 [removed: (1)] | | | | [removed: June] [added: June] 30, 2013 [removed: (1)] | | | | [removed: June] [added: June] 24, 2012 [removed: (1)] | | | | [removed: June 26, 2011 | | |]
| | [removed: | (in] [added: (in] thousands, except per share [removed: data)] [added: data)] | | | | | | | | | | | | | | | | | | |
| OPERATIONS: | | | | | | | | | | | | | | | | | | | | [removed: |]
| Revenue | [removed: |] $ | [removed: 5,259,312] [added: 5,885,893] | | | $ | [removed: 4,607,309] [added: 5,259,312] | | | $ | [removed: 3,598,916] [added: 4,607,309] | | | $ | [removed: 2,665,192] [added: 3,598,916] | | | $ | [removed: 3,237,693] [added: 2,665,192] | |
| Gross margin | [added: 2,618,922] | | [added: | |] 2,284,336 | | | | 2,007,481 | | | | 1,403,059 | | | | 1,084,069 | | | [removed: | 1,497,232 | |]
| Goodwill impairment (2) | [removed: | | 79,444] [added: —] | | | | [removed: —] [added: 79,444] | | | | — | | | | — | | | | — | | [added: |]
| Restructuring charges, net | [added: —] | | [added: | |] — | | | | — | | | | 1,813 | | | | 1,725 | | | [removed: | 11,579 | |]
| Operating income | [added: 1,074,256] | | [added: | |] 788,039 | | | | 677,669 | | | | 118,071 | | | | 237,733 | | | [removed: | 804,285 | |]
| Net income | [added: 914,049] | | [added: | |] 655,577 | | | | 632,289 | | | | 113,879 | | | | 168,723 | | | [removed: | 723,748 | |]
| Net income per share: | | | | | | | | | | | | | | | | | | | | [removed: |]
| Basic | [removed: |] $ | [removed: 4.11] [added: 5.75] | | | $ | [removed: 3.84] [added: 4.11] | | | $ | [removed: 0.67] [added: 3.84] | | | $ | [removed: 1.36] [added: 0.67] | | | $ | [removed: 5.86] [added: 1.36] | |
| Diluted | [removed: |] $ | [removed: 3.70] [added: 5.22] | | | $ | [removed: 3.62] [added: 3.70] | | | $ | [removed: 0.66] [added: 3.62] | | | $ | [removed: 1.35] [added: 0.66] | | | $ | [removed: 5.79] [added: 1.35] | |
| Cash dividends declared per common share | [removed: |] $ | [removed: 0.84] [added: 1.20] | | | $ | [removed: 0.18] [added: 0.84] | | | $ | [removed: —] [added: 0.18] | | | $ | — | | | $ | — | |
| BALANCE SHEET: | | | | | | | | | | | | | | | | | | | | [removed: |]
| Working capital | [removed: |] $ | [removed: 3,639,488] [added: 6,795,109] | | | $ | [removed: 3,201,661] [added: 3,639,488] | | | $ | [removed: 2,389,354] [added: 3,201,661] | | | $ | [removed: 2,988,181] [added: 2,389,354] | | | $ | [removed: 2,592,506] [added: 2,988,181] | |
| Total assets | [added: 12,271,528] | | [added: | |] 9,364,648 | | | | 7,993,306 | | | | 7,250,315 | | | | 8,004,652 | | | [removed: | 4,053,867 | |]
| Long-term obligations, less current portion | [added: 3,749,657] | | [added: | |] 1,388,335 | | | | 1,198,221 | | | | 1,170,048 | | | | 1,255,600 | | | [removed: | 903,263 | |]
| Current portion of long-term debt and capital leases | [removed: | | 1,359,650] [added: 949,494] | | | | [removed: 518,267] [added: 1,359,650] | | | | [removed: 520,686] [added: 518,267] | | | | 514,655 | | | | [removed: 4,782] [added: 511,139] | | [added: |]
| (1) | Fiscal years [added: 2016,] 2015, 2014, and 2013 amounts include operating results of Novellus. Fiscal year 2012 amounts include 20 days of operating results of Novellus from the acquisition date of June 4, 2012. The Novellus acquisition was accounted for as a business combination in accordance with the applicable accounting guidance. |
| (2) | Goodwill impairment analysis during fiscal year 2015 resulted in a non-cash impairment charge [removed: upon] [added: to] our single-wafer clean reporting unit, extinguishing the goodwill ascribed to the reporting unit. |
| | [removed: | Three] [added: Three] Months Ended [removed: (1)] [added: (1)] | | | | | | | | | | | | | | |
| [removed: | | June] [added: June] 28, [removed: 2015] [added: 2015] | | | | [removed: March] [added: March] 29, [removed: 2015] [added: 2015] | | | | [removed: December] [added: December] 28, [removed: 2014] [added: 2014] | | | | [removed: September] [added: September] 28, [removed: 2014] [added: 2014] | | | [added: |]
| | [removed: | (in] [added: unaudited (in] thousands, except per share [removed: data)] [added: data)] | | | | | | | | | | | | | | |
| QUARTERLY FISCAL YEAR 2015: | | | | | | | | | | | | | | | | [removed: |]
| Revenue | [removed: |] $ | 1,481,370 | | | $ | 1,393,333 | | | $ | 1,232,241 | | | $ | 1,152,368 | |
| Gross margin | [removed: | |] 641,538 | | | | 600,602 | | | | 536,657 | | | | 505,539 | | [added: |]
| Goodwill impairment | [removed: | |] 79,444 | | | | — | | | | — | | | | — | | [added: |]
| Operating income | [removed: | |] 191,035 | | | | 239,965 | | | | 188,741 | | | | 168,298 | | [added: |]
| Net income | [removed: | |] 131,271 | | | | 206,285 | | | | 176,940 | | | | 141,081 | | [added: |]
| Net income per share | | | | | | | | | | | | | | | | [removed: |]
| Basic | [removed: |] $ | 0.83 | | | $ | 1.30 | | | $ | 1.11 | | | $ | 0.87 | |
| Diluted | [removed: |] $ | 0.74 | | | $ | 1.16 | | | $ | 1.00 | | | $ | 0.80 | |
| Number of shares used in per share calculations: | | | | | | | | | | | | | | | | [removed: |]
| Basic | [removed: | |] 158,590 | | | | 158,992 | | | | 159,248 | | | | 161,685 | | [added: |]
| Diluted | [removed: | |] 176,575 | | | | 177,531 | | | | 177,046 | | | | 177,118 | | [added: |]
| [removed: |] [added: June 26, 2016] | [removed: June 29, 2014] | | | [added: March 27, 2016] | [removed: March 30, 2014] | | | [added: December 27, 2015] | [removed: December 29, 2013] | | | [added: September 27, 2015] | [removed: September 29, 2013] | | |
| QUARTERLY FISCAL YEAR [removed: 2014: |] [added: 2016:] | | | | | | | | | | | | | | | |
| (1) | Our reporting period is a 52/53-week fiscal year. The fiscal years ended June [removed: 28, 2015] [added: 26, 2016] and June [removed: 29, 2014] [added: 28, 2015] included 52 weeks. All quarters presented above included 13 weeks. |
| | | | | | | | | | | | | | | | | | | | |
| --- | --- | --- | --- | --- | --- | --- | --- | --- | --- | --- | --- | --- | --- | --- | --- | --- | --- | --- | --- |
| | | | | | | | | | | | | | | | | | | | |
__________________________________
| | |
| | |
| | | | | | | | | | | | | | | | |
| --- | --- | --- | --- | --- | --- | --- | --- | --- | --- | --- | --- | --- | --- | --- | --- |
| | | | | | | | | | | | | | | | |
| Revenue | $ | 1,546,261 | | | $ | 1,314,055 | | | $ | 1,425,534 | | | $ | 1,600,043 | |
| Gross margin | 698,784 | | | | 571,265 | | | | 626,510 | | | | 722,363 | | |
| Operating income | 309,241 | | | | 190,753 | | | | 238,834 | | | | 335,428 | | |
| Net income | 258,939 | | | | 143,451 | | | | 222,980 | | | | 288,679 | | |
| Basic | $ | 1.62 | | | $ | 0.90 | | | $ | 1.41 | | | $ | 1.82 | |
| Diluted | $ | 1.46 | | | $ | 0.82 | | | $ | 1.28 | | | $ | 1.66 | |
| Basic | 159,862 | | | | 159,039 | | | | 158,424 | | | | 158,352 | | |
| Diluted | 177,649 | | | | 174,373 | | | | 174,242 | | | | 174,374 | | |
Continues on next page
Lam Research Corporation 2016 10-K 31

| | | | | | | | | | | | | | | | |
| --- | --- | --- | --- | --- | --- | --- | --- | --- | --- | --- | --- | --- | --- | --- | --- |
| | | | | | | | | | | | | | | | |
| | Three Months Ended (1) | | | | | | | | | | | | | | |
| | unaudited (in thousands, except per share data) | | | | | | | | | | | | | | |
| Net income per share | | | | | | | | | | | | | | | |
| Number of shares used in per share calculations: | | | | | | | | | | | | | | | |
__________________________________
| | |
| | |
| | | | | | | | | | | | | | | | | | | | | |
| --- | --- | --- | --- | --- | --- | --- | --- | --- | --- | --- | --- | --- | --- | --- | --- | --- | --- | --- | --- | --- |
##### [Table of Contents](#toc)
| | | | | | | | | | | | | | | | | |
| --- | --- | --- | --- | --- | --- | --- | --- | --- | --- | --- | --- | --- | --- | --- | --- | --- |
| | | unaudited | | | | | | | | | | | | | | |
| Revenue | | $ | 1,248,797 | | | $ | 1,227,392 | | | $ | 1,116,061 | | | $ | 1,015,059 | |
| Gross margin | | | 557,036 | | | | 530,798 | | | | 487,789 | | | | 431,858 | |
| Operating income | | | 215,850 | | | | 191,937 | | | | 164,474 | | | | 105,408 | |
| Net income | | | 233,395 | | | | 164,396 | | | | 148,992 | | | | 85,506 | |
| Basic | | $ | 1.44 | | | $ | 1.01 | | | $ | 0.92 | | | $ | 0.52 | |
| Diluted | | $ | 1.35 | | | $ | 0.96 | | | $ | 0.87 | | | $ | 0.50 | |
| Basic | | | 162,215 | | | | 162,238 | | | | 162,305 | | | | 162,896 | |
| Diluted | | | 173,345 | | | | 171,636 | | | | 171,757 | | | | 171,363 | |
Item 8. Financial Statements and Supplementary Data
656 rewritten, 637 added, 164 removed, 347 unchanged
| | [removed: | Page | |] [added: Page] |
| [removed: [Consolidated] [added: Consolidated] Statements of Operations — Years Ended June [added: 26, 2016, June] 28, 2015, [removed: June 29, 2014,] and June [removed: 30, 2013](#tx937085_50) | | | 49] [added: 29, 2014] | [added: [52](#sAE5CE74A9C2FC7C652393B687F57B174)] |
| [removed: [Consolidated] [added: Consolidated] Statements of Comprehensive Income — Years Ended June [added: 26, 2016, June] 28, 2015, [removed: June 29, 2014,] and June [removed: 30, 2013](#tx937085_51) | | | 50] [added: 29, 2014] | [added: [53](#s3CB15857A8C509C8050D3B687C30E6D4)] |
| [removed: [Consolidated] [added: Consolidated] Balance Sheets — June [removed: 28, 2015] [added: 26, 2016] and June [removed: 29, 2014](#tx937085_52) | | | 51] [added: 28, 2015] | [added: [54](#s16D7C265876CFB02F0703B687F11A8AC)] |
| [removed: [Consolidated] [added: Consolidated] Statements of Cash Flows — Years Ended June [added: 26, 2016, June] 28, 2015, [removed: June 29, 2014,] and June [removed: 30, 2013](#tx937085_53) | | | 52] [added: 29, 2014] | [added: [55](#s841D8C95643C3C4BA80C3B687FC70CA4)] |
| [removed: [Consolidated] [added: Consolidated] Statements of Stockholders’ Equity — Years Ended June [added: 26, 2016, June] 28, 2015, [removed: June 29, 2014,] and June [removed: 30, 2013](#tx937085_54) | | | 54] [added: 29, 2014] | [added: [57](#s3E2A37DFF918C5ED14473B6880249BF0)] |
[removed: | [Notes to Consolidated Financial Statements](#tx937085_55) | | | 55 | |][added: NOTES TO CONSOLIDATED FINANCIAL STATEMENTS]
| [removed: [Reports] [added: Reports] of Independent Registered Public Accounting [removed: Firm](#tx937085_56) | | | 89] [added: Firm] | [added: [98](#s50DE6F94C93E973C6A153B68B2CB8401)] |
[removed: LAM] [added: LAM] RESEARCH [removed: CORPORATION][added: CORPORATION]
[removed: CONSOLIDATED] [added: CONSOLIDATED] STATEMENTS OF [removed: OPERATIONS][added: OPERATIONS]
[removed: (in] [added: (in] thousands, except per share [removed: data)][added: data)]
| | [removed: | Year Ended] [added: Year Ended] | | | | | | | | | | |
| [removed: |] [added: June 26, 2016] | [removed: June 28, 2015] | | | [added: June 28, 2015] | [removed: June 29, 2014] | | | [added: June 29, 2014] | [removed: June 30, 2013] | | |
| Revenue | [removed: |] $ | [removed: 5,259,312] [added: 5,885,893] | | | $ | [removed: 4,607,309] [added: 5,259,312] | | | $ | [removed: 3,598,916] [added: 4,607,309] | |
| Cost of goods sold | [removed: |] [added: 3,266,971] | [removed: 2,974,976] | | | [added: 2,974,976] | [removed: 2,599,828] | | | [added: 2,599,828] | [removed: 2,195,857] | |
| Gross margin | [removed: |] [added: 2,618,922] | [removed: 2,284,336] | | | [added: 2,284,336] | [removed: 2,007,481] | | | [added: 2,007,481] | [removed: 1,403,059] | |
| Research and development | [removed: |] [added: 913,712] | [removed: 825,242] | | | [added: 825,242] | [removed: 716,471] | | | [added: 716,471] | [removed: 683,688] | |
| Selling, general and administrative | [removed: |] [added: 630,954] | [removed: 591,611] | | | [added: 591,611] | [removed: 613,341] | | | [added: 613,341] | [removed: 601,300] | |
| Goodwill impairment | [removed: | | 79,444] [added: —] | | | | [removed: —] [added: 79,444] | | | | — | | [added: |]
| Total operating expenses | [removed: |] [added: 1,544,666] | [removed: 1,496,297] | | | [added: 1,496,297] | [removed: 1,329,812] | | | [added: 1,329,812] | [removed: 1,284,988] | |
| Operating income | [removed: |] [added: 1,074,256] | [removed: 788,039] | | | [added: 788,039] | [removed: 677,669] | | | [added: 677,669] | [removed: 118,071] | |
| Gain on sale of real estate | [removed: | |] — | | | | [removed: 83,090] [added: —] | | | | [removed: —] [added: 83,090] | | [added: |]
| Other expense, net | [removed: |] [added: (114,139] | [removed: (47,189] | ) | | [added: (47,189] | [removed: (37,396] | ) | | [added: (37,396] | [removed: (51,413] | ) |
| Income before income taxes | [removed: |] [added: 960,117] | [removed: 740,850] | | | [added: 740,850] | [removed: 723,363] | | | [added: 723,363] | [removed: 66,658] | |
| Income tax [removed: (expense) benefit |] [added: expense] | [added: (46,068] | [removed: (85,273] | ) | | [added: (85,273] | [removed: (91,074] | ) | | [added: (91,074] | [removed: 47,221] | [added: )] |
| Net income | [removed: |] $ | [removed: 655,577] [added: 914,049] | | | $ | [removed: 632,289] [added: 655,577] | | | $ | [removed: 113,879] [added: 632,289] | |
| Net income per share: | | | | | | | | | | | | [removed: |]
| Basic | [removed: |] $ | [removed: 4.11] [added: 5.75] | | | $ | [removed: 3.84] [added: 4.11] | | | $ | [removed: 0.67] [added: 3.84] | |
| Diluted | [removed: |] $ | [removed: 3.70] [added: 5.22] | | | $ | [removed: 3.62] [added: 3.70] | | | $ | [removed: 0.66] [added: 3.62] | |
| Number of shares used in per share calculations: | | | | | | | | | | | | [removed: |]
| Basic | [removed: |] [added: 158,919] | [removed: 159,629] | | | [added: 159,629] | [removed: 164,741] | | | [added: 164,741] | [removed: 168,932] | |
| Diluted | [removed: |] [added: 175,159] | [removed: 177,067] | | | [added: 177,067] | [removed: 174,503] | | | [added: 174,503] | [removed: 173,430] | |
[removed: CONSOLIDATED] [added: CONSOLIDATED] STATEMENTS OF COMPREHENSIVE [removed: INCOME][added: INCOME]
[removed: (in thousands)][added: (in thousands)]
| Other comprehensive income (loss), net of tax: | | | | | | | | | | | | [removed: |]
| Foreign currency translation adjustment | [removed: |] [added: (4,403] | [removed: (22,139] | ) | | [added: (22,139] | [removed: 4,192] | [added: )] | | [added: 4,192] | [removed: 5,303] | |
| Cash flow hedges: | | | | | | | | | | | | [removed: |]
| Net unrealized [added: (losses)] gains during the period | [removed: |] [added: (17,725] | [removed: 1,595] | [added: )] | | [added: 1,595] | [removed: 8,004] | | | [added: 8,004] | [removed: 10,607] | |
| Net [removed: gains] [added: losses (gains)] reclassified into earnings | [removed: |] [added: 4,961] | [removed: (4,388] | [removed: )] | | [added: (4,388] | [removed: (10,892] | ) | | [added: (10,892] | [removed: (7,573] | ) |
| | [removed: |] [added: (12,764] | [removed: (2,793] | ) | | [added: (2,793] | [removed: (2,888] | ) | | [added: (2,888] | [removed: 3,034] | [added: )] |
| | |
| | |
Continues on next page
Lam Research Corporation 2016 10-K 51

| | | | | | | | | | | | |
| --- | --- | --- | --- | --- | --- | --- | --- | --- | --- | --- | --- |
| | | | | | | | | | | | |
Continues on next page
Lam Research Corporation 2016 10-K 52

LAM RESEARCH CORPORATION
| | | | | | | | | | | | |
| --- | --- | --- | --- | --- | --- | --- | --- | --- | --- | --- | --- |
| | | | | | | | | | | | |
| Net income | $ | 914,049 | | | $ | 655,577 | | | $ | 632,289 | |
Continues on next page
Lam Research Corporation 2016 10-K 53

LAM RESEARCH CORPORATION
| | | | | | | | |
| --- | --- | --- | --- | --- | --- | --- | --- |
| | | | | | | | |
| Cash and cash equivalents | $ | 5,039,322 | | | $ | 1,501,539 | |
Continues on next page
Lam Research Corporation 2016 10-K 54

LAM RESEARCH CORPORATION
| | | | | | | | | | | | |
| --- | --- | --- | --- | --- | --- | --- | --- | --- | --- | --- | --- |
| | | | | | | | | | | | |
| Net income | $ | 914,049 | | | $ | 655,577 | | | $ | 632,289 | |
| Goodwill impairment | — | | | | 79,444 | | | | — | | |
| Other, net | 1,636 | | | | 3,978 | | | | 10,000 | | |
Continues on next page
Lam Research Corporation 2016 10-K 55

| | | | | | | | | | | | |
| --- | --- | --- | --- | --- | --- | --- | --- | --- | --- | --- | --- |
| | | | | | | | | | | | |
| | | | | |
| --- | --- | --- | --- | --- |
##### [Table of Contents](#toc)
| | | | | | | | | | | | | |
| --- | --- | --- | --- | --- | --- | --- | --- | --- | --- | --- | --- | --- |
| | | | | | | | | |
| --- | --- | --- | --- | --- | --- | --- | --- | --- |
| Impairment of investment | | | — | | | | — | | | | 3,711 | |
| Issuance (repayment) of notes receivable | | | 3,978 | | | | 10,000 | | | | (10,000 | ) |
| Cash and cash equivalents at beginning of year | | | 1,452,677 | | | | 1,162,473 | | | | 1,564,752 | |
| | | | | | | | | | | | | | | | | | | | | | | | | | | | | |
| --- | --- | --- | --- | --- | --- | --- | --- | --- | --- | --- | --- | --- | --- | --- | --- | --- | --- | --- | --- | --- | --- | --- | --- | --- | --- | --- | --- | --- |
| Balance at June 24, 2012 | | | 186,656 | | | $ | 187 | | | $ | 4,943,539 | | | $ | (2,636,936 | ) | | $ | (33,818 | ) | | $ | 2,858,809 | | | $ | 5,131,781 | |
| Sale of common stock | | | 3,301 | | | | 3 | | | | 39,377 | | | | — | | | | — | | | | — | | | | 39,380 | |
| Purchase of treasury stock | | | (28,157 | ) | | | (28 | ) | | | — | | | | (934,780 | ) | | | — | | | | — | | | | (934,808 | ) |
| Reissuance of treasury stock | | | 1,073 | | | | 1 | | | | (622 | ) | | | 31,886 | | | | — | | | | — | | | | 31,265 | |
| Net income | | | — | | | | — | | | | — | | | | — | | | | — | | | | 113,879 | | | | 113,879 | |
well as the tax effect of carryforwards.
The Company did not record any goodwill impairment in fiscal years 2014 or 2013.
Under the income approach, the Company determines fair value based on estimated future cash flows
In July 2013, the FASB released Accounting Standards Update 2013-11 “Presentation of an Unrecognized Tax Benefit When a Net Operating Loss Carryforward, a Similar Tax Loss, or a Tax Credit Carryforward Exists.” The new standard requires that an unrecognized tax benefit should be presented as a reduction of a deferred tax asset for a net operating loss carryforward or other tax credit carryforward when settlement in this manner is available under the tax law.
The Company adopted this standard during the fiscal year without significant impact on its financial position, results of operations, or cash flows.
In April 2014, the FASB released Accounting Standards Update 2014-8 “Presentation of Financial Statements and Property, Plant and Equipment: Reporting Discontinued Operations and Disclosure of Disposals of Components of an Entity.” The new standard re-defines discontinued operations and requires only those disposals of components of an entity, including classifications as held for sale, that represent a strategic shift that has, or will have, a major effect on an entity’s operations and financial results to be reported as discontinued operations.
In addition, the new standard expands the disclosure requirements of discontinued operations.
(ii) retrospective with the cumulative effect of initially applying the standard recognized at the date of initial application and providing certain additional disclosures as defined per the standard.
Note 4: Reclassifications
Certain amounts in fiscal years 2014 and 2013 financial statements have been reclassified to conform to the fiscal year 2015 presentation.
| Equity-based compensation expense | | $ | 135,354 | | | $ | 103,700 | | | $ | 99,310 | |
awards to eligible employees, consultants and advisors, and non-employee directors of the Company and its subsidiaries.
| | | | | | | | | | | | | | | | | |
| --- | --- | --- | --- | --- | --- | --- | --- | --- | --- | --- | --- | --- | --- | --- | --- | --- |
| June 24, 2012 | | | 3,902,077 | | | $ | 25.14 | | | | 4,331,478 | | | $ | 41.01 | |
| Granted | | | 288,867 | | | $ | 42.59 | | | | 2,563,670 | | | $ | 38.76 | |
| Exercised | | | (1,546,028 | ) | | $ | 25.47 | | | | _N/A_ | | | | _N/A_ | |
| Canceled | | | (73,993 | ) | | $ | 26.24 | | | | (299,079 | ) | | $ | 39.70 | |
| Vested restricted stock | | | _N/A_ | | | | _N/A_ | | | | (1,754,273 | ) | | $ | 42.52 | |
| | | | | | | | | | | | | | | | | | | | | |
| --- | --- | --- | --- | --- | --- | --- | --- | --- | --- | --- | --- | --- | --- | --- | --- | --- | --- | --- | --- | --- |
| $9.44-$19.05 | | | 130,682 | | | | 0.52 | | | $ | 12.94 | | | | 130,682 | | | $ | 12.94 | |
| $21.04-$25.60 | | | 89,907 | | | | 0.30 | | | $ | 22.13 | | | | 86,845 | | | $ | 22.08 | |
An excerpt. Shown here: 40 of 656 rewritten, 40 of 637 added and 40 of 164 removed. The counts are complete. For every sentence, read Item 8. Financial Statements and Supplementary Data in the FY2016 filing and the FY2015 filing.
Item 9. Changes in and Disagreements With Accountants on Accounting and Financial Disclosure
0 rewritten, 0 added, 1 removed, 1 unchanged
| --- | --- |
Item 9A. Controls and Procedures
9 rewritten, 1 added, 0 removed, 11 unchanged
[removed: _Design] [added: Design] of Disclosure Controls and Procedures and Internal Control over Financial [removed: Reporting_][added: Reporting]
[removed: _Disclosure] [added: Disclosure] Controls and [removed: Procedures_][added: Procedures]
As required by Rule 13a-15(b) under the Securities Exchange Act of 1934, as amended (the “Exchange Act”), as of June [removed: 28, 2015,] [added: 26, 2016,] we carried out an evaluation, under the supervision and with the participation of our management, including our Chief Executive Officer and our Chief Financial Officer, of the effectiveness of the design and operation of our disclosure controls and procedures as defined in Rule 13a-15(e).
Based upon that evaluation, our Chief Executive Officer and our Chief Financial Officer each concluded that our disclosure controls and procedures are [removed: effective] [added: effective, as of June 26, 2016,] at the reasonable assurance level.
[removed: _Changes] [added: Changes] in Internal Control Over Financial [removed: Reporting_][added: Reporting]
[removed: _Management’s] [added: Management’s] Report on Internal Control Over Financial [removed: Reporting_][added: Reporting]
Based on that evaluation, management has concluded that the Company’s internal control over financial reporting was effective as of June [removed: 28, 2015] [added: 26, 2016] at providing reasonable assurance regarding the reliability of financial reporting and the preparation of financial statements for external purposes in accordance with GAAP.
Ernst & Young LLP, an independent registered public accounting firm, has audited the Company’s internal control over financial reporting, as stated in their report, which is included in Part II, Item 8 of this [removed: 2015] [added: 2016] Form 10-K.
[removed: _Effectiveness] [added: Effectiveness] of [removed: Controls_][added: Controls]
| | |
Item 9B. Other Information
2 rewritten, 3 added, 2 removed, 2 unchanged
[removed: PART III][added: PART III]
We have omitted from this [removed: 2015] [added: 2016] Form 10-K certain information required by Part III because we, as the Registrant, will file a definitive proxy statement with the SEC within 120 days after the end of our fiscal year, pursuant to Regulation 14A, as promulgated by the SEC, for our Annual Meeting of Stockholders expected to be held on or about November [removed: 4, 2015] [added: 9, 2016] (the “Proxy Statement”), and certain information included in the Proxy Statement is incorporated into this report by reference.
Continues on next page
Lam Research Corporation 2016 10-K 100

| --- | --- |
##### [Table of Contents](#toc)
Item 10. Directors, Executive Officers and Corporate Governance
4 rewritten, 0 added, 1 removed, 4 unchanged
For information regarding our executive officers, see Part I, Item 1 of this [removed: 2015] [added: 2016] Form 10-K under the caption “Executive Officers of the Company,” which information is incorporated into Part III by reference.
The information concerning our directors required by this Item is incorporated by reference to our Proxy Statement under the heading “Voting Proposals — Proposal No. 1: Election of Directors — [added: 2016] Nominees for [removed: Directors.”][added: Director” and "Voting Proposals — Proposal No. 2: — Election of Additional Directors — 2016 Nominees for Director."]
The information concerning our audit committee and audit committee financial experts required by this Item is incorporated by reference to our Proxy Statement under the heading “Governance Matters — Corporate Governance — Board [added: Committees" and "Governance Matters — Corporate Governance — Board] Committees — Audit Committee.”
The information concerning compliance by our officers, directors and 10% shareholders with Section 16 of the Exchange Act required by this Item is incorporated by reference to our Proxy Statement under the heading [removed: “Share] [added: “Stock] Ownership – Section 16(a) Beneficial Ownership Reporting Compliance.”
| --- | --- |
Item 11. Executive Compensation
0 rewritten, 1 added, 0 removed, 2 unchanged
| | |
Item 12. Security Ownership of Certain Beneficial Owners and Management and Related Stockholder Matters
1 rewritten, 1 added, 0 removed, 1 unchanged
The information required by this Item is incorporated by reference to our Proxy Statement under the headings [removed: “Voting Proposals — Proposal No. 1: Election of Directors,” “Compensation Matters — Executive Compensation and Other Information Compensation Committee Interlocks and Insider Participation,” “Compensation Matters — Executive Compensation and Other Information — Compensation Committee Report,” “Share] [added: “Stock] Ownership — Security Ownership of Certain Beneficial Owners and Management” and “Compensation Matters — Securities Authorized for Issuance Under Equity Compensation Plans.”
| | |
Item 13. Certain Relationships and Related Transactions, and Director Independence
1 rewritten, 1 added, 0 removed, 1 unchanged
The information required by this Item is incorporated by reference to our Proxy Statement under the headings “Audit Matters — Certain Relationships and Related Transactions” and “Governance Matters — Corporate [removed: Governance”.][added: Governance — Director Independence Policies."]
| | |
Item 14. Principal Accounting Fees and Services
1 rewritten, 3 added, 2 removed, 1 unchanged
[removed: PART IV][added: PART IV]
Continues on next page
Lam Research Corporation 2016 10-K 101

| --- | --- |
##### [Table of Contents](#toc)
Item 15. Exhibits, Financial Statement Schedules
107 rewritten, 106 added, 24 removed, 93 unchanged
| [removed: |] (a) | The following documents are filed as part of this Annual Report on Form 10-K |
| | [removed: |] Page | [removed: | |]
| Consolidated Statements of Operations — Years Ended June [added: 26, 2016, June] 28, 2015, [removed: June 29, 2014,] and June [removed: 30, 2013 | | | 49] [added: 29, 2014] | [added: [52](#sAE5CE74A9C2FC7C652393B687F57B174)] |
| Consolidated Statements of Comprehensive Income — Years Ended June [added: 26, 2016, June] 28, 2015, [removed: June 29, 2014,] and June [removed: 30, 2013 | | | 50] [added: 29, 2014] | [added: [53](#s3CB15857A8C509C8050D3B687C30E6D4)] |
| Consolidated Balance Sheets — June [removed: 28, 2015] [added: 26, 2016] and June [removed: 29, 2014 | | | 51] [added: 28, 2015] | [added: [54](#s16D7C265876CFB02F0703B687F11A8AC)] |
| Consolidated Statements of Cash Flows — Years Ended June [added: 26, 2016, June] 28, 2015, [removed: June 29, 2014,] and June [removed: 30, 2013 | | | 52] [added: 29, 2014] | [added: [55](#s841D8C95643C3C4BA80C3B687FC70CA4)] |
| Consolidated Statements of Stockholders’ Equity — Years Ended June [added: 26, 2016, June] 28, 2015, [removed: June 29, 2014,] and June [removed: 30, 2013 | | | 54] [added: 29, 2014] | [added: [57](#s3E2A37DFF918C5ED14473B6880249BF0)] |
| Notes to Consolidated Financial Statements | [removed: | | 55 |] [added: [58](#sBBC2E580623282E96E4A3B68AAC4E49A)] |
| Reports of Independent Registered Public Accounting Firm | [removed: | | 89 |] [added: [98](#s50DE6F94C93E973C6A153B68B2CB8401)] |
| 2. Index to Financial Statement Schedules | | [removed: | | |]
[removed: | Schedule] [added: SCHEDULE] II — [removed: Valuation and Qualifying Accounts | | | 96 | |][added: VALUATION AND QUALIFYING ACCOUNTS]
| Schedules, other than those listed above, have been omitted since they are not applicable/not required, or the information is included elsewhere herein. | | [removed: | | |]
| 3. See (b) of this Item 15, which is incorporated herein by reference. | | [removed: | | |]
| [removed: |] (b) | The list of Exhibits follows page [removed: 96] [added: 105] of this [removed: 2015] [added: 2016] Annual Report on Form 10-K and is incorporated herein by this reference. |
[removed: SIGNATURES][added: SIGNATURES]
[removed: |] LAM RESEARCH CORPORATION [removed: | | |]
| [removed: By] [added: By:] | | [added: |] /s/ Martin B. Anstice |
| [removed: | |] Martin B. Anstice | [added: | | |]
| [removed: | |] President and Chief Executive Officer | [added: | | |]
[removed: POWER] [added: POWER] OF ATTORNEY AND [removed: SIGNATURES][added: SIGNATURES]
| [removed: Signatures] [added: Signatures] | | [removed: Title] [added: Title] | | [removed: Date] [added: Date] |
| [removed: Principal] [added: Principal] Executive [removed: Officer] [added: Officer] | | | | |
| /s/ Martin B. Anstice [removed: Martin B. Anstice] | | President, Chief Executive Officer and Director | | August [removed: 13, 2015] [added: 16, 2016] |
| [removed: Principal] [added: Principal] Financial Officer and [removed: Principal Accounting Officer] [added: Principal Accounting Officer] | | | | |
| /s/ Douglas R. Bettinger [removed: Douglas R. Bettinger] | | Executive Vice President, Chief Financial Officer, and Chief Accounting Officer | | August [removed: 13, 2015] [added: 16, 2016] |
| /s/ Eric K. Brandt [removed: Eric K. Brandt] | | Director | | August [removed: 13, 2015] [added: 16, 2016] |
| [removed: /s/] Michael R. Cannon [removed: Michael R. Cannon] | | [removed: Director] | | [removed: August 13, 2015] |
| /s/ Youssef A. El-Mansy [removed: Youssef A. El-Mansy] | | Director | | August [removed: 13, 2015] [added: 16, 2016] |
| /s/ Christine Heckart [removed: Christine Heckart] | | Director | | August [removed: 13, 2015] [added: 16, 2016] |
| /s/ Catherine P. Lego [removed: Catherine P. Lego] | | Director | | August [removed: 13, 2015] [added: 16, 2016] |
| /s/ Krishna Saraswat [removed: Krishna Saraswat] | | Director | | August [removed: 13, 2015] [added: 16, 2016] |
| /s/ Abhi Talwalkar [removed: Abhi Talwalkar] | | Director | | August [removed: 13, 2015] [added: 16, 2016] |
[removed: LAM] [added: LAM] RESEARCH [removed: CORPORATION][added: CORPORATION]
[removed: SCHEDULE] [added: | Schedule] II — [removed: VALUATION AND QUALIFYING ACCOUNTS][added: Valuation and Qualifying Accounts | [105](#sab0bd2ac55ea447eb016eb57c2c2366b) |]
[removed: (in thousands)][added: (in thousands)]
| | | [removed: Additions] [added: Additions] | | | | | | | | | | | | | | |
| [removed: Description] [added: Description] | | [removed: Balance] [added: Balance] at Beginning of [removed: Period] [added: Period] | | | | [removed: Charged] [added: Charged] to Costs and [removed: Expenses] [added: Expenses] | | | | [removed: Write-offs,] [added: Write-offs,] Net of Recoveries [removed: (1)] | | | | [removed: Balance] [added: Balance] at End of [removed: Period] [added: Period] | | |
| YEAR ENDED JUNE [removed: 30, 2013] [added: 26, 2016] | | | | | | | | | | | | | | | | |
| Allowance for doubtful accounts | | $ | [removed: 5,248] [added: 4,890] | | | $ | [removed: 200] [added: —] | | | $ | [removed: —] [added: 265] | | | $ | [removed: 5,448] [added: 5,155] | |
[removed: ANNUAL] [added: ANNUAL] REPORT ON FORM [removed: 10-K][added: 10-K]
| | |
| | |
| | |
| | |
| | |
| | |
| | |
| | |
Continues on next page
Lam Research Corporation 2016 10-K 102

| | | | |
| --- | --- | --- | --- |
| | | | |
| Date: | August 16, 2016 | | LAM RESEARCH CORPORATION (Registrant) |
| | | | |
Continues on next page
Lam Research Corporation 2016 10-K 103

| Martin B. Anstice | | | | |
| Douglas R. Bettinger | | | | |
| Other Directors | | | | |
| | | Chairman | | |
| Stephen G. Newberry | | | | |
| Eric K. Brandt | | | | |
| | | Director | | |
| Youssef A. El-Mansy | | | | |
| Christine Heckart | | | | |
| Catherine P. Lego | | | | |
| Krishna Saraswat | | | | |
| Abhi Talwalkar | | | | |
Continues on next page
Lam Research Corporation 2016 10-K 104

| | | | | | | | | | | | | | | | | |
Continues on next page
Lam Research Corporation 2016 10-K 105

| 2.1(25) | | Agreement and Plan of Merger and Reorganization, dated as of October 20, 2015, by and among Lam Research Corporation, Topeka Merger Sub 1, Inc., Topeka Merger Sub 2, Inc., and KLA-Tencor Corporation. |
| 4.23(30) | | Second Supplemental Indenture, dated as of June 7, 2016, by and between Lam Research Corporation and The Bank of New York Mellon Trust Company, N.A., as trustee. |
| --- | --- | --- |
| | | | | |
| --- | --- | --- | --- | --- |
##### [Table of Contents](#toc)
Dated: August 13, 2015
| Other Directors /s/ Stephen G. Newberry Stephen G. Newberry | | Chairman | | August 13, 2015 |
| /s/ Grant M. Inman Grant M. Inman | | Director | | August 13, 2015 |
| /s/ William R. Spivey William R. Spivey | | Director | | August 13, 2015 |
| 4.20(16)* | | Lam Research Corporation 1999 Employee Stock Purchase Plan, as amended. |
| 10.194(18) | | Participation Agreement between Lam Research Corporation and BTMU Capital Leasing & Finance, Inc., dated December 31, 2013 |
| 10.195(18) | | Amended and Restated Lease Agreement (1 Portola Avenue Building) between Lam Research Corporation and BTMU Capital Leasing & Finance, Inc., dated December 31, 2013 |
| 10.196(18) | | Pledge Agreement (1 Portola Avenue Building) between Lam Research Corporation and BTMU Capital Leasing & Finance, Inc., dated December 31, 2013 |
| 10.197(18) | | Amended and Restated Lease Agreement (101 Portola Avenue Building) between Lam Research Corporation and BTMU Capital Leasing & Finance, Inc., dated December 31, 2013 |
| 10.198(18) | | Pledge Agreement (101 Portola Avenue Building) between Lam Research Corporation and BTMU Capital Leasing & Finance, Inc., dated December 31, 2013 |
| 10.199(18) | | Amended and Restated Lease Agreement (Fremont Building #1) between Lam Research Corporation and BTMU Capital Leasing & Finance, Inc., dated December 31, 2013 |
| 10.200(18) | | Pledge Agreement (Fremont Building #1) between Lam Research Corporation and BTMU Capital Leasing & Finance, Inc., dated December 31, 2013 |
| 10.201(18) | | Amended and Restated Lease Agreement (Fremont Building #3) between Lam Research Corporation and BTMU Capital Leasing & Finance, Inc., dated December 31, 2013 |
| 10.202(18) | | Pledge Agreement (Fremont Building #3) between Lam Research Corporation and BTMU Capital Leasing & Finance, Inc., dated December 31, 2013 |
| 10.203(18) | | Amended and Restated Lease Agreement (Fremont Building #3E) between Lam Research Corporation and BTMU Capital Leasing & Finance, Inc., dated December 31, 2013 |
| 10.204(18) | | Pledge Agreement (Fremont Building #3E) between Lam Research Corporation and BTMU Capital Leasing & Finance, Inc., dated December 31, 2013 |
| 10.205(18) | | Amended and Restated Lease Agreement (Fremont Building #4) between Lam Research Corporation and BTMU Capital Leasing & Finance, Inc., dated December 31, 2013 |
| 10.206(18) | | Pledge Agreement (Fremont Building #4) between Lam Research Corporation and BTMU Capital Leasing & Finance, Inc., dated December 31, 2013 |
| 10.207(18) | | Construction Agency Agreement (Fremont Building #3E) between Lam Research Corporation and BTMU Capital Leasing & Finance, Inc., dated December 31, 2013 |
| 10.221(20) | | Credit Agreement dated March 12, 2014 among Lam Research Corporation and the lenders party thereto, JPMorgan Chase Bank, N.A., as administrative agent, Bank of America, N.A., as syndication agent, BNP Paribas, Barclays Bank PLC, Citibank, N.A. and Deutsche Bank Securities Inc., as co-documentation agents, and J.P. Morgan Securities LLC, Merrill Lynch, Pierce, Fenner & Smith Incorporated, as joint bookrunners and joint lead arrangers |
An excerpt. Shown here: 40 of 107 rewritten, 40 of 106 added and all 24 removed. The counts are complete. For every sentence, read Item 15. Exhibits, Financial Statement Schedules in the FY2016 filing and the FY2015 filing.