 filings.tools
Lam Research 10-K 2022-06-26
Filed 2022-08-24. 23 sections, 420K characters. Original on sec.gov · Markdown · JSON
Cover and table of contents
UNITED STATES
SECURITIES AND EXCHANGE COMMISSION
Washington, D.C. 20549
| FORM | 10-K |
| (Mark One) | |||||
| ☒ | ANNUAL REPORT PURSUANT TO SECTION 13 OR 15(d) OF THE SECURITIES EXCHANGE ACT OF 1934 |
For the fiscal year ended June 26, 2022
OR
| ☐ | TRANSITION REPORT PURSUANT TO SECTION 13 OR 15(d) OF THE SECURITIES EXCHANGE ACT OF 1934 |
For the transition period from to .
Commission file number: 0-12933
| LAM RESEARCH CORPORATION | ||
| (Exact name of registrant as specified in its charter) |
| Delaware | 94-2634797 | |||||||||||||
| (State or other jurisdiction of incorporation or organization) | (I.R.S. Employer Identification No.) | |||||||||||||
| 4650 Cushing Parkway, | Fremont, | California | 94538 | |||||||||||
| (Address of principal executive offices) | (Zip Code) |
Registrant’s telephone number, including area code: (510) 572-0200
Securities registered pursuant to Section 12(b) of the Act:
| Title of each class | Trading Symbol(s) | Name of each exchange on which registered | ||||||
| Common Stock, Par Value $0.001 Per Share | LRCX | The Nasdaq Stock Market | ||||||
| (Nasdaq Global Select Market) |
Securities registered pursuant to Section 12(g) of the Act:
None
(Title of class)
_______________________
Indicate by check mark if the registrant is a well-known seasoned issuer, as defined in Rule 405 of the Securities Act. Yes ☒ No ☐
Indicate by check mark if the registrant is not required to file reports pursuant to Section 13 or Section 15(d) of the Act. Yes ☐ No ☒
Indicate by check mark whether the registrant (1) has filed all reports required to be filed by Section 13 or 15(d) of the Securities Exchange Act of 1934 during the preceding 12 months (or for such shorter period that the registrant was required to file such reports), and (2) has been subject to such filing requirements for the past 90 days. Yes ☒ No ☐
Indicate by check mark whether the registrant has submitted electronically every Interactive Data File required to be submitted pursuant to Rule 405 of Regulation S-T (§ 232.405 of this chapter) during the preceding 12 months (or for such shorter period that the registrant was required to submit such files). Yes ☒ No ☐
Indicate by check mark whether the registrant is a large accelerated filer, an accelerated filer, a non-accelerated filer, a smaller reporting company, or an emerging growth company. See the definitions of “large accelerated filer,” “accelerated filer”, “smaller reporting company”, and “emerging growth company” in Rule 12b-2 of the Exchange Act.
| Large accelerated filer | ☒ | Accelerated filer | ☐ | |||||||||||||||||
| Non-accelerated filer | ☐ | Smaller reporting company | ☐ | |||||||||||||||||
| Emerging growth company | ☐ |
If an emerging growth company, indicate by check mark if the registrant has elected not to use the extended transition period for complying with any new or revised financial accounting standards provided pursuant to Section 13(a) of the Exchange Act. ☐
Indicate by check mark whether the registrant has filed a report on and attestation to its management’s assessment of the effectiveness of its internal control over financial reporting under Section 404(b) of the Sarbanes-Oxley Act (15 U.S.C. 7262(b)) by the registered public accounting firm that prepared or issued its audit report. ☒
Indicate by check mark whether the registrant is a shell company (as defined in Rule 12b-2 of the Act). Yes ☐ No ☒
The aggregate market value of the Registrant’s Common Stock, $0.001 par value, held by non-affiliates of the Registrant, as of December 26, 2021, the last business day of the most recently completed second fiscal quarter, was $77,032,123,135. Common Stock held by each officer and director and by each person who owns 5% or more of the outstanding Common Stock has been excluded from this computation based on the assumption that such persons may be deemed to be affiliates. This determination of affiliate status is not necessarily a conclusive determination of such status for other purposes.
As of August 22, 2022, the Registrant had 136,987,792 outstanding shares of Common Stock.
_________________________
Documents Incorporated by Reference
Parts of the Registrant’s Proxy Statement for the Annual Meeting of Stockholders expected to be held on or about November 8, 2022, are incorporated by reference into Part III of this Form 10-K. Except as expressly incorporated by reference herein, the Registrant’s proxy statement shall not be deemed to be part of this report.
LAM RESEARCH CORPORATION
2022 ANNUAL REPORT ON FORM 10-K
TABLE OF CONTENTS
Lam Research Corporation 2022 10-K 2
PART I
CAUTIONARY STATEMENT REGARDING FORWARD-LOOKING STATEMENTS
With the exception of historical facts, the statements contained in this discussion are forward-looking statements, which are subject to the safe harbor provisions created by the Private Securities Litigation Reform Act of 1995. Certain, but not all, of the forward-looking statements in this report are specifically identified as forward-looking, by use of phrases and words such as “believe,” “estimated,” “anticipate,” “expect,” “probable,” “intend,” “plan,” “aim,” “may,” “should,” “could,” “would,” “will,” “continue,” and other future-oriented terms. The identification of certain statements as “forward-looking” does not mean that other statements not specifically identified are not forward-looking. Forward-looking statements include but are not limited to statements that relate to: trends and opportunities in the global economic environment; trends and opportunities in the semiconductor industry, including in the end markets and applications for semiconductors, and in device complexity; growth or decline in the industry and the market for, and spending on, wafer fabrication equipment; the anticipated levels of, and rates of change in, margins, market share, served addressable market, capital expenditures, research and development expenditures, international sales, revenue (actual and/or deferred), operating expenses and earnings generally; management’s plans and objectives for our current and future operations and business focus; volatility in our quarterly results; the makeup of our customer base; customer and end user requirements and our ability to satisfy those requirements; customer spending and demand for our products and services, and the reliability of indicators of change in customer spending and demand; the effect of variability in our customers’ business plans or demand for our products and services; our competition, and our ability to defend our market share and to gain new market share; the success of joint development and collaboration relationships with customers, suppliers, or others; outsourced activities; our supply chain and the role of suppliers in our business, including the impacts of supply chain constraints and material costs; our leadership and competency, and our ability to facilitate innovation; our research and development programs, our ability to create sustainable differentiation; technology inflections in the industry and our ability to identify those inflections and to invest in research and development programs to meet them; our ability to deliver multi-product solutions; the resources invested to comply with evolving standards and the impact of such efforts; changes in state, federal and international tax laws, our estimated annual tax rate and the factors that affect our tax rates; legal and regulatory compliance; the estimates we make, and the accruals we record, in order to implement our critical accounting policies (including but not limited to the adequacy of prior tax payments, future tax benefits or liabilities, and the adequacy of our accruals relating to them); hedging transactions; debt or financing arrangements; our investment portfolio; our access to capital markets; uses of, payments of, and impact of interest rate fluctuations on, our debt; our intention to pay quarterly dividends and the amounts thereof, if any*;* our ability and intention to repurchase our shares; credit risks; controls and procedures; recognition or amortization of expenses; our ability to manage and grow our cash position; our strategic relevance with our customers; our ability to scale our operations to respond to changes in our business; the value of our patents; the materiality of potential losses arising from legal proceedings; the probability of making payments under our guarantees; the impact of the COVID-19 pandemic, and the sufficiency of our financial resources or liquidity to support future business activities (including but not limited to operations, investments, debt service requirements, dividends, and capital expenditures). Such statements are based on current expectations and are subject to risks, uncertainties, and changes in condition, significance, value, and effect, including without limitation those discussed below under the heading “Risk Factors” within Item 1A and elsewhere in this report and other documents we file from time to time with the Securities and Exchange Commission (“SEC”), such as our quarterly reports on Form 10-Q and our current reports on Form 8-K. Such risks, uncertainties, and changes in condition, significance, value, and effect could cause our actual results to differ materially from those expressed in this report and in ways not readily foreseeable. Readers are cautioned not to place undue reliance on these forward-looking statements, which speak only as of the date hereof and are based on information currently and reasonably known to us. We do not undertake any obligation to release the results of any revisions to these forward-looking statements, which may be made to reflect events or circumstances that occur after the date of this report or to reflect the occurrence or effect of anticipated or unanticipated events.
Item 1. Business
Incorporated in 1980, Lam Research Corporation (“Lam Research,” “Lam,” “we,” “our,” “us,” or the “Company”) is a Delaware corporation, headquartered in Fremont, California. We maintain a network of facilities throughout Asia, Europe, and the United States in order to meet the needs of our dynamic customer base.
Additional information about Lam Research is available on our website at www.lamresearch.com. The content on any website referred to in this Form 10-K is not a part of or incorporated by reference in this Form 10-K unless expressly noted.
Our Annual Report on Form 10-K, Quarterly Reports on Forms 10-Q, Current Reports on Forms 8-K, Proxy Statements and all other filings we make with the SEC are available on our website, free of charge, as soon as reasonably practical after we file them with or furnish them to the SEC and are also available online at the SEC’s website at www.sec.gov.
The Lam Research logo, Lam Research, and all product and service names used in this report are either registered trademarks or trademarks of Lam Research Corporation or its subsidiaries in the United States and/or other countries. All other marks mentioned herein are the property of their respective holders.
Lam Research Corporation 2022 10-K 3
We are a global supplier of innovative wafer fabrication equipment and services to the semiconductor industry. We have built a strong global presence with core competencies in areas like nanoscale applications enablement, chemistry, plasma and fluidics, advanced systems engineering, and a broad range of operational disciplines. Our products and services are designed to help our customers build smaller and better performing devices that are used in a variety of electronic products, including mobile phones, personal computers, servers, wearables, automotive vehicles, and data storage devices.
Our customer base includes leading semiconductor memory, foundry, and integrated device manufacturers (“IDMs”) that make products such as non-volatile memory (“NVM”), dynamic random-access memory (“DRAM”), and logic devices. Their continued success is part of our commitment to driving semiconductor breakthroughs that define the next generation. Our core technical competency is integrating hardware, process, materials, software, and process control enabling results on the wafer.
Semiconductor manufacturing, our customers’ business, involves the complete fabrication of multiple dies or integrated circuits (“ICs”) on a wafer. This involves the repetition of a set of core processes and can require hundreds of individual steps. Fabricating these devices requires highly sophisticated process technologies to integrate an increasing array of new materials with precise control at the atomic scale. Along with meeting technical requirements, wafer processing equipment must deliver high productivity and be cost-effective.
Demand from cloud computing (the “Cloud”), the Internet of Things (“IoT”), and other markets is driving the need for increasingly powerful and cost-efficient semiconductors. At the same time, there are growing technical challenges with traditional two-dimensional scaling. These trends are driving significant inflections in semiconductor manufacturing, such as the increasing importance of vertical scaling strategies like three-dimensional (“3D”) architectures as well as multiple patterning to enable shrinks.
We believe we are in a strong position with our leadership and expertise in deposition, etch, and clean to facilitate some of the most significant innovations in semiconductor device manufacturing. Several factors create opportunity for sustainable differentiation for us: (i) our focus on research and development, with several on-going programs relating to sustaining engineering, product and process development, and concept and feasibility; (ii) our ability to effectively leverage cycles of learning from our broad installed base; (iii) our collaborative focus with semi-ecosystem partners; (iv) our ability to identify and invest in the breadth of our product portfolio to meet technology inflections; and (v) our focus on delivering our multi-product solutions with a goal to enhance the value of Lam’s solutions to our customers.
We also address processes for back-end wafer-level packaging (“WLP”), which is an alternative to traditional wire bonding and can offer a smaller form factor, increased interconnect speed and bandwidth, and lower power consumption, among other benefits. In addition, our products are well-suited for related markets that rely on semiconductor processes and require production-proven manufacturing capability, such as complementary metal-oxide-semiconductor image sensors (“CIS”) and micro-electromechanical systems (“MEMS”).
Our Customer Support Business Group (“CSBG”) provides products and services to maximize installed equipment performance, predictability, and operational efficiency. We offer a broad range of services to deliver value throughout the lifecycle of our equipment, including customer service, spares, upgrades, and new and refurbished non-leading edge products in our deposition, etch, and clean markets. Many of the technical advances that we introduce in our newest products are also available as upgrades, which provide customers with a cost-effective strategy for extending the performance and capabilities of their existing wafer fabrication lines. Service offerings include addressing productivity needs for our customers including, but not limited to, system uptime or availability optimization, throughput improvements, and defect reduction. Additionally, within CSBG, our Reliant product line offers new and refurbished non-leading edge products in deposition, etch and clean markets for those applications that do not require the most advanced wafer processing capability.
Lam Research Corporation 2022 10-K 4
Products
| Market | Process/Application | Technology | Products | |||||||||||||||||
| Deposition | Metal Films | Electrochemical Deposition (“ECD”) (Copper & Other) | SABRE® family | |||||||||||||||||
| Chemical Vapor Deposition (“CVD”) Atomic Layer Deposition (“ALD”) (Tungsten) | ALTUS® family | |||||||||||||||||||
| Dielectric Films | Plasma-enhanced CVD (“PECVD”) ALD Gapfill High-Density Plasma CVD (“HDP-CVD”) | VECTOR® family Striker® family SPEED® family | ||||||||||||||||||
| Film Treatment | Ultraviolet Thermal Processing (“ULTP”) | SOLA® family | ||||||||||||||||||
| Etch | Conductor Etch | Reactive Ion Etch | Kiyo® family, Versys® Metal family | |||||||||||||||||
| Dielectric Etch | Reactive Ion Etch | Flex® family | ||||||||||||||||||
| Through-silicon Via (“TSV”) Etch | Deep Reactive Ion Etch | Syndion® family | ||||||||||||||||||
| Clean | Wafer Cleaning | Wet Clean | EOS®, DV-Prime®, Da Vinci®, SP Series | |||||||||||||||||
| Bevel Cleaning | Dry Plasma Clean | Coronus® family | ||||||||||||||||||
Deposition Processes and Product Families
Deposition processes create layers of dielectric (insulating) and metal (conducting) materials used to build a semiconductor device. Depending on the type of material and structure being made, different techniques are employed. Electrochemical deposition creates the copper wiring (interconnect) that links devices in an integrated circuit (“IC” or “chip”). Plating of copper and other metals is also used for TSV and WLP applications. Tiny tungsten connectors and thin barriers are made with the precision of chemical vapor deposition and atomic layer deposition, which adds only a few layers of atoms at a time. Plasma-enhanced CVD, high-density plasma CVD, and ALD are used to form the critical insulating layers that isolate and protect all of these electrical structures. Lastly, post-deposition treatments such as ultraviolet thermal processing are used to improve dielectric film properties.
ALTUS**®** Product Family
Tungsten deposition is used to form conductive features such as contacts, vias, and wordlines on a chip. These features are small, often narrow, and use only a small amount of metal, so minimizing resistance and achieving complete fill can be difficult. At these nanoscale dimensions, even slight imperfections can impact device performance or cause a chip to fail. Our ALTUS® systems combine CVD and ALD technologies to deposit the highly conformal films needed for advanced tungsten metallization applications. The Multi-Station Sequential Deposition architecture enables nucleation layer formation and bulk CVD/ALD fill to be performed in the same chamber (“in situ”). Our ALD technologies are used in the deposition of barrier films to achieve high step coverage with reduced thickness at lower temperatures relative to a conventional process.
SABRE**®** Product Family
Copper deposition lays down the electrical wiring for most semiconductor devices. Even the smallest defect - say, a microscopic pinhole or dust particle - in these conductive structures can impact device performance, from loss of speed to complete failure. The SABRE*®* ECD product family, which helped pioneer the copper interconnect transition, offers the precision needed for copper damascene manufacturing in logic and memory. System capabilities include cobalt deposition for logic applications and copper deposition directly on various liner materials, which is important for next-generation metallization schemes. For advanced WLP applications, such as forming conductive bumps and redistribution layers, and for filling TSVs, the SABRE® 3D family combines Lam’s SABRE Electrofill® technology with additional innovation to deliver the high-quality films needed at high productivity. The modular architecture can be configured with multiple plating and pre/post-treatment cells, providing flexibility to address a variety of packaging applications.
SOLA**®** Product Family
Dielectric materials designed to meet the insulation requirements of logic chips often have attributes that make them unusually difficult to use. These films are easily damaged and vulnerable to losing some of their insulating capability, which can lead to poor device performance. To enable these applications, some films can be stabilized - and others enhanced to improve device performance - using specialized post-deposition film treatments available with Lam’s SOLA® UVTP product family. SOLA® products offer process flexibility through independent control of temperature, wavelength, and intensity at each station of the wafer path, enabled by Multi-Station Sequential Processing architecture.
Lam Research Corporation 2022 10-K 5
SPEED**®** Product Family
Dielectric gapfill processes deposit critical insulation layers between conductive and/or active areas by filling openings of various aspect ratios between conducting lines and between devices. With advanced devices, the structures being filled can be very tall and narrow. As a result, high-quality dielectric films are especially important due to the ever-increasing possibility of cross-talk and device failure. Our SPEED*®* HDP-CVD products provide a multiple dielectric film solution for high-quality gapfill with industry-leading throughput and reliability. SPEED*®* products have excellent particle performance, and their design allows large batch sizes between cleans and faster cleans.
Striker**®** Product Family
The latest memory, logic, and imaging devices require extremely thin, highly conformal dielectric films for continued device performance improvement and scaling. For example, ALD films are critical for spacer-based multiple patterning schemes where the spacers help define critical dimensions, as well as for insulating liners and gapfill in high aspect ratio features, which have little tolerance for voids and even the smallest defect. The Striker® single-wafer ALD products provide dielectric film solutions for these challenging requirements through application-specific material, process and hardware options that deliver film technology and defect performance.
VECTOR**®** Product Family
Dielectric film deposition processes are used to form some of the most difficult-to-produce insulating layers in a semiconductor device, including those used in the latest transistors and 3D structures. In some applications, these films require dielectric films to be exceptionally smooth and defect free since slight imperfections are multiplied greatly in subsequent layers. Our VECTOR® PECVD products are designed to provide the performance and flexibility needed to create these enabling structures within a wide range of challenging device applications. As a result of its design, VECTOR® produces superior thin film quality, along with exceptional within-wafer and wafer-to-wafer uniformity.
Etch Processes and Product Families
Etch processes help create chip features by selectively removing dielectric (insulating), metal, silicon and poly silicon (conducting/semiconducting) materials that have been added during deposition. These processes involve fabricating increasingly small, complex, and narrow features using many types of materials. The primary technology, reactive ion etch, bombards the wafer surface with ions (charged particles) to remove material. For the smallest features, atomic-layer etching (“ALE”) removes a few atomic layers of material at a time. While conductor etch processes precisely shape critical electrical components like transistors, dielectric etch forms the insulating structures that protect conducting parts.
Flex**®** Product Family
Dielectric etch carves patterns in insulating materials to create barriers between the electrically conductive parts of a semiconductor device. For advanced devices, these structures can be extremely tall and thin and involve complex, sensitive materials. Slight deviations from the target feature profile - even at the atomic level - can negatively affect electrical properties of the device. To precisely create these challenging structures, our Flex® product family offers differentiated technologies and application-focused capabilities for critical dielectric etch applications. Uniformity, repeatability, and tunability are enabled by a unique multi-frequency, small-volume, confined plasma design. Flex® offers in situ multi-step etch and continuous plasma capability that delivers high productivity with low defectivity.
Kiyo**®** Product Family
Conductor etch helps shape the electrically active materials used in the parts of a semiconductor device. Even a slight variation in these miniature structures can degrade device performance. In fact, these structures are so tiny and sensitive that etch processes push the boundaries of the basic laws of physics and chemistry. Our Kiyo® product family delivers the high-performance capabilities needed to precisely and consistently form these features precisely and with high productivity. Proprietary Hydra technology in Kiyo*®* products improves critical dimension (“CD”) uniformity by correcting for incoming pattern variability, and atomic-scale variability control with production-worthy throughput is achieved with plasma-enhanced ALE capability.
Syndion**®** Product Family
Plasma etch processes used to remove single crystal silicon and other materials deep into the wafer are collectively referred to as deep silicon etch. These may be deep trenches for CMOS image sensors, trenches for power and other devices, TSVs, and other high aspect ratio features. These are created by etching through multiple materials sequentially, where each new material involves a change in the etch process. The Syndion® etch product family is optimized for deep silicon etch, providing the fast process switching with depth and cross-wafer uniformity control required to achieve precision etch results. The systems support both conventional single-step etch and rapidly alternating process, which minimizes damage and delivers precise depth uniformity.
Lam Research Corporation 2022 10-K 6
Versys**®** Metal Product Family
Metal etch processes play a key role in connecting the individual components that form an IC, such as forming wires and electrical connections. These processes can also be used to drill through metal hardmasks that are used to form the wiring for advanced devices. To enable these critical etch steps, the Versys® Metal product family provides high-productivity capability on a flexible platform. Superior CD, profile uniformity, and uniformity control are enabled by a symmetrical chamber design with independent process tuning features.
Clean Processes and Product Families
Clean techniques are used between manufacturing steps to clear away particles, contaminants, residues and other unwanted material that could later lead to defects and to prepare the wafer surface for subsequent processing. Wet processing technologies can be used for wafer cleaning and etch applications. Plasma bevel cleaning is used to enhance die yield by removing unwanted materials from the wafer’s edge that could impact the device area.
Coronus**®** Product Family
Bevel cleaning removes unwanted masks, residues, and films from the edge of a wafer between manufacturing steps. If not cleaned, these materials become defect sources. For instance, they can flake off and re-deposit on the device area during subsequent processes. Even a single particle that lands on a critical part of a device can ruin the entire chip. By inserting bevel clean processes at strategic points, these potential defect sources can be eliminated and more functional chips produced. By combining the precise control and flexibility of plasma with technology that protects the active die area, the Coronus® bevel clean family cleans the wafer’s edge to enhance die yield. The systems provide active die area protection by using plasma processing with proprietary confinement technology. Applications include post-etch, pre- and post-deposition, pre-lithography, and metal film removal to prevent arcing during plasma etch or deposition steps.
DV-Prime**®,** Da Vinci**®,** EOS**®****, and SP Series Product Families**
Wafer cleaning is performed repeatedly during semiconductor device manufacturing and is a critical process that affects product yield and reliability. Unwanted microscopic materials - some no bigger than the tiny structures themselves - need to be cleaned effectively. At the same time, these processes must selectively remove residues that are chemically similar to the device films. For advanced WLP, the wet clean steps used between processes that form the package and external wiring have surprisingly complex requirements. These processes are called on to completely remove specific materials and leave other fragile structures undisturbed. In IoT products that include power devices, MEMS and image sensors, there is a unique requirement for wafer backside wet etch to uniformly thin the silicon wafer while protecting the device side of the wafer.
Based on our pioneering single-wafer spin technology, the DV-Prime® and Da Vinci® products provide the process flexibility needed with high productivity to address a wide range of wafer cleaning steps throughout the manufacturing process flow. As the latest of Lam’s wet clean products, EOS® delivers exceptionally low on-wafer defectivity and high throughput to address progressively demanding wafer cleaning applications. With a broad range of process capability, our SP Series products deliver cost-efficient, production-proven wet clean and silicon wet etch solutions for challenging WLP and IoT applications.
Fiscal Periods Presented
All references to fiscal years apply to our fiscal years, which ended June 26, 2022, June 27, 2021, and June 28, 2020.
Research and Development
The market for semiconductor capital equipment is characterized by rapid technological change and product innovation. Our ability to achieve and maintain our competitive advantage depends in part on our continued and timely development of new products and enhancements to existing products. Accordingly, we devote a significant portion of our personnel and financial resources to research and development (“R&D”) programs and seek to maintain close and responsive relationships with our customers and suppliers.
We believe current challenges for customers at various points in the semiconductor manufacturing process present opportunities for us. We expect to continue to make substantial investments in R&D to meet our customers’ product needs, support our growth strategy and enhance our competitive position.
Marketing, Sales, and Service
Our marketing, sales, and service efforts are focused on building long-term relationships with our customers and targeting product and service solutions designed to meet their needs. These efforts are supported by a team of product marketing and sales professionals as well as equipment and process engineers who work closely with individual customers to develop solutions for their wafer processing needs. We maintain ongoing service relationships with our customers and have an extensive network of service engineers in place throughout the United States, China, Europe, India, Japan, Korea, Southeast Asia, and Taiwan. We believe that comprehensive support programs and close working relationships with customers are essential to maintaining high customer satisfaction and our competitiveness in the marketplace.
Lam Research Corporation 2022 10-K 7
We provide standard warranties for our systems. The warranty provides that systems will be free from defects in material and workmanship and will conform to agreed-upon specifications. The warranty is limited to repair of the defect or replacement with new or like-new equivalent goods and is valid when the buyer provides prompt notification within the warranty period of the claimed defect or non-conformity and also makes the items available for inspection and repair. We also offer extended warranty packages to our customers to purchase as desired.
International Sales
A significant portion of our sales and operations occur outside the United States (“U.S.”) and, therefore, may be subject to certain risks, including but not limited to tariffs and other barriers; difficulties in staffing and managing non-U.S. operations; adverse tax consequences; foreign currency exchange rate fluctuations; changes in currency controls; compliance with U.S. and international laws and regulations, including U.S. export restrictions; the effects of the COVID-19 pandemic and the related governmental, public health and business responses to it; and economic and political conditions. Any of these factors may have a material adverse effect on our business, financial position, and results of operations and cash flows. For geographical reporting, revenue is attributed to the geographic location in which the customers’ facilities are located. Refer to Note 20 of our Consolidated Financial Statements, included in Part II, Item 8 of this 2022 Form 10-K, for the attribution of revenue by geographic region.
Long-lived Assets
Refer to Note 20 of our Consolidated Financial Statements, included in Part II, Item 8 of this 2022 Form 10-K, for information concerning the geographic locations of long-lived assets.
Customers
Our customers include all of the world’s leading semiconductor manufacturers. Customers continue to establish joint ventures, alliances, and licensing arrangements which have the potential to positively or negatively impact our competitive position and market opportunities. Refer to Note 9 of our Consolidated Financial Statements, included in Part II, Item 8 of this report, for information concerning customer concentrations. Our most significant customers during the fiscal years ending June 26, 2022, June 27, 2021, and June 28, 2020 included Intel Corporation; Kioxia Corporation; Micron Technology, Inc.; Samsung Electronics Company, Ltd.; SK hynix Inc.; Taiwan Semiconductor Manufacturing Company; and Yangtze Memory Technologies Co., Ltd.
A material reduction in orders from our customers could adversely affect our results of operations and projected financial condition. Our business depends upon the expenditures of semiconductor manufacturers. Semiconductor manufacturers’ businesses, in turn, depend on many factors, including their economic capability, the current and anticipated market demand for ICs, and the availability of equipment capacity to support that demand.
Manufacturing
Our manufacturing operations mainly consist of assembling and testing components, sub-assemblies, and modules that are then integrated into finished systems prior to shipment to or at the location of our customers. The assembly and testing of our products is conducted predominately in cleanroom environments.
We have agreements with third parties to outsource certain aspects of our manufacturing, production warehousing, and logistics functions. These outsourcing contracts may provide us more flexibility to scale our operations up or down in a timely and cost-effective manner, with the potential to enable us to respond more quickly to changes in our business. We believe that we have selected reputable providers and have secured their performance on terms documented in written contracts. However, it is possible that one or more of these providers could fail to perform as we expect, and such failure could have an adverse impact on our business and have a negative effect on our operating results and financial condition. Overall, we believe we have effective mechanisms to manage risks associated with our outsourcing relationships. Refer to Note 17 of our Consolidated Financial Statements, included in Part II, Item 8 of this report, for further information concerning our outsourcing commitments, reported as a component of purchase obligations.
Certain components and sub-assemblies that we include in our products may only be obtained from a single supplier. In response to ongoing supply chain constraints, we worked diligently to obtain and qualify alternative sources to supply these products. Any prolonged inability to obtain these components could have an adverse effect on our operating results and could unfavorably impact our customer relationships.
Compliance with Government Regulations
As a public company with global operations, we are subject to a variety of governmental regulations across multiple jurisdictions, including those related to export controls, financial and other disclosures, corporate governance, anti-trust, intellectual property, privacy, anti-bribery, anti-corruption, anti-boycott, tax, labor, health and safety, conflict minerals, human trafficking, the management of hazardous materials, and carbon emissions, among others. Each of these regulations imposes costs on our business and has the potential to divert our management’s time and attention from revenue-generating and other profit maximizing activities to those associated with compliance. Efforts to comply with new and changing regulations have resulted in, and are likely to continue to result in, decreased net income and increased capital expenditures. If we are alleged or found by a court or regulatory agency not to be in compliance with regulations, we may be subject to fines, restrictions on our actions, reputational damage, and harm to our
Lam Research Corporation 2022 10-K 8
competitive position, and our business, financial condition, and/or results of operations could be adversely affected. For additional details, please refer to “Legal, Regulatory and Tax Risks – We Are Exposed to Various Risks from Our Regulatory Environment” in Item 1A: Risk Factors.
Regulations that impact trade, including tariffs, export controls, taxes, trade barriers, sanctions, the termination or modification of trade agreements, trade zones, and other duty mitigation initiatives, have the potential to increase our manufacturing costs, decrease margins, reduce the competitiveness of our products, or inhibit our ability to sell products or purchase necessary equipment and supplies, which could have a material adverse effect on our business, results of operations, or financial conditions. For additional details regarding the impacts of compliance with trade laws and regulations, please refer to “Business and Operational Risks – Our Future Success Depends Heavily on International Sales and the Management of Global Operations” and “Legal, Regulatory and Tax Risks – Our Sales to Customers in China, a Region of Growing Significance to Us, Could be Materially and Adversely Affected by Export License Requirements and Other Regulatory Changes, or Other Governmental Actions in the Course of the Trade Relationship Between the U.S. and China” in Item 1A: Risk Factors.
We are subject to income, transaction, and other taxes in the United States and various foreign jurisdictions that impact our tax rate and profitability. For additional details regarding the impacts of compliance with tax laws and regulations, please refer to “Legal, Regulatory and Tax Risks – Our Financial Results May Be Adversely Impacted by Higher than Expected Tax Rates or Exposure to Additional Tax Liabilities” in Item 1A: Risk Factors.
An important element of our management strategy is to review acquisition prospects that would complement our existing products, augment our market coverage and distribution ability, enhance our technological capabilities, or accomplish other strategic objectives. However, for regulatory reasons, we may not be successful in our attempts to acquire or dispose of businesses, products, or technologies. For additional details regarding the impacts of regulations on acquisitions or dispositions we may attempt, please refer to “Business and Operational Risks – If We Choose to Acquire or Dispose of Businesses, Product Lines, and Technologies, We May Encounter Unforeseen Costs and Difficulties That Could Impair Our Financial Performance” in Item 1A: Risk Factors.
We are subject to a variety of domestic and international governmental regulations related to the handling, discharge, and disposal of toxic, volatile, or otherwise hazardous chemicals. For additional details regarding the impacts of compliance with environmental laws and regulations, please refer to “Legal, Regulatory and Tax Risks – A Failure to Comply with Environmental Regulations May Adversely Affect Our Operating Results” in Item 1A: Risk Factors.
Environmental, Social, and Governance
We strive to incorporate environmental, social and governance ("ESG") considerations into everything we do – from our operations and workplace practices, to how we source our materials and design our products. Our ESG report for calendar year 2021 details, among other items, a number of ESG goals. One such goal is to achieve net zero emissions by 2050, which we intend to achieve in part by meeting a number of interim targets related to our environmental impact. There have been no material impacts to capital expenditures or our results of operations associated with this goal, and there are no material cash commitments associated with the goal as of fiscal year ended June 26, 2022.
Information contained on our website or in our annual ESG Report is not incorporated by reference into this or any other report we file with the Securities and Exchange Commission, or the SEC. Refer to “Item 1A. Risk Factors” for a discussion of risks and uncertainties we face related to ESG.
Competition
The semiconductor capital equipment industry is characterized by rapid change and is highly competitive throughout the world. To compete effectively, we invest significant financial resources targeted to strengthen and enhance our product and services portfolio and to maintain customer service and support locations globally. Semiconductor manufacturers evaluate capital equipment suppliers in many areas, including but not limited to process performance, productivity, defect control, customer support, and overall cost of ownership, which can be affected by many factors such as equipment design, reliability, software advancements, and similar factors. Our ability to succeed in the marketplace depends upon our ability to manufacture and ship products on a timeline that meets our customers’ needs, maintain existing products, and introduce product enhancements and new products that meet customer requirements on a timely basis. In addition, semiconductor manufacturers must make a substantial investment to qualify and integrate new capital equipment into semiconductor production lines. As a result, once a semiconductor manufacturer has selected a particular supplier’s equipment and qualified it for production, the manufacturer generally maintains that selection for that specific production application and technology node as long as the supplier’s products demonstrate performance to specification in the installed base. Accordingly, we may experience difficulty in selling to a given customer if that customer has qualified a competitor’s equipment. We must also continue to meet the expectations of our installed base of customers through the delivery of high-quality and cost-efficient spare parts in the presence of competition from third-party spare parts providers.
We face significant competition with all of our products and services. Our primary competitor in the dielectric and metals deposition market is Applied Materials, Inc. For ALD and PECVD, we also compete against ASM International and Wonik IPS. In the etch market, our primary competitors are Applied Materials, Inc.; Hitachi, Ltd.; and Tokyo Electron, Ltd., and our primary competitors in the wet clean market are Screen Holding Co., Ltd.; Semes Co., Ltd.; and Tokyo Electron, Ltd.
Lam Research Corporation 2022 10-K 9
We face competition from a number of established and emerging companies in the industry. We expect our competitors to continue to improve the design and performance of their current products and processes, to introduce new products and processes with enhanced price/performance characteristics, and to provide more comprehensive offerings of products. If our competitors make acquisitions or enter into strategic relationships with leading semiconductor manufacturers, or other entities, covering products similar to those we sell, our ability to sell our products to those customers could be adversely affected. Strategic investments to encourage local semiconductor manufacturing and supply chain in China could increase competition from domestic equipment manufacturers in China. There can be no assurance that we will continue to compete successfully in the future.
Patents and Licenses
Our policy is to seek patents on inventions relating to new or enhanced products and processes developed as part of our ongoing research, engineering, manufacturing, and support activities. We currently hold a number of U.S. and foreign patents and applications covering various aspects of our products and processes. Our patents, which cover material aspects of our past and present core products, have current durations ranging from approximately one to twenty years. We believe that, although the patents we own and may obtain in the future will be of value, they alone will not determine our success. Our success depends principally upon our research and development, engineering, marketing, support, and delivery skills. However, in the absence of patent protection, we may be vulnerable to competitors who attempt to imitate our products, manufacturing techniques, and processes and may be more limited in our ability to exclude competitors than would otherwise be the case. In addition, other companies and inventors may receive patents that contain claims applicable to our products and processes. The sale of products covered by patents of others could require licenses that may not be available on terms acceptable to us, or at all. For further discussion of legal matters, see Item 3, “Legal Proceedings,” of this report.
Human Capital
We endeavor to be a great place to work globally by investing in a multi-faceted strategy that is rooted in building an inclusive and diverse workplace. To support our employees, we tailor our programs to meet the unique cultural needs and priorities within different regions around the world.
As of August 22, 2022, we had approximately 17,700 regular full-time employees, of which over 26% were engaged in research and development. Approximately 50% of our regular full-time employees are located in the United States, 44% in Asia, and 6% in Europe.
Inclusion and Diversity
To achieve their full potential, we believe it is important for every employee to feel valued, included, and empowered. We embrace inclusion and diversity (“I&D”) and proactively create opportunities to attract, retain, develop, and reward our employees. I&D is one of our strategic focus areas for the company. The three core pillars of our strategy include fostering inclusion, increasing diversity, and sharing our progress. We employ an executive leader of I&D who is responsible for driving our I&D strategy, building partnerships, and aligning with best practices.
Employment, Recruitment and Development
Our talented people are what makes our success possible. Many of our recruitment efforts are carried out through partnerships with key universities. In fact, many of our senior executives began their careers with us right out of college, demonstrating that programs that recruit university students have the potential to contribute to our leadership pipeline. To tap into the best and brightest students, we prioritize core initiatives including an internship program, new college graduate rotation program, campus events, and thesis awards and scholarships. We accelerate employee development, broaden career opportunities, and expand professional networks for employees through our mentorship, coaching, and rotation programs. Additionally, we offer leadership development programs which are designed to scale leadership across our business by guiding managers to motivate, inspire, and lead employees through change.
Employee Engagement
Employee engagement (i.e. satisfaction) and voice are critical to Lam’s culture. We conduct a global survey at a regular cadence to gather input from employees on culture, I&D, career opportunity, and manager effectiveness. We also solicit employee feedback through in-person and online employee forums, engagement sessions, all-employee meetings, conversations with
managers, and our Human Resource Support and Employee Relations programs.
Total Rewards
Our Total Rewards program incorporates a comprehensive compensation and benefits package aimed at supporting employees’ financial, physical, and mental well-being. We conduct an annual review of salaries and benefits packages using third-party benchmarking surveys to ensure that our offerings are aligned with the marketplace and attractive to top talent. We offer our employees a competitive 401(k) benefit, an employee stock purchase plan, and annual cash bonuses. Stock awards are offered to executives and select employees.
We recognize the importance of time away from work for personal reasons, and we offer annual paid holidays and time off. Additionally, several financial benefits were added to support our employees through the pandemic, including, but not limited to, pay
Lam Research Corporation 2022 10-K 10
continuity for those affected by closures, expanded medical and family care leave options for employees with COVID-19 related absences, and funding for home office provisions.
Employee Health and Safety, Pandemic Response
Prioritizing the health, safety, and well-being of our employees is critical to our ongoing success. We invest in education, awareness, monitoring, and prevention programs to help recognize and control safety hazards. Our goal is to apply our environmental health and safety (“EHS”) policies, programs, and response plans to anywhere we operate and to extend them to anyone who works on our sites with the intent to provide a safe environment during both routine and extraordinary circumstances. People managers in field support, manufacturing, R&D, warehouse, and logistics operations undergo formal safety leadership training biannually to enhance their skills in safety management and communication. We screen contractors’ safety performance and require contractor compliance with specified safety standards.
We monitor our safety performance at the enterprise, regional, and site levels. By using our global incident tracking system, our corporate EHS team can assess and monitor safety trends to report to business units and executive leadership as a part of quarterly reviews. We maintain multi-site certifications for ISO 45001, the globally recognized standard for occupational health and safety management systems.
We have taken a holistic approach in response to the COVID-19 pandemic, safeguarding our employees and caring for our communities by implementing strict procedures consistent with medical guidelines and best practices for the health and safety of on-site workers; enabling staff to work remotely; and providing enhanced employee benefits to support physical and mental health.
Information about our Executive Officers
As of August 22, 2022, the executive officers of Lam Research were as follows:
| Name | Age | Title | ||||||||||||
| Timothy M. Archer | 55 | President and Chief Executive Officer | ||||||||||||
| Douglas R. Bettinger | 55 | Executive Vice President, Chief Financial Officer, and Chief Accounting Officer | ||||||||||||
| Richard A. Gottscho | 70 | Executive Vice President, Chief Technology Officer | ||||||||||||
| Patrick J. Lord | 56 | Executive Vice President, CSBG and Global Operations | ||||||||||||
| Ava M. Hahn | 49 | Senior Vice President, Chief Legal Officer and Secretary | ||||||||||||
| Scott G. Meikle | 60 | Senior Vice President, Global Customer Operations | ||||||||||||
| Vahid Vahedi | 56 | Senior Vice President and General Manager, Etch Business Unit | ||||||||||||
| Seshasayee (Sesha) Varadarajan | 47 | Senior Vice President and General Manager, Deposition Business Unit | ||||||||||||
Timothy M. Archer has been our president and chief executive officer since December 2018. Prior to this, he served as our president and chief operating officer, from January 2018 to November 2018. Mr. Archer joined us in June 2012 as our executive vice president, chief operating officer. Prior to joining us, he spent 18 years at Novellus Systems, Inc., (“Novellus”) in various technology development and business leadership roles, including most recently as chief operating officer from January 2011 to June 2012; executive vice president of Worldwide Sales, Marketing, and Customer Satisfaction from September 2009 to January 2011; and executive vice president of the PECVD and Electrofill Business Units from November 2008 to September 2009. His tenure at Novellus also included assignments as senior director of technology for Novellus Systems Japan from 1999 to 2001 and senior director of technology for the Electrofill Business Unit from April 2001 to April 2002. He started his career in 1989 at Tektronix, where he was responsible for process development for high-speed bipolar ICs. Mr. Archer currently serves on the International Board of Directors for SEMI, the global industry association representing the electronics manufacturing and design supply chain. From 2020 to 2022, Mr. Archer served as chairman of the board for the National GEM Consortium, a nonprofit organization that is dedicated to increasing the participation of underrepresented groups at the master’s and doctoral levels in engineering and science. Mr. Archer completed the Program for Management Development at the Harvard Graduate School of Business and earned a B.S. degree in applied physics from the California Institute of Technology.
Douglas R. Bettinger is our executive vice president, chief financial officer, and chief accounting officer with responsibility for Finance, Tax, Treasury, Information Technology, and Investor Relations. Prior to joining the Company in 2013, Mr. Bettinger served as senior vice president and chief financial officer of Avago Technologies from 2008 to 2013. From 2007 to 2008, he served as vice president of Finance and corporate controller at Xilinx, Inc., and from 2004 to 2007, he was chief financial officer at 24/7 Customer, a privately held company. Mr. Bettinger worked at Intel Corporation from 1993 to 2004, where he held several senior-level finance positions, including corporate planning and reporting controller and Malaysia site operations controller. Mr. Bettinger currently serves on the SEMI Board of Industry Leaders and the Industrial Advisory Board of the University of Wisconsin School of Engineering. Mr. Bettinger earned an M.B.A. degree in finance from the University of Michigan and a B.S. degree in economics from the University of Wisconsin in Madison.
Richard A. Gottscho is our executive vice president, chief technology officer, a position he has held since May 2017. Dr. Gottscho previously served as executive vice president, Global Products Group beginning in August 2010; and group vice president and
Lam Research Corporation 2022 10-K 11
general manager, Etch Businesses beginning in March 2007**.** He joined us in January 1996 and has held various director and vice president roles spanning across deposition, etch, and clean products. Prior to joining us, he was a member of Bell Laboratories for 15 years, where he headed research departments in electronics materials, electronics packaging, and flat panel displays. In 2016, Dr. Gottscho was elected to the U.S. National Academy of Engineering; and in 2020, he was named a semiconductor all-star by VLSI Research. He is the recipient of many awards, including the American Vacuum Society’s Peter Mark Memorial Award, the Plasma Science and Technology Division Prize, the Dry Process Symposium Nishizawa Award, and the Tegal Thinker Award. He is a fellow of the American Physical and American Vacuum Societies. He has authored numerous papers, patents, and lectures, and has served on editorial boards of peer-reviewed technical publications and program committees for major conferences in plasma science and engineering. He served as vice-chair of a National Research Council study on plasma science. Dr. Gottscho earned Ph.D. and B.S. degrees in physical chemistry from the Massachusetts Institute of Technology and Pennsylvania State University, respectively.
Patrick J. Lord is our executive vice president of CSBG and Global Operations, a position he has held since September 2020. Dr. Lord was senior vice president and general manager of CSBG from December 2016 to September 2020. Prior to that , Dr. Lord held the position of group vice president and deputy general manager of the Global Products Group from September 2013 to December 2016. He served as the head of the Direct Metals, GapFill, Surface Integrity Group, and Integrated Metals (“DGSI”) Business Units between June 2012 and September 2013. Prior to our acquisition of Novellus in June 2012, Dr. Lord was senior vice president and general manager of the DGSI Business Units at Novellus. Additionally, Dr. Lord held the position of senior vice president of Business Development and Strategic Planning. He joined Novellus in 2001 and held a number of other positions, including senior vice president and general manager of the CMP Business Unit, senior director of Business Development, senior director of Strategic Marketing, and acting vice president of Corporate Marketing. Before joining Novellus, Dr. Lord spent six years at KLA-Tencor in various product marketing and management roles. He earned his Ph.D., M.S., and B.S. degrees in mechanical engineering from the Massachusetts Institute of Technology.
Ava M. Hahn is our senior vice president, chief legal officer. She joined us in January 2020 and is responsible for global legal matters, ethics and compliance, and government affairs. Prior to joining us, Ms. Hahn served as executive vice president, chief compliance officer, general counsel and secretary of CA Technologies, an enterprise software company, from February 2019 to November 2019 (until its acquisition by Broadcom Corp.), general counsel and secretary of Aruba Networks from April 2013 to June 2016 (until its acquisition by Hewlett Packard Enterprise), general counsel and secretary of ShoreTel, Inc. from 2007 to 2013, and general counsel and secretary of Genesis Microchip from 2002 to 2007. Ms. Hahn also served as general counsel of venture capital firms Kleiner Perkins and Felicis Ventures. She started her career at the law firm of Wilson Sonsini Goodrich & Rosati, where she practiced corporate and securities law. Ms. Hahn earned a J.D. from Columbia Law School and a B.A. in history from the University of California at Berkeley.
Scott G. Meikle is our senior vice president of Global Customer Operations, a position he has held since September 2017. Before joining us, he was an independent consultant for a year and director, special projects at Micron Technology, Inc. for seven months. Prior to that time, he spent over five and a half years at Inotera Memories, Inc., most recently as its president from August 2012 to December 2015. Dr. Meikle started his career in process R&D and advanced to various leadership roles in business operations across multiple geographies for Micron Technology, and has over 25 years of experience in the memory devices sector of the semiconductor industry. He earned his Ph.D. and M. Eng. degrees in engineering physics from Shizuoka University and McMaster University, respectively, and a B.S. degree in physics from the University of Calgary.
Vahid Vahedi is our senior vice president and general manager of the Etch Business Unit, a position he has held since February 2018. Prior to that time, he was group vice president of the Etch product group since March 2012. Previously, he served as vice president of Etch Business Product Management and Marketing, vice president of Dielectric Etch, vice president of Conductor and 3DIC Etch, and director of Conductor Etch Technology Development. He joined us in 1995. He earned his Ph.D., M.S., and B.S. degrees in electrical engineering and computer science from the University of California at Berkeley.
Sesha Varadarajan is our senior vice president and general manager of the Deposition Business Unit, a position he has held since February 2018. Prior that time, he was group vice president of the Deposition product group since September 2013. Previously, he served as the head of the PECVD/Electrofill Business Unit between June 2012 and September 2013. Prior to our acquisition of Novellus in June 2012, Mr. Varadarajan was senior vice president and general manager of Novellus’ PECVD and Electrofill Business Units. He joined Novellus in 1999 as a process engineer with the Electrofill Business Unit and held various roles in that business unit before being appointed director of technology in 2004. Between 2006 and 2008, he worked in the PECVD Business Unit, initially as director of technology, until being promoted to product general manager. In 2009, he returned to the Electrofill Business Unit as vice president and general manager. In mid-2011, he was promoted to senior vice president and general manager, where he was also responsible for the PECVD Business Unit. Mr. Varadarajan earned an M.S. degree in manufacturing engineering and material science from Boston University and a B.S. degree in mechanical engineering from the University of Mysore.
Item 1A. Risk Factors
In addition to the other information in this Annual Report on Form 10-K (“2022 Form 10-K”), the following risk factors should be carefully considered in evaluating us and our business because such factors may significantly impact our business, operating results, and financial condition. Many of the following risk factors have been, and could be further, exacerbated by the COVID-19 pandemic and any worsening of the global business and economic environment as a result. As a result of these risk factors, as well as other
Lam Research Corporation 2022 10-K 12
risks discussed in our other SEC filings, our actual results could differ materially from those projected in any forward-looking statements. No priority or significance is intended by, nor should be attached to, the order in which the risk factors appear.
INDUSTRY AND CUSTOMER RISKS
The Semiconductor Capital Equipment Industry Is Subject to Variability and Periods of Rapid Growth or Decline; We Therefore Face Risks Related to Our Strategic Resource Allocation Decisions
The semiconductor capital equipment industry has historically been characterized by rapid changes in demand. The industry environment has moved toward being more characterized by variability across segments and customers, accentuated by consolidation within the industry. Variability in our customers’ business plans may lead to changes in demand for our equipment and services, which could negatively impact our results. The variability in our customers’ investments during any particular period is dependent on several factors, including but not limited to electronics demand, economic conditions (both general and in the semiconductor and electronics industries), industry supply and demand, prices for semiconductors, and our customers’ ability to develop and manufacture increasingly complex and costly semiconductor devices. The changes in demand may require our management to adjust spending and other resources allocated to operating activities.
During periods of rapid growth or decline in demand for our products and services, we face significant challenges in maintaining adequate financial and business controls, management processes, information systems, and procedures for training, assimilating, and managing our workforce, and in appropriately sizing our supply chain infrastructure and facilities, work force, and other components of our business on a timely basis. If we do not adequately meet these challenges during periods of increasing or declining demand, our gross margins and earnings may be negatively impacted. For example, the COVID-19 pandemic has impacted and could further impact our ability to meet the demand for our products due to production, sourcing, logistics and other challenges resulting from quarantines, shelter in place or “stay at home” orders, facility closures, workforce challenges, and travel and logistics restrictions in connection with the pandemic.
We continuously reassess our strategic resource allocation choices in response to the changing business environment. If we do not adequately adapt to the changing business environment, we may lack the infrastructure and resources to scale up our business to meet customer expectations and compete successfully during a period of growth, or we may expand our capacity and resources too rapidly and/or beyond what is appropriate for the actual demand environment, resulting in excess fixed costs.
Especially during transitional periods, resource allocation decisions can have a significant impact on our future performance, particularly if we have not accurately anticipated industry changes. Our success will depend, to a significant extent, on the ability of our executive officers and other members of our senior management to identify and respond to these challenges effectively.
Future Declines in the Semiconductor Industry, and the Overall World Economic Conditions on Which It Is Significantly Dependent, Could Have a Material Adverse Impact on Our Results of Operations and Financial Condition
Our business depends on the capital equipment expenditures of semiconductor manufacturers, which in turn depend on the current and anticipated market demand for integrated circuits. With the consolidation of customers within the industry, the semiconductor capital equipment market may experience rapid changes in demand driven both by changes in the market generally and the plans and requirements of particular customers. The economic, political, and business conditions occurring nationally, globally, or in any of our key sales regions, which are often unpredictable, have historically impacted customer demand for our products and normal commercial relationships with our customers, suppliers, and creditors. Additionally, in times of economic uncertainty, our customers’ budgets for our products, or their ability to access credit to purchase them, could be adversely affected. This would limit their ability to purchase our products and services. As a result, changing economic, political or business conditions can cause material adverse changes to our results of operations and financial condition, including but not limited to:
-
a decline in demand for our products or services;
-
an increase in reserves on accounts receivable due to our customers’ inability to pay us;
-
an increase in reserves on inventory balances due to excess or obsolete inventory as a result of our inability to sell such inventory;
-
valuation allowances on deferred tax assets;
-
restructuring charges;
-
asset impairments including the potential impairment of goodwill and other intangible assets;
-
a decline in the value of our investments;
-
exposure to claims from our suppliers for payment on inventory that is ordered in anticipation of customer purchases that do not come to fruition;
-
a decline in the value of certain facilities we lease to less than our residual value guarantee with the lessor; and
-
challenges maintaining reliable and uninterrupted sources of supply.
Fluctuating levels of investment by semiconductor manufacturers may materially affect our aggregate shipments, revenues, operating results, and earnings. Where appropriate, we will attempt to respond to these fluctuations with cost management programs aimed at aligning our expenditures with anticipated revenue streams, which sometimes result in restructuring charges. Even during periods of
Lam Research Corporation 2022 10-K 13
reduced revenues, we must continue to invest in R&D and maintain extensive ongoing worldwide customer service and support capabilities to remain competitive, which may temporarily harm our profitability and other financial results.
We Have a Limited Number of Key Customers
Sales to a limited number of large customers constitute a significant portion of our overall revenue, shipments, cash flows, collections, and profitability. As a result, the actions of even one customer may subject us to variability in those areas that is difficult to predict. In addition, large customers may be able to negotiate requirements that result in decreased pricing, increased costs, and/or lower margins for us; compliance with specific environmental, social, and corporate governance standards; and limitations on our ability to share technology with others. Similarly, significant portions of our credit risk may, at any given time, be concentrated among a limited number of customers so that the failure of even one of these key customers to pay its obligations to us could significantly impact our financial results.
We Face a Challenging and Complex Competitive Environment
We face significant competition from multiple competitors, and with increased consolidation efforts in our industry, as well as the emergence and strengthening of new, regional competitors, we may face increasing competitive pressures. Other companies continue to develop systems and/or acquire businesses and products that are competitive to our
Showing the first 8K of 74K characters. Open the full section
Item 1B. Unresolved Staff Comments
None.
Item 2. Properties
Our executive offices and principal operating and R&D facilities are located in Fremont and Livermore, California; Tualatin, Oregon; Yongin, Gyeonggi Province, Korea; and Villach, Austria. In addition, we lease or own properties for our service, technical support, and sales personnel throughout the United States, China, Europe, India, Japan, Korea, Southeast Asia, and Taiwan and lease or own manufacturing facilities located in California, Ohio, Oregon, Austria, Korea, Malaysia, and Taiwan. In July 2021, our new advanced technology production facility in Malaysia began production. The Company owns two properties in Fremont, as well as the majority of the Tualatin facilities. The majority of the Fremont and Livermore facilities are held under finance leases expiring in September 2027. Our Fremont, Livermore, and Villach leases include options to renew or purchase the facilities. Our facilities lease obligations are subject to periodic increases. We believe that our existing facilities are well-maintained and in good operating condition.
Item 3. Legal Proceedings
Please refer to the subsection entities “Legal Proceedings” within Note 17: Commitments and Contingencies to our Consolidated Financial Statements included in Part II, Item 8 of this 2022 Form 10-K.
Item 4. Mine Safety Disclosures
Not applicable.
Lam Research Corporation 2022 10-K 24
PART II
Item 5. Market for Registrant’s Common Equity, Related Stockholder Matters and Issuer Purchases of Equity Securities
Stock Information
Our Common Stock is traded on the Nasdaq Global Select MarketSM under the symbol “LRCX.” As of August 22, 2022, we had 462 stockholders of record.
Dividends
Our Board of Directors has declared quarterly dividends since April 2014. Our intent to continue to pay quarterly dividends is subject to capital availability and periodic determinations by our Board of Directors that cash dividends are in the best interest of our stockholders and are in compliance with all laws and agreements applicable to the declaration and payment of cash dividends by us. During fiscal year 2022, our quarterly dividend declared was $1.50 per share.
Repurchases of Company Shares
In May 2022, the Board of Directors authorized management to repurchase up to an additional $5.0 billion of Common Stock; this authorization supplements the remaining balance from any prior authorization. These repurchases can be conducted on the open market or as private purchases and may include the use of derivative contracts with large financial institutions, in all cases subject to compliance with applicable law. This repurchase program has no termination date and may be suspended or discontinued at any time.
Accelerated Share Repurchase Agreements
On June 2, 2022, we entered into an accelerated share repurchase agreement (the "June 2022 ASR") with two financial institutions to repurchase a total of $500 million of Common Stock. We took an initial delivery of approximately 717 thousand shares, which represented 75% of the prepayment amount divided by our closing stock price on June 2, 2022. The total number of shares received under the June 2022 ASR will be based upon the average daily volume weighted average price of our Common Stock during the repurchase period, less an agreed upon discount. Final settlement of the June 2022 ASR will occur between August 18, 2022 and November 4, 2022.
On February 15, 2022, we entered into an accelerated share repurchase agreement (the "February 2022 ASR") with two financial institutions to repurchase a total of $600 million of Common Stock. We took an initial delivery of approximately 758 thousand shares, which represented 75% of the prepayment amount divided by our closing stock price on February 15, 2022. The total number of shares received under the February 2022 ASR was based upon the average daily volume weighted average price of our Common Stock during the repurchase period, less an agreed upon discount. Final settlement of the February 2022 ASR occurred in May 2022, resulting in the receipt of approximately 438 thousand additional shares, which yielded a weighted-average share price of $502.06 for the transaction period.
On August 31, 2021, we entered into an accelerated share repurchase agreement (the “August 2021 ASR") with two financial institutions to repurchase a total of $650 million of Common Stock. We took an initial delivery of approximately 806 thousand shares, which represented 75% of the prepayment amount divided by our closing stock price on August 31, 2021. The total number of shares received under the August 2021 ASR was based upon the average daily volume weighted average price of our Common Stock during the repurchase period, less an agreed upon discount. Final settlement of the August 2021 ASR occurred in January 2022, resulting in the receipt of approximately 265 thousand additional shares, which yielded a weighted-average share price of $606.71 for the transaction period.
Lam Research Corporation 2022 10-K 25
Share repurchases, including those under the repurchase program, were as follows:
| Period | Total Number of Shares Repurchased (1) | Average Price Paid per Share**(2)** | Total Number of Shares Purchased as Part of Publicly Announced Plans or Programs | Amount Available Under Repurchase Program | |||||||||||||||||||
| (in thousands, except per share data) | |||||||||||||||||||||||
| Available balance as of June 27, 2021 | $ | 4,222,220 | |||||||||||||||||||||
| Quarter ended September 26, 2021 | 1,737 | $ | 608.89 | 1,725 | 3,012,476 | ||||||||||||||||||
| Quarter ended December 26, 2021 | 685 | $ | 634.51 | 677 | 2,582,493 | ||||||||||||||||||
| Quarter ended March 27, 2022 | 2,231 | $ | 597.66 | 2,007 | 1,382,287 | ||||||||||||||||||
| March 28, 2022 - April 24, 2022 | 3 | $ | 482.67 | — | 1,382,287 | ||||||||||||||||||
| Board authorization, $5.0 billion, May 2022 | — | $ | — | — | 6,382,287 | ||||||||||||||||||
| April 25, 2022 - May 22, 2022 | 903 | $ | 470.86 | 900 | 6,164,869 | ||||||||||||||||||
| May 23, 2022 - June 26, 2022 | 1,015 | $ | 507.47 | 1,012 | 5,514,636 | ||||||||||||||||||
| Total | 6,574 | $ | 485.14 | (3) | 6,321 | $ | 5,514,636 | ||||||||||||||||
(1)During the fiscal year ended June 26, 2022, we acquired 253 thousand shares at a total cost of $138.1 million which we withheld through net share settlements to cover minimum tax withholding obligations upon the vesting of restricted stock unit awards granted under our equity compensation plans. The shares retained by us through these net share settlements are not a part of the Board-authorized repurchase program but instead are authorized under our equity compensation plan.
(2)Average price paid per share excludes the effect of accelerated share repurchases. See additional disclosure above regarding our accelerated share repurchase activity during the fiscal year.
(3)Average price paid per share presented is for the quarter ended June 26, 2022.
Lam Research Corporation 2022 10-K 26
Cumulative Five-Year Return
The graph below compares Lam Research Corporation’s cumulative five-year total shareholder return on Common Stock with the cumulative total returns of the Philadelphia Semiconductor Sector Total Return Index, the Nasdaq Composite Total Return index, and the Standard & Poor’s (“S&P”) 500 (TR) index. The graph tracks the performance of a $100 investment in our Common Stock and in each of the indices (with the reinvestment of all dividends) for the five years ended June 26, 2022.
| COMPARISON OF FIVE-YEAR CUMULATIVE TOTAL RETURN* | |||||||||||
| Among Lam Research Corporation, the Philadelphia Semiconductor Sector Total Return Index, the Nasdaq Composite Total Return Index, and the S&P 500 (TR) Index. |
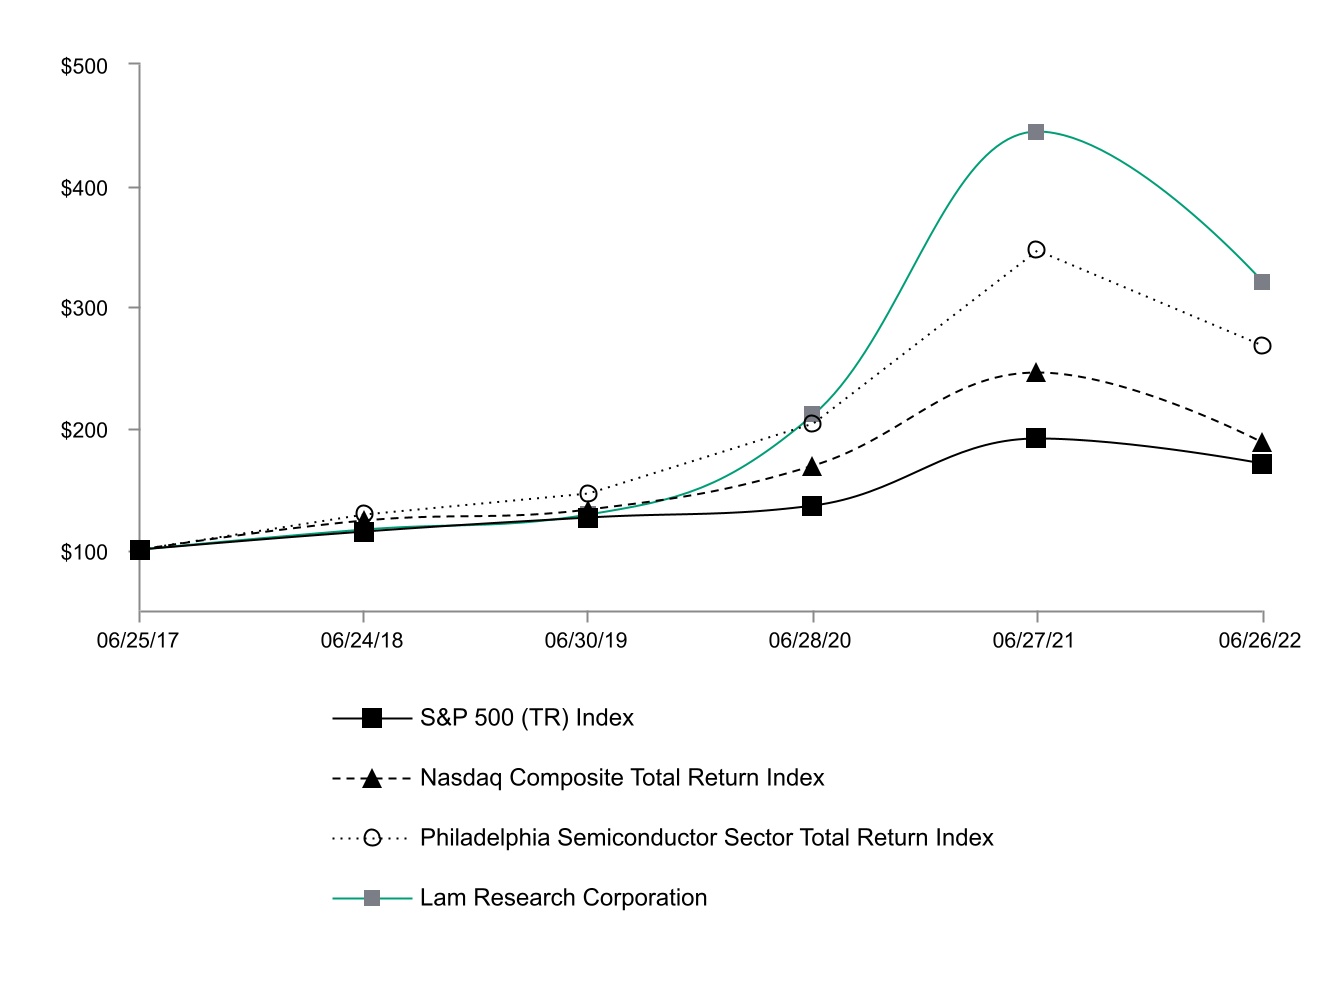
*$100 invested on June 25, 2017 in stock or June 30, 2017 in index, including reinvestment of dividends. Indexes calculated on month-end basis.
Copyright © 2022 Standard & Poor’s, a division of S&P Global. All rights reserved.
| June 25, 2017 | June 24, 2018 | June 30, 2019 | June 28, 2020 | June 27, 2021 | June 26, 2022 | ||||||||||||||||||||||||||||||
| Lam Research Corporation | $ | 100.00 | $ | 116.63 | $ | 128.74 | $ | 211.10 | $ | 444.69 | $ | 321.08 | |||||||||||||||||||||||
| Philadelphia Semiconductor Sector Total Return Index | $ | 100.00 | $ | 129.11 | $ | 146.29 | $ | 203.84 | $ | 346.16 | $ | 267.91 | |||||||||||||||||||||||
| Nasdaq Composite Total Return Index | $ | 100.00 | $ | 123.60 | $ | 133.22 | $ | 169.11 | $ | 245.60 | $ | 188.07 | |||||||||||||||||||||||
| S&P 500 (TR) Index | $ | 100.00 | $ | 114.37 | $ | 126.29 | $ | 135.77 | $ | 191.15 | $ | 170.86 |
Lam Research Corporation 2022 10-K 27
Item 6. [Reserved]
Item 7. Management’s Discussion and Analysis of Financial Condition and Results of Operations
The following discussion of our financial condition and results of operations contains forward-looking statements, which are subject to risks, uncertainties, and changes in condition, significance, value, and effect. Our actual results could differ materially from those anticipated in the forward-looking statements as a result of certain factors, including but not limited to those discussed in “Risk Factors” and elsewhere in this 2022 Form 10-K and other documents we file from time to time with the Securities and Exchange Commission. (See “Cautionary Statement Regarding Forward-Looking Statements” in Part I of this 2022 Form 10-K.)
Management’s Discussion and Analysis of Financial Condition and Results of Operations (“MD&A”) provides a description of our results of operations and should be read in conjunction with our Consolidated Financial Statements and accompanying Notes to Consolidated Financial Statements included in Part II, Item 8 of this 2022 Form 10-K. MD&A consists of the following sections:
Executive Summary provides a summary of the key highlights of our results of operations and our management’s assessment of material trends and uncertainties relevant to our business.
Results of Operations provides an analysis of operating results.
Critical Accounting Policies and Estimates discusses accounting policies that reflect the more significant judgments and estimates used in the preparation of our Consolidated Financial Statements.
Liquidity and Capital Resources provides an analysis of cash flows, contractual obligations, and financial position.
Executive Summary
Lam Research Corporation is a global supplier of innovative wafer fabrication equipment and services to the semiconductor industry. We have built a strong global presence with core competencies in areas like nanoscale applications enablement, chemistry, plasma and fluidics, advanced systems engineering and a broad range of operational disciplines. Our products and services are designed to help our customers build smaller, and better performing devices that are used in a variety of electronic products, including mobile phones, personal computers, servers, wearables, automotive vehicles, and data storage devices.
Our customer base includes leading semiconductor memory, foundry, and integrated device manufacturers that make products such as NVM, DRAM, and logic devices. Their continued success is part of our commitment to driving semiconductor breakthroughs that define the next generation. Our core technical competency is integrating hardware, process, materials, software, and process control enabling results on the wafer.
Semiconductor manufacturing, our customers’ business, involves the complete fabrication of multiple dies or integrated circuits on a wafer. This involves the repetition of a set of core processes and can require hundreds of individual steps. Fabricating these devices requires highly sophisticated process technologies to integrate an increasing array of new materials with precise control at the atomic scale. Along with meeting technical requirements, wafer processing equipment must deliver high productivity and be cost-effective.
Demand from cloud computing, the IoT, and other markets is driving the need for increasingly powerful and cost-efficient semiconductors. At the same time, there are growing technical challenges with traditional two-dimensional scaling. These trends are driving significant inflections in semiconductor manufacturing, such as the increasing importance of vertical scaling strategies like three-dimensional architecture as well as multiple patterning to enable shrinks.
We believe we are in a strong position with our leadership and expertise in deposition, etch, and clean to facilitate some of the most significant innovations in semiconductor device manufacturing. Our Customer Support Business Group provides products and services to maximize installed equipment performance, predictability and operational efficiency. Several factors create opportunity for sustainable differentiation for us: (i) our focus on research and development, with several on-going programs relating to sustaining engineering, product and process development, and concept and feasibility; (ii) our ability to effectively leverage cycles of learning from our broad installed base; (iii) our collaborative focus with semi-ecosystem partners; (iv) our ability to identify and invest in the breadth of our product portfolio to meet technology inflections; and (v) our focus on delivering our multi-product solutions with a goal to enhance the value of Lam’s solutions to our customers.
Wafer fabrication equipment spending was strong throughout the 2022 fiscal year driven by increasing device manufacturing complexity and the robust secular demand for semiconductors for NAND, DRAM, and foundry logic markets. Over the longer term, we believe that secular demand for semiconductors will continue to drive sustainable growth for our products and services, and that technology inflections in our industry, including 3D device scaling, multiple patterning, process flow, and advanced packaging chip integration, will lead to an increase in the served addressable market for our products and services in the deposition, etch, and clean businesses. During fiscal year 2022, customer demand remained solid; however, ongoing supply chain constraints broadened during the period and impacted our ability to fulfill demand. While we have seen improvements in both our operations and those of our suppliers, we expect supply shortages as well as inflationary cost pressures to persist in at least the near term. Risks and
Lam Research Corporation 2022 10-K 28
uncertainties related to the COVID-19 pandemic, broadening supply chain challenges, and inflationary pressures may continue to negatively impact our revenue and gross margin.
The following table summarizes certain key financial information for the periods indicated below:
| Year Ended | Change | ||||||||||||||||||||||||||||||||||||||||
| June 26, 2022 | June 27, 2021 | June 28, 2020 | FY22 vs. FY21 | FY21 vs. FY20 | |||||||||||||||||||||||||||||||||||||
| (in thousands, except per share data and percentages) | |||||||||||||||||||||||||||||||||||||||||
| Revenue | $ | 17,227,039 | $ | 14,626,150 | $ | 10,044,736 | $ | 2,600,889 | 17.8 | % | $ | 4,581,414 | 45.6 | % | |||||||||||||||||||||||||||
| Gross margin | $ | 7,871,807 | $ | 6,805,306 | $ | 4,608,693 | $ | 1,066,501 | 15.7 | % | $ | 2,196,613 | 47.7 | % | |||||||||||||||||||||||||||
| Gross margin as a percent of total revenue | 45.7 | % | 46.5 | % | 45.9 | % | (0.8)% | 0.6% | |||||||||||||||||||||||||||||||||
| Total operating expenses | $ | 2,489,985 | $ | 2,323,283 | $ | 1,934,891 | $ | 166,702 | 7.2 | % | $ | 388,392 | 20.1 | % | |||||||||||||||||||||||||||
| Net income | $ | 4,605,286 | $ | 3,908,458 | $ | 2,251,753 | $ | 696,828 | 17.8 | % | $ | 1,656,705 | 73.6 | % | |||||||||||||||||||||||||||
| Net income per diluted share | $ | 32.75 | $ | 26.90 | $ | 15.10 | $ | 5.85 | 21.7 | % | $ | 11.80 | 78.1 | % |
Fiscal year 2022 revenue increased over 17% compared to fiscal year 2021, reflecting continued strong customer demand for semiconductor equipment. Gross margin as a percentage of revenue decreased due to inflationary cost pressures that led to higher spending on material costs, freight and logistics, and labor-related expenses, as well as unfavorable customer and product mix, partially offset by decreased variable compensation. The increase in operating expenses in fiscal year 2022 compared to fiscal year 2021 was mainly driven by higher employee-related costs as a result of increased headcount, supplies expense, rent, repair and utilities expense, and outside services spending, partially offset by lower deferred compensation plan-related costs.
Fiscal year 2021 revenue increased approximately 46% compared to fiscal year 2020, reflecting stronger customer demand for semiconductor equipment. Gross margin as a percentage of revenue increased primarily due to customer and product mix, partially offset by higher costs incurred in freight and logistics as well as start-up expenses for our new Malaysia manufacturing facility. The increase in operating expenses in fiscal year 2021 compared to fiscal year 2020 was mainly driven by higher employee-related costs as a result of increased headcount and outsourcing services, deferred compensation plan-related costs, and supplies, partially offset by lower travel expenses and miscellaneous costs.
Our cash and cash equivalents, investments, and restricted cash and investments balances totaled approximately $3.9 billion as of June 26, 2022, compared to $6.0 billion as of June 27, 2021. Cash flow provided from operating activities was $3.1 billion for fiscal year 2022 compared to $3.6 billion for fiscal year 2021. Cash flow provided from operating activities in fiscal year 2022 was primarily used for $3.9 billion in treasury stock purchases, including net share settlement on employee stock-based compensation; $815 million in dividends paid to our stockholders; and $546 million of capital expenditures. These cash outflows were partially offset by $114 million of treasury stock reissuance and Common Stock issuance resulting from our employee equity-based compensation programs.
Results of Operations
Revenue
| Year Ended | |||||||||||||||||
| June 26, 2022 | June 27, 2021 | June 28, 2020 | |||||||||||||||
| Revenue (in millions) | $ | 17,227 | $ | 14,626 | $ | 10,045 | |||||||||||
| China | 31 | % | 35 | % | 31 | % | |||||||||||
| Korea | 23 | % | 27 | % | 24 | % | |||||||||||
| Taiwan | 17 | % | 14 | % | 19 | % | |||||||||||
| Japan | 9 | % | 9 | % | 9 | % | |||||||||||
| United States | 8 | % | 6 | % | 8 | % | |||||||||||
| Southeast Asia | 8 | % | 6 | % | 6 | % | |||||||||||
| Europe | 4 | % | 3 | % | 3 | % |
Revenue increased in fiscal year 2022 compared to fiscal years 2021 and 2020, primarily due to the increased investment by our customers in semiconductor capital equipment as well as higher revenue from our Customer Support Business Group for spares, services, upgrades and mature node equipment. The overall Asia region continued to account for a majority of our revenues as a substantial amount of the worldwide capacity investments for semiconductor manufacturing continued to occur in this region.
The deferred revenue balance was $2.2 billion as of June 26, 2022 compared to $1.1 billion as of June 27, 2021, driven by additional deferrals related to tools pending full delivery and future servicing of our existing installed base.
Lam Research Corporation 2022 10-K 29
The following table presents our revenue disaggregated between system and customer support-related revenue:
| Year Ended | |||||||||||||||||
| June 26, 2022 | June 27, 2021 | June 28, 2020 | |||||||||||||||
| (in thousands) | |||||||||||||||||
| Systems Revenue | $ | 11,322,271 | $ | 9,764,845 | $ | 6,625,130 | |||||||||||
| Customer support-related revenue and other | 5,904,768 | 4,861,305 | 3,419,606 | ||||||||||||||
| $ | 17,227,039 | $ | 14,626,150 | $ | 10,044,736 | ||||||||||||
Please refer to Note 4: Revenue of our Consolidated Financial Statements in Part II, Item 8 of this 2022 Form 10-K for additional information regarding the composition of the two categories into which revenue has been disaggregated.
The percentage of leading- and non-leading-edge equipment and upgrade revenue from each of the markets we serve was as follows:
| Year Ended | |||||||||||||||||
| June 26, 2022 | June 27, 2021 | June 28, 2020 | |||||||||||||||
| Memory | 60 | % | 61 | % | 58 | % | |||||||||||
| Foundry | 26 | % | 32 | % | 31 | % | |||||||||||
| Logic/integrated device manufacturing | 14 | % | 7 | % | 11 | % |
Gross Margin
| Year Ended | Change | ||||||||||||||||||||||||||||||||||||||||
| June 26, 2022 | June 27, 2021 | June 28, 2020 | FY22 vs. FY21 | FY21 vs. FY20 | |||||||||||||||||||||||||||||||||||||
| (in thousands, except percentages) | |||||||||||||||||||||||||||||||||||||||||
| Gross margin | $ | 7,871,807 | $ | 6,805,306 | $ | 4,608,693 | $ | 1,066,501 | 15.7 | % | $ | 2,196,613 | 47.7 | % | |||||||||||||||||||||||||||
| Percent of revenue | 45.7 | % | 46.5 | % | 45.9 | % | (0.8)% | 0.6% |
The decrease in gross margin as a percentage of revenue for fiscal year 2022 compared to fiscal year 2021 was due to inflationary cost pressures that led to higher spending on material costs, freight and logistics, and labor-related expenses, as well as unfavorable customer and product mix, partially offset by decreased variable compensation.
The increase in gross margin as a percentage of revenue for fiscal year 2021 compared to fiscal year 2020 was primarily related to customer and product mix, partially offset by increased spending on freight and logistics due in significant part to COVID-19 disruptions, start-up expenses for our Malaysia manufacturing facility, and deferred compensation plan-related costs.
Research and Development
| Year Ended | Change | ||||||||||||||||||||||||||||||||||||||||
| June 26, 2022 | June 27, 2021 | June 28, 2020 | FY22 vs. FY21 | FY21 vs. FY20 | |||||||||||||||||||||||||||||||||||||
| (in thousands, except percentages) | |||||||||||||||||||||||||||||||||||||||||
| Research & development | $ | 1,604,248 | $ | 1,493,408 | $ | 1,252,412 | $ | 110,840 | 7.4 | % | $ | 240,996 | 19.2 | % | |||||||||||||||||||||||||||
| Percent of revenue | 9.3 | % | 10.2 | % | 12.5 | % | (0.9)% | (2.3)% |
We continued to make significant R&D investments focused on leading-edge deposition, etch, clean, and other semiconductor manufacturing processes. The increase in R&D expense during fiscal year 2022 compared to fiscal year 2021 was mainly driven by an increase of $89 million in employee-related costs due in part to increased headcount and $43 million in spending for supplies, partially offset by a decrease of $44 million in deferred compensation plan-related costs.
The increase in R&D expense during fiscal year 2021 compared to fiscal year 2020 was mainly driven by an increase of $137 million in employee-related costs due in part to increased headcount, $49 million in outside service costs, $32 million in deferred compensation plan-related costs, and $27 million in spending for supplies
Lam Research Corporation 2022 10-K 30
Selling, General, and Administrative
| Year Ended | Change | ||||||||||||||||||||||||||||||||||||||||
| June 26, 2022 | June 27, 2021 | June 28, 2020 | FY22 vs. FY21 | FY21 vs. FY20 | |||||||||||||||||||||||||||||||||||||
| (in thousands, except percentages) | |||||||||||||||||||||||||||||||||||||||||
| Selling, general, and administrative ("SG&A") | $ | 885,737 | $ | 829,875 | $ | 682,479 | $ | 55,862 | 6.7 | % | $ | 147,396 | 21.6 | % | |||||||||||||||||||||||||||
| Percent of revenue | 5.1 | % | 5.7 | % | 6.8 | % | (0.6)% | (1.1)% |
The increase in SG&A expense during fiscal year 2022 compared to fiscal year 2021 was primarily driven by an increase of $28 million in outside service costs, $28 million in spending for rent, repair and utilities, and $26 million in employee-related costs due in part to increased headcount, partially offset by a decrease of $29 million in deferred compensation plan-related costs.
The increase in SG&A expense during fiscal year 2021 compared to fiscal year 2020 was primarily due to a $97 million increase in employee-related costs due in part to increased headcount, $37 million in outside service costs, and $21 million in deferred compensation plan-related costs, partially offset by a $9 million decrease in travel and entertainment costs.
Other Income (Expense), Net
Other income (expense), net, consisted of the following:
| Year Ended | Change | ||||||||||||||||||||||||||||||||||||||||
| June 26, 2022 | June 27, 2021 | June 28, 2020 | FY22 vs. FY21 | FY21 vs. FY20 | |||||||||||||||||||||||||||||||||||||
| (in thousands, except percentages) | |||||||||||||||||||||||||||||||||||||||||
| Interest income | $ | 15,209 | $ | 19,687 | $ | 85,433 | $ | (4,478) | (22.7) | % | $ | (65,746) | (77.0) | % | |||||||||||||||||||||||||||
| Interest expense | (184,759) | (208,597) | (177,440) | $ | 23,838 | (11.4) | % | $ | (31,157) | 17.6 | % | ||||||||||||||||||||||||||||||
| (Losses) gains on deferred compensation plan related assets, net | (38,053) | 61,838 | 5,999 | $ | (99,891) | (161.5) | % | $ | 55,839 | 930.8 | % | ||||||||||||||||||||||||||||||
| Foreign exchange (losses) gains, net | (723) | (6,962) | (3,317) | $ | 6,239 | (89.6) | % | $ | (3,645) | 109.9 | % | ||||||||||||||||||||||||||||||
| Other, net | 19,618 | 22,815 | (9,499) | $ | (3,197) | (14.0) | % | $ | 32,314 | (340.2) | % | ||||||||||||||||||||||||||||||
| $ | (188,708) | $ | (111,219) | $ | (98,824) | $ | (77,489) | 69.7 | % | $ | (12,395) | 12.5 | % | ||||||||||||||||||||||||||||
Interest income decreased in fiscal year 2022 compared to fiscal year 2021 as a result of lower cash balances. Interest income decreased in fiscal year 2021 compared to fiscal year 2020 as a result of lower yield.
Interest expense decreased in fiscal year 2022 compared to fiscal year 2021 primarily due to the payoff of $800 million of our notes in June 2021. Interest expense increased in fiscal year 2021 compared to fiscal year 2020 primarily due to the full-year impact of the issuance of $2.0 billion senior notes in fiscal year 2020.
The gains or losses on deferred compensation plan related assets, net in fiscal years 2022, 2021 and 2020 were driven by fluctuations in the fair market value of the underlying funds.
The variation in other, net for the fiscal year 2022 compared to fiscal years 2021 and 2020 was primarily driven by fluctuations in the fair market value of equity investments.
Income Tax Expense
Our provision for income taxes and effective tax rate for the periods indicated were as follows:
| Year Ended | Change | ||||||||||||||||||||||||||||||||||||||||
| June 26, 2022 | June 27, 2021 | June 28, 2020 | FY22 vs. FY21 | FY21 vs. FY20 | |||||||||||||||||||||||||||||||||||||
| (in thousands, except percentages) | |||||||||||||||||||||||||||||||||||||||||
| Income tax expense | $ | 587,828 | $ | 462,346 | $ | 323,225 | $ | 125,482 | 27.1 | % | $ | 139,121 | 43.0 | % | |||||||||||||||||||||||||||
| Effective tax rate | 11.3 | % | 10.6 | % | 12.6 | % | 0.7% | (2.0)% |
The increase in the effective tax rate in fiscal year 2022 as compared to fiscal year 2021 was primarily due to the change in level and proportion of income in higher and lower tax jurisdictions.
Lam Research Corporation 2022 10-K 31
The decrease in the effective tax rate in fiscal year 2021 as compared to fiscal year 2020 was primarily due to a cumulative income tax benefit reversal due to a court ruling in fiscal year 2020, as outlined below.
In November 2019, the U.S. Court of Appeals for the Ninth Circuit (“Ninth Circuit”) rejected the en banc appeal petitioned by Altera Corporation (“Altera”) in July 2019. In that quarter, we evaluated the impact of the decision and viewed the denial as an indication that Altera’s position of excluding stock-based compensation expense in an intercompany cost-sharing arrangement was unlikely to be sustained upon further litigation. As a result, we reversed $75 million of net tax assets associated with stock-based compensation benefits related to previous years in the Condensed Consolidated Financial Statements in the three months ended December 29, 2019 and we no longer reflected a net tax benefit within our financial statements related to excluding stock-based compensation from our intercompany cost-sharing arrangement. In February 2020, Altera petitioned the Supreme Court of the United States ("SCOTUS") to hear their case. In June 2020, the SCOTUS denied the petition.
International revenues account for a significant portion of our total revenues, such that a material portion of our pre-tax income is earned and taxed outside the United States. International pre-tax income is taxable in the United States at a lower effective tax rate than the federal statutory tax rate. Please refer to Note 7 of our Consolidated Financial Statements in Part II, Item 8 of this 2022 Form 10-K.
A provision enacted as part of the 2017 Tax Cuts & Jobs Act requires companies to capitalize research and experimental expenditures for tax purposes in tax years beginning after December 31, 2021 (our fiscal year 2023). If this provision is not repealed or deferred, we expect our fiscal year 2023 cash tax payments to increase significantly compared to our fiscal year 2022.
On August 16, 2022, the Inflation Reduction Act was signed into law. In general, the provisions of the IRA will be effective beginning with our fiscal year 2024, with certain exceptions. The IRA includes a new 15% corporate minimum tax. We are in the process of evaluating the potential impacts of the IRA. The impact on income taxes due to changes in legislation is required under the authoritative guidance of Accounting Standard Codification (“ASC”) 740, Income Taxes, to be recognized in the period in which the law is enacted. While we do not currently expect the IRA to have a material impact on our effective tax rate, our analysis is ongoing and incomplete, and it is possible that the IRA could have a material adverse effect on our tax liability. We will continue to monitor issuance of additional guidance.
Deferred Income Taxes
Deferred income taxes reflect the net tax effect of temporary differences between the carrying amounts of assets and liabilities for financial reporting purposes and the amounts used for income tax purposes, as well as the tax effect of carryforwards. Our gross deferred tax assets were $1,103 million and $772 million at the end of fiscal years 2022 and 2021, respectively. These gross deferred tax assets were offset by gross deferred tax liabilities of $234 million and $187 million and a valuation allowance representing our entire California deferred tax asset balance due to the single sales factor apportionment resulting in lower taxable income in California of $309 million and $277 million at the end of fiscal years 2022 and 2021, respectively. The change in gross deferred tax assets, gross deferred tax liabilities, and valuation allowance between fiscal year 2022 and 2021 is primarily due to increases in gross deferred tax assets for outside basis differences of foreign subsidiaries and tax credits and increases in gross deferred tax liabilities for capital assets.
We evaluate if the deferred tax assets are realizable on a quarterly basis and will continue to assess the need for changes in valuation allowances, if any.
Uncertain Tax Positions
We re-evaluate uncertain tax positions on a quarterly basis. This evaluation is based on factors including, but not limited to, changes in facts or circumstances, changes in tax law, effectively settled issues under audit, and new audit activity. Any change in recognition or measurement would result in the recognition of a tax benefit or an additional charge to the tax provision.
Critical Accounting Policies and Estimates
A critical accounting policy is defined as one that has both a material impact on our financial condition and results of operations and requires us to make difficult, complex and/or subjective judgments, often as a result of the need to make estimates about matters that are inherently uncertain. The preparation of financial statements in conformity with U.S. generally accepted accounting principles (“GAAP”) requires management to make certain judgments, estimates and assumptions that could affect the reported amounts of assets and liabilities at the date of the financial statements and the reported amounts of revenue and expenses during the reporting period. We base our estimates and assumptions on historical experience and on various other assumptions we believe to be applicable and evaluate them on an ongoing basis to ensure they remain reasonable under current conditions. Actual results could differ significantly from those estimates, which could have a material impact on our business, results of operations, and financial condition. Our critical accounting estimates include:
-
the recognition and valuation of revenue from arrangements with multiple performance obligations which impacts revenue;
-
the valuation of inventory, which impacts gross margin;
-
the valuation of warranty reserves, which impacts gross margin;
-
the recognition and measurement of current and deferred income taxes, including the measurement of uncertain tax positions, which impact our provision for income tax expenses; and
Lam Research Corporation 2022 10-K 32
- the valuation and recoverability of long-lived assets, which impacts gross margin and operating expenses when we record asset impairments or accelerate their depreciation or amortization.
We believe that the following critical accounting policies reflect the more significant judgments and estimates used in the preparation of our consolidated financial statements regarding the critical accounting estimates indicated above. See Note 2, “Summary of Significant Accounting Policies,” of our Consolidated Financial Statements in Part II, Item 8 of this 2022 Form 10-K for additional information regarding our accounting policies.
Revenue Recognition: We recognize revenue when promised goods or services are transferred to customers in an amount that reflects the consideration to which we expect to be entitled in exchange for those goods or services by following a five-step process, (1) identify the contract with a customer, (2) identify the performance obligations in the contract, (3) determine the transaction price, (4) allocate the transaction price to the performance obligations in the contract, and (5) recognize revenue when or as we satisfy a performance obligation, as further described below.
Identify the contract with a customer. We generally consider documentation of terms with an approved purchase order as a customer contract, provided that collection is considered probable, which is assessed based on the creditworthiness of the customer as determined by credit checks, payment histories, and/or other circumstances.
Identify the performance obligations in the contract. Performance obligations include sales of systems, spare parts, and services. In addition, our customer contracts contain provisions for installation and training services which have been deemed immaterial in the context of the contract.
Determine the transaction price. The transaction price for our contracts with customers consists of both fixed and variable consideration provided it is probable that a significant reversal of revenue will not occur when the uncertainty related to variable consideration is resolved. Fixed consideration includes amounts to be contractually billed to the customer while variable consideration includes estimates for discounts and credits for future usage which are based on contractual terms outlined in volume purchase agreements and other factors known at the time. We generally invoice customers at shipment and for professional services either as provided or upon meeting certain milestones. Customer invoices are generally due within 30 to 90 days after issuance. Our contracts with customers typically do not include significant financing components as the period between the transfer of performance obligations and timing of payment are generally within one year.
Allocate the transaction price to the performance obligations in the contract. For contracts that contain multiple performance obligations, we allocate the transaction price to the performance obligations in the contract on a relative standalone selling price basis. Standalone selling prices are based on multiple factors including, but not limited to historical discounting trends for products and services and pricing practices in different geographies.
Recognize revenue when or as we satisfy a performance obligation. Revenue for systems and spares are recognized at a point in time, which is generally upon shipment or delivery. Revenue from services is recognized over time as services are completed or ratably over the contractual period of generally one year or less.
Inventory Valuation: Our policy is to assess the valuation of all inventories including manufacturing raw materials, work-in-process, finished goods, and spare parts in each reporting period. Obsolete inventory or inventory in excess of management’s estimated usage requirement is written down to its estimated net realizable value if less than cost. Estimates of market value include but are not limited to management’s forecasts related to our future manufacturing schedules, customer demand, technological and/or market obsolescence, general semiconductor market conditions, and possible alternative uses. If future customer demand or market conditions are less favorable than our projections, additional inventory write-downs may be required and would be reflected in cost of goods sold in the period in which the revision is made.
Warranty: We record a provision for estimated warranty expenses to cost of sales for each system when we recognize revenue. We periodically monitor the performance and cost of warranty activities, if actual costs incurred are different than our estimates, we may recognize adjustments to provisions in the period in which those differences arise or are identified. We do not maintain general or unspecified reserves; all warranty reserves are related to specific systems.
Income Taxes: Deferred income taxes reflect the net tax effect of temporary differences between the carrying amount of assets and liabilities for financial reporting purposes and the amounts used for income tax purposes, as well as the tax effect of carryforwards. We record a valuation allowance to reduce our deferred tax assets to the amount that is more likely than not to be realized. Realization of our net deferred tax assets is dependent on future taxable income. We believe it is more likely than not that such assets will be realized; however, ultimate realization could be negatively impacted by market conditions and other variables not known or anticipated at this time. In the event that we determine that we will not be able to realize all or part of our net deferred tax assets, an adjustment will be charged to earnings in the period such determination is made. Likewise, if we later determine that it is more likely than not that the deferred tax assets will be realized, then the previously provided valuation allowance will be reversed.
We recognize the benefit from a tax position only if it is more likely than not that the position will be sustained upon audit based solely on the technical merits of the tax position. Our policy is to include interest and penalties related to uncertain tax positions as a component of income tax expense.
Lam Research Corporation 2022 10-K 33
Long-lived Assets: We review goodwill at least annually for impairment during the fourth quarter of each fiscal year and if certain events or indicators of impairment occur between annual impairment tests. The process of evaluating the potential impairment of goodwill requires significant judgment. When reviewing goodwill for impairment, we first perform a qualitative assessment to determine whether it is more likely than not that the fair value of a reporting unit is less than its carrying value. In performing a qualitative assessment, we consider business conditions and other factors including, but not limited to (i) adverse industry or economic trends, (ii) restructuring actions and lower projections that may impact future operating results, (iii) sustained decline in share price, and (iv) overall financial performance and other events affecting the reporting units. If we conclude that it is more likely than not that the fair value of a reporting unit is less than its carrying amount, then a quantitative impairment test is performed by estimating the fair value of the reporting unit and comparing it to its carrying value, including goodwill allocated to that reporting unit.
We determine the fair value of our reporting units by using an income approach. Under the income approach, we determine fair value based on estimated future cash flows of each reporting unit, discounted by an estimated weighted-average cost of capital, which reflects the overall level of inherent risk of a reporting unit and the rate of return an outside investor would expect to earn.
In estimating the fair value of a reporting unit, we make estimates and judgments about the future cash flows of our reporting units, including estimated growth rates and assumptions about the economic environment. Although our cash flow forecasts are based on assumptions that are consistent with the plans and estimates we are using to manage the underlying businesses, there is significant judgment involved in determining the cash flows attributable to a reporting unit. In addition, we make certain judgments about allocating shared assets to the estimated balance sheets of our reporting units. Changes in judgment on these assumptions and estimates could result in a goodwill impairment charge.
If after completing the quantitative assessment the carrying value of a reporting unit exceeds its fair value, we would record an impairment charge equal to the excess of the carrying value of the reporting unit over its fair value, up to the amount of the goodwill assigned to the reporting unit.
For other long-lived assets, we review them whenever events or changes in circumstances indicate the carrying value of an asset or asset group may not be recoverable. If such indicators are present, we determine whether the sum of the estimated undiscounted cash flows attributable to the assets is less than their carrying value. If the sum is less, we recognize an impairment loss based on the excess of the carrying amount of the assets over their respective fair values. Fair value is determined by discounted future cash flows, appraisals or other methods. We recognize an impairment charge to the extent the present value of anticipated net cash flows attributable to the asset is less than the asset’s carrying value. The fair value of the asset then becomes the asset’s new carrying value, which we depreciate over the remaining estimated useful life of the asset. Assets to be disposed of are reported at the lower of the carrying amount or fair value. In addition, for fully amortized intangible assets, we de-recognize the gross cost and accumulated amortization in the period we determine the intangible asset no longer enhances future cash flows.
Recent Accounting Pronouncements
For a description of recent accounting pronouncements, including the expected dates of adoption and estimated effects, if any, on our consolidated financial statements, see Note 3, “Recent Accounting Pronouncements,” of our Consolidated Financial Statements, included in Part II, Item 8 of this 2022 Form 10-K.
Liquidity and Capital Resources
Total gross cash, cash equivalents, investments, and restricted cash and investments balances were $3.9 billion at the end of fiscal year 2022 compared to $6.0 billion at the end of fiscal year 2021. This decrease was primarily due to Common Stock repurchases in connection with our stock repurchase program, dividends paid, and capital expenditures, partially offset by cash provided by operating activities.
Cash Flow from Operating Activities
Net cash provided by operating activities of $3.1 billion during fiscal year 2022 consisted of (in thousands):
| Net income | $ | 4,605,286 | |||
| Non-cash charges: | |||||
| Depreciation and amortization | 333,739 | ||||
| Deferred income taxes | (257,438) | ||||
| Equity-based compensation expense | 259,064 | ||||
| Changes in operating asset and liability accounts | (1,796,226) | ||||
| Other | (44,751) | ||||
| $ | 3,099,674 | ||||
Significant changes in operating asset and liability accounts, net of foreign exchange impact, included the following uses of cash: increases in accounts receivable of $1.3 billion, inventories of $1.4 billion, and prepaid expenses and other assets of $53 million; partially offset by the following sources of cash: increases in deferred profit of $605 million, accounts payable of $168 million, and accrued expenses and other liabilities of $123 million.
Lam Research Corporation 2022 10-K 34
Cash Flow from Investing Activities
Net cash provided by investing activities during fiscal year 2022 was $612 million, primarily consisting of net sales/maturities of available for sale securities of $1.2 billion, partially offset by capital expenditures of $546 million.
Cash Flow from Financing Activities
Net cash used for financing activities during fiscal year 2022 was $4.6 billion, primarily consisting of $3.9 billion in Common Stock repurchases, including net share settlement on employee stock-based compensation; and $815 million of dividends paid; partially offset by $114 million of stock issuance and treasury stock reissuances associated with our employee stock-based compensation plans.
Liquidity
Given that the semiconductor industry is highly competitive and has historically experienced rapid changes in demand, we believe that maintaining sufficient liquidity reserves is important to support sustaining levels of investment in R&D and capital infrastructure. Anticipated cash flows from operations based on our current business outlook, combined with our current levels of cash, cash equivalents, and short-term investments as of June 26, 2022, are expected to be sufficient to support our anticipated levels of operations, investments, debt service requirements, capital expenditures, capital redistributions, and dividends through at least the next twelve months. However, uncertainty in the global economy and the semiconductor industry, as well as disruptions in credit markets, have in the past, and could in the future, impact customer demand for our products, as well as our ability to manage normal commercial relationships with our customers, suppliers, and creditors.
In the longer term, liquidity will depend to a great extent on our future revenues and our ability to appropriately manage our costs based on demand for our products and services. While we have substantial cash balances, we may require additional funding and need or choose to raise the required funds through borrowings or public or private sales of debt or equity securities. We believe that, if necessary, we will be able to access the capital markets on terms and in amounts adequate to meet our objectives. However, the ongoing COVID-19 pandemic has in the past caused disruption in the capital markets, and were it to do the same in the future, that could make any financing more challenging, and there can be no assurance that we will be able to obtain such financing on commercially reasonable terms or at all.
Off-Balance Sheet Arrangements and Contractual Obligations
We have certain obligations to make future payments under various contracts, some of which are recorded on our balance sheet and some of which are not. Certain obligations that are recorded on our balance sheet in accordance with GAAP include our long-term debt, operating leases and finance leases; refer to Notes 14 and 15 of our Consolidated Financial Statements in Part II, Item 8 of this 2022 Form 10-K for further discussion. Our off-balance sheet arrangements and our transition tax liability are presented as purchase obligations, refer to Note 17 of our Consolidated Financial Statements in Part II, Item 8 of this 2022 Form 10-K for further discussion.
Item 7A. Quantitative and Qualitative Disclosures About Market Risk
Investments
We maintain an investment portfolio of various holdings, types, and maturities. As of June 26, 2022, our mutual funds are classified as trading securities. Investments classified as trading securities are recorded at fair value based upon quoted market prices. Any material differences between the cost and fair value of trading securities is recognized as other income (expense), net in our Consolidated Statement of Operations. All of our other investments are classified as available-for-sale and consequently are recorded in the Consolidated Balance Sheets at fair value with unrealized gains or losses reported as a separate component of accumulated other comprehensive income, net of tax.
Lam Research Corporation 2022 10-K 35
Interest Rate Risk
Fixed-Income Securities
Our investments in various interest-earning securities carry a degree of market risk for changes in interest rates. At any time, a sharp rise in interest rates could have a material adverse impact on the fair value of our fixed-income investment portfolio. Conversely, declines in interest rates could have a material adverse impact on interest income for our investment portfolio. We target to maintain a conservative investment policy, which focuses on the safety and preservation of our capital by limiting default risk, market risk, reinvestment risk, and concentration risk. As of June 26, 2022, our fixed income securities total $135.7 million. Market changes with hypothetical parallel shifts in the yield curve of plus or minus 50 basis points (“BPS”), 100 BPS, and 150 BPS, with a minimum interest rate of zero BPS, are not significant.
We mitigate default risk by investing in high credit quality securities and by positioning our portfolio to respond appropriately to a significant reduction in a credit rating of any investment issuer or guarantor. The portfolio includes only marketable securities with active secondary or resale markets to achieve portfolio liquidity and maintain a prudent amount of diversification.
Long-Term Debt
As of June 26, 2022, we had $5.0 billion in principal amount of fixed-rate long-term debt outstanding, with a fair value of $4.5 billion. The fair value of our Notes is subject to interest rate risk and market risk. Generally, the fair value of Notes will increase as interest rates fall and decrease as interest rates rise. The interest and market value changes affect the fair value of our Notes but do not impact our financial position, cash flows, or results of operations due to the fixed nature of the debt obligations. We do not carry the Notes at fair value but present the fair value of the principal amount of our Notes for disclosure purposes.
Equity Price Risk
Publicly Traded Securities
The values of our investments in publicly traded securities, including mutual funds related to our obligations under our deferred compensation plans, are subject to market price risk. As of June 26, 2022, our publicly traded securities total $95.2 million. Potential fluctuations in the price of each security in the portfolio of plus or minus 10%, 15%, or 25% are not significant.
Foreign Currency Exchange (“FX”) Risk
We conduct business on a global basis in several major international currencies. As such, we are potentially exposed to adverse as well as beneficial movements in foreign currency exchange rates. The majority of our revenues and expenses are denominated in U.S. dollars. However, we are exposed to foreign currency exchange rate fluctuations on non-U.S dollar transactions or cash flows.
We enter into foreign currency forward contracts to minimize the short-term impact of exchange rate fluctuations on certain foreign currency denominated monetary assets and liabilities, primarily cash, third-party accounts receivable, accounts payable, and intercompany receivables and payables. In addition, we hedge certain anticipated foreign currency cash flows.
To protect against adverse movements in value of anticipated non-U.S. dollar transactions or cash flows, we enter into foreign currency forward and option contracts that generally expire within 12 months and no later than 24 months. The option contracts include collars, an option strategy that is comprised of a combination of a purchased put option and a written call option with the same expiration dates and notional amounts but with different strike prices. These foreign currency hedge contracts are designated as cash flow hedges and are carried on our balance sheet at fair value, with the effective portion of the contracts’ gains or losses included in accumulated other comprehensive income (loss) and subsequently recognized in earnings in the same period the hedged revenue and/or expense is recognized. We also enter into foreign currency forward contracts to hedge the gains and losses generated by the remeasurement of certain non-U.S.-dollar denominated monetary assets and liabilities, primarily cash, third-party accounts receivable, accounts payable, and intercompany receivables and payables. The change in fair value of these balance sheet hedge contracts is recorded into earnings as a component of other income (expense), net, and offsets the change in fair value of the foreign currency denominated monetary assets and liabilities also recorded in other income (expense), net, assuming the hedge contract fully covers the hedged items. The notional amount and unrealized gain of our outstanding forward and option contracts that are designated as cash flow hedges, as of June 26, 2022, are shown in the table below. This table also shows the change in fair value of these cash flow hedges assuming a hypothetical foreign currency exchange rate movement of plus or minus 10 percent and plus or minus 15 percent.
Lam Research Corporation 2022 10-K 36
| Notional Amount | Unrealized FX Gain/(Loss) | Valuation of FX Contracts Given an X% Increase (+)/Decrease(-) in Each | |||||||||||||||||||||||||||
| June 26, 2022 | = +/- (10%) | = +/- (15%) | |||||||||||||||||||||||||||
| (in thousands) | |||||||||||||||||||||||||||||
| Forward contracts, cash flow hedges | |||||||||||||||||||||||||||||
| Sell | Japanese yen | $ | 541,999 | $ | 27,396 | $ | 50,808 | $ | 76,213 | ||||||||||||||||||||
| Buy | Euro | 150,020 | (9,365) | 13,927 | 20,891 | ||||||||||||||||||||||||
| Buy | Indian rupee | 70,768 | (630) | 7,109 | 10,663 | ||||||||||||||||||||||||
| Buy | Korean won | 57,220 | (4,110) | 5,287 | 7,930 | ||||||||||||||||||||||||
| Buy | Malaysian ringgit | 28,203 | 133 | 2,793 | 4,189 | ||||||||||||||||||||||||
| $ | 13,424 | $ | 79,924 | $ | 119,886 | ||||||||||||||||||||||||
The notional amount and unrealized loss of our outstanding foreign currency forward contracts that are designated as balance sheet hedges, as of June 26, 2022, are shown in the table below. This table also shows the change in fair value of these balance sheet hedges, assuming a hypothetical foreign currency exchange rate movement of plus or minus 10 percent and plus or minus 15 percent. These changes in fair values would be offset in other income (expense), net, by corresponding change in fair values of the foreign currency denominated monetary assets and liabilities, assuming the hedge contract fully covers the intercompany and trade receivable balances.
| Notional Amount | Unrealized FX Gain/(Loss) | Valuation of FX Contracts Given an X% Increase (+)/Decrease(-) in Each | |||||||||||||||||||||||||||
| June 26, 2022 | = +/- (10%) | = +/- (15%) | |||||||||||||||||||||||||||
| (in thousands) | |||||||||||||||||||||||||||||
| Forward contracts, balance sheet hedges | |||||||||||||||||||||||||||||
| Sell | Korean won | $ | 322,808 | $ | 6 | $ | 32,261 | $ | 48,391 | ||||||||||||||||||||
| Buy | Chinese renminbi | 64,434 | 12 | 6,447 | 9,671 | ||||||||||||||||||||||||
| Buy | Euro | 43,321 | (18) | 4,324 | 6,486 | ||||||||||||||||||||||||
| Buy | Taiwan dollar | 33,752 | (33) | 3,360 | 5,041 | ||||||||||||||||||||||||
| Buy | British pound | 20,983 | (2) | 2,097 | 3,146 | ||||||||||||||||||||||||
| Buy | Singapore dollar | 12,243 | (1) | 1,224 | 1,836 | ||||||||||||||||||||||||
| Buy | Swiss francs | 8,841 | (3) | 883 | 1,324 | ||||||||||||||||||||||||
| Sell | Indian rupee | 3,060 | (4) | 307 | 460 | ||||||||||||||||||||||||
| Sell | Malaysian ringgit | 908 | — | 91 | 136 | ||||||||||||||||||||||||
| Buy | Japanese yen | 736 | — | 74 | 111 | ||||||||||||||||||||||||
| $ | (43) | $ | 51,068 | $ | 76,602 | ||||||||||||||||||||||||
Lam Research Corporation 2022 10-K 37
Item 8. Financial Statements and Supplementary Data
There were no retrospective changes to the Consolidated Statements of Operation for any quarters in the two most recent fiscal years that would require disclosure under Item 302 of Regulation S-K.
Index to Consolidated Financial Statements
| Page | |||||
| Consolidated Statements of Operations — Years Ended June 26, 2022, June 27, 2021, and June 28, 2020 | 39 | ||||
| Consolidated Statements of Comprehensive Income — Years Ended June 26, 2022, June 27, 2021, and June 28, 2020 | 40 | ||||
| Consolidated Balance Sheets — June 26, 2022, and June 27, 2021 | 41 | ||||
| Consolidated Statements of Cash Flows — Years Ended June 26, 2022, June 27, 2021, and June 28, 2020 | 42 | ||||
| Consolidated Statements of Stockholders’ Equity — Years Ended June 26, 2022, June 27, 2021, and June 28, 2020 | 44 | ||||
| Notes to Consolidated Financial Statements | 45 | ||||
| Reports of Independent Registered Public Accounting Firm (PCAOB ID: 42) | 71 | ||||
Lam Research Corporation 2022 10-K 38
LAM RESEARCH CORPORATION
CONSOLIDATED STATEMENTS OF OPERATIONS
(in thousands, except per share data)
| Year Ended | |||||||||||||||||
| June 26, 2022 | June 27, 2021 | June 28, 2020 | |||||||||||||||
| Revenue | $ | 17,227,039 | $ | 14,626,150 | $ | 10,044,736 | |||||||||||
| Cost of goods sold | 9,355,232 | 7,820,844 | 5,436,043 | ||||||||||||||
| Gross margin | 7,871,807 | 6,805,306 | 4,608,693 | ||||||||||||||
| Research and development | 1,604,248 | 1,493,408 | 1,252,412 | ||||||||||||||
| Selling, general, and administrative | 885,737 | 829,875 | 682,479 | ||||||||||||||
| Total operating expenses | 2,489,985 | 2,323,283 | 1,934,891 | ||||||||||||||
| Operating income | 5,381,822 | 4,482,023 | 2,673,802 | ||||||||||||||
| Other income (expense), net | (188,708) | (111,219) | (98,824) | ||||||||||||||
| Income before income taxes | 5,193,114 | 4,370,804 | 2,574,978 | ||||||||||||||
| Income tax expense | (587,828) | (462,346) | (323,225) | ||||||||||||||
| Net income | $ | 4,605,286 | $ | 3,908,458 | $ | 2,251,753 | |||||||||||
| Net income per share: | |||||||||||||||||
| Basic | $ | 32.92 | $ | 27.22 | $ | 15.55 | |||||||||||
| Diluted | $ | 32.75 | $ | 26.90 | $ | 15.10 | |||||||||||
| Number of shares used in per share calculations: | |||||||||||||||||
| Basic | 139,899 | 143,609 | 144,814 | ||||||||||||||
| Diluted | 140,628 | 145,320 | 149,090 | ||||||||||||||
See Notes to Consolidated Financial Statements
Lam Research Corporation 2022 10-K 39
LAM RESEARCH CORPORATION
CONSOLIDATED STATEMENTS OF COMPREHENSIVE INCOME
(in thousands)
| Year Ended | |||||||||||||||||
| June 26, 2022 | June 27, 2021 | June 28, 2020 | |||||||||||||||
| Net income | $ | 4,605,286 | $ | 3,908,458 | $ | 2,251,753 | |||||||||||
| Other comprehensive income (loss), net of tax: | |||||||||||||||||
| Foreign currency translation adjustment | (50,342) | 14,398 | (6,441) | ||||||||||||||
| Cash flow hedges: | |||||||||||||||||
| Net unrealized gains (losses) during the period | 30,849 | 22,139 | (30,603) | ||||||||||||||
| Net (gains) losses reclassified into net income | (29,054) | (3,468) | 2,137 | ||||||||||||||
| 1,795 | 18,671 | (28,466) | |||||||||||||||
| Available-for-sale investments: | |||||||||||||||||
| Net unrealized (losses) gains during the period | (4,638) | (4,098) | 1,842 | ||||||||||||||
| Net losses reclassified into net income | 1,390 | 786 | 935 | ||||||||||||||
| (3,248) | (3,312) | 2,777 | |||||||||||||||
| Defined benefit plans, net change in unrealized component | 5,941 | 326 | 1,949 | ||||||||||||||
| Other comprehensive income (loss), net of tax | (45,854) | 30,083 | (30,181) | ||||||||||||||
| Comprehensive income | $ | 4,559,432 | $ | 3,938,541 | $ | 2,221,572 | |||||||||||
See Notes to Consolidated Financial Statements
Lam Research Corporation 2022 10-K 40
LAM RESEARCH CORPORATION
CONSOLIDATED BALANCE SHEETS
(in thousands, except per share data)
| June 26, 2022 | June 27, 2021 | ||||||||||
| ASSETS: | |||||||||||
| Cash and cash equivalents | $ | 3,522,001 | $ | 4,418,263 | |||||||
| Investments | 135,731 | 1,310,872 | |||||||||
| Accounts receivable, less allowance of $5,606 as of June 26, 2022 and $5,255 as of June 27, 2021 | 4,313,818 | 3,026,430 | |||||||||
| Inventories | 3,966,294 | 2,689,294 | |||||||||
| Prepaid expenses and other current assets | 347,391 | 207,528 | |||||||||
| Total current assets | 12,285,235 | 11,652,387 | |||||||||
| Property and equipment, net | 1,647,587 | 1,303,479 | |||||||||
| Restricted cash and investments | 251,534 | 252,487 | |||||||||
| Goodwill | 1,515,113 | 1,490,134 | |||||||||
| Intangible assets, net | 101,850 | 132,365 | |||||||||
| Other assets | 1,394,313 | 1,061,300 | |||||||||
| Total assets | $ | 17,195,632 | $ | 15,892,152 | |||||||
| LIABILITIES AND STOCKHOLDERS’ EQUITY: | |||||||||||
| Trade accounts payable | $ | 1,011,208 | $ | 829,710 | |||||||
| Accrued expenses and other current liabilities | 1,974,272 | 1,719,483 | |||||||||
| Deferred profit | 1,571,898 | 967,325 | |||||||||
| Current portion of long-term debt and finance lease obligations | 7,381 | 11,349 | |||||||||
| Total current liabilities | 4,564,759 | 3,527,867 | |||||||||
| Long-term debt and finance lease obligations, less current portion | 4,998,449 | 4,990,333 | |||||||||
| Income taxes payable | 931,117 | 948,037 | |||||||||
| Other long-term liabilities | 422,941 | 398,727 | |||||||||
| Total liabilities | 10,917,266 | 9,864,964 | |||||||||
| Commitments and contingencies | |||||||||||
| S |
Showing the first 8K of 172K characters. Open the full section
Item 9. Changes in and Disagreements with Accountants on Accounting and Financial Disclosure
None.
Item 9A. Controls and Procedures
Design of Disclosure Controls and Procedures and Internal Control over Financial Reporting
We maintain disclosure controls and procedures and internal control over final reporting that are designed to comply with Rule 13a-15 of the Exchange Act. In designing and evaluating the controls and procedures associated with each, management recognizes that any controls and procedures, no matter how well designed and operated, can provide only reasonable assurance of achieving the desired control objectives and that the effectiveness of controls cannot be absolute because the cost to design and implement a control to identify errors or mitigate the risk of errors occurring should not outweigh the potential loss caused by the errors that would likely be detected by the control. Moreover, we believe that a control system cannot be guaranteed to be 100% effective all of the time. Accordingly, a control system, no matter how well designed and operated, can provide only reasonable, not absolute, assurance that the control system’s objectives will be met.
Disclosure Controls and Procedures
As required by Rule 13a-15(b) under the Securities Exchange Act of 1934, as amended (the “Exchange Act”), as of June 26, 2022, we carried out an evaluation, under the supervision and with the participation of our management, including our Chief Executive Officer and our Chief Financial Officer, of the effectiveness of the design and operation of our disclosure controls and procedures as defined in Rule 13a-15(e). Based upon that evaluation, our Chief Executive Officer and our Chief Financial Officer each concluded that our disclosure controls and procedures are effective, as of June 26, 2022, at the reasonable assurance level.
We intend to review and evaluate the design and effectiveness of our disclosure controls and procedures on an ongoing basis and to correct any material deficiencies that we may discover. Our goal is to ensure that our senior management has timely access to material information that could affect our business.
Changes in Internal Control over Financial Reporting
There has been no change in our internal control over financial reporting during our most recent fiscal quarter that has materially affected, or is reasonably likely to materially affect, our internal control over financial reporting.
Management’s Report on Internal Control over Financial Reporting
Management is responsible for establishing and maintaining adequate “internal control over financial reporting”, as that term is defined in Exchange Act Rules 13a-15(f) and 15d-15(f). Management conducted an evaluation of the effectiveness of internal control over financial reporting based on the framework in Internal Control — Integrated Framework used by the Committee of Sponsoring Organizations of the Treadway Commission (2013 Framework). Based on that evaluation, management has concluded that the Company’s internal control over financial reporting was effective as of June 26, 2022, at providing reasonable assurance regarding the reliability of financial reporting and the preparation of financial statements for external purposes in accordance with GAAP.
Ernst & Young LLP, an independent registered public accounting firm, audited the financial statements included in this 2022 Form 10-K and has issued an attestation report on the Company’s internal control over financial reporting, as stated in their report, which is included in Part II, Item 8 of this 2022 Form 10-K.
Effectiveness of Controls
While we believe the present design of our disclosure controls and procedures and internal control over financial reporting is effective at the reasonable assurance level, future events affecting our business may cause us to modify our disclosure controls and procedures or internal control over financial reporting.
Item 9B. Other Information
None.
Item 9C. Disclosure Regarding Foreign Jurisdictions that Prevent Inspections
Not applicable.
Lam Research Corporation 2022 10-K 74
PART III
We have omitted from this 2022 Form 10-K certain information required by Part III because we, as the Registrant, will file a definitive proxy statement with the SEC within 120 days after the end of our fiscal year, pursuant to Regulation 14A, as promulgated by the SEC, for our Annual Meeting of Stockholders expected to be held on or about November 8, 2022, (the “Proxy Statement”), and certain information included in the Proxy Statement is incorporated into this report by reference.
Item 10. Directors, Executive Officers and Corporate Governance
For information regarding our executive officers, see Part I, Item 1 of this 2022 Form 10-K under the caption “Information about our Executive Officers,” which information is incorporated into Part III by reference.
The information concerning our directors required by this Item is incorporated by reference to our Proxy Statement under the heading “Voting Proposals — Proposal No. 1: Election of Directors — 2022 Nominees for Director.”
The information concerning our audit committee and audit committee financial experts required by this Item is incorporated by reference to our Proxy Statement under the heading “Governance Matters — Corporate Governance — Board Committees” and “Governance Matters — Corporate Governance — Board Committees — Audit Committee.”
The Company has adopted a Corporate Code of Ethics that applies to all employees, officers, and directors of the Company. Our Code of Ethics is publicly available on the Investor Relations page of our website at http://investor.lamresearch.com. To the extent required by law, any amendments to, or waivers from, any provision of the Code of Ethics will promptly be disclosed to the public. To the extent permitted by applicable legal requirements, we intend to make any required public disclosure by posting the relevant material on our website in accordance with SEC rules.
Item 11. Executive Compensation
The information required by this Item is incorporated by reference to our Proxy Statement under the heading “Compensation Matters — Executive Compensation and Other Information,” “Compensation Matters — CEO Pay Ratio,” and “Governance Matters — Director Compensation.”
Item 12. Security Ownership of Certain Beneficial Owners and Management and Related Stockholder Matters
The information required by this Item is incorporated by reference to our Proxy Statement under the headings “Stock Ownership — Security Ownership of Certain Beneficial Owners and Management” and “Compensation Matters — Securities Authorized for Issuance Under Equity Compensation Plans.”
Item 13. Certain Relationships and Related Transactions, and Director Independence
The information required by this Item is incorporated by reference to our Proxy Statement under the headings “Audit Matters — Certain Relationships and Related Party Transactions” and “Governance Matters — Corporate Governance — Director Independence Policies.”
Item 14. Principal Accountant Fees and Services
The information required by this Item is incorporated by reference to our Proxy Statement under the heading “Audit Matters — Relationship with Independent Registered Public Accounting Firm –– Fees Billed by Ernst & Young LLP” and “Audit Matters –– Relationship with Independent Registered Public Accounting Firm –– Policy on Audit Committee Pre-Approval of Audit and Non-Audit Services.”
Lam Research Corporation 2022 10-K 75
PART IV
Item 15. Exhibit and Financial Statement Schedules
(a)The following documents are filed as part of this Annual Report on Form 10-K.
| Page | |||||
| 1. Index to Financial Statements | |||||
| Consolidated Statements of Operations — Years Ended June 26, 2022, June 27, 2021, and June 28, 2020 | 39 | ||||
| Consolidated Statements of Comprehensive Income — Years Ended June 26, 2022, June 27, 2021, and June 28, 2020 | 40 | ||||
| Consolidated Balance Sheets — June 26, 2022, and June 27, 2021 | 41 | ||||
| Consolidated Statements of Cash Flows — Years Ended June 26, 2022, June 27, 2021, and June 28, 2020 | 42 | ||||
| Consolidated Statements of Stockholders’ Equity — Years Ended June 26, 2022, June 27, 2021, and June 28, 2020 | 44 | ||||
| Notes to Consolidated Financial Statements | 45 | ||||
| Reports of Independent Registered Public Accounting Firm | 71 | ||||
| 2. Index to Financial Statement Schedules | |||||
| Schedules have been omitted since they are not applicable, not required, not material, or the information is included elsewhere herein. | |||||
Item 16. Form 10-K Summary
None
Lam Research Corporation 2022 10-K 76
LAM RESEARCH CORPORATION
ANNUAL REPORT ON FORM 10-K
FOR THE FISCAL YEAR ENDED JUNE 26, 2022
EXHIBIT INDEX
Lam Research Corporation 2022 10-K 77
Lam Research Corporation 2022 10-K 78
| Exhibit | Description | |||||||
| 10.39* | Lam Research Corporation Senior Executive Transition Policy which is incorporated by reference to Exhibit 10.1 to the Registrant’s Current report on Form 8-K filed on May 11, 2022 (SEC File No. 000-12933) | |||||||
| 21 | Subsidiaries of the Registrant. | |||||||
| 23 | Consent of Independent Registered Public Accounting Firm. | |||||||
| 24 | Power of Attorney (See Signature page) | |||||||
| 31.1 | Rule 13a — 14(a) / 15d — 14(a) Certification (Principal Executive Officer) | |||||||
| 31.2 | Rule 13a — 14(a) / 15d — 14(a) Certification (Principal Financial Officer) | |||||||
| 32.1 | Section 1350 Certification — (Principal Executive Officer) | |||||||
| 32.2 | Section 1350 Certification — (Principal Financial Officer) | |||||||
| 101.INS | Inline XBRL Instance Document - the instance document does not appear in the Interactive Data File because its XBRL tags are embedded within the Inline XBRL document. | |||||||
| 101.SCH | Inline XBRL Taxonomy Extension Schema Document | |||||||
| 101.CAL | Inline XBRL Taxonomy Extension Calculation Linkbase Document | |||||||
| 101.DEF | Inline XBRL Taxonomy Extension Definition Linkbase Document | |||||||
| 101.LAB | Inline XBRL Taxonomy Extension Label Linkbase Document | |||||||
| 101.PRE | Inline XBRL Taxonomy Extension Presentation Linkbase Document | |||||||
| 104 | Cover Page Interactive Data File (formatted as Inline XBRL and contained in Exhibit 101) |
*Indicates management contract or compensatory plan or arrangement.
Lam Research Corporation 2022 10-K 79
SIGNATURES
Pursuant to the requirements of Section 13 or 15(d) of the Securities Exchange Act of 1934, as amended, the Registrant has duly caused this Report to be signed on its behalf by the undersigned, thereunto duly authorized.
| Date: | August 24, 2022 | LAM RESEARCH CORPORATION (Registrant) | |||||||||
| By: | /s/ Timothy M. Archer | ||||||||||
| Timothy M. Archer | |||||||||||
| President and Chief Executive Officer |
Lam Research Corporation 2022 10-K 80
POWER OF ATTORNEY AND SIGNATURES
By signing this Annual Report on Form 10-K below, I hereby appoint each of Timothy M. Archer and Douglas R. Bettinger, jointly and severally, as my attorney-in-fact to sign all amendments to this Form 10-K on my behalf and to file this Form 10-K (including all exhibits and other related documents) with the Securities and Exchange Commission. I authorize each of my attorneys-in-fact to (1) appoint a substitute attorney-in-fact for himself and (2) perform any actions that he believes are necessary or appropriate to carry out the intention and purpose of this Power of Attorney. I ratify and confirm all lawful actions taken directly or indirectly by my attorneys-in-fact and by any properly appointed substitute attorneys-in-fact.
Pursuant to the requirements of the Securities Exchange Act of 1934, as amended, this Report has been signed below by the following persons on behalf of the Registrant and in the capacities and on the dates indicated.
| Signatures | Title | Date | ||||||||||||
| Principal Executive Officer | ||||||||||||||
| /s/ Timothy M. Archer | President, Chief Executive Officer and Director | August 24, 2022 | ||||||||||||
| Timothy M. Archer | ||||||||||||||
| Principal Financial Officer and Principal Accounting Officer | ||||||||||||||
| /s/ Douglas R. Bettinger | Executive Vice President, Chief Financial Officer, and Chief Accounting Officer | August 24, 2022 | ||||||||||||
| Douglas R. Bettinger | ||||||||||||||
| Other Directors | |||||||||||||||||
| Signatures | Title | Date | Signatures | Title | Date | ||||||||||||
| /s/ Abhijit Y. Talwalkar | Chairman | August 24, 2022 | /s/ Bethany J. Mayer | Director | August 24, 2022 | ||||||||||||
| Abhijit Y. Talwalkar | Bethany J. Mayer | ||||||||||||||||
| /s/ Sohail U. Ahmed | Director | August 24, 2022 | /s/ Jyoti K. Mehra | Director | August 24, 2022 | ||||||||||||
| Sohail U. Ahmed | Jyoti K. Mehra | ||||||||||||||||
| /s/ Eric K. Brandt | Director | August 24, 2022 | /s/ Lih Shyng Tsai | Director | August 24, 2022 | ||||||||||||
| Eric K. Brandt | Lih Shyng (Rick L.) Tsai | ||||||||||||||||
| /s/ Michael R. Cannon | Director | August 24, 2022 | /s/ Leslie F. Varon | Director | August 24, 2022 | ||||||||||||
| Michael R. Cannon | Leslie F. Varon | ||||||||||||||||
| /s/ Catherine P. Lego | Director | August 24, 2022 | |||||||||||||||
| Catherine P. Lego | |||||||||||||||||
Lam Research Corporation 2022 10-K 81