 filings.tools
lululemon athletica 2013 10-K Annual Report
LULU · CIK 1397187 · Form 10-K · Fiscal year ended February 3, 2013 · Filed March 21, 2013
16 sections, 309K characters. Original on sec.gov · Markdown · JSON
Cover and table of contents
10-K 1 d475380d10k.htm 10-K
Table of Contents
UNITED STATES
SECURITIES AND EXCHANGE COMMISSION
Washington, D.C. 20549
Form 10-K
| x | ANNUAL REPORT PURSUANT TO SECTION 13 OR 15(d) OF THE SECURITIES EXCHANGE ACT OF 1934 |
|---|
For the fiscal year ended February 3, 2013
OR
| ¨ | TRANSITION REPORT PURSUANT TO SECTION 13 OR 15(d) OF THE SECURITIES EXCHANGE ACT OF 1934 |
|---|
For the transition period from to
Commission file number 001-33608
lululemon athletica inc.
(Exact name of registrant as specified in its charter)
| Delaware | 20-3842867 | |
| (State or other jurisdiction of incorporation or organization) | (I.R.S. Employer Identification Number) | |
| 1818 Cornwall Avenue Vancouver, British Columbia | V6J 1C7 | |
| (Address of principal executive offices) | (Zip Code) |
Registrant’s telephone number, including area code: (604) 732-6124
Securities registered pursuant to Section 12(b) of the Act:
| Title of Each Class | Name of Each Exchange on Which Registered | |
| Common Stock, par value $0.005 per share | Nasdaq Global Select Market |
Indicate by check mark if the registrant is a well-known seasoned issuer, as defined in Rule 405 of the Securities Act. Yes x No ¨
Indicate by check mark if the registrant is not required to file reports pursuant to Section 13 of Section 15(d) of the Act. Yes ¨ No x
Indicate by check mark whether the registrant (1) has filed all reports required to be filed by Section 13 or 15(d) of the Securities Exchange Act of 1934 during the preceding 12 months (or for such shorter period that the registrant was required to file such reports), and (2) has been subject to such filing requirements for the past 90 days. Yes x No ¨
Indicate by check mark whether the registrant has submitted electronically and posted on its corporate Website, if any, every Interactive Data File required to be submitted and posted pursuant to Rule 405 of Regulation S-T during the preceding 12 months (or for such shorter period that the registrant was required to submit and post such files). Yes x No ¨
Indicate by check mark if disclosure of delinquent filers pursuant to Item 405 of Regulation S-K is not contained herein, and will not be contained, to the best of registrant’s knowledge, in definitive proxy or information statements incorporated by reference in Part III of this Form 10-K or any amendment to this Form 10-K. ¨
Indicate by check mark whether the registrant is a large accelerated filer, an accelerated filer, a non-accelerated filer, or a smaller reporting company. See the definitions of “large accelerated filer,” “accelerated filer” and “smaller reporting company” in Rule 12b-2 of the Exchange Act. (Check one):
| Large accelerated filer | x | Accelerated filer | ¨ | |||
| Non-accelerated filer | ¨ (Do not check if a smaller reporting company) | Smaller reporting company | ¨ |
Indicate by check mark whether the registrant is a shell company (as defined in rule 12b-2 of the Act). Yes ¨ No x
The aggregate market value of the voting stock held by non-affiliates of the registrant on July 27, 2012 was approximately $6,234,540,799. Such aggregate market value was computed by reference to the closing price of the common stock as reported on the Nasdaq Global Select Market on July 27, 2012. For purposes of determining this amount only, the registrant has defined affiliates as including the executive officers and directors of the registrant on July 27, 2012.
Common Stock:
At March 18, 2013 there were 112,401,614 shares of the registrant’s common stock, par value $0.005 per share, outstanding.
Exchangeable and Special Voting Shares:
At March 18, 2013, there were outstanding 32,033,458 exchangeable shares of Lulu Canadian Holding, Inc., a wholly-owned subsidiary of the registrant. Exchangeable shares are exchangeable for an equal number of shares of the registrant’s common stock.
In addition, at March 18, 2013, the registrant had outstanding 32,033,458 shares of special voting stock, through which the holders of exchangeable shares of Lulu Canadian Holding, Inc. may exercise their voting rights with respect to the registrant. The special voting stock and the registrant’s common stock generally vote together as a single class on all matters on which the common stock is entitled to vote.
DOCUMENTS INCORPORATED BY REFERENCE
| DOCUMENT | PARTS INTO WHICH INCORPORATED | |
| Portions of Proxy Statement for the 2013 Annual Meeting of Stockholders | Part III |
Table of Contents
TABLE OF CONTENTS
Table of Contents
PART I
Special Note Regarding Forward-Looking Statements
This Annual Report on Form 10-K contains forward-looking statements within the meaning of Section 27A of the Securities Act of 1933, as amended and Section 21E of the Securities Exchange Act of 1934, as amended. We use words such as “anticipates,” “believes,” “estimates,” “may,” “intends,” “expects” and similar expressions to identify forward-looking statements. Discussions containing forward-looking statements may be found in the material set forth under “Business,” “Management’s Discussion and Analysis of Financial Condition and Results of Operations” and in other sections of the report. All forward-looking statements are inherently uncertain as they are based on our expectations and assumptions concerning future events. Any or all of our forward-looking statements in this report may turn out to be inaccurate. We have based these forward-looking statements largely on our current expectations and projections about future events and financial trends that we believe may affect our financial condition, results of operations, business strategy and financial needs. They may be affected by inaccurate assumptions we might make or by known or unknown risks and uncertainties, including the risks, uncertainties and assumptions described in the section entitled Item 1A and elsewhere in this report. In light of these risks, uncertainties and assumptions, the forward-looking events and circumstances discussed in this report may not occur as contemplated, and our actual results could differ materially from those anticipated or implied by the forward-looking statements. All forward-looking statements in this report are made as of the date hereof, based on information available to us as of the date hereof, and we assume no obligation to update any forward-looking statement.
Item 1. BUSINESS
| --- | --- |
Overview
lululemon athletica inc. is a designer and retailer of technical athletic apparel operating primarily in North America and Australia. Our yoga-inspired apparel is marketed under the lululemon athletica and ivivva athletica brand names. We believe consumers associate our brand with innovative, technical apparel products. Our products are designed to offer performance, fit and comfort while incorporating both function and style. Our heritage of combining performance and style distinctly positions us to address the needs of female athletes as well as a growing core of consumers who desire everyday casual wear that is consistent with their active lifestyles. We also continue to broaden our product range to increasingly appeal to male athletes and athletic female youth. We offer a comprehensive line of apparel and accessories including fitness pants, shorts, tops and jackets designed for athletic pursuits such as yoga, running, general fitness and dance-inspired apparel for female youth. As of February 3, 2013, our branded apparel was principally sold through 211 stores that are located in Canada, the United States, Australia and New Zealand. We believe our vertical retail strategy allows us to interact more directly with, and gain feedback from, our customers, whom we call guests, while providing us with greater control of our brand.
We have developed a distinctive community-based strategy that we believe enhances our brand and reinforces our guest loyalty. The key elements of our strategy are to:
| • | design and develop innovative athletic apparel that combines performance with style and incorporates real-time guest feedback; |
|---|
| • | locate our stores in street locations, lifestyle centers and malls that position each lululemon athletica store as an integral part of its community; |
|---|
| • | create an inviting and educational store environment that encourages product trial and repeat visits; and |
|---|
| • | market on a grassroots level in each community, including through social media and influential fitness practitioners who embrace and create excitement around our brand. |
|---|
We were founded in 1998 by Dennis “Chip” Wilson in Vancouver, British Columbia. Noting the increasing number of women participating in sports, and specifically yoga, Mr. Wilson developed lululemon athletica to
Table of Contents
address a void in the women’s athletic apparel market. The founding principles established by Mr. Wilson drive our distinctive corporate culture with a mission of providing people with the components to live a longer, healthier and more fun life. Consistent with this mission, we promote a set of core values in our business, which include developing the highest quality products, operating with integrity, leading a healthy balanced life, and training our employees in self responsibility and goal setting. These core values attract passionate and motivated employees who are driven to succeed and share our vision of “elevating the world from mediocrity to greatness.” We believe the energy and passion of our employees allow us to successfully execute on our business strategy, enhance brand loyalty and create a distinctive connection with our guests.
We believe our culture and community-based business approach provides us with competitive advantages that are responsible for our strong financial performance. Our net revenue has increased from $40.7 million in fiscal 2004 to $1,370.4 million in fiscal 2012, representing a 55% compound annual growth rate. Our net revenue increased from $1,000.8 million in fiscal 2011 to $1,370.4 million in fiscal 2012, representing a 37% increase, including the impact of the 53rd week of sales. During fiscal 2012, our comparable store sales growth was 16%, excluding the impact of the 53rd week of sales, and we reported income from operations of $376.4 million. During fiscal 2011, our comparable store sales growth was 22% and we reported income from operations of $287.0 million. In fiscal 2012, our corporate-owned stores opened at least one year, averaged sales of $2,058 per square foot, excluding the impact of the 53rd week of sales, compared to sales per square foot of $2,004 for fiscal 2011. We believe this is among the best in the apparel retail sector.
Our fiscal year ends on the Sunday closest to January 31 of the following year, typically resulting in a 52 week year, but occasionally giving rise to an additional week, resulting in a 53 week year. Fiscal 2012, which ends on February 3, 2013, is a 53 week year.
Our Market
Our primary target customer is a sophisticated and educated woman who understands the importance of an active, healthy lifestyle. She is increasingly tasked with the dual responsibilities of career and family and is constantly challenged to balance her work, life and health. We believe she pursues exercise to achieve physical fitness and inner peace.
As women have continued to embrace a variety of fitness and athletic activities, including yoga, we believe other athletic apparel companies are not effectively addressing their unique style, fit and performance needs. We believe we have been able to help address this void in the marketplace by incorporating style along with comfort and functionality into our products through our vertical retail strategy. Although we were founded to address the unique needs of women, we are also successfully designing products for men and athletic female youth who also appreciate the technical rigor and premium quality of our products. We also believe longer-term growth in athletic participation will be reinforced as the aging Baby Boomer generation focuses more on longevity. In addition, we believe consumer purchase decisions are driven by both an actual need for functional products and a desire to create a particular lifestyle perception. As such, we believe the credibility and authenticity of our brand expands our potential market beyond just athletes to those who desire to lead an active, healthy, and balanced life.
Our Competitive Strengths
We believe the following strengths differentiate us from our competitors and are important to our success:
| • | Premium Active Brand. lululemon athletica stands for leading a healthy, balanced and fun life. We believe customers associate the lululemon athletica brand with high quality premium athletic apparel that incorporates technically advanced materials, innovative functional features and style. We believe our focus on women differentiates us and positions lululemon athletica to address a void in the growing market for women’s athletic apparel. While our brand has its roots in yoga, our products are |
|---|
Table of Contents
| increasingly being designed and used for other athletic and casual lifestyle pursuits, such as running and general fitness. We work with local athletes and fitness practitioners to enhance our brand awareness and broaden our product appeal. |
|---|
| • | Distinctive Retail Experience. We locate our stores in street locations, lifestyle centers and malls that position lululemon athletica stores to be an integral part of their communities. We coach our store sales associates, whom we refer to as “educators,” to develop a personal connection with each guest. Our educators receive approximately 30 hours of in-house training within the first three months of the start of their employment and are well prepared to explain the technical and innovative design aspects of each product. |
|---|
| • | Innovative Design Process. We offer high-quality premium apparel that is designed for performance, comfort, functionality and style. We attribute our ability to develop superior products to a number of factors, including: |
|---|
| • | our feedback-based design process through which our design and product development team proactively and frequently seeks input from our guests and local fitness practitioners; |
|---|
| • | close collaboration with our third-party suppliers to formulate innovative and technically-advanced fabrics and features for our products; and |
|---|
| • | although we typically bring products from design to market in eight to 10 months, our vertical retail strategy enables us to bring select products to market in as little as two months, thereby allowing us to respond quickly to customer feedback, changing market conditions and apparel trends. |
|---|
| • | Community-Based Marketing Approach. We differentiate lululemon athletica through an innovative, community-based approach to building brand awareness and customer loyalty. We use a multi-faceted grassroots marketing strategy that includes social media, local ambassadors, hosting community events and creating in-store community boards. We believe this grassroots approach allows us to successfully increase brand awareness and broaden our appeal while reinforcing our premium brand image. |
|---|
| • | Deep Rooted Culture Centered on Training and Personal Growth. We believe our core values and distinctive corporate culture allow us to attract passionate and motivated employees who are driven to succeed and share our vision. We provide our employees with a supportive, goal-oriented environment and encourage them to reach their full professional, health and personal potential. We offer programs such as personal development workshops and goal coaching to assist our employees in realizing their long-term objectives. We believe our relationship with our employees is exceptional and a key contributor to our success. |
|---|
| • | Experienced Management Team with Proven Ability to Execute. Our Chief Executive Officer, Ms. Day, whose experience includes 20 years at Starbucks Corporation, most recently serving as President of Asia Pacific Group of Starbucks International from 2004 to 2007, joined us in January 2008. Ms. Day has assembled a management team with a complementary mix of retail, design, operations, product sourcing, marketing and information technology experience from leading apparel and retail companies such as Abercrombie & Fitch Co., The Gap, Inc., Nike, Inc. and Speedo International Limited. We believe our management team is well positioned to execute the long-term growth strategy for our business. |
|---|
Growth Strategy
Key elements of our growth strategy are to:
| • | Grow our Store Base in North America. As of February 3, 2013, our products were sold through 186 corporate-owned stores in North America, including 135 in the United States and 51 in Canada. We expect that most of our near-term store growth will occur in the United States. We plan to add new |
|---|
Table of Contents
| stores to strengthen existing markets and selectively enter new markets in the United States and Canada. We opened 27 stores in the United States and four stores in Canada in fiscal 2012, including three ivivva branded stores, and we plan to open up to 38 stores, including three ivivva athletica branded stores in North America in fiscal 2013. |
|---|
| • | Expand Beyond North America. As of February 3, 2013, we operated 23 corporate-owned stores and one showroom in Australia, two corporate-owned stores and one showroom in New Zealand, two showrooms in Hong Kong, and one showroom in the United Kingdom. We plan to open approximately five lululemon stores in fiscal 2013 in Australia and New Zealand. Over the next two years we intend to open additional showrooms as pre-seeding activities in the Asian and European markets. |
|---|
| • | Develop our Direct to Consumer Sales Channel. We launched our retail website in the first quarter of fiscal 2009. The addition of e-commerce to our direct to consumer sales channel expanded our customer base and supplemented our growing store base over the past four years. During fiscal 2012 we added new country and region specific websites in Australia, Europe and Asia, and new brand specific websites in North America. We plan to continue developing our e-commerce website to provide a distinctive online shopping experience and extend our reach. |
|---|
| • | Increase our Brand Awareness. We will continue to increase brand awareness and customer loyalty through our grassroots marketing efforts, social media activities and planned store expansion. We believe that increased brand awareness will result in increased comparable store sales and store productivity over time. |
|---|
| • | Introduce New Product Technologies. We remain focused on developing and offering products that incorporate technology-enhanced fabrics and performance features that differentiate us in the market. Collaborating with leading fabric manufacturers, we have jointly developed and trademarked names for innovative fabrics such as Luon and Silverescent, and natural stretch fabrics using organic elements such as cotton and seaweed. Among our ongoing efforts, we are developing fabrics to provide advanced features such as UV protection and inherent reflectivity. In addition, we will continue to develop differentiated manufacturing techniques that provide greater support, protection, and comfort. |
|---|
| • | Broaden the Appeal of our Products. We will selectively seek opportunities to expand the appeal of our brand to improve store productivity and expand our market. To enhance our product appeal, we intend to: |
|---|
| • | Expand our Product Categories. We continue to expand our product offerings in complementary existing and new categories such as bags, underwear and outerwear; |
|---|
| • | Increase the Range of Athletic Activities our Products Target. Our guests purchase our products mainly for activities such as yoga, running and general fitness. We will continue to expand our product categories and educate our guests on the versatility of our products; |
|---|
| • | Grow our Men’s Business. We believe the premium quality and technical rigor of our products will continue to appeal to men and that there is an opportunity to expand our men’s business as a proportion of our total sales; and |
|---|
| • | Develop our Youth Brand. We launched our youth focused brand, ivivva athletica, in fiscal 2009. We believe the premium quality and technical rigor of our dance-inspired products designed for female youth serve an open market and provide us with an opportunity for future growth. |
|---|
Our Stores
As of February 3, 2013, our retail footprint included 135 stores in the United States, 51 stores in Canada, 23 stores in Australia and two in New Zealand. While most of our corporate-owned stores are branded lululemon athletica, eight of our corporate-owned stores are branded ivivva athletica and specialize in dance-inspired apparel for female youth. We no longer operate any franchised stores as we reacquired our four remaining franchise stores during fiscal 2011. Our retail stores are located primarily on street locations, in lifestyle centers and in malls.
Table of Contents
The following store list shows the number of corporate-owned stores operated in each U.S. state, Canadian province, Australian state and in New Zealand, and the overall totals:
| February 3, 2013 | January 29, 2012 | |||||||
| United States | ||||||||
| Alabama | 1 | 1 | ||||||
| Arizona | 3 | 3 | ||||||
| California | 24 | 23 | ||||||
| Colorado | 3 | 3 | ||||||
| Connecticut | 3 | 3 | ||||||
| District of Columbia | 2 | 2 | ||||||
| Florida | 8 | 7 | ||||||
| Georgia | 3 | 1 | ||||||
| Hawaii | 1 | 1 | ||||||
| Illinois | 9 | 8 | ||||||
| Indiana | 1 | 1 | ||||||
| Kansas | 1 | 1 | ||||||
| Louisiana | 1 | — | ||||||
| Maryland | 3 | 2 | ||||||
| Massachusetts | 6 | 5 | ||||||
| Michigan | 2 | 1 | ||||||
| Minnesota | 3 | 3 | ||||||
| Missouri | 2 | 1 | ||||||
| Nebraska | 1 | — | ||||||
| Nevada | 1 | 1 | ||||||
| New Jersey | 6 | 5 | ||||||
| New Mexico | 1 | — | ||||||
| New York | 9 | 8 | ||||||
| North Carolina | 4 | 2 | ||||||
| Ohio | 5 | 3 | ||||||
| Oregon | 2 | 2 | ||||||
| Pennsylvania | 6 | 4 | ||||||
| South Carolina | 1 | — | ||||||
| Tennessee | 3 | 1 | ||||||
| Texas | 10 | 10 | ||||||
| Utah | 1 | — | ||||||
| Vermont | 1 | — | ||||||
| Virginia | 3 | 3 | ||||||
| Washington | 3 | 3 | ||||||
| Wisconsin | 2 | — | ||||||
| Total United States | 135 | 108 | ||||||
| Canada | ||||||||
| Alberta | 12 | 11 | ||||||
| British Columbia | 12 | 12 | ||||||
| Manitoba | 2 | 1 | ||||||
| Nova Scotia | 1 | 1 | ||||||
| Ontario | 18 | 17 | ||||||
| Québec | 4 | 4 | ||||||
| Saskatchewan | 2 | 1 | ||||||
| Total Canada | 51 | 47 | ||||||
| Australia | ||||||||
| Australian Capital Territory | 1 | — | ||||||
| New South Wales | 7 | 6 | ||||||
| Queensland | 3 | 2 | ||||||
| South Australia | 1 | 1 | ||||||
| Tasmania | 1 | — | ||||||
| Victoria | 7 | 6 | ||||||
| Western Australia | 3 | 3 | ||||||
| Total Australia | 23 | 18 | ||||||
| New Zealand | 2 | 1 | ||||||
| Total | 211 | 174 | ||||||
Table of Contents
Store Economics
We believe that our innovative retail concept and guest experience contribute to the success of our stores. During fiscal 2012 our corporate-owned stores open at least one year, which average approximately 2,834 square feet, averaged sales of $2,058 per square foot, excluding the 53rd week of sales.
Management performs an ongoing evaluation of our portfolio of corporate-owned store locations. In fiscal 2012 we did not close any of our corporate-owned stores. As we continue our evaluation we may in future periods close corporate-owned store locations.
Store Expansion
From February 1, 2002 (when we had one store, in Vancouver) to February 3, 2013, we opened or acquired 210 net corporate-owned stores in North America and Australia. We opened our first corporate-owned store in the United States in 2003 and in Australia in 2010. We opened 37 corporate-owned stores in North America and Australia in fiscal 2012. Over the next few years, our new store growth will be primarily focused on corporate-owned stores in the United States, an attractive market with a population of over nine times that of Canada. Beyond North America, we intend to expand our global presence as part of our long-term business strategy. We believe that partnering with companies and individuals with significant experience and proven success in the target country is to our advantage.
Direct to Consumer
In fiscal 2009 we launched our e-commerce website which makes up our direct to consumer channel. Direct to consumer is an increasingly substantial part of our business, representing approximately 14% of our net revenue in fiscal 2012, compared to 11% of our net revenue in fiscal 2011. We believe that a direct to consumer channel is convenient for our core customer and enhances the image of our brand. Our direct to consumer channel makes our product accessible to more markets than our corporate-owned store channel alone. We use this channel to build brand awareness, especially in new markets.
Wholesale Channel
We also sell lululemon athletica products through premium yoga studios, health clubs and fitness centers. This channel represented 2% of our net revenue in both fiscal 2012 and fiscal 2011. We believe these premium wholesale locations offer an alternative distribution channel that is convenient for our core consumer and enhances the image of our brand. We do not intend wholesale to be a significant contributor to overall sales. Instead, we use the channel to build brand awareness, especially in new markets, including those outside of North America.
Our Products
We offer a comprehensive line of performance apparel and accessories for women, men and female youth. Our apparel assortment, including items such as fitness pants, shorts, tops and jackets, is designed for healthy lifestyle activities such as yoga, running and general fitness. Although we benefit from the growing number of people that participate in yoga, we believe the percentage of our products sold for other activities will continue to increase as we broaden our product range to address other activities. Our fitness-related accessories include an array of items such as bags, socks, underwear, yoga mats, instructional yoga DVDs and water bottles.
Our design team continues to develop fabrics that we believe will help advance our product line and differentiate us from the competition.
Our Culture and Values
Since our inception, we have developed a distinctive corporate culture with a mission to provide people with components to live a longer, healthier and more fun life. We promote a set of core values in our business, which
Table of Contents
include developing the highest quality products, operating with integrity, leading a healthy balanced life and instilling in our employees a sense of self responsibility and personal achievement. These core values allow us to attract passionate and motivated employees who are driven to succeed and share our vision of “elevating the world from mediocrity to greatness.”
Community-Based Marketing
We differentiate our business through an innovative, community-based approach to building brand awareness and customer loyalty. We pursue a multi-faceted strategy which leverages our local ambassadors, social media, in-store community boards and a variety of grassroots initiatives.
Product Design and Development
Our product design efforts are led by a team of designers based in Vancouver, British Columbia partnering with international designers. Our team is comprised of dedicated athletes and users of our products who embody our design philosophy and dedication to premium quality. Our design team identifies trends based on market intelligence and research, proactively seeks the input of our guests and our ambassadors and broadly seeks inspiration consistent with our goals of style, function and technical superiority.
As we strive to continue to provide our guests with functional fabrics, our design team works closely with our suppliers to incorporate innovative fabrics that bring particular specifications to our products. We partner with a leading independent inspection, verification, testing and certification company, which conducts a battery of tests before each season on our fabrics, testing for a variety of performance characteristics including pilling, shrinkage, abrasion resistance and colorfastness. We collaborate with leading fabric suppliers to develop fabrics that we ultimately trademark for brand recognition whenever possible.
Sourcing and Manufacturing
We do not own or operate any manufacturing facilities. The fabric used in our products is sourced by our manufacturers from a limited number of pre-approved suppliers. We work with a group of approximately 50 manufacturers, five of which produced approximately 60% of our products in fiscal 2012. During fiscal 2012, no single manufacturer produced more than 26% of our product offering. During fiscal 2012, approximately 54% of our products were produced in South/South East Asia, approximately 34% in China, approximately 3% in North America and the remainder in the Peru, Israel, Egypt and other countries. Our North American manufacturers provide us with the speed to market necessary to respond quickly to changing trends and increased demand. While we plan to support future growth through manufacturers outside of North America, our intent is also to maintain production in Canada and the United States whenever practicable. We have developed long-standing relationships with a number of our vendors and take great care to ensure that they share our commitment to quality and ethics. We do not, however, have any long-term agreements requiring us to use any manufacturer, and no manufacturer is required to produce our products in the long-term. We require that all of our manufacturers adhere to a code of conduct regarding quality of manufacturing, working conditions and other social concerns. We currently also work with a leading inspection and verification firm to closely monitor each supplier’s compliance with applicable law and our workplace code of conduct. We believe that the services of additional, or other, producers of our fabrics could be obtained with little or no additional expense to us and/or delay in the timeliness of our production process.
Distribution Facilities
We centrally distribute finished products from distribution facilities in Vancouver, British Columbia, Sumner, Washington, and Melbourne, Victoria. We operate the distribution facilities in Vancouver, Sumner and Melbourne which are leased and are approximately 120,000, 167,000 and 54,000 square feet, respectively. We believe these modern facilities enhance the efficiency of our operations. We believe our distribution
Table of Contents
infrastructure will be sufficient to accommodate our expected store growth and expanded product offerings over the next several years. Merchandise is typically shipped to our stores through third-party delivery services multiple times per week, providing them with a steady flow of new inventory.
Competition
Competition in the athletic apparel industry is principally on the basis of brand image and recognition as well as product quality, innovation, style, distribution and price. We believe that we successfully compete on the basis of our premium brand image, our focus on women and our technical product innovation. In addition, we believe our vertical retail distribution strategy differentiates us from our competitors and allows us to more effectively control our brand image.
The market for athletic apparel is highly competitive. It includes increasing competition from established companies who are expanding their production and marketing of performance products, as well as from frequent new entrants to the market. We are in direct competition with wholesalers and direct sellers of athletic apparel, such as Nike, Inc., adidas AG, which includes the adidas and Reebok brands, and Under Armour, Inc. We also compete with retailers specifically focused on women’s athletic apparel including The Gap, Inc. (including the Athleta brand), Lucy Activewear Inc., and bebe stores, inc. (including the BEBE SPORT collection).
Our Employees
As of February 3, 2013, we had 6,383 employees, of which 3,387 were employed in the United States, 2,545 were employed in Canada, and 451 were employed outside of North America. Of the 3,387 employees in the United States, 3,196 were employed in our retail locations, 114 were employed in distribution and the remaining 77 performed selling, general and administrative and other functions. Of the 2,545 Canadian employees, 1,574 were employed in our retail locations, 75 were employed in distribution, 162 were employed in design, merchandise and production, and the remaining 734 performed selling, general and administration functions. Of the 451 international employees, 347 were employed in our international retail locations, 27 were employed in distribution, and 77 performed merchandise, production, and administrative functions. None of our employees is currently covered by a collective bargaining agreement. We have had no labor-related work stoppages and we believe our relations with our employees are excellent.
Intellectual Property
We believe we own the material trademarks used in connection with the marketing, distribution and sale of all of our products in Canada, the United States and in the other countries in which our products are currently or intended to be either sold or manufactured. Our major trademarks include lululemon athletica & design, the logo design (WAVE design) and lululemon as a word mark. In addition to the registrations in Canada, the United States, and Australia, lululemon’s design and word mark are registered in over 68 other jurisdictions which cover over 112 countries. We own trademark registrations for names of several of our fabrics and products including Luon, Silverescent, VitaSea, Boolux, Luxtreme, Groove Pant, Light as Air, and Power Y. In addition to trademarks, we own 22 industrial design registrations in Canada that protect our distinctive apparel and accessory designs, as well as a number of corresponding design patents in the United States and registered community designs in Europe.
Securities and Exchange Commission Filings
Our website address is www.lululemon.com. We provide free access to various reports that we file with, or furnish to, the United States Securities and Exchange Commission, or the SEC, through our website, as soon as reasonably practicable after they have been filed or furnished. These reports include, but are not limited to, our annual reports on Form 10-K, quarterly reports on Form 10-Q, current reports on Form 8-K, and any amendments to those reports. Our SEC reports can also be accessed through the SEC’s website at www.sec.gov. Also available on our website are printable versions of our Code of Business Conduct and Ethics and charters of
Table of Contents
the Audit, Compensation, and Nominating and Governance Committees of our Board of Directors. Information on our website does not constitute part of this annual report on Form 10-K or any other report we file or furnish with the SEC.
Item 1A. RISK FACTORS
| --- | --- |
In addition to the other information contained in this Form 10-K, the following risk factors should be considered carefully in evaluating our business. Our business, financial condition or results of operations could be materially adversely affected by any of these risks. Please note that additional risks not presently known to us or that we currently deem immaterial could also impair our business and operations.
Our success depends on our ability to maintain the value and reputation of our brand.
Our success depends on the value and reputation of the lululemon athletica brand. The lululemon athletica name is integral to our business as well as to the implementation of our strategies for expanding our business. Maintaining, promoting and positioning our brand will depend largely on the success of our marketing and merchandising efforts and our ability to provide a consistent, high quality guest experience. We rely on social media, as one of our marketing strategies, to have a positive impact on both our brand value and reputation. Our brand could be adversely affected if we fail to achieve these objectives or if our public image or reputation were to be tarnished by negative publicity. Negative publicity regarding the production methods of any of our suppliers or manufacturers could adversely affect our reputation and sales and force us to locate alternative suppliers or manufacturing sources. Additionally, while we devote considerable efforts and resources to protecting our intellectual property, if these efforts are not successful the value of our brand may be harmed, which could have a material adverse effect on our financial condition.
An economic downturn or economic uncertainty in our key markets may adversely affect consumer discretionary spending and demand for our products.
Many of our products may be considered discretionary items for consumers. Factors affecting the level of consumer spending for such discretionary items include general economic conditions, particularly those in North America and other factors such as consumer confidence in future economic conditions, fears of recession, the availability of consumer credit, levels of unemployment, tax rates and the cost of consumer credit. As global economic conditions continue to be volatile or economic uncertainty remains, trends in consumer discretionary spending also remain unpredictable and subject to reductions due to credit constraints and uncertainties about the future. The current volatility in the United States economy in particular has resulted in an overall slowing in growth in the retail sector because of decreased consumer spending, which may remain depressed for the foreseeable future. These unfavorable economic conditions may lead consumers to delay or reduce purchase of our products. Consumer demand for our products may not reach our sales targets, or may decline, when there is an economic downturn or economic uncertainty in our key markets, particularly in North America. Our sensitivity to economic cycles and any related fluctuation in consumer demand may have a material adverse effect on our financial condition.
Our sales and profitability may decline as a result of increasing product costs and decreasing selling prices.
Our business is subject to significant pressure on pricing and costs caused by many factors, including intense competition, constrained sourcing capacity and related inflationary pressure, pressure from consumers to reduce the prices we charge for our products and changes in consumer demand. These factors may cause us to experience increased costs, reduce our sales prices to consumers or experience reduced sales in response to increased prices, any of which could cause our operating margin to decline if we are unable to offset these factors with reductions in operating costs and could have a material adverse affect on our financial conditions, operating results and cash flows.
Table of Contents
If we are unable to anticipate consumer preferences and successfully develop and introduce new, innovative and updated products, we may not be able to maintain or increase our sales and profitability.
Our success depends on our ability to identify and originate product trends as well as to anticipate and react to changing consumer demands in a timely manner. All of our products are subject to changing consumer preferences that cannot be predicted with certainty. If we are unable to introduce new products or novel technologies in a timely manner or our new products or technologies are not accepted by our customers, our competitors may introduce similar products in a more timely fashion, which could hurt our goal to be viewed as a leader in technical athletic apparel innovation. Our new products may not receive consumer acceptance as consumer preferences could shift rapidly to different types of athletic apparel or away from these types of products altogether, and our future success depends in part on our ability to anticipate and respond to these changes. Failure to anticipate and respond in a timely manner to changing consumer preferences could lead to, among other things, lower sales and excess inventory levels. Even if we are successful in anticipating consumer preferences, our ability to adequately react to and address those preferences will in part depend upon our continued ability to develop and introduce innovative, high-quality products. Our failure to effectively introduce new products that are accepted by consumers could result in a decrease in net revenue and excess inventory levels, which could have a material adverse effect on our financial condition.
Our results of operations could be materially harmed if we are unable to accurately forecast customer demand for our products.
To ensure adequate inventory supply, we must forecast inventory needs and place orders with our manufacturers based on our estimates of future demand for particular products. Our ability to accurately forecast demand for our products could be affected by many factors, including an increase or decrease in customer demand for our products or for products of our competitors, our failure to accurately forecast customer acceptance of new products, product introductions by competitors, unanticipated changes in general market conditions, and weakening of economic conditions or consumer confidence in future economic conditions. If we fail to accurately forecast customer demand we may experience excess inventory levels or a shortage of products available for sale in our stores or for delivery to customers.
Inventory levels in excess of customer demand may result in inventory write-downs or write-offs and the sale of excess inventory at discounted prices, which would cause our gross margin to suffer and could impair the strength and exclusivity of our brand. Conversely, if we underestimate customer demand for our products, our manufacturers may not be able to deliver products to meet our requirements, and this could result in damage to our reputation and customer relationships.
Any material disruption of our information systems could disrupt our business and reduce our sales.
We are increasingly dependent on information systems to operate our e-commerce websites, process transactions, respond to guest inquiries, manage inventory, purchase, sell and ship goods on a timely basis and maintain cost-efficient operations. Any material disruption or slowdown of our systems, including a disruption or slowdown caused by our failure to successfully upgrade our systems, system failures, viruses, computer “hackers” or other causes, could cause information, including data related to customer orders, to be lost or delayed which could—especially if the disruption or slowdown occurred during the holiday season—result in delays in the delivery of products to our stores and customers or lost sales, which could reduce demand for our products and cause our sales to decline. If changes in technology cause our information systems to become obsolete, or if our information systems are inadequate to handle our growth, we could lose customers.
If we continue to grow at a rapid pace, we may not be able to effectively manage our growth and the increased complexity of our business and as a result our brand image and financial performance may suffer.
We have expanded our operations rapidly since our inception in 1998 and our net revenue has increased from $40.7 million in fiscal 2004 to $1,370.4 million in fiscal 2012. If our operations continue to grow at a rapid
Table of Contents
pace, we may experience difficulties in obtaining sufficient raw materials and manufacturing capacity to produce our products, as well as delays in production and shipments, as our products are subject to risks associated with overseas sourcing and manufacturing. We could be required to continue to expand our sales and marketing, product development and distribution functions, to upgrade our management information systems and other processes and technology, and to obtain more space for our expanding workforce. This expansion could increase the strain on our resources, and we could experience serious operating difficulties, including difficulties in hiring, training and managing an increasing number of employees. These difficulties could result in the erosion of our brand image which could have a material adverse effect on our financial condition.
The fluctuating cost of raw materials could increase our cost of goods sold and cause our results of operations and financial condition to suffer.
The fabrics used by our suppliers and manufacturers include synthetic fabrics whose raw materials include petroleum-based products. Our products also include natural fibers, including cotton. Our costs for raw materials are affected by, among other things, weather, consumer demand, speculation on the commodities market, the relative valuations and fluctuations of the currencies of producer versus consumer countries and other factors that are generally unpredictable and beyond our control. Increases in the cost of raw materials, including petroleum or the prices we pay for our cotton yarn and cotton-based textiles, could have a material adverse effect on our cost of goods sold, results of operations, financial condition and cash flows.
We rely on third-party suppliers to provide fabrics for and to produce our products, and we have limited control over them and may not be able to obtain quality products on a timely basis or in sufficient quantity.
We do not manufacture our products or the raw materials for them and rely instead on third-party suppliers. Many of the specialty fabrics used in our products are technically advanced textile products developed and manufactured by third parties and may be available, in the short-term, from only one or a very limited number of sources. For example, Luon fabric, which is included in many of our products, is supplied to the mills we use by a single manufacturer in Taiwan, and the fibers used in manufacturing Luon fabric are supplied to our Taiwanese manufacturer by a single company. In fiscal 2012, approximately 60% of our products were produced by our top five manufacturing suppliers. We have no long term contracts with our suppliers or manufacturing sources, and we compete with other companies for fabrics, raw materials, production and import quota capacity.
We may experience a significant disruption in the supply of fabrics or raw materials from current sources or, in the event of a disruption, we may be unable to locate alternative materials suppliers of comparable quality at an acceptable price, or at all. In addition, if we experience significant increased demand, or if we need to replace an existing supplier manufacturer, we may be unable to locate additional supplies of fabrics or raw materials or additional manufacturing capacity on terms that are acceptable to us, or at all, or we may be unable to locate any supplier or manufacturer with sufficient capacity to meet our requirements or to fill our orders in a timely manner. Identifying a suitable supplier is an involved process that requires us to become satisfied with their quality control, responsiveness and service, financial stability and labor and other ethical practices. Even if we are able to expand existing or find new manufacturing or fabric sources, we may encounter delays in production and added costs as a result of the time it takes to train our suppliers and manufacturers in our methods, products and quality control standards. Delays related to supplier changes could also arise due to an increase in shipping times if new suppliers are located farther away from our markets or from other participants in our supply chain. Any delays, interruption or increased costs in the supply of fabric or manufacture of our products could have an adverse effect on our ability to meet customer demand for our products and our results in lower net revenue and income from operations both in the short and long term. We have occasionally received, and may in the future continue to receive, shipments of products that fail to comply with our technical specifications or that fail to conform to our quality control standards. In that event, unless we are able to obtain replacement products in a timely manner, we risk the loss of net revenue resulting from the inability to sell those products and related increased administrative and shipping costs. Additionally, if defects in the manufacture of our products are not discovered until after such products are purchased by our guests, our guests could lose confidence in the technical attributes of our products and our results of operations could suffer and our business could be harmed.
Table of Contents
Our limited operating experience and limited brand recognition in new international markets may limit our expansion strategy and cause our business and growth to suffer.
Our future growth depends, to an extent, on our international expansion efforts. We have limited experience with regulatory environments and market practices internationally, and we may not be able to penetrate or successfully operate in any new market. In connection with our expansion efforts we may encounter obstacles we did not face in North America, including cultural and linguistic differences, differences in regulatory environments, labor practices and market practices, difficulties in keeping abreast of market, business and technical developments and foreign guests’ tastes and preferences. We may also encounter difficulty expanding into new international markets because of limited brand recognition leading to delayed acceptance of our technical athletic apparel by guests in these new international markets. Our failure to develop new international markets or disappointing growth outside of existing markets will harm our business and results of operations.
We operate in a highly competitive market and the size and resources of some of our competitors may allow them to compete more effectively than we can, resulting in a loss of our market share and a decrease in our net revenue and profitability.
The market for technical athletic apparel is highly competitive. Competition may result in pricing pressures, reduced profit margins or lost market share or a failure to grow our market share, any of which could substantially harm our business and results of operations. We compete directly against wholesalers and direct retailers of athletic apparel, including large, diversified apparel companies with substantial market share and established companies expanding their production and marketing of technical athletic apparel, as well as against retailers specifically focused on women’s athletic apparel. We also face competition from wholesalers and direct retailers of traditional commodity athletic apparel, such as cotton T-shirts and sweatshirts. Many of our competitors are large apparel and sporting goods companies with strong worldwide brand recognition, such as Nike, Inc., adidas AG, which includes the adidas and Reebok brands, and The Gap, Inc, which includes the Athleta brand. Because of the fragmented nature of the industry, we also compete with other apparel sellers, including those specializing in yoga apparel. Many of our competitors have significant competitive advantages, including longer operating histories, larger and broader customer bases, more established relationships with a broader set of suppliers, greater brand recognition and greater financial, research and development, store development, marketing, distribution and other resources than we do. In addition, our technical athletic apparel is sold at a price premium to traditional athletic apparel.
Our competitors may be able to achieve and maintain brand awareness and market share more quickly and effectively than we can. In contrast to our “grassroots” marketing approach, many of our competitors promote their brands through traditional forms of advertising, such as print media and television commercials, and through celebrity endorsements, and have substantial resources to devote to such efforts. Our competitors may also create and maintain brand awareness using traditional forms of advertising more quickly than we can. Our competitors may also be able to increase sales in their new and existing markets faster than we do by emphasizing different distribution channels than we do, such as catalog sales or an extensive franchise network, as opposed to distribution through retail stores, wholesale or internet, and many of our competitors have substantial resources to devote toward increasing sales in such ways.
In addition, because we own no patents or exclusive intellectual property rights in the technology, fabrics or processes underlying our products, our current and future competitors are able to manufacture and sell products with performance characteristics, fabrication techniques and styling similar to our products.
If we encounter problems with our distribution system, our ability to deliver our products to the market and to meet guest expectations could be harmed.
We rely on our distribution facilities for substantially all of our product distribution. Our distribution facilities include computer controlled and automated equipment, which means their operations are complicated
Table of Contents
and may be subject to a number of risks related to security or computer viruses, the proper operation of software and hardware, electronic or power interruptions or other system failures. In addition, because substantially all of our products are distributed from three locations, our operations could also be interrupted by labor difficulties, extreme or severe weather conditions or by floods, fires or other natural disasters near our distribution centers. For example, severe weather conditions in Sumner, Washington in 2011, including snow and freezing rain, resulted in disruption in our distribution facilities and the local transportation system. If we encounter problems with our distribution system, our ability to meet guest expectations, manage inventory, complete sales and achieve objectives for operating efficiencies could be harmed.
Another significant risk resulting from our international operations is compliance with the U.S. Foreign Corrupt Practices Act, or FCPA, and other anti-bribery laws applicable to our operations. In many foreign countries, particularly in those with developing economies, it may be a local custom that businesses operating in such countries engage in business practices that are prohibited by the FCPA or other U.S. and foreign laws and regulations applicable to us. Although we have implemented procedures designed to ensure compliance with the FCPA and similar laws, there can be no assurance that all of our employees, agents and other channel partners, as well as those companies to which we outsource certain of our business operations, will not take actions in violation of our policies. Any such violation could have a material and adverse effect on our business.
Our fabrics and manufacturing technology are not patented and can be imitated by our competitors.
The intellectual property rights in the technology, fabrics and processes used to manufacture our products are owned or controlled by our suppliers and are generally not unique to us. Our ability to obtain intellectual property protection for our products is therefore limited and we currently own no patents or exclusive intellectual property rights in the technology, fabrics or processes underlying our products. As a result, our current and future competitors are able to manufacture and sell products with performance characteristics, fabrics and styling similar to our products. Because many of our competitors have significantly greater financial, distribution, marketing and other resources than we do, they may be able to manufacture and sell products based on our fabrics and manufacturing technology at lower prices than we can. If our competitors do sell similar products to ours at lower prices, our net revenue and profitability could suffer.
Our failure or inability to protect our intellectual property rights could diminish the value of our brand and weaken our competitive position.
We currently rely on a combination of copyright, trademark, trade dress and unfair competition laws, as well as confidentiality procedures and licensing arrangements, to establish and protect our intellectual property rights. We cannot assure you that the steps taken by us to protect our intellectual property rights will be adequate to prevent infringement of such rights by others, including imitation of our products and misappropriation of our brand. In addition, intellectual property protection may be unavailable or limited in some foreign countries where laws or law enforcement practices may not protect our intellectual property rights as fully as in the United States or Canada, and it may be more difficult for us to successfully challenge the use of our intellectual property rights by other parties in these countries. If we fail to protect and maintain our intellectual property rights, the value of our brand could be diminished and our competitive position may suffer.
We are subject to risks associated with leasing retail space subject to long-term and non-cancelable leases.
We lease the majority of our corporate-owned stores under operating leases and our inability to secure appropriate real estate or lease terms could impact our ability to grow. Our leases generally have initial terms of between five and ten years, and generally can be extended only in five-year increments if at all. We generally cannot cancel these leases at our option. If an existing or new store is not profitable, and we decide to close it, as we have done in the past and may do in the future, we may nonetheless be committed to perform our obligations under the applicable lease including, among other things, paying the base rent for the balance of the lease term. Similarly, we may be committed to perform our obligations under the applicable leases even if current locations of our stores become unattractive as demographic patterns change. In addition, as each of our leases expire, we may fail to negotiate renewals, either on commercially acceptable terms or at all, which could require us to close stores in desirable locations.
Table of Contents
Increasing labor costs and other factors associated with the production of our products in China could increase the costs to produce our products.
During fiscal 2012, approximately 34% of our products were produced in China and increases in the costs of labor and other costs of doing business in China could significantly increase our costs to produce our products and could have a negative impact on our operations, revenue and earnings. Factors that could negatively affect our business include a potential significant revaluation of the Chinese Yuan, which may result in an increase in the cost of producing products in China, labor shortage and increases in labor costs in China, and difficulties in moving products manufactured in China out of Asia and through the ports on the western coast of North America, whether due to port congestion, labor disputes, product regulations and/or inspections or other factors, and natural disasters or health pandemics impacting China. Also, the imposition of trade sanctions or other regulations against products imported by us from, or the loss of “normal trade relations” status with, China, could significantly increase our cost of products imported into North America and/or Australia and harm our business.
We may not be able to successfully open new store locations in a timely manner, if at all, which could harm our results of operations.
Our growth will largely depend on our ability to successfully open and operate new stores. Our approach to identifying locations for our stores typically favors street locations, lifestyle centers and malls where we can be a part of the community. As a result, our stores are typically located near retailers or fitness facilities that we believe are consistent with our guests’ lifestyle choices. Sales at these stores are derived, in part, from the volume of foot traffic in these locations. Our ability to successfully open and operate new stores depends on many factors, including, among others, our ability to:
| • | identify suitable store locations, the availability of which is outside of our control; |
|---|
| • | negotiate acceptable lease terms, including desired tenant improvement allowances; |
|---|
| • | hire, train and retain store personnel and field management; |
|---|
| • | immerse new store personnel and field management into our corporate culture; |
|---|
| • | source sufficient inventory levels; and |
|---|
| • | successfully integrate new stores into our existing operations and information technology systems. |
|---|
Successful new store openings may also be affected by our ability to initiate our grassroots marketing efforts in advance of opening our first store in a new market. We typically rely on our grassroots marketing efforts to build awareness of our brand and demand for our products. Our grassroots marketing efforts are often lengthy and must be tailored to each new market based on our emerging understanding of the market. Accordingly, there can be no assurance that we will be able to successfully implement our grassroots marketing efforts in a particular market in a timely manner, if at all. Additionally, we may be unsuccessful in identifying new markets where our technical athletic apparel and other products and brand image will be accepted or the performance of our stores will be considered successful.
Our failure to comply with trade and other regulations could lead to investigations or actions by government regulators and negative publicity.
The labeling, distribution, importation, marketing and sale of our products are subject to extensive regulation by various federal agencies, including the Federal Trade Commission, Consumer Product Safety Commission and state attorneys general in the United States, the Competition Bureau and Health Canada in Canada, as well as by various other federal, state, provincial, local and international regulatory authorities in the countries in which our products are distributed or sold. If we fail to comply with any of these regulations, we could become subject to enforcement actions or the imposition of significant penalties or claims, which could harm our results of operations or our ability to conduct our business. In addition, the adoption of new regulations or changes in the interpretation of existing regulations may result in significant compliance costs or discontinuation of product sales and could impair the marketing of our products, resulting in significant loss of net sales.
Table of Contents
Our future success is substantially dependent on the continued service of our senior management.
Our future success is substantially dependent on the continued service of our senior management and other key employees. The loss of the services of our senior management or other key employees could make it more difficult to successfully operate our business and achieve our business goals.
We also may be unable to retain existing management, technical, sales and client support personnel that are critical to our success, which could result in harm to our customer and employee relationships, loss of key information, expertise or know-how and unanticipated recruitment and training costs.
We do not maintain a key person life insurance policy on Ms. Day or any of the other members of our senior management team. As a result, we would have no way to cover the financial loss if we were to lose the services of members of our senior management team.
Our business is affected by seasonality.
Our business is affected by the general seasonal trends common to the retail apparel industry. Our annual net sales are weighted more heavily toward our fourth fiscal quarter, reflecting our historical strength in sales during the holiday season, while our operating expenses are more equally distributed throughout the year. As a result, a substantial portion of our operating profits are generated in the fourth quarter of our fiscal year. For example, we generated approximately 35%, 37% and 36% of our full year gross profit during the fourth quarters of fiscal 2012, fiscal 2011 and fiscal 2010, respectively. This seasonality may adversely affect our business and cause our results of operations to fluctuate, and, as a result, we believe that comparisons of our operating results between different quarters within a single fiscal year are not necessarily meaningful and that results of operations in any period should not be considered indicative of the results to be expected for any future period.
Because a significant portion of our sales are generated in countries other than the United States, fluctuations in foreign currency exchange rates have negatively affected our results of operations and may continue to do so in the future.
The reporting currency for our consolidated financial statements is the U.S. dollar. In the future, we expect to continue to derive a significant portion of our net revenue and incur a significant portion of our operating costs in Canada, and changes in exchange rates between the Canadian dollar and the U.S. dollar may have a significant, and potentially adverse, effect on our results of operations. Additionally, a portion of our net revenue is generated in Australia and New Zealand. Our primary risk of loss regarding foreign currency exchange rate risk is caused by fluctuations in the exchange rates between the U.S. dollar, Canadian dollar, Australian dollar and New Zealand dollar. As we recognize net revenue from sales in Canada in Canadian dollars, and the U.S. dollar has strengthened during fiscal 2012, it has had a negative impact on our Canadian operating results upon translation of those results into U.S. dollars for the purposes of consolidation. However, the loss in net revenue was partially offset by lower cost of sales and lower selling, general and administrative expenses that are generated in Canadian dollars. A 10% depreciation in the relative value of the Canadian dollar compared to the U.S. dollar would have resulted in lost income from operations of approximately $28.0 million in the fiscal 2012 and approximately $15.4 million in fiscal 2011. Similarly, a 10% depreciation in the relative value of the Australian dollar compared to the U.S. dollar would have resulted in lost income from operations of approximately $0.9 million in fiscal 2012 and approximately $0.4 million in the fiscal 2011. We have not historically engaged in hedging transactions but in the future may at times enter into derivative financial instruments to mitigate foreign exchange risks. As we continue to recognize gains and losses in foreign currency transactions, depending upon changes in future currency rates, such gains or losses could have a significant, and potentially adverse, effect on our results of operations.
Table of Contents
The operations of many of our suppliers are subject to additional risks that are beyond our control and that could harm our business, financial condition and results of operations.
Almost all of our suppliers are located outside of North America. During fiscal 2012, approximately 54% of our products were produced in South and South East Asia, approximately 34% in China, approximately 3% in North America and the remainder in the Peru, Israel, Egypt and other countries. As a result of our international suppliers, we are subject to risks associated with doing business abroad, including:
| • | political unrest, terrorism, labor disputes and economic instability resulting in the disruption of trade from foreign countries in which our products are manufactured; |
|---|
| • | the imposition of new laws and regulations, including those relating to labor conditions, quality and safety standards, imports, duties, taxes and other charges on imports, as well as trade restrictions and restrictions on currency exchange or the transfer of funds; |
|---|
| • | reduced protection for intellectual property rights, including trademark protection, in some countries, particularly China; |
|---|
| • | disruptions or delays in shipments; and |
|---|
| • | changes in local economic conditions in countries where our manufacturers, suppliers or guests are located. |
|---|
These and other factors beyond our control could interrupt our suppliers’ production in offshore facilities, influence the ability of our suppliers to export our products cost-effectively or at all and inhibit our suppliers’ ability to procure certain materials, any of which could harm our business, financial condition and results of operations.
Our ability to source our merchandise profitably or at all could be hurt if new trade restrictions are imposed or existing trade restrictions become more burdensome.
The United States and the countries in which our products are produced or sold internationally have imposed and may impose additional quotas, duties, tariffs, or other restrictions or regulations, or may adversely adjust prevailing quota, duty or tariff levels. For example, under the provisions of the World Trade Organization, or the WTO, Agreement on Textiles and Clothing, effective as of January 1, 2005, the United States and other WTO member countries eliminated quotas on textiles and apparel-related products from WTO member countries. In 2005, China’s exports into the United States surged as a result of the eliminated quotas. In response to the perceived disruption of the market, the United States imposed new quotas, which remained in place through the end of 2008, on certain categories of natural-fiber products that we import from China. These quotas were lifted on January 1, 2009, but we have expanded our relationships with suppliers outside of China, which among other things has resulted in increased costs and shipping times for some products. Countries impose, modify and remove tariffs and other trade restrictions in response to a diverse array of factors, including global and national economic and political conditions, which make it impossible for us to predict future developments regarding tariffs and other trade restrictions. Trade restrictions, including tariffs, quotas, embargoes, safeguards and customs restrictions, could increase the cost or reduce the supply of products available to us or may require us to modify our supply chain organization or other current business practices, any of which could harm our business, financial condition and results of operations.
Our trademarks and other proprietary rights could potentially conflict with the rights of others and we may be prevented from selling some of our products.
Our success depends in large part on our brand image. We believe that our trademarks and other proprietary rights have significant value and are important to identifying and differentiating our products from those of our competitors and creating and sustaining demand for our products. We have obtained and applied for some United States and foreign trademark registrations, and will continue to evaluate the registration of additional trademarks
Table of Contents
as appropriate. However, we cannot guarantee that any of our pending trademark applications will be approved by the applicable governmental authorities. Moreover, even if the applications are approved, third parties may seek to oppose or otherwise challenge these registrations. Additionally, we cannot assure you that obstacles will not arise as we expand our product line and the geographic scope of our sales and marketing. Third parties may assert intellectual property claims against us, particularly as we expand our business and the number of products we offer. Our defense of any claim, regardless of its merit, could be expensive and time consuming and could divert management resources. Successful infringement claims against us could result in significant monetary liability or prevent us from selling some of our products. In addition, resolution of claims may require us to redesign our products, license rights from third parties or cease using those rights altogether. Any of these events could harm our business and cause our results of operations, liquidity and financial condition to suffer.
Our founder controls a significant percentage of our stock and is able to exercise significant influence over our affairs.
Our founder, Dennis Wilson, beneficially owns approximately 29% of our common stock. As a result, Mr. Wilson is able to influence or control matters requiring approval by our stockholders, including the election of directors and the approval of mergers, acquisitions or other extraordinary transactions. This concentration of ownership may have various effects including, but not limited to, delaying, preventing or deterring a change of control of our company.
Anti-takeover provisions of Delaware law and our certificate of incorporation and bylaws could delay and discourage takeover attempts that stockholders may consider to be favorable.
Certain provisions of our certificate of incorporation and bylaws and applicable provisions of the Delaware General Corporation Law may make it more difficult or impossible for a third-party to acquire control of us or effect a change in our board of directors and management. These provisions include:
| • | the classification of our board of directors into three classes, with one class elected each year; |
|---|
| • | prohibiting cumulative voting in the election of directors; |
|---|
| • | the ability of our board of directors to issue preferred stock without stockholder approval; |
|---|
| • | the ability to remove a director only for cause and only with the vote of the holders of at least 66 2/3% of our voting stock; |
|---|
| • | a special meeting of stockholders may only be called by our chairman or Chief Executive Officer, or upon a resolution adopted by an affirmative vote of a majority of the board of directors, and not by our stockholders; |
|---|
| • | prohibiting stockholder action by written consent; and |
|---|
| • | our stockholders must comply with advance notice procedures in order to nominate candidates for election to our board of directors or to place stockholder proposals on the agenda for consideration at any meeting of our stockholders. |
|---|
In addition, we are governed by Section 203 of the Delaware General Corporation Law which, subject to some specified exceptions, prohibits “business combinations” between a Delaware corporation and an “interested stockholder,” which is generally defined as a stockholder who becomes a beneficial owner of 15% or more of a Delaware corporation’s voting stock, for a three-year period following the date that the stockholder became an interested stockholder. Section 203 could have the effect of delaying, deferring or preventing a change in control that our stockholders might consider to be in their best interests.
Table of Contents
Item 2. PROPERTIES
| --- | --- |
Our principal executive and administrative offices are located at 1818 Cornwall Avenue, Vancouver, British Columbia, Canada, V6J 1C7. We expect that our current administrative offices are sufficient for our expansion plans for the foreseeable future. In March 2011, we purchased the building that currently houses our administrative offices and in October 2012 we purchased additional space in Vancouver, BC for our administrative offices. We currently operate three distribution centers located in Vancouver, British Columbia, Sumner, Washington, and Melbourne, Victoria which together are capable of accommodating our expansion plans through the foreseeable future.
The general location, use, approximate size and lease renewal date of our properties at February 3, 2013, are set forth below:
| Location | Use | Approximate Square Feet | Lease Renewal Date | |||||
| Sumner, WA | Distribution Center | 167,000 | April 2020 | |||||
| Vancouver, BC | Distribution Center | 120,000 | November 2017 | |||||
| Vancouver, BC | Executive and Administrative Offices | 78,000 | n/a | |||||
| Vancouver, BC | Executive and Administrative Offices | 15,000 | n/a | |||||
| Melbourne, VIC | Distribution Center | 54,000 | September 2016 | |||||
| Melbourne, VIC | Executive and Administrative Offices | 19,000 | September 2013 |
As of February 3, 2013, we leased approximately 596,000 gross square feet relating to 209 of our 211 corporate-owned stores. Our leases generally have initial terms of between five and 10 years, and generally can be extended only in five-year increments, if at all. All of our leases require a fixed annual rent, and most require the payment of additional rent if store sales exceed a negotiated amount. Generally, our leases are “net” leases, which require us to pay all of the cost of insurance, taxes, maintenance and utilities. We generally cannot cancel these leases at our option.
| ITEM | 3. LEGAL PROCEEDINGS |
|---|
On October 12, 2012, former hourly employees of lululemon filed a class action lawsuit in the Superior Court of the State of California entitled Rebekah Geare et al v. lululemon athletica inc. The lawsuit alleges that we violated various U.S. labor codes by failing to provide meal and rest breaks, failing to pay minimum wage, failing to pay overtime, failing to pay certain wages , failing to provide reasonable seating and failing to provide unpaid vacation times as wages at time of termination. The plaintiffs are seeking an unspecified amount of damages. We intend to vigorously defend the matter.
On August 10, 2012, customers of lululemon filed a class action lawsuit in San Diego Superior Court entitled Laura Chaikin et al v. lululemon athletica inc. The lawsuit alleges that we violated California Civil Code sections by requesting and capturing personal information from guests in our stores. The plaintiffs are seeking an unspecified amount of damages. We intend to vigorously defend the matter.
We are, from time to time, involved in routine legal matters incidental to our business. Management believes that the ultimate resolution of any such current proceeding will not have a material adverse effect on our continued financial position, results of operations or cash flows.
Table of Contents
PART II
Item 5. MARKET FOR REGISTRANT’S COMMON EQUITY, RELATED STOCKHOLDER MATTERS AND ISSUER PURCHASES OF EQUITY SECURITIES
| --- | --- |
Market Information and Dividends
Our common stock is quoted on the Nasdaq Global Select Market under the symbol “LULU” and on the Toronto Stock Exchange under the symbol “LLL.” The following table sets forth, for the periods indicated, the high and low closing sale prices (adjusted to account for our two-for-one stock split that became legally effective July 1, 2011) of our common stock reported by the Nasdaq Global Select Market for the last two fiscal years:
| Common Stock Price (Nasdaq Global Select Market) | ||||||||
| High | Low | |||||||
| Fiscal Year Ending February 3, 2013 | ||||||||
| Fourth Quarter | $ | 77.19 | $ | 65.87 | ||||
| Third Quarter | $ | 77.99 | $ | 53.35 | ||||
| Second Quarter | $ | 80.30 | $ | 54.40 | ||||
| First Quarter | $ | 77.06 | $ | 63.13 | ||||
| Fiscal Year Ending January 29, 2012 | ||||||||
| Fourth Quarter | $ | 64.12 | $ | 43.61 | ||||
| Third Quarter | $ | 62.15 | $ | 44.80 | ||||
| Second Quarter | $ | 63.76 | $ | 41.54 | ||||
| First Quarter | $ | 51.08 | $ | 34.34 |
As of February 3, 2013, there were approximately 398 holders of record of our common stock.
We have never declared or paid any cash dividends on our common stock and do not anticipate paying any cash dividends on our common stock in the foreseeable future. We anticipate that we will retain all of our available funds for use in the operation and expansion of our business. Any future determination as to the payment of cash dividends will be at the discretion of our board of directors and will depend on our financial condition, operating results, current and anticipated cash needs, plans for expansion and other factors that our board of directors considers to be relevant. In addition, financial and other covenants in any instruments or agreements that we enter into in the future may restrict our ability to pay cash dividends on our common stock.
Stock Performance Graph
The graph set forth below compares the cumulative total stockholder return on our common stock between February 3, 2008 (the date of our fiscal year end five years ago) and February 3, 2013, with the cumulative total return of (i) the S&P 500 Index and (ii) S&P 500 Apparel, Accessories & Luxury Goods Index(1), over the same period. This graph assumes the investment of $100 on February 3, 2008 in the closing sale price our common stock, the S&P 500 Index and the S&P Apparel, Accessories & Luxury Goods Index and assumes the reinvestment of dividends, if any.
The comparisons shown in the graph below are based on historical data. We caution that the stock price performance showing in the graph below is not necessarily indicative of, nor is it intended to forecast, the potential future performance of our common stock. Information used in the graph was obtained from the Nasdaq Stock Market website, a source believed to be reliable, but we are not responsible for any errors or omissions in such information.
| (1) | The previously compared, S&P Retail Index is no longer published at February 3, 2013. |
|---|
Table of Contents
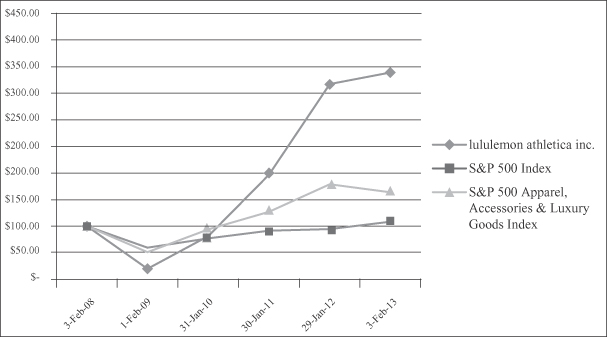
| 3-Feb-08 | 1-Feb-09 | 31-Jan-10 | 30-Jan-11 | 29-Jan-12 | 03-Feb-13 | |||||||||||||||||||
| lululemon athletica inc | $ | 100.00 | $ | 19.48 | $ | 80.92 | $ | 196.62 | $ | 367.45 | $ | 388.88 | ||||||||||||
| S&P 500 Index | $ | 100.00 | $ | 59.19 | $ | 76.96 | $ | 91.47 | $ | 94.33 | $ | 108.44 | ||||||||||||
| S&P 500 Apparel, Accessories & Luxury Goods Index | $ | 100.00 | $ | 50.63 | $ | 93.94 | $ | 127.05 | $ | 178.78 | $ | 163.65 |
Issuer Purchase of Equity Securities
The following table provides information regarding our Employee Share Purchase Plan (ESPP) repurchases of our common stock, on a post-split basis, during the fourteen week period ended February 3, 2013:
| Period(1) | Total Number of Shares Purchased | Average Price Paid per Share | Total Number of Shares Purchased as Part of Publicly Announced Plans or Programs(2) | Maximum Number of Shares that May Yet Be Purchased Under the Plans or Programs(2) | ||||||||||||
| October 29, 2012 – November 25, 2012 | 6,349 | $ | 69.70 | 6,349 | 5,538,071 | |||||||||||
| November 26, 2012 – December 30, 2012 | 6,141 | 73.93 | 6,141 | 5,531,930 | ||||||||||||
| December 31, 2012 – February 3, 2013 | 10,007 | 68.38 | 10,007 | 5,521,923 | ||||||||||||
| Total | 22,497 | 22,497 | ||||||||||||||
| (1) | Monthly information is presented by reference to our fiscal months during our fourth quarter of fiscal 2012. |
|---|
| (2) | Our ESPP was approved by our Board of Directors and stockholders in September 2007. All shares purchased under the ESPP will be purchased on the Toronto Stock Exchange or the Nasdaq Global Select Market (or such other stock exchange as we may designate from time to time). Unless our Board of Directors terminates the ESPP earlier, the ESPP will continue until all shares authorized for purchase under the ESPP have been purchased. The maximum number of shares available for issuance under the ESPP is 6,000,000. |
|---|
Table of Contents
Item 6. SELECTED CONSOLIDATED FINANCIAL DATA
| --- | --- |
The selected consolidated financial data set forth below are derived from our consolidated financial statements and should be read in conjunction with our consolidated financial statements the years February 3, 2013, January 29, 2012, January 30, 2011, January 31, 2010 and February 1, 2009. The consolidated statement of operations and comprehensive income data for each of the years ended February 3, 2013, January 29, 2012 and January 30, 2011and the consolidated balance sheet data as of February 3, 2013 and January 29, 2012 are derived from, and qualified by reference to, our audited consolidated financial statements and related notes appearing elsewhere in this Annual Report. The consolidated statement of operations and comprehensive income for the year ended February 3, 2013 covers a 53 week period compared to a 52 week period for the other years.
| Fiscal Year Ended | ||||||||||||||||||||
| February 3, 2013 | January 29, 2012 | January 30, 2011 | January 31, 2010 | February 1, 2009 | ||||||||||||||||
| (In thousands, except per share data) | ||||||||||||||||||||
| Consolidated statement of operations and comprehensive income data: | ||||||||||||||||||||
| Net revenue | $ | 1,370,358 | $ | 1,000,839 | $ | 711,704 | $ | 452,898 | $ | 353,488 | ||||||||||
| Cost of goods sold | 607,532 | 431,488 | 316,757 | 229,812 | 174,421 | |||||||||||||||
| Gross profit | 762,826 | 569,351 | 394,947 | 223,086 | 179,067 | |||||||||||||||
| Operating expenses: | ||||||||||||||||||||
| Selling, general and administrative expenses | 386,387 | 282,393 | 212,784 | 136,161 | 118,098 | |||||||||||||||
| Provision for impairment and lease exit costs | — | — | 1,722 | 379 | 4,405 | |||||||||||||||
| Income from operations | 376,439 | 286,958 | 180,391 | 86,546 | 56,564 | |||||||||||||||
| Other income (expense), net | 4,957 | 2,500 | 2,886 | 164 | 821 | |||||||||||||||
| Income before provision for income taxes | 381,396 | 289,458 | 183,277 | 86,710 | 57,385 | |||||||||||||||
| Provision for income taxes | 109,965 | 104,494 | 61,080 | 28,429 | 16,884 | |||||||||||||||
| Net income | 271,431 | 184,964 | 122,197 | 58,281 | 40,501 | |||||||||||||||
| Net income attributable to non-controlling interest | 875 | 901 | 350 | — | — | |||||||||||||||
| Net loss from discontinued operations | — | — | — | — | (1,138 | ) | ||||||||||||||
| Net income attributable to lululemon athletica inc. | $ | 270,556 | $ | 184,063 | $ | 121,847 | $ | 58,281 | $ | 39,363 | ||||||||||
| Basic earnings (loss) per share | ||||||||||||||||||||
| Continuing operations | $ | 1.88 | $ | 1.29 | $ | 0.86 | $ | 0.41 | $ | 0.30 | ||||||||||
| Discontinued operations | — | — | — | — | (0.01 | ) | ||||||||||||||
| Net basic earnings per share | $ | 1.88 | $ | 1.29 | $ | 0.86 | $ | 0.41 | $ | 0.29 | ||||||||||
| Diluted earnings (loss) per share | ||||||||||||||||||||
| Continuing operations | $ | 1.85 | $ | 1.27 | $ | 0.85 | $ | 0.41 | $ | 0.29 | ||||||||||
| Discontinued operations | — | — | — | — | (0.01 | ) | ||||||||||||||
| Net diluted earnings per share | $ | 1.85 | $ | 1.27 | $ | 0.85 | $ | 0.41 | $ | 0.28 | ||||||||||
| Basic weighted-average number of shares outstanding | 144,000 | 143,196 | 141,720 | 140,502 | 137,422 | |||||||||||||||
| Diluted weighted-average number of shares outstanding | 145,806 | 145,278 | 143,858 | 141,898 | 141,884 | |||||||||||||||
| Other comprehensive income: | ||||||||||||||||||||
| Foreign currency translation adjustment | (459 | ) | 1,220 | 14,462 | 17,018 | (16,548 | ) | |||||||||||||
| Comprehensive income | $ | 270,097 | $ | 185,283 | $ | 136,309 | $ | 75,299 | $ | 22,815 | ||||||||||
| As of | ||||||||||||||||||||
| February 3, 2013 | January 29, 2012 | January 30, 2011 | January 31, 2010 | February 1, 2009 | ||||||||||||||||
| (In thousands) | ||||||||||||||||||||
| Consolidated balance sheet data: | ||||||||||||||||||||
| Cash and cash equivalents | $590,179 | $ | 409,437 | $ | 316,286 | $ | 159,573 | $ | 56,797 | |||||||||||
| Total assets | 1,051,078 | 734,634 | 499,302 | 307,258 | 211,636 | |||||||||||||||
| Total stockholders’ equity | 887,299 | 606,181 | 394,293 | 233,108 | 154,843 | |||||||||||||||
| Non-controlling interest | — | 4,805 | 3,904 | — | — |
Table of Contents
Item 7. MANAGEMENT’S DISCUSSION AND ANALYSIS OF FINANCIAL CONDITION AND RESULTS OF OPERATIONS
| --- | --- |
This discussion summarizes our consolidated operating results, financial condition and liquidity during the three-year period ending February 3, 2013. Our fiscal year ends on the Sunday closest to January 31 of the following year, typically resulting in a 52 week year, but occasionally giving rise to an additional week, resulting in a 53 week year. Fiscal 2012 is a 53 week year. Net sales numbers include results from the 53rd week; however, comparable stores sales calculations exclude the 53rd week. Fiscal 2012, 2011 and 2010 ended on February 3, 2013, January 29, 2012 and January 30, 2011, respectively. The following discussion and analysis should be read in conjunction with our consolidated financial statements and the related notes included elsewhere in this Annual Report on Form 10-K.
This discussion and analysis contains forward-looking statements based on current expectations that involve risks, uncertainties and assumptions, such as our plans, objectives, expectations and intentions set forth in the “Special Note Regarding Forward-Looking Statements.” Our actual results and the timing of events may differ materially from those anticipated in these forward looking statements as a result of various factors, including those set forth in the “Item 1A—Risk Factors” section and elsewhere in this Annual Report on Form 10-K.
Overview
Our results for fiscal 2012 demonstrate the ongoing success of our efforts to execute the goals we set at the end of last year. We committed to continued investment in our stores and our people, making infrastructure enhancements and funding working capital requirements, while remaining conscious of our discretionary spending. These goals included driving store productivity along with North American store build out and ecommerce, seeding international markets via a community, showroom and ecommerce model, and reinvesting in product innovation to create value and differentiation in our product lines and to enhance our leadership position for the long term. We continually assess the economic environment and market conditions when making decisions regarding timing of our investments.
Our investments in our stores and people were reflected in our comparable stores net revenue growth, which leveraged our fixed operating costs. We increased our store base through execution of our real estate strategy, when and where we saw opportunities for success. For example, we opened 37 new corporate-owned stores in North America, Australia, and New Zealand since fiscal 2011. Where we find opportunities for growth through opening showrooms, or other community presence efforts, we expect to expand our store base and therefore our business. Our growth strategy relies on positive comparable store sales and expansion in North America, particularly in the United States. We have also determined that international growth is an opportunity and are expanding our foothold in markets by establishing local community connections, distributing to strategic sales partners and opening showrooms where we feel our key guests are shopping.
Throughout fiscal 2012, we were able to grow our e-commerce business which has further increased our brand awareness and has made our product available in new markets, including those outside of North America. This sales channel offers a higher operating margin than our other segments and accounted for 16.1% of total revenue in the fourth quarter of fiscal 2012 compared to 13.5% of total revenue in the same period of the prior year. Continuing increases in traffic and conversion rates on our e-commerce website lead us to believe that there is potential for our direct to consumer segment to become an increasingly substantial part of our business and we plan to continue to commit a portion of our resources to further developing this channel. In fiscal 2012 we launched country and region specific websites in Australia, Europe and Asia to provide our online guests with local content, assortment and pricing.
In mid-March 2013, we determined that certain shipments of women’s black Luon bottoms received from our factories and available in our stores from March 1, 2013, did not meet our technical specifications. As we became aware of this issue, we pulled what we believe to be all of the affected items from our stores, showrooms
Table of Contents
and e-commerce sites and began working with our supplier to replace the fabric and with our other manufacturers to replace these items as quickly as possible. The lost revenue, additional costs expected to be incurred and the write down of affected product on hand from this issue will negatively impact our results from operations in Fiscal 2013.
We believe that our brand is recognized as premium in our offerings of run and yoga assortment, as well as a leader in technical fabrics and functionality. This has made our product desirable to our consumers and has driven demand, which we are able to meet given our increased product depth compared to last year. Delivering quality to our customers is a critical factor in our market place differentiation and removing items that do not meet our standards is key to maintaining our brand reputation. In fiscal 2013, we plan on investing in new and legacy information technology systems to develop new capabilities in our vertical retail strategy. We have recently added strong leadership in Quality Control, our Liason Office and our commercialization and development teams, and expect these people and other investments to solidify our quality consistency and our delivery capabilities. We believe our strong cash flow generation, solid balance sheet and healthy liquidity provide us with the financial flexibility to continue executing the initiatives which we believe will lead to quality growth.
Operating Segment Overview
lululemon is a designer and retailer of technical athletic apparel operating primarily in North America and Australia. Our yoga-inspired apparel is marketed under the lululemon athletica and ivivva athletica brand names. We offer a comprehensive line of apparel and accessories including fitness pants, shorts, tops and jackets designed for athletic pursuits such as yoga, running and general fitness, and dance-inspired apparel for female youth. As of February 3, 2013, our branded apparel was principally sold through 211 corporate-owned stores that are located in the United States, Canada, Australia and New Zealand and via our e-commerce websites through our direct to consumer sales channel. We believe our vertical retail strategy allows us to interact more directly with and gain insights from our customers while providing us with greater control of our brand. In fiscal 2012, 61% of our net revenue was derived from sales of our products in the United States, 34% of our net revenue was derived from the sales of our products in Canada and 5% of our net revenue was derived from sales of our products outside of North America. In fiscal 2011, 53% of our net revenue was derived from sales of our products in the United States, 43% of our net revenue was derived from the sales of our products in Canada and 4% of our net revenue was derived from sales of our products outside of North America. In fiscal 2010, 46% of our net revenue was derived from sales of our products in the United States, 52% of our net revenue was derived from the sales of our products in Canada and 2% of our net revenue was derived from sales of our products outside of North America.
Our net revenue increased from $1,000.8 million in fiscal 2011 to $1,370.4 million in fiscal 2012, representing a 37% increase. Our increase in net revenue from fiscal 2011 to fiscal 2012 resulted from the addition of 37 retail locations, and comparable store sales growth of 16% in fiscal 2012, excluding the impact of the 53rd week. Our ability to open new stores and grow sales in existing stores has been driven by increasing demand for our technical a
Showing the first 8K of 81K characters. Open the full section
Item 7A. QUANTITATIVE AND QUALITATIVE DISCLOSURES ABOUT MARKET RISK
| --- | --- |
Market risk represents the risk of loss that may impact our financial position due to adverse changes in financial market prices and rates. Our market risk exposure is primarily a result of fluctuations in interest rates and foreign currency exchange rates. We do not hold or issue financial instruments for trading purposes.
Foreign Currency Exchange Risk. We currently generate a significant portion of our net revenue in Canada. The reporting currency for our consolidated financial statements is the U.S. dollar. Historically, our operations were based largely in Canada. As of February 3, 2013, we operated 51 stores in Canada. As a result, we have been impacted by changes in exchange rates and may be impacted materially for the foreseeable future. As we recognize net revenue from sales in Canada in Canadian dollars, and the U.S. dollar has strengthened during fiscal 2012, it has had a negative impact on our Canadian operating results upon translation of those results into U.S. dollars for the purposes of consolidation. However, the loss in net revenue was partially offset by lower cost of sales and lower selling, general and administrative expenses that are generated in Canadian dollars. A 10% depreciation in the relative value of the Canadian dollar compared to the U.S. dollar would have resulted in lost income from operations of approximately $28.0 million in fiscal 2012 and approximately $15.4 million in fiscal 2011. To the extent the ratio between our net revenue generated in Canadian dollars increases as compared to our expenses generated in Canadian dollars, we expect that our results of operations will be further impacted by changes in exchange rates. A portion of our net revenue is generated in Australia. A 10% depreciation in the relative value of the Australian dollar compared to the U.S. dollar would have resulted in lost income from operations of approximately $0.9 million in fiscal 2012 and $0.4 million in fiscal 2011. We do not currently hedge foreign currency fluctuations. However, in the future, in an effort to mitigate losses associated with these risks, we may at times enter into derivative financial instruments, although we have not historically done so. We do not, and do not intend to, engage in the practice of trading derivative securities for profit.
Interest Rate Risk. In April 2007, we entered into an uncommitted senior secured demand revolving credit facility with Royal Bank of Canada. The revolving credit facility provides us with available borrowings in an amount up to CDN$20.0 million. Because our revolving credit facility bears interest at a variable rate, we will be exposed to market risks relating to changes in interest rates, if we have a meaningful outstanding balance. As of February 3, 2013, we had no outstanding borrowings under our revolving facility. We had small outstanding balances under our revolving facility during fiscal 2012 as we built inventory and working capital for the holiday selling season, but we do not believe we are significantly exposed to changes in interest rate risk. We currently do not engage in any interest rate hedging activity and currently have no intention to do so in the foreseeable future. However, in the future, if we have a meaningful outstanding balance under our revolving facility, in an effort to mitigate losses associated with these risks, we may at times enter into derivative financial instruments, although we have not historically done so. These may take the form of forward sales contracts, option contracts, and interest rate swaps. We do not, and do not intend to, engage in the practice of trading derivative securities for profit.
Inflation
Inflationary factors such as increases in the cost of our product and overhead costs may adversely affect our operating results. Although we do not believe that inflation has had a material impact on our financial position or results of operations to date, a high rate of inflation in the future may have an adverse effect on our ability to maintain current levels of gross margin and selling, general and administrative expenses as a percentage of net revenue if the selling prices of our products do not increase with these increased costs.
Table of Contents
Item 8. FINANCIAL STATEMENTS AND SUPPLEMENTARY DATA
| --- | --- |
lululemon athletica inc. and Subsidiaries
INDEX TO CONSOLIDATED FINANCIAL STATEMENTS
Table of Contents
REPORT OF INDEPENDENT REGISTERED PUBLIC ACCOUNTING FIRM
To the Board of Directors and Stockholders of lululemon athletica inc.
In our opinion, the accompanying consolidated balance sheets and the related consolidated statements of operations and comprehensive income, stockholders’ equity and cash flows present fairly, in all material respects, the financial position of lululemon athletica inc. and its subsidiaries as at February 3, 2013 and January 29, 2012, and the results of their operations and their cash flows for the three years ended February 3, 2013, January 29, 2012 and January 30, 2011 in conformity with accounting principles generally accepted in the United States of America. In addition, in our opinion, the financial statement schedule listed in the index appearing under Item 15(a) presents fairly, in all material respects, the information set forth therein when read in conjunction with the related consolidated financial statements. Also in our opinion, the Company maintained, in all material respects, effective internal control over financial reporting as of February 3, 2013, based on criteria established in Internal Control—Integrated Framework issued by the Committee of Sponsoring Organizations of the Treadway Commission (COSO). The Company’s management is responsible for these financial statements and financial statement schedule, for maintaining effective internal control over financial reporting and for its assessment of the effectiveness of internal control over financial reporting, included in Management’s Annual Report on Internal Control over Financial Reporting appearing under Item 9A. Our responsibility is to express opinions on these financial statements, on the financial statement schedule, and on the Company’s internal control over financial reporting based on our integrated audits. We conducted our audits in accordance with the standards of the Public Company Accounting Oversight Board (United States). Those standards require that we plan and perform the audits to obtain reasonable assurance about whether the financial statements are free of material misstatement and whether effective internal control over financial reporting was maintained in all material respects. Our audits of the financial statements included examining, on a test basis, evidence supporting the amounts and disclosures in the financial statements, assessing the accounting principles used and significant estimates made by management, and evaluating the overall financial statement presentation. Our audit of internal control over financial reporting included obtaining an understanding of internal control over financial reporting, assessing the risk that a material weakness exists, and testing and evaluating the design and operating effectiveness of internal control based on the assessed risk. Our audits also included performing such other procedures as we considered necessary in the circumstances. We believe that our audits provide a reasonable basis for our opinions.
A company’s internal control over financial reporting is a process designed to provide reasonable assurance regarding the reliability of financial reporting and the preparation of financial statements for external purposes in accordance with generally accepted accounting principles. A company’s internal control over financial reporting includes those policies and procedures that (i) pertain to the maintenance of records that, in reasonable detail, accurately and fairly reflect the transactions and dispositions of the assets of the company; (ii) provide reasonable assurance that transactions are recorded as necessary to permit preparation of financial statements in accordance with generally accepted accounting principles, and that receipts and expenditures of the company are being made only in accordance with authorizations of management and directors of the company; and (iii) provide reasonable assurance regarding prevention or timely detection of unauthorized acquisition, use, or disposition of the company’s assets that could have a material effect on the financial statements.
Because of its inherent limitations, internal control over financial reporting may not prevent or detect misstatements. Also, projections of any evaluation of effectiveness to future periods are subject to the risk that controls may become inadequate because of changes in conditions, or that the degree of compliance with the policies or procedures may deteriorate.
| /s/ PricewaterhouseCoopers LLP |
| Chartered Accountants |
| Vancouver, BC |
March 20, 2013
Table of Contents
lululemon athletica inc. and Subsidiaries
CONSOLIDATED BALANCE SHEETS
| February 3, 2013 | January 29, 2012 | |||||||
| (Amounts in thousands, except per share amounts) | ||||||||
| ASSETS | ||||||||
| Current assets | ||||||||
| Cash and cash equivalents | $ | 590,179 | $ | 409,437 | ||||
| Accounts receivable | 6,351 | 5,202 | ||||||
| Inventories | 155,222 | 104,097 | ||||||
| Prepaid expenses and other current assets | 35,301 | 8,357 | ||||||
| 787,053 | 527,093 | |||||||
| Property and equipment, net | 214,639 | 162,941 | ||||||
| Goodwill and intangible assets, net | 30,201 | 31,872 | ||||||
| Deferred income taxes | 15,033 | 8,587 | ||||||
| Other non-current assets | 4,152 | 4,141 | ||||||
| $ | 1,051,078 | $ | 734,634 | |||||
| LIABILITIES AND STOCKHOLDERS’ EQUITY | ||||||||
| Current liabilities | ||||||||
| Accounts payable | $ | 1,045 | $ | 14,536 | ||||
| Accrued liabilities | 30,032 | 34,535 | ||||||
| Accrued compensation and related expenses | 27,530 | 22,875 | ||||||
| Income taxes payable | 39,637 | 8,720 | ||||||
| Unredeemed gift card liability | 35,113 | 22,773 | ||||||
| 133,357 | 103,439 | |||||||
| Non-current liabilities | 30,422 | 25,014 | ||||||
| 163,779 | 128,453 | |||||||
| Stockholders’ equity | ||||||||
| Undesignated preferred stock, $0.01 par value, 5,000 shares authorized, none issued and outstanding | — | — | ||||||
| Exchangeable stock, no par value, 60,000 shares authorized, issued and outstanding 32,065 and 33,412 | — | — | ||||||
| Special voting stock, $0.000005 par value, 60,000 shares authorized, issued and outstanding 32,065 and 33,412 | — | — | ||||||
| Common stock, $0.005 par value, 400,000 shares authorized, issued and outstanding 112,371 and 110,135 | 562 |
Showing the first 8K of 92K characters. Open the full section
Item 9A. CONTROLS AND PROCEDURES
| --- | --- |
Evaluation of Disclosure Controls and Procedures
Under the supervision and with the participation of our management, including our principal executive officer and principal financial officer, we conducted an evaluation of the effectiveness of the design and operation of our disclosure controls and procedures, as defined in Rules 13a-15(e) and 15d-15(e) under the Securities Exchange Act of 1934, as amended, or the Exchange Act, as of the end of the period covered by this report, or the Evaluation Date. Based upon the evaluation, our principal executive officer and principal financial officer concluded that our disclosure controls and procedures were effective as of the Evaluation Date. Disclosure controls and procedures are controls and procedures designed to reasonably ensure that information required to be disclosed in our reports filed under the Exchange Act, such as this report, is recorded, processed, summarized and reported within the time periods specified in the SEC’s rules and forms. Disclosure controls and procedures include controls and procedures designed to reasonably ensure that such information is accumulated and communicated to our management, including our chief executive officer and chief financial officer, as appropriate to allow timely decisions regarding required disclosure.
Inherent Limitations Over Internal Controls
Our internal control over financial reporting is designed to provide reasonable assurances regarding the reliability of financial reporting and the preparation of financial statements for external purposes in accordance with generally accepted accounting principles. Our internal control over financial reporting includes those policies and procedures that (i) pertain to the maintenance of records that, in reasonable detail, accurately and fairly reflect the transactions and dispositions of our assets; (ii) provide reasonable assurance that transactions are recorded as necessary to permit preparation of financial statements in accordance with generally accepted accounting principles, and that our receipts and expenditures are being made only in accordance with authorizations of our management and directors; and (iii) provide reasonable assurance regarding prevention or timely detection of unauthorized acquisition, use, or disposition of our assets that could have a material effect on the financial statements. Management, including our principal executive officer and principal financial officer, does not expect that our internal controls will prevent or detect all errors and all fraud. A control system, no matter how well designed and operated, can provide only reasonable, not absolute, assurance that the objectives of the control system are met. Further, the design of a control system must reflect the fact that there are resource limitations on all control systems, no evaluation of internal controls can provide absolute assurance that all control issues and instances of fraud, if any, have been detected. Also, any evaluation of the effectiveness of controls in future periods are subject to the risk that those internal controls may become inadequate because of changes in business conditions, or that the degree of compliance with the policies and procedures may deteriorate.
Management’s Annual Report on Internal Control Over Financial Reporting
Management is responsible for establishing and maintaining adequate internal control over financial reporting (as defined in Rule 13a-15(f) under the Securities Exchange Act of 1934, as amended). Management conducted an evaluation of the effectiveness of our internal control over financial reporting based on the criteria set forth in Internal Control—Integrated Framework issued by the Committee of Sponsoring Organizations of the Treadway Commission, or COSO. Based on this evaluation, management concluded that we maintained effective internal control over financial reporting as of February 3, 2013. The effectiveness of our internal control over financial reporting as of February 3, 2013 has been audited by PricewaterhouseCoopers LLP our independent auditors, who have expressed an opinion in their report on page 44 of this Form 10-K.
Table of Contents
Changes in Internal Control Over Financial Reporting
There were no changes in our internal control over financial reporting during the fourth quarter of the fiscal year ended February 3, 2013, which were identified in connection with management’s evaluation required by Rules 13a-15(d) and 15d-15(d) under the Securities Exchange Act of 1934, as amended, that have materially affected, or are reasonably likely to materially affect, our internal control over financial reporting.
Table of Contents
PART III
Item 10. DIRECTORS, EXECUTIVE OFFICERS AND CORPORATE GOVERNANCE
| --- | --- |
The information required by this item concerning our directors, director nominees and Section 16 beneficial ownership reporting compliance is incorporated by reference to our definitive Proxy Statement for our 2012 Annual Meeting of Stockholders under the captions “Election of Directors,” “Section 16(a) Beneficial Ownership Reporting Compliance,” “Executive Officers” and “Corporate Governance.”
We have adopted a written code of business conduct and ethics, which applies to all of our directors, officers and employees, including our principal executive officer and our principal financial and accounting officer. Our Code of Business Conduct and Ethics is available on our internet website, www.lululemon.com and can be obtained by writing to Investor Relations, lululemon athletica inc., 1818 Cornwall Avenue, Vancouver, British Columbia, Canada V6J 1C7 or by sending an email to investor@lululemon.com. The information contained on our website is not incorporated by reference into this Annual Report on Form 10-K. Any amendments, other than technical, administrative or other non-substantive amendments, to our Code of Business Conduct and Ethics or waivers from the provisions of the Code of Business Conduct and Ethics for our principal executive officer and our principal financial and accounting officer will be disclosed on our internet website within four business days following the date of such amendment or waiver.
Item 11. EXECUTIVE COMPENSATION
| --- | --- |
The information required by this item is incorporated by reference to our 2013 Proxy Statement under the captions “Executive Compensation” and “Other Forms of Compensation.”
Item 12. SECURITY OWNERSHIP OF CERTAIN BENEFICIAL OWNERS AND MANAGEMENT AND RELATED STOCKHOLDER MATTERS
| --- | --- |
The information required by this item is incorporated by reference to our 2013 Proxy Statement under the caption “Security Ownership of Certain Beneficial Owners and Directors and Officers.”
Equity Compensation Plan Information (as of February 3, 2013)
| Plan Category | Number of Securities to be Issued Upon Exercise of Outstanding Options | Weighted-Average Exercise Price of Outstanding Options | Number of Securities Remaining Available for Future Issuance Under Equity Compensation Plans(1) | |||||||||
| Equity compensation plans approved by stockholders | 1,377,030 | $ | 19.51 | 14,832,290 | ||||||||
| Equity compensation plans not approved by stockholders | — | — | — | |||||||||
| Total | 1,377,030 | $ | 19.51 | 14,832,290 | ||||||||
| (1) | This amount represents 9,310,367 shares of our common stock available for future issuance pursuant to stock options available for grant under our 2007 Equity Incentive Plan and 5,521,923 shares of our common stock available for future issuance pursuant to our Employee Share Purchase Plan. |
|---|
Table of Contents
Item 13. CERTAIN RELATIONSHIPS AND RELATED TRANSACTIONS, AND DIRECTOR INDEPENDENCE
| --- | --- |
The information required by this item is incorporated by reference to our 2013 Proxy Statement under the captions “Certain Relationships and Related Transactions” and “Corporate Governance.”
Item 14. PRINCIPAL ACCOUNTANT FEES AND SERVICES
| --- | --- |
The information required by this item is incorporated by reference to our 2013 Proxy Statement under the caption “Fees for Professional Services.”
Table of Contents
PART IV
Item 15. EXHIBITS AND FINANCIAL STATEMENT SCHEDULE
| --- | --- |
(a) Documents filed as part of this report:
-
Financial Statements. The financial statements as set forth under Item 8 of this Annual Report on Form 10-K are incorporated herein.
-
Financial Statement Schedule.
Schedule II
Valuation and Qualifying Accounts
| Description | Balance at Beginning of Year | Charged to Costs and Expenses | Write-offs Net of Recoveries | Balance at End of Year | ||||||||||||
| (In thousands) | ||||||||||||||||
| Shrink Provision on Finished Goods | ||||||||||||||||
| For the year ended January 30, 2011 | $ | (1,313 | ) | (2,881 | ) | 2,751 | (1,443 | ) | ||||||||
| For the year ended January 29, 2012 | (1,443 | ) | (1,752 | ) | 2,069 | (1,126 | ) | |||||||||
| For the year ended February 3, 2013 | (1,126 | ) | (2,823 | ) | 2,949 | (1,000 | ) | |||||||||
| Slow Moving and Obsolescence Provision on Finished Goods and Raw Materials | ||||||||||||||||
| For the year ended January 30, 2011 | $ | (961 | ) | (284 | ) | 107 | (1,138 | ) | ||||||||
| For the year ended January 29, 2012 | (1,138 | ) | (2,212 | ) | 864 | (2,486 | ) | |||||||||
| For the year ended February 3, 2013 | (2,486 | ) | (7,232 | ) | 2,868 | (6,850 | ) | |||||||||
| Damage Provision on Finished Goods | ||||||||||||||||
| For the year ended January 30, 2011 | $ | (298 | ) | (1,610 | ) | 907 | (1,001 | ) | ||||||||
| For the year ended January 29, 2012 | (1,001 | ) | (1,551 | ) | 2,269 | (283 | ) | |||||||||
| For the year ended February 3, 2013 | (283 | ) | (3,727 | ) | 3,491 | (519 | ) | |||||||||
| Sales Allowances | ||||||||||||||||
| For the year ended January 30, 2011 | $ | 307 | 215 | — | 522 | |||||||||||
| For the year ended January 29, 2012 | 522 | 392 | — | 914 | ||||||||||||
| For the year ended February 3, 2013 | 914 | 914 | — | 1,828 | ||||||||||||
| Valuation Allowance on Deferred Income Taxes | ||||||||||||||||
| For the year ended January 30, 2011 | $ | (100 | ) | 2 | — | (98 | ) | |||||||||
| For the year ended January 29, 2012 | (98 | ) | 7 | — | (91 | ) | ||||||||||
| For the year ended February 3, 2013 | (91 | ) | — | — | (91 | ) |
Table of Contents
- Exhibits
Exhibit Index
| Incorporated by Reference | ||||||||||||||||||||
| Exhibit No. | Exhibit Title | Filed Herewith | Form | Exhibit No. | File No. | Filing Date | ||||||||||||||
| 3.1 | Third Amended and Restated Certificate of Incorporation of lululemon athletica inc. | 8-K | 3.1 | 001-33608 | 3/31/2009 | |||||||||||||||
| 3.2 | Certificate of Amendment to Amended and Restated Certificate of Incorporation of lululemon athletica inc. | 8-K | 3.1 | 001-33608 | 7/01/2011 | |||||||||||||||
| 3.3 | Amended and Restated Bylaws of lululemon athletica inc. | 10-Q | 3.2 | 001-33608 | 9/10/2007 | |||||||||||||||
| 3.4 | Second Amended and Restated Bylaws of lululemon athletica inc. | 8-K | 3.1 | 001-33608 | 4/2/2008 | |||||||||||||||
| 3.5 | Third Amended and Restated Bylaws of lululemon athletica inc. | 8-K | 3.1 | 001-33608 | 03/31/2009 | |||||||||||||||
| 4.1 | Form of Specimen Stock Certificate of lululemon athletica inc. | S-1/A | 4.1 | 001-33608 | 7/9/2007 | |||||||||||||||
| 10.1* | lululemon athletica inc. 2007 Equity Incentive Plan | S-8 | 4.1 | 001-33608 | 8/15/2007 | |||||||||||||||
| 10.2* | Form of Non-Qualified Stock Option Agreement (standard) | 10-Q | 10.1 | 001-33608 | 12/6/2012 | |||||||||||||||
| 10.3* | Form of Non-Qualified Stock Option Agreement (for outside directors) | 10-Q | 10.2 | 001-33608 | 12/6/2012 | |||||||||||||||
| 10.4* | Form of Non-Qualified Stock Option Agreement (with clawback provision) | 10-Q | 10.3 | 001-33608 | 12/6/2012 | |||||||||||||||
| 10.5* | Form of Notice of Grant of Performance Shares and Performance Shares Agreement | 10-Q | 10.4 | 001-33608 | 12/6/2012 | |||||||||||||||
| 10.6* | Form of Notice of Grant of Performance Shares and Performance Shares Agreement (with clawback provision) | 10-Q | 10.5 | 001-33608 | 12/6/2012 | |||||||||||||||
| 10.7* | Amended and Restated LIPO Investments (USA), Inc. Option Plan and form of Award Agreement | S-1 | 10.3 | 333-142477 | 5/1/2007 | |||||||||||||||
| 10.8 | Amended and Restated Registration Rights Agreement dated July 26, 2007 between lululemon athletica inc. and the parties named therein | 10-Q | 10.4 | 001-33608 | 9/10/2007 | |||||||||||||||
| 10.9 | Exchange Trust Agreement dated July 26, 2007 between lululemon athletica inc., Lulu Canadian Holding, Inc. and Computershare Trust Company of Canada | 10-Q | 10.5 | 001-33608 | 9/10/2007 |
Table of Contents
| Incorporated by Reference | ||||||||||||||||||||||
| Exhibit No. | Exhibit Title | Filed Herewith | Form | Exhibit No. | File No. | Filing Date | ||||||||||||||||
| 10.10 | Exchangeable Share Support Agreement dated July 26, 2007 between lululemon athletica inc., Lululemon Callco ULC and Lulu Canadian Holding, Inc. | 10-Q | 10.6 | 001-33608 | 9/10/2007 | |||||||||||||||||
| 10.11 | Amended and Restated Declaration of Trust for Forfeitable Exchangeable Shares dated July 26, 2007, by and among the parties named therein | 10-Q | 10.7 | 001-33608 | 9/10/2007 | |||||||||||||||||
| 10.12 | Amended and Restated Arrangement Agreement dated as of June 18, 2007, by and among the parties named therein (including Plan of Arrangement and Exchangeable Share Provisions) | S-1/A | 10.14 | 333-142477 | 7/9/2007 | |||||||||||||||||
| 10.13 | Credit Facility between lululemon canada inc. and Royal Bank of Canada dated as of April 11, 2007 | S-1 | 10.15 | 333-142477 | 5/1/2007 | |||||||||||||||||
| 10.14 | Form of Indemnification Agreement between lululemon athletica inc. and its directors and certain officers | S-1/A | 10.16 | 333-142477 | 7/9/2007 | |||||||||||||||||
| 10.15 | Purchase and Sale Agreement between 2725312 Canada Inc and lululemon athletica inc., dated December 22, 2010 | 10-K | 10.12 | 001-33608 | 3/17/2011 | |||||||||||||||||
| 10.16* | Outside Director Compensation Plan | X | ||||||||||||||||||||
| 10.17* | lululemon athletica inc. Employee Share Purchase Plan | 10-Q | 10.3 | 001-33608 | 11/29/2007 | |||||||||||||||||
| 10.18* | Executive Employment Agreement with Christine M. Day, dated effective as of August 1, 2008 | 8-K | 10.1 | 001-33608 | 7/30/2008 | |||||||||||||||||
| 10.19* | Executive Bonus Plan of lululemon athletica inc. | 8-K | 10.1 | 001-33608 | 3/19/2013 | |||||||||||||||||
| 10.20* | Amended Executive Employment Agreement, effective as of October 29, 2012 between lululemon athletica canada inc. and John E. Currie | X | ||||||||||||||||||||
| 10.21* | Executive Employment Agreement, effective as of March 24, 2010 between lululemon athletica canada inc. and Delaney Schweitzer | 10-K | 10.23 | 001-33608 | 3/25/2010 | |||||||||||||||||
| 10.22* | Executive Employment Agreement, effective as of March 24, 2010 between lululemon athletica canada inc. and Sheree Waterson | 10-K | 10.24 | 001-33608 | 3/25/2010 |
Table of Contents
| Incorporated by Reference | ||||||||||||||
| Exhibit No. | Exhibit Title | Filed Herewith | Form | Exhibit No. | File No. | Filing Date | ||||||||
| 21.1 | Subsidiaries of lululemon athletica inc. | X | ||||||||||||
| 23.1 | Consent of PricewaterhouseCoopers LLP | X | ||||||||||||
| 31.1 | Certification of Chief Executive Officer pursuant to Exchange Act Rules 13a-14(a) and 15d-14(a), as adopted pursuant to Section 302 of the Sarbanes-Oxley Act of 2002 | X | ||||||||||||
| 31.2 | Certification of Chief Financial Officer pursuant to Exchange Act Rules 13a-14(a) and 15d-14(a), as adopted pursuant to Section 302 of the Sarbanes-Oxley Act of 2002 | X | ||||||||||||
| 32.1 | Certification of Chief Executive Officer and Chief Financial Officer pursuant to 18 U.S.C. Section 1350, as adopted pursuant to Section 906 of the Sarbanes-Oxley Act of 2002 | X | ||||||||||||
| 101** | The following financial statements from the Company’s 10-K for the fiscal year ended February 3, 2013, formatted in XBRL: (i) Consolidated Balance Sheets, (ii) Consolidated Statements of Operations and Comprehensive Income, (iii) Consolidated Statements of Stockholders’ Equity, (iv) Consolidated Statements of Cash Flows (v) Notes to the Consolidated Financial Statements |
| * | Denotes a compensatory plan, contract or arrangement, in which our directors or executive officers may participate. |
|---|
| ** | Furnished herewith. |
|---|
Table of Contents
SIGNATURES
Pursuant to the requirements of Section 13 or 15(d) of the Securities Exchange Act of 1934, as amended, the registrant has duly caused this report to be signed on its behalf by the undersigned, thereunto duly authorized.
| LULULEMON ATHLETICA INC. | ||
| By: | /s/ CHRISTINE M. DAY | |
| Christine M. Day | ||
| Chief Executive Officer (Principal Executive Officer) |
KNOW ALL PERSONS BY THESE PRESENTS, that each person whose signature appears below constitutes and appoints Christine M. Day and John E. Currie and each of them, with full power of substitution and resubstitution and full power to act without the other, as his or her true and lawful attorney-in-fact and agent to act in his or her name, place and stead and to execute in the name and on behalf of each person, individually and in each capacity stated below, and to file, any and all documents in connection therewith, with the Securities and Exchange Commission, granting unto said attorneys-in-fact and agents, and each of them, full power and authority to do and perform each and every act and thing, ratifying and confirming all that said attorneys-in-fact and agents or any of them or their and his or her substitute or substitutes, may lawfully do or cause to be done by virtue thereof.
Pursuant to the requirements of the Securities Exchange Act of 1934, as amended, this report has been signed below by the following persons on behalf of the registrant and in the capacities and on the dates indicated:
| Signature | Title | Date | ||
| /s/ CHRISTINE M. DAY Christine M. Day | Director and Chief Executive Officer (Principal Executive Officer) | March 20, 2013 | ||
| /s/ JOHN E. CURRIE John E. Currie | Chief Financial Officer (Principal Financial and Accounting Officer) | March 20, 2013 | ||
| /s/ DENNIS J. WILSON Dennis J. Wilson | Chairman of the Board | March 20, 2013 | ||
| /s/ ROBERT BENSOUSSAN Robert Bensoussan | Director | March 20, 2013 | ||
| /s/ MICHAEL CASEY Michael Casey | Director | March 20, 2013 | ||
| /s/ ROANN COSTIN RoAnn Costin | Director | March 20, 2013 | ||
| /s/ WILLIAM H. GLENN William H. Glenn | Director | March 20, 2013 | ||
| /s/ MARTHA A.M. MORFITT Martha A.M. Morfitt | Director | March 20, 2013 | ||
| /s/ RHODA M. PITCHER Rhoda M. Pitcher | Director | March 20, 2013 | ||
| /s/ THOMAS G. STEMBERG Thomas G. Stemberg | Director | March 20, 2013 | ||
| /s/ JERRY STRITZKE Jerry Stritzke | Director | March 20, 2013 | ||
| /s/ EMILY WHITE Emily White | Director | March 20, 2013 |
Table of Contents
Exhibit Index
| Incorporated by Reference | ||||||||||||||||||||
| Exhibit No. | Exhibit Title | Filed Herewith | Form | Exhibit No. | File No. | Filing Date | ||||||||||||||
| 3.1 | Third Amended and Restated Certificate of Incorporation of lululemon athletica inc. | 8-K | 3.1 | 001-33608 | 3/31/2009 | |||||||||||||||
| 3.2 | Certificate of Amendment to Amended and Restated Certificate of Incorporation of lululemon athletica inc. | 8-K | 3.1 | 001-33608 | 7/01/2011 | |||||||||||||||
| 3.3 | Amended and Restated Bylaws of lululemon athletica inc. | 10-Q | 3.2 | 001-33608 | 9/10/2007 | |||||||||||||||
| 3.4 | Second Amended and Restated Bylaws of lululemon athletica inc. | 8-K | 3.1 | 001-33608 | 4/2/2008 | |||||||||||||||
| 3.5 | Third Amended and Restated Bylaws of lululemon athletica inc. | 8-K | 3.1 | 001-33608 | 03/31/2009 | |||||||||||||||
| 4.1 | Form of Specimen Stock Certificate of lululemon athletica inc. | S-1/A | 4.1 | 001-33608 | 7/9/2007 | |||||||||||||||
| 10.1* | lululemon athletica inc. 2007 Equity Incentive Plan | S-8 | 4.1 | 001-33608 | 8/15/2007 | |||||||||||||||
| 10.2* | Form of Non-Qualified Stock Option Agreement (standard) | 10-Q | 10.1 | 001-33608 | 12/6/2012 | |||||||||||||||
| 10.3* | Form of Non-Qualified Stock Option Agreement (for outside directors) | 10-Q | 10.2 | 001-33608 | 12/6/2012 | |||||||||||||||
| 10.4* | Form of Non-Qualified Stock Option Agreement (with clawback provision) | 10-Q | 10.3 | 001-33608 | 12/6/2012 | |||||||||||||||
| 10.5* | Form of Notice of Grant of Performance Shares and Performance Shares Agreement | 10-Q | 10.4 | 001-33608 | 12/6/2012 | |||||||||||||||
| 10.6* | Form of Notice of Grant of Performance Shares and Performance Shares Agreement (with clawback provision) | 10-Q | 10.5 | 001-33608 | 12/6/2012 | |||||||||||||||
| 10.7* | Amended and Restated LIPO Investments (USA), Inc. Option Plan and form of Award Agreement | S-1 | 10.3 | 333-142477 | 5/1/2007 | |||||||||||||||
| 10.8 | Amended and Restated Registration Rights Agreement dated July 26, 2007 between lululemon athletica inc. and the parties named therein | 10-Q | 10.4 | 001-33608 | 9/10/2007 | |||||||||||||||
| 10.9 | Exchange Trust Agreement dated July 26, 2007 between lululemon athletica inc., Lulu Canadian Holding, Inc. and Computershare Trust Company of Canada | 10-Q | 10.5 | 001-33608 | 9/10/2007 |
Table of Contents
| Incorporated by Reference | ||||||||||||||||||||||
| Exhibit No. | Exhibit Title | Filed Herewith | Form | Exhibit No. | File No. | Filing Date | ||||||||||||||||
| 10.10 | Exchangeable Share Support Agreement dated July 26, 2007 between lululemon athletica inc., Lululemon Callco ULC and Lulu Canadian Holding, Inc. | 10-Q | 10.6 | 001-33608 | 9/10/2007 | |||||||||||||||||
| 10.11 | Amended and Restated Declaration of Trust for Forfeitable Exchangeable Shares dated July 26, 2007, by and among the parties named therein | 10-Q | 10.7 | 001-33608 | 9/10/2007 | |||||||||||||||||
| 10.12 | Amended and Restated Arrangement Agreement dated as of June 18, 2007, by and among the parties named therein (including Plan of Arrangement and Exchangeable Share Provisions) | S-1/A | 10.14 | 333-142477 | 7/9/2007 | |||||||||||||||||
| 10.13 | Credit Facility between lululemon canada inc. and Royal Bank of Canada dated as of April 11, 2007 | S-1 | 10.15 | 333-142477 | 5/1/2007 | |||||||||||||||||
| 10.14 | Form of Indemnification Agreement between lululemon athletica inc. and its directors and certain officers | S-1/A | 10.16 | 333-142477 | 7/9/2007 | |||||||||||||||||
| 10.15 | Purchase and Sale Agreement between 2725312 Canada Inc and lululemon athletica inc., dated December 22, 2010 | 10-K | 10.12 | 001-33608 | 3/17/2011 | |||||||||||||||||
| 10.16* | Outside Director Compensation Plan | X | ||||||||||||||||||||
| 10.17* | lululemon athletica inc. Employee Share Purchase Plan | 10-Q | 10.3 | 001-33608 | 11/29/2007 | |||||||||||||||||
| 10.18* | Executive Employment Agreement with Christine M. Day, dated effective as of August 1, 2008 | 8-K | 10.1 | 001-33608 | 7/30/2008 | |||||||||||||||||
| 10.19* | Executive Bonus Plan of lululemon athletica inc. | 8-K | 10.1 | 001-33608 | 3/19/2013 | |||||||||||||||||
| 10.20* | Amended Executive Employment Agreement, effective as of October 29, 2012 between lululemon athletica canada inc. and John E. Currie | X | ||||||||||||||||||||
| 10.21* | Executive Employment Agreement, effective as of March 24, 2010 between lululemon athletica canada inc. and Delaney Schweitzer | 10-K | 10.23 | 001-33608 | 3/25/2010 | |||||||||||||||||
| 10.22* | Executive Employment Agreement, effective as of March 24, 2010 between lululemon athletica canada inc. and Sheree Waterson | 10-K | 10.24 | 001-33608 | 3/25/2010 |
Table of Contents
| Incorporated by Reference | ||||||||||||||
| Exhibit No. | Exhibit Title | Filed Herewith | Form | Exhibit No. | File No. | Filing Date | ||||||||
| 21.1 | Subsidiaries of lululemon athletica inc. | X | ||||||||||||
| 23.1 | Consent of PricewaterhouseCoopers LLP | X | ||||||||||||
| 31.1 | Certification of Chief Executive Officer pursuant to Exchange Act Rules 13a-14(a) and 15d-14(a), as adopted pursuant to Section 302 of the Sarbanes-Oxley Act of 2002 | X | ||||||||||||
| 31.2 | Certification of Chief Financial Officer pursuant to Exchange Act Rules 13a-14(a) and 15d-14(a), as adopted pursuant to Section 302 of the Sarbanes-Oxley Act of 2002 | X | ||||||||||||
| 32.1 | Certification of Chief Executive Officer and Chief Financial Officer pursuant to 18 U.S.C. Section 1350, as adopted pursuant to Section 906 of the Sarbanes-Oxley Act of 2002 | X | ||||||||||||
| 101** | The following financial statements from the Company’s 10-K for the fiscal year ended February 3, 2013, formatted in XBRL: (i) Consolidated Balance Sheets, (ii) Consolidated Statements of Operations and Comprehensive Income, (iii) Consolidated Statements of Stockholders’ Equity, (iv) Consolidated Statements of Cash Flows (v) Notes to the Consolidated Financial Statements |
| * | Denotes a compensatory plan, contract or arrangement, in which our directors or executive officers may participate. |
|---|
| ** | Furnished herewith. |
|---|