 filings.tools
Item 5. — MARKET FOR REGISTRANT’S COMMON EQUITY, RELATED STOCKHOLDER MATTERS AND ISSUER PURCHASES OF EQUITY SECURITIES
6K characters. Original on sec.gov · Markdown
Item 5. — MARKET FOR REGISTRANT’S COMMON EQUITY, RELATED STOCKHOLDER MATTERS AND ISSUER PURCHASES OF EQUITY SECURITIES
Market Information
The Company’s common stock trades on the NYSE under the symbol “LVS.” The following table sets forth the high and low sales prices for the common stock on the NYSE for the fiscal quarter indicated:
| High | Low | ||||||
| 2015 | |||||||
| First Quarter | $ | 61.59 | $ | 51.24 | |||
| Second Quarter | $ | 59.90 | $ | 49.57 | |||
| Third Quarter | $ | 57.77 | $ | 37.40 | |||
| Fourth Quarter | $ | 52.14 | $ | 36.53 | |||
| 2016 | |||||||
| First Quarter | $ | 54.80 | $ | 34.88 | |||
| Second Quarter | $ | 53.31 | $ | 41.45 | |||
| Third Quarter | $ | 58.65 | $ | 42.29 | |||
| Fourth Quarter | $ | 63.38 | $ | 53.07 | |||
| 2017 | |||||||
| First Quarter (through February 22, 2017) | $ | 57.46 | $ | 51.47 |
As of February 22, 2017, there were 793,994,554 shares of our common stock outstanding that were held by 391 stockholders of record.
Dividends
Our ability to declare and pay dividends on our common stock is subject to the requirements of Nevada law. In addition, we are a parent company with limited business operations of our own. Accordingly, our primary sources of cash are dividends and distributions with respect to our ownership interest in our subsidiaries that are derived from the earnings and cash flow generated by our operating properties.
Our subsidiaries’ long-term debt arrangements place restrictions on their ability to pay cash dividends to the Company. This may restrict our ability to pay cash dividends other than from cash on hand. See “Item 7 — Management’s Discussion and Analysis of Financial Condition and Results of Operations — Restrictions on Distributions” and “Item 8 — Financial Statements and Supplementary Data — Notes to Consolidated Financial Statements — Note 8 — Long-Term Debt.”
Common Stock Dividends
On March 31, June 30, September 30 and December 30, 2016, we paid a dividend of $0.72 per common share as part of a regular cash dividend program. During the year ended December 31, 2016, we recorded $2.29 billion as a distribution against retained earnings (of which $1.24 billion related to our Principal Stockholder and his family and the remaining $1.05 billion related to all other stockholders).
On March 31, June 30, September 30 and December 31, 2015, we paid a dividend of $0.65 per common share as part of a regular cash dividend program. During the year ended December 31, 2015, we recorded $2.07 billion as a distribution against retained earnings (of which $1.12 billion related to our Principal Stockholder and his family and the remaining $949 million related to all other stockholders).
On March 31, June 30, September 30 and December 29, 2014, we paid a dividend of $0.50 per common share as part of a regular cash dividend program. During the year ended December 31, 2014, we recorded $1.61 billion as a distribution against retained earnings (of which $863 million related to our Principal Stockholder and his family and the remaining $745 million related to all other stockholders).
In January 2017, our Board of Directors declared a quarterly dividend of $0.73 per common share (a total estimated to be approximately $580 million) to be paid on March 31, 2017, to shareholders of record on March 23, 2017. We expect this level of dividend to continue quarterly through the remainder of 2017. Our Board of Directors will continually assess the level and appropriateness of any cash dividends.
Recent Sales of Unregistered Securities
There have not been any sales by the Company of equity securities in the last three fiscal years that have not been registered under the Securities Act of 1933.
Purchases of Equity Securities by the Issuer
In October 2014, our Board of Directors authorized the repurchase of $2.0 billion of our outstanding common stock, which expired on October 9, 2016. In November 2016, our Board of Directors authorized the repurchase of $1.56 billion of our outstanding common stock, which expires on November 2, 2018. All repurchases under the stock repurchase program are made from time to time at our discretion in accordance with applicable federal securities laws. All share repurchases of our common stock have been recorded as treasury shares. During the quarter ended December 31, 2016, there were no shares purchased. As of December 31, 2016, the approximate dollar value of shares that may yet be purchased under the stock repurchase program was $1.56 billion.
Performance Graph
The following performance graph compares the performance of our common stock with the performance of the Standard & Poor’s 500 Index and the Dow Jones US Gambling Index, during the five years ended December 31, 2016. The graph plots the changes in value of an initial $100 investment over the indicated time period, assuming all dividends are reinvested. The stock price performance in this graph is not necessarily indicative of future stock price performance.
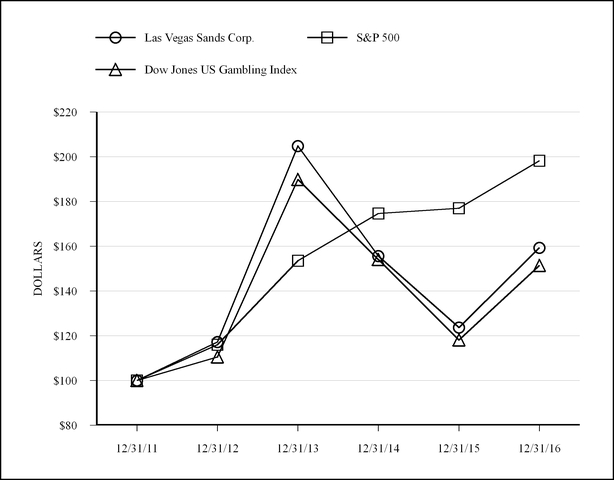
| Cumulative Total Return | |||||||||||||||||||||||
| 12/31/2011 | 12/31/2012 | 12/31/2013 | 12/31/2014 | 12/31/2015 | 12/31/2016 | ||||||||||||||||||
| Las Vegas Sands Corp. | $ | 100.00 | $ | 117.20 | $ | 204.83 | $ | 155.65 | $ | 123.73 | $ | 159.31 | |||||||||||
| S&P 500 | $ | 100.00 | $ | 116.00 | $ | 153.58 | $ | 174.60 | $ | 177.01 | $ | 198.18 | |||||||||||
| Dow Jones US Gambling Index | $ | 100.00 | $ | 110.52 | $ | 189.80 | $ | 154.10 | $ | 118.14 | $ | 151.45 |
The performance graph should not be deemed filed or incorporated by reference into any other Company filing under the Securities Act of 1933 or the Exchange Act of 1934, except to the extent the Company specifically incorporates the performance graph by reference therein.
Previous: Item 4. — MINE SAFETY DISCLOSURES · Next: Item 6. — SELECTED FINANCIAL DATA