 filings.tools
Masco (MAS) 10-K risk factor changes: FY2016 vs FY2015
The 2016-12-31 10-K against the 2015-12-31 one, compared heading by heading and sentence by sentence. One of these filings carries no fiscal year tag, so its year is the calendar year of the period end.
Item 1A76 rewritten25 added30 removed51 unchanged
All filing items1,242 rewritten985 added565 removed569 unchanged
Summary
counted, not written
- Item 1A headings could not be compared: only 0 carried over between the two years, which usually means one filing was read wrongly, so none is reported as new or removed.
- Sentence by sentence, 985 added, 565 removed, 1,242 rewritten and 569 unchanged across 22 items that differ.
- New this year: Item 16. Form 10-K Summary.
Sentences by item
22 items, with every count and a link to each item that changed
Underlined words on a shaded ground are new in FY2016; struck-through words were in FY2015. Sentences that are wholly new or wholly gone are labelled rather than marked.
Item 1A. Risk Factors.
76 rewritten, 25 added, 30 removed, 51 unchanged
Additional risks and uncertainties not presently known to us, or that we currently believe to be immaterial, also may adversely impact our business, [removed: financial condition and] results of [removed: operations.][added: operations and financial position.]
[removed: _Our] [added: Our] business relies on home improvement [removed: and] [added: and, to a lesser extent, on] new home construction activity, both of which are [removed: cyclical._][added: cyclical.]
Our business [removed: also] relies on [added: home improvement activity, including repair and remodeling projects, and, to a lesser extent, on] new home construction activity.
Macroeconomic conditions in [removed: the U.S.] [added: North America] and Europe, including consumer confidence levels, fluctuations in home prices, unemployment and underemployment levels, consumer income and debt levels, household formation and the availability of home equity loans and mortgages and the interest rates for such loans, affect both [removed: consumers'] [added: consumers’] discretionary spending on home improvement projects as well as new home construction activity.
[removed: While improving, both] [added: Although credit availability has improved and financing rates remain low,] consumer spending for big ticket remodeling projects and new home construction [removed: continue] [added: continues] to be below historic [removed: average] levels.
[removed: Adverse] [added: The fundamentals driving our business are cyclical, and adverse] changes or uncertainty regarding [removed: these] macroeconomic [removed: conditions] [added: conditions, including an economic slowdown or increased interest rates,] could result in a decline in spending on home improvement projects and a decline in demand for new home construction, [removed: both of] which could adversely affect our results of operations and [removed: our] financial position.
[removed: _If] [added: If] we do not maintain [added: our] strong brands, develop new products or respond to changing purchasing practices and consumer [removed: preferences] [added: preferences,] we could lose market [removed: share._][added: share.]
If we do not introduce new or improved products in a timely manner or if these products do not gain widespread acceptance, we could lose market share, which could negatively impact our [removed: operating results.][added: results of operations and financial position.]
If we are unable to successfully [removed: execute] [added: provide this support to] our [removed: e-business strategy,] [added: customers,] our brands may lose market share.
If we do not timely and effectively identify and respond to these changing purchasing practices and consumer preferences, our relationships with our customers and with consumers could be harmed, the demand for our brands and products could be reduced and our results of operations [added: and financial position] could be negatively affected.
[removed: _We] [added: We] face significant [removed: competition._][added: competition.]
[removed: Additionally,] [added: In addition,] home center retailers, which have historically concentrated their sales efforts on retail consumers and remodelers, are increasingly marketing directly to professional contractors and installers, which may impact our margins on our products that contractors and installers would otherwise buy through our dealers and wholesalers.
We sell many of our products through [added: home center retailers,] distributors and independent dealers and [removed: we] rely on these customers to market and promote our products to consumers.
Our success with [removed: these] [added: our] customers is dependent on our ability to provide quality products and timely delivery.
As market dynamics change, we may experience a shift in the mix of some products we sell toward more [removed: value-priced] [added: value‑priced] or opening price point products, which may impact our ability to maintain or gain market share and/or our profitability.
[removed: _Our] [added: Our] sales are concentrated with two significant [removed: customers._][added: customers.]
In [removed: 2015,] [added: 2016, our] net sales to [removed: our largest customer,] The Home [removed: Depot,] [added: Depot] were [removed: $2.4] [added: $2.5] billion (approximately [removed: 33] [added: 34] percent of our consolidated net [removed: sales).][added: sales), and our net sales to Lowe’s were less than ten percent of our consolidated net sales.]
[removed: If] [added: Our reliance on these significant customers may further increase if] the mix of our business operations [removed: continues to change,] [added: changes,] including as a result of acquisitions or [removed: divestitures, our reliance on these significant customers may further increase.][added: divestitures.]
Additionally, these home center [removed: customers] [added: retailers] may reduce the number of vendors from which they purchase and could make significant changes in their volume of [removed: purchases.][added: purchases from us.]
Although other retailers, dealers, distributors and homebuilders represent other channels of distribution for our products and services, [added: we might not be able to quickly replace, if at all,] the loss of a substantial portion of our sales to The Home Depot or the loss of all of our sales to [removed: Lowe's] [added: Lowe’s, and any such loss] would have a material adverse effect on our [removed: business.][added: business, results of operations and financial position.]
Further, as [removed: some of] these home center retailers expand their markets and targeted customers and as consumer purchasing practices change and [removed: e-commerce] [added: e‑commerce] increases, conflicts between our existing distribution channels have and will continue to occur, which could impact our results of [removed: operations.][added: operations and financial position.]
Our relationships with [removed: our] [added: these] customers may be impacted if we increase the amount of business we transact directly with consumers.
In addition, [removed: our large retail customers] [added: these home center retailers] request product exclusivity from time to time, which may affect our ability to offer products to other customers and may diminish our ability to leverage economies of scale.
[removed: _We] [added: We] may not achieve all of the anticipated benefits of our strategic [removed: initiatives._][added: initiatives.]
[removed: We continue to pursue our strategic initiatives, which] [added: All of these initiatives] are designed to [added: grow revenue, improve profitability and] increase shareholder value over the [removed: mid-] [added: mid‑] to [removed: long-term.][added: long‑term.]
Our business performance and results could be adversely affected if we are [added: unable to successfully execute these initiatives, or if we are unable to execute them in a timely and efficient manner.]
We could also be adversely affected if we [added: have not appropriately prioritized and balanced our initiatives or if we] are unable to effectively manage change throughout our organization.
If we are not able to identify suitable acquisition candidates or consummate potential [removed: acquisitions,] [added: acquisitions at acceptable terms and prices,] our [removed: long-term] [added: long‑term] competitive positioning may be impacted.
Our failure to address these risks could cause us to incur additional costs and/or fail to realize the anticipated benefits of our acquisitions and could adversely affect our results of [removed: operations.][added: operations and financial position.]
[removed: _Variability] [added: Variability] in commodity costs or limited availability of commodities could impact [removed: us._][added: us.]
We buy various commodities to [removed: manufacture] [added: produce] our products, including, among others, brass, resins, titanium dioxide, zinc, wood and glass.
Fluctuations in the availability and prices of these commodities could increase our costs to [removed: manufacture] [added: produce] our products.
Further, increases in energy costs could increase our production [removed: costs as well as our] [added: and] transportation costs, [removed: each of] which could [added: also] negatively affect our [removed: financial condition] [added: results of operations] and [removed: operating results.][added: financial position.]
It [removed: has been, and likely will continue to be,] [added: can be] difficult for us to pass on to customers cost increases to cover our increased commodity and production costs.
If we are not able to increase the prices of our products or achieve cost savings to offset increased commodity and production costs, our [removed: financial condition and operating] results [added: of operations and financial position] could be negatively impacted.
Such reductions could impact our [removed: operating results.][added: results of operations and financial position.]
This strategy increases the possibility that we may make commitments [removed: to purchase] [added: for] these commodities at prices that subsequently exceed their market prices, which has and may continue to adversely affect our [removed: financial condition] [added: results of operations] and [removed: operating results.][added: financial position.]
[removed: _We] [added: We] are dependent on third-party [removed: suppliers._][added: suppliers.]
We rely heavily on [removed: third-party] [added: third‑party] suppliers for many of our products and components, and our ability to offer a wide variety of products depends on our ability to obtain an adequate [added: and/or timely] supply of these products and components.
Failure [removed: by] [added: of] our suppliers to provide us quality products on commercially reasonable terms, or to comply with applicable legal and regulatory requirements, could have a material adverse effect on our [added: results of operations and] financial [removed: condition or operating results.][added: position.]
It is also possible that our competitors may improve their products more rapidly or effectively than we do, which could adversely affect our market share.
As our customers execute their strategies to reach end consumers through multiple channels, they rely on us to support their efforts with our infrastructure, including maintaining robust and user-friendly websites with sufficient content for consumer research and to provide comprehensive supply chain solutions and differentiated product development.
We also compete with low‑cost foreign manufacturers and private label brands in a variety of our product groups.
If we are unable to maintain our competitive position in our industries our results of operations and financial position could be adversely affected.
Our sales are concentrated with our two largest customers.
We continue to pursue our strategic initiatives of investing in our brands, developing innovative products, and focusing on operational excellence through our continued deployment of the Masco Operating System, our methodology to drive growth and productivity.
Our actions to improve the results of our U.S. window business may not be successful.
Our U.S. window business, Milgard Manufacturing Incorporated (“Milgard”), is experiencing operational issues and production inefficiencies, including difficulty in hiring and retaining qualified labor.
In addition, Milgard has begun a phased deployment of a new Enterprise Resource Planning (“ERP”) system to improve its business processes.
The implementation of this ERP system is complex and expensive and will require significant oversight and resources.
While we have implemented plans to address the operational and ERP issues challenging Milgard, there is no assurance that our plans will be successful.
If we experience unanticipated expenses or additional disruptions to Milgard’s operations, our results of operations and financial position may be negatively impacted.
Our production of products could also be impacted if we are unable to procure our requirements for these commodities or if a shortage of these commodities drives their prices to levels that are not commercially feasible.
We have entered into long-term agreements with certain significant suppliers to help ensure continued availability of key commodities and to establish firm pricing, but at times these contractual commitments may result in our paying above market prices for commodities during the term of the contract.
From time to time, we also may use derivative instruments, including commodity futures and swaps.
As the situation involving the United Kingdom’s decision to exit from the European Union develops, we could experience volatility in the currency exchange rates and/or a change in the demand for our products and services, particularly in our U.K. and European markets, or there could be disruption of our operations and our customers’ and suppliers’ businesses.
Current and former employees, contractors or suppliers have or may have had access to proprietary or confidential information regarding our business operations that could harm us if used by, or disclosed to others, including our competitors.
In certain areas of the U.S., we have experienced and may continue to experience difficulty in recruiting, training and retaining sufficient skilled and unskilled labor, resulting in additional costs related to labor inefficiencies.
Defending and resolving claims and litigation can be costly and can divert management’s attention.
We have and may continue to incur significant costs as a result of claims and litigation.
We may be adversely impacted if our information systems are disrupted, are no longer supported or fail.
We have plans to make significant investments in new technology systems throughout our company over the next several years.
We are also in the process of implementing ERP systems at select business units.
While we are leveraging our experience and engaging consultants to assist as we deploy ERP systems, we have experienced, and may continue to experience, unanticipated expenses and disruptions to our operations during these implementations.
Our results of operations and financial position could be negatively impacted if we do not appropriately select and implement our new technology systems in a timely manner or if we experience significant unanticipated expenses or disruptions in connection with the implementation of ERP systems.
A significant portion of our business relies on home improvement, including repair and remodeling projects, of which our reliance has increased following the spin off of TopBuild Corp. ("TopBuild") in 2015.
Consumers are increasingly using the internet and mobile technology to research home improvement products and to inform and provide feedback on their purchasing and ownership experience for these products.
E-business is a rapidly developing area, and the refinement and execution of a successful e-business strategy involves significant time, investment and resources.
While U.S. demand for single-family houses is increasing, the demand for multi-family housing units such as apartments and condominiums continues to be elevated compared to historic levels.
Multi-family units typically are smaller than single-family houses and require fewer kitchen and bathroom cabinets than single-family houses.
If this demand mix remains, it may limit our growth opportunities.
Home center retailers continue to purchase products in our segments directly from low-cost foreign manufacturers for sale as private label merchandise.
Additionally, in these channels as well as at home center retailers, we compete with foreign manufacturers in a variety of our product groups.
Some of these foreign manufacturers are putting downward pressures on price.
Our ability to maintain our competitive position in our industries depends upon maintaining strong brands, developing and innovating products, maintaining strong relationships with our customers, managing our cost structure, executing a successful e-business strategy, accommodating customer demands for new and improved products on a shorter cycle, implementing growth strategies and entering new domestic and international areas, none of which is assured.
As a result of the spin off of TopBuild in 2015, the mix of our business operations has changed and the concentration of our sales to our two largest customers has increased and may continue to increase.
In 2015, net sales to Lowe's, our second largest customer, were less than ten percent of our consolidated net sales.
unable to successfully execute these initiatives, or if we are unable to execute them in a timely and efficient manner.
_We may not be able to sustain the turnaround in our cabinetry businesses._
Our initiatives to improve our cabinetry operations have been complex, time-consuming and expensive.
Although the operating results of our cabinetry businesses improved in 2015, we continue to focus on obtaining profitable sales, reducing our cost structure and improving production efficiencies.
Our strategies in these areas require time to implement, execute and assess and may not be successful.
If the improvement in our cabinetry businesses cannot be sustained or if the pace of the improvement slows, our results of operations may be negatively impacted.
To help reduce price volatility associated with certain anticipated commodity purchases, we use derivative instruments, including commodity futures and swaps.
We also have agreements with certain significant suppliers to help assure continued availability.
Following the TopBuild spin off, a greater proportion of our sales occurs outside of the U.S., and increasing our international sales is an important part of our strategic plans.
If we are not able to protect our existing
If we are unable to recruit, train and retain sufficient skilled and unskilled labor, we may not be able to adequately satisfy increased demand for our products and services, and our operating results could be adversely affected.
In recent years, we have experienced class action lawsuits predicated upon claims for product liability and wage and hour issues, and we may be subject to other consumer claims in the future.
We have generally denied liability and have vigorously defended these cases.
Due to their scope and complexity, however, these lawsuits can be particularly costly to defend and resolve, and we have and may continue to incur significant costs as a result of these types of lawsuits.
We may elect not to obtain insurance if we believe the cost of available insurance is excessive relative to the risks presented.
We may also experience increased costs for insurance coverage that could impact our financial results.
We may be adversely impacted if our information systems are disrupted or fail, or if we do not appropriately select and implement our new technology systems in a timely manner.
An excerpt. Shown here: 40 of 76 rewritten, all 25 added and all 30 removed. The counts are complete. For every sentence, read Item 1A. Risk Factors. in the FY2016 filing and the FY2015 filing.
Item 7. Management's Discussion and Analysis of Financial Condition and Results of Operations.
244 rewritten, 128 added, 93 removed, 130 unchanged
In addition to the various factors included in the "Executive Level Overview," "Critical Accounting Policies and Estimates" and "Outlook for the Company" sections, our future performance may be affected by the levels of home improvement activity and new home construction, our ability to maintain our strong brands and to develop and introduce new and improved products, our ability to maintain our competitive position in our industries, our reliance on key customers, our ability to achieve the anticipated benefits of our strategic initiatives, our ability to [removed: sustain the performance of] [added: improve] our [removed: cabinetry businesses,] [added: under-performing U.S. window business,] the cost and availability of raw materials, our dependence on third party suppliers, and risks associated with international operations and global strategies.
[removed: Executive] [added: Executive] Level [removed: Overview][added: Overview]
We design, [removed: manufacture, market] [added: manufacture] and distribute branded home improvement and building products.
Net sales were positively affected by increased [added: sales volume resulting from increased] repair and remodel activity and new home [removed: construction in the U.S.] [added: construction,] and [removed: Europe,] favorable product [removed: mix, net selling price increases] [added: mix in the U.S.] and [removed: acquisitions.][added: Europe.]
Such increases were partially offset by foreign currency translation, primarily due to the stronger U.S. dollar [removed: compared to the Euro.][added: and lower selling prices of paints and other coating products.]
Our results of operations were positively affected by increased sales volume, [removed: operational efficiencies due to benefits resulting from cost savings initiatives and] a more favorable relationship between selling prices and commodity [removed: costs.][added: costs, operational efficiencies, and cost savings initiatives.]
[removed: Our Cabinets and Related Products] [added: Operating margins in this] segment [removed: was] [added: in 2015 were] positively affected by operational efficiencies due to [added: the] benefits [removed: resulting from] [added: associated with] business rationalization activities and other cost [removed: saving] [added: savings] initiatives and decreased business rationalization expenses.
Our Plumbing Products segment benefited from increased sales [removed: volume and] [added: volume,] a favorable relationship between selling prices and commodity costs and [added: benefits associated with cost savings initiatives, and] was negatively impacted by [removed: unfavorable product mix and] an increase in certain variable [removed: expenses.][added: expenses, such as strategic growth investments and higher insurance costs, as well as unfavorable product mix.]
The Decorative Architectural Products segment benefited from increased sales volume of paints and [removed: stains] [added: other coating products] and [removed: builders'] [added: builder's] hardware, [removed: a more favorable] [added: partially offset by an unfavorable] relationship [removed: between] [added: betwen] selling prices and commodity costs [removed: in][added: of paints and other coating products.]
[removed: Our Other Specialty Products] [added: Operating margins in this] segment [removed: benefited from increased volume, a more favorable product mix of U.S. windows and] [added: in 2014 reflect] a more favorable relationship between selling prices and commodity [removed: costs] [added: costs, a more favorable product mix] of [added: U.S. and U.K.] windows [added: and increased sales volume] in the [added: Western] U.S. [added: Such positive results were partially offset by lower sales volume] and [removed: the U.K.][added: lower net selling prices of staple gun tackers and other fastening tools.]
[removed: Critical] [added: Critical] Accounting Policies and [removed: Estimates][added: Estimates]
Our discussion and analysis of our financial condition and results of operations [removed: are] [added: is] based upon our consolidated financial statements, which have been prepared in accordance with accounting principles generally accepted in the United States of America ("GAAP").
The preparation of these financial statements requires us to make certain estimates and assumptions that affect the reported amounts of assets and liabilities, disclosure of any contingent assets and [removed: liabilities at the date of the financial statements and the reported amounts of revenues and expenses during the reporting periods.]
Note A to [removed: our] [added: the] consolidated financial statements includes our accounting policies, estimates and methods used in the preparation of our consolidated financial statements.
[removed: Revenue] [added: Revenue] Recognition and [removed: Receivables][added: Receivables]
[removed: Goodwill] [added: Goodwill] and Other Intangible [removed: Assets][added: Assets]
We selected the discounted cash flow methodology because we believe that it is comparable to what would be used by [removed: other] market participants.
We generally develop these forecasts based upon, among other things, recent sales [added: data for existing products, planned timing of new product launches, estimated repair and remodel activity and estimated housing starts.]
Our assumptions included a relatively stable U.S. Gross Domestic Product [removed: ranging from 2.4 percent to 2.9] [added: growing at 2.3] percent and a euro zone Gross Domestic Product [removed: ranging from 1.5 percent to 1.8] [added: growing at 1.4] percent [added: annually] over the five-year forecast.
In [removed: 2015,] [added: 2016,] based upon our assessment of the risks impacting each of our businesses, we applied a risk premium to increase the discount rate to a range of 10.5 percent to [removed: 12.5] [added: 13.5] percent for our reporting units.
In the fourth quarter of [removed: 2015,] [added: 2016,] we estimated that future discounted cash flows projected for all of our reporting units were greater than the carrying values.
A 10 percent decrease in the estimated fair value of our reporting units [removed: at December 31, 2015] would not have resulted in any additional analysis of goodwill impairment for any reporting unit.
In [removed: 2015,] [added: 2016,] we did not recognize any impairment charges for other indefinite-lived intangible assets.
[removed: Employee] [added: Employee] Retirement [removed: Plans][added: Plans]
[removed: Effective January 1, 2010, we] [added: We] froze all future benefit accruals under substantially all of our domestic [added: and foreign] qualified and [added: domestic] non-qualified defined-benefit pension [removed: plans.][added: plans several years ago.]
In December [removed: 2015,] [added: 2016,] our discount rate [removed: increased] [added: decreased] for obligations to an average of [removed: 4.0] [added: 3.5] percent from [removed: 3.8] [added: 4.0] percent.
The discount rate for obligations is based upon the expected duration of each defined-benefit pension plan's liabilities matched to the December 31, [removed: 2015] [added: 2016] Towers Watson Rate Link curve.
The discount rates we use for our defined-benefit pension plans ranged from [removed: 2.0] [added: 1.5] percent to [removed: 4.3] [added: 4.0] percent, with the most significant portion of the liabilities having a discount rate for obligations of [removed: 4.0] [added: 3.8] percent or higher.
The assumed asset return was primarily 7.25 percent, reflecting the expected long-term return on plan [added: assets based upon an analysis of expected and historical rates of return of various asset classes utilizing the current and long-term asset allocation of the plan] assets.
Our net underfunded amount for our qualified defined-benefit pension plans, which is the difference between the projected benefit obligation and plan assets, decreased to [removed: $401] [added: $338] million at December 31, [removed: 2015] [added: 2016] from [removed: $454] [added: $401] million at December 31, [removed: 2014.][added: 2015.]
Our projected benefit obligation for our [removed: unfunded non-qualified] [added: unfunded, non-qualified,] defined-benefit pension plans was [removed: $174] [added: $170] million at December 31, [removed: 2015] [added: 2016] compared with [removed: $190] [added: $174] million at December 31, [removed: 2014.][added: 2015.]
The decrease in [removed: the] [added: our] projected benefit obligations was [removed: primarily due to lower bond rates and] [added: partially driven by lump sum payouts of certain long-term qualified pension obligations as well as] a change to the MP [removed: 2015] [added: 2016] Mortality Improvement [removed: Scale issued by the U.S. Society of Actuaries,] [added: Scale,] which decreased our long-term pension liabilities.
In accordance with the Pension Protection Act, the Adjusted Funding Target Attainment Percentage for the various defined-benefit pension plans ranges from [removed: 78] [added: 76] percent to [removed: 114] [added: 109] percent.
We expect pension expense for our qualified defined-benefit pension plans to be [removed: $24] [added: $22] million in [removed: 2016] [added: 2017] compared with [removed: $22] [added: $25] million in [removed: 2015.][added: 2016.]
If we assumed that the future return on plan assets was one-half percent lower than the assumed asset return and the discount rate decreased by 50 basis points, the [removed: 2016] [added: 2017] pension expense would increase by [removed: $5] [added: $4] million.
We expect pension expense for our non-qualified defined-benefit pension plans to be [removed: $9] [added: $8] million in [removed: 2016,] [added: 2017,] compared to [removed: $10] [added: $9] million in [removed: 2015.][added: 2016.]
We anticipate that we will be required to contribute approximately [removed: $25] [added: $21] million in [removed: 2016] [added: 2017] to our qualified and non-qualified defined-benefit plans.
Refer to [removed: Footnote] [added: Note] M [added: to the consolidated financial statements] for further information regarding the funding of our plans.
[removed: Income Taxes][added: Income Taxes]
[removed: In 2010, we recorded] [added: Compared to our normalized tax rate of 36 percent, the variance in 2015 is due primarily to] a [removed: $372] [added: $21] million valuation allowance against [removed: our U.S. Federal] [added: certain] deferred tax assets [added: of TopBuild recorded] as a non-cash charge to income tax expense.
2016 Results
Such increases were partially offset by an increase in warranty costs resulting from a change in our estimate of expected future warranty claim costs and an increase in certain variable expenses, such as strategic growth investments, as well as ERP system implementation and higher insurance costs.
Our Cabinetry Products segment benefited from operational efficiencies resulting from business rationalization activities and other cost savings initiatives, a positive product mix and a more favorable relationship between selling prices and commodity costs, and was negatively impacted by decreased sales volume.
Our Windows and Other Specialty Products segment was negatively affected by increased warranty costs and certain other expenses, such as higher labor costs and ERP system implementation costs, and was positively impacted by a more favorable relationship between selling prices and commodity costs of windows.
liabilities at the date of the financial statements and the reported amounts of revenues and expenses during the reporting periods.
Allowances are estimated based upon specific customer balances, where a risk of default has been identified, and also include a provision for non-customer specific defaults based upon historical collection, return and write-off activity.
Our weighted average cost of capital is unchanged as compared to 2015.
These unfunded plans are not subject to the funding requirements of the Pension Protection Act of 2006.
The decrease was partially offset by a lower discount rate compared to the prior year.
During 2016, we contributed $100 million to our qualified defined-benefit pension plans, including $51 million to a previously unfunded pension plan.
Additionally, our qualified defined-benefit pension plan assets had a net gain of 8.3 percent in 2016.
Refer to Note M to the consolidated financial statements for additional information.
The potential for comprehensive tax reform in 2017, if implemented, may have a significant impact on our effective tax rate or taxes paid due to certain business provisions such as the denial of net interest expense deductions or the imposition of a tax on imports.
We offer full and limited warranties on certain products with warranty periods ranging up to the lifetime of the product to the original consumer purchaser.
Refer to Note U to the consolidated financial statements for additional information.
In addition, we actively manage our portfolio of companies by divesting of those businesses that do not align with our long-term growth strategy.
Refer to Note K to the consolidated financial statements for additional information.
On March 17, 2016, we issued $400 million of 3.5% Notes due April 1, 2021 and $500 million of 4.375% Notes due April 1, 2026.
We received proceeds of $896 million, net of discount, for the issuance of these Notes.
The Notes are senior indebtedness and are redeemable at our option at the applicable redemption price.
On April 15, 2016, proceeds from the debt issuances, together with cash on hand, were used to repay and early retire all of our $1 billion, 6.125% Notes which were due on October 3, 2016 and all of our $300 million, 5.85% Notes which were due on March 15, 2017.
In connection with these early retirements, we incurred $40 million of debt extinguishment costs, which we recorded as interest expense.
Refer to Note K to the consolidated financial statements for additional information.
We expect to remain in compliance with these covenants through at least the next year.
Our short-term bank deposits consist of time deposits with maturities of 12 months or less.
Beginning in 2016, we decided to significantly reduce our utilization of derivative and hedging activity for commodity cost fluctuations by settling positions at their scheduled maturity while not entering into new transactions.
During 2016, we repurchased nearly 15 million shares of our common stock for cash aggregating $459 million.
The increase in the current ratio was due to the net debt reduction of $400 million during 2016 resulting from the refinancing of our debt, which reduced current liabilities by approximately $1 billion at December 31, 2016 compared to December 31, 2015.
| | | | | | | | | | | | |
| --- | --- | --- | --- | --- | --- | --- | --- | --- | --- | --- | --- |
| | | | | | | | | | | | |
| Debt extinguishment costs | (40 | | ) | | — | | | | — | | |
| | | | | | |
| --- | --- | --- | --- | --- | --- |
| | | | | | |
| | 2016 | | | 2015 | |
This usage was partially offset by the issuance of $400 million of 3.5% Notes due April 1, 2021 and $500 million of 4.375% Notes due April 1, 2026.
The timing of these share repurchases will depend on market conditions.
Net cash used for investing activities was $124 million, and included $180 million for capital expenditures, partially offset by $40 million net proceeds from the sale of short-term bank deposits and $32 million cash received from financial investments, primarily related to the early redemption of our auction rate securities.
| | 2016 | | | | 2015 | | |
2015 Results
paints and stains and operational efficiencies due to benefits associated with cost savings initiatives.
data for existing products, planned timing of new product launches, estimated repair and remodel activity and estimated housing starts.
Our weighted average cost of capital decreased in 2015 as compared to 2014, primarily due to less risk associated with our stock in relation to the capital markets.
Our qualified domestic pension plan assets in 2015 had a net loss of 1.8 percent.
At December 31, 2015, we reported a net liability of $575 million, of which $174 million was related to our non-qualified, supplemental retirement plans, which are not subject to the funding requirements of the Pension Protection Act of 2006.
In reaching this conclusion, we considered the weaker retail sales of certain of our building products and the slower than anticipated recovery in the U.S. housing market which led to U.S. operating losses and significant U.S. goodwill impairment charges, that primarily occurred in the fourth quarter of 2010, causing us to be in a three-year cumulative U.S. loss position.
During 2012 and 2011, objective and verifiable negative evidence, such as U.S. operating losses and significant impairment charges for U.S. goodwill and other intangible assets, continued to outweigh positive evidence necessary to reduce the valuation allowance.
As a result, we recorded increases of $65 million and $87 million in the valuation allowance related to our U.S. Federal deferred tax assets in 2012 and 2011, respectively.
amounts are recorded as charges to earnings.
We acquired two businesses in 2015, Endless Pools and Evolution Manufacturing.
Endless Pools expanded our product offering and distribution channels into the aquatic fitness category.
Evolution Manufacturing expanded our offering of fiberglass and composite windows in the United Kingdom.
We believe these acquisitions will accelerate the growth of, and complement, our current businesses, Watkins Manufacturing and our UK-based window company, respectively.
In addition, during the financial recession of the last decade, we actively managed our portfolio of companies by divesting of those businesses that did not align with our long-term growth strategy, including, in 2015, the spin off of our Installation and Other Services businesses into an independent, publicly-traded company named TopBuild.
We also intend to pay down between $300 million and $500 million of our debt over the next several quarters.
See Note K to the consolidated financial statements.
The decrease in the current ratio was due to the approximately $500 million increase in short-term notes payable at December 31, 2015 compared to December 31, 2014 due to scheduled debt maturities.
| | | | | | | | | | | |
| --- | --- | --- | --- | --- | --- | --- | --- | --- | --- | --- |
| Businesses, net of cash disposed | | | — | | | — | | | 17 | |
| | | | | | | | | | | |
| --- | --- | --- | --- | --- | --- | --- | --- |
| | | | | | | | |
Other financing activities include the issuance of $497 million of notes, $75 million tax benefit from stock-based compensation, and $200 million of cash received from TopBuild as a result of its new debt financing agreement, offset by $63 million of cash distributed to TopBuild.
As part of our capital management strategy, we expect to repurchase up to $500 million of our common stock in 2016.
Net cash used for investing activities was $189 million, and included $158 million for capital expenditures, $41 million for acquisitions of companies, net of cash acquired, and $43 million for in-store displays.
Investing activities also include net cash provided from the sale of short-term bank deposits of $26 million.
Both 2015 and 2014 reflect the benefits associated with business rationalizations and other cost savings initiatives.
Other, net, for 2013 included income from equity investments, net, of $16 million and gains of $11 million from investments in private equity funds.
In 2013, in conjunction with the transaction to sell our Danish ready-to-assemble cabinet business (included in discontinued operations), we also disposed of a related Danish holding company.
This disposition triggered the settlement of loans, which resulted in the recognition of $18 million of currency translation expense, which is included in other income (expense), net, from continuing operations in the statement of operations.
Compared to our normalized tax rate of 36 percent, the variance in 2015 is primarily due to a $21 million valuation allowance against certain deferred tax assets of TopBuild recorded as a non-cash charge to income tax expense.
During 2015, we made progress on our strategic priorities, which include leveraging opportunities across our businesses, driving the full potential of our core businesses and actively managing our portfolio.
We believe and are confident that the long-term fundamentals for home improvement activity and new home construction continue to be positive.
| | | | | | | | | | | | | | | | | |
| --- | --- | --- | --- | --- | --- | --- | --- | --- | --- | --- | --- | --- | --- | --- | --- | --- |
| Cabinets and Related Products | | $ | 1,025 | | $ | 999 | | $ | 1,014 | | | 3 | % | | (1 | )% |
| | | | | | | | | | | | | | | | | |
An excerpt. Shown here: 40 of 244 rewritten, 40 of 128 added and 40 of 93 removed. The counts are complete. For every sentence, read Item 7. Management's Discussion and Analysis of Financial Condition and Results of Operations. in the FY2016 filing and the FY2015 filing.
Item 7A. Quantitative and Qualitative Disclosures about Market Risk.
2 rewritten, 2 added, 1 removed, 4 unchanged
[removed: See] [added: Refer to] Note F to the consolidated financial statements for additional information regarding our derivative instruments.
At December 31, [removed: 2015,] [added: 2016,] we performed sensitivity analyses to assess the potential loss in the fair values of market risk sensitive instruments resulting from a hypothetical change of 10 percent in foreign currency exchange rates, a 10 percent decline in the market value of our long-term investments, a 10 percent change in commodity costs, or a 10 percent change in interest rates.
| | |
| --- | --- |
Item 1. Business.
73 rewritten, 40 added, 42 removed, 37 unchanged
Masco Corporation is a global leader in the design, [removed: manufacture, marketing] [added: manufacture] and distribution of branded home improvement and building products.
Our portfolio of industry-leading brands includes [removed: KRAFTMAID® and MERILLAT® cabinets; DELTA®, PEERLESS®,] [added: BEHR® paint; DELTA®] and HANSGROHE® faucets, bath and shower fixtures; [removed: HOT SPRING® and CALDERA® spas; BEHR® paint, primer and stain; KILZ® primer; LIBERTY® and BRAINERD® decorative hardware;] [added: KRAFTMAID®] and [added: MERILLAT® cabinets;] MILGARD® windows and [removed: doors.][added: doors; and HOT SPRING® spas.]
[removed: During 2015, we further advanced] [added: We believe that] our [removed: strategy to] [added: solid results of operations and financial] position [removed: the Company] for [removed: future growth by focusing] [added: 2016 resulted from our continued focus] on [added: our] three strategic pillars: driving the full potential of our core businesses, leveraging opportunities across our businesses, and actively managing our portfolio.
[removed: First, to drive the full potential of our core businesses,] [added: In addition,] we [removed: pursued sales growth opportunities in adjacent markets and products,] continued [removed: the deployment of] [added: to reduce costs and capitalize on synergies across our businesses with] standardized operating [removed: tools across the enterprise, executed] [added: tools,] cost saving initiatives and [removed: expanded our] [added: the] implementation of lean principles and process improvements in many areas, including production and functional support processes.
We continued to realize supply chain efficiencies through strategic [removed: sourcing,] [added: sourcing] and [removed: we continued] to share best practices across all of our functional departments to enhance productivity.
[removed: To further enhance value creation for our shareholders,] [added: In addition,] during [removed: 2015] [added: 2016] we repurchased [removed: over 17] [added: nearly 15] million shares of our common stock and increased our quarterly dividend by approximately [removed: 6 percent.][added: 5 percent, which further enhanced value for our shareholders.]
We believe that the actions we [removed: took during 2015] have [added: taken over the last few years have] positioned our company for further enhancement of shareholder [removed: value.][added: value with strong and consistent growth.]
By [removed: continuing] [added: focusing on] our disciplined execution of our strategy, we believe that [removed: we] [added: our positive momentum] will [removed: increase shareholder value.][added: continue.]
[removed: Our] [added: Our] Business [removed: Segments][added: Segments]
We report our financial results in four business segments aggregated by similarity in [removed: products and services.][added: products.]
The following table sets forth the contribution of our segments to net sales and operating profit (loss) for the three years ended December 31, [removed: 2015.][added: 2016.]
Additional financial information concerning our operations by segment and by geographic regions, as well as general corporate expense, net, as of and [added: for the three years ended December 31, 2016, is set forth in Note P to the consolidated financial statements included in Item 8 of this Report.]
| | [added: (In Millions)] | | | | [removed: (In Millions)] | | | | | | [added: |]
| | [removed: | Net] [added: Net] Sales [removed: (1)] [added: (1)] | | | | | | | | | [added: | |]
| | [added: 2016] | [removed: 2015] | | | [removed: 2014] [added: 2015] | | | [removed: 2013] | [added: 2014] | | [added: |]
| Plumbing Products | [added: $] | [added: 3,526] | [removed: 3,341] | | [added: $] | [removed: 3,308] [added: 3,341] | | | [removed: 3,183] [added: $] | [added: 3,308] | [added: |]
| Decorative Architectural Products | [added: 2,092] | | [removed: 2,020] | | [added: 2,020] | [removed: 1,998] | | | [removed: 1,927] [added: 1,998] | | [added: |]
| [added: Windows and] Other Specialty Products | [added: 769] | | [removed: 756] | | [added: 756] | [removed: 701] | | | [removed: 637] [added: 701] | | [added: |]
| Total | [removed: |] $ | [removed: 7,142] [added: 7,357] | | [added: |] $ | [removed: 7,006] [added: 7,142] | | [added: |] $ | [removed: 6,761] [added: 7,006] | |
| | [removed: | Operating] [added: Operating] Profit (Loss) [removed: (1)(2)(3)] [added: (1)(2)(3)] | | | | | | | | | [added: | |]
| Plumbing Products | [added: $] | [added: 642] | [removed: 512] | | [added: $] | 512 | | | [removed: 394] [added: $] | [added: 512] | [added: |]
| Decorative Architectural Products | [added: 430] | | [removed: 403] | | [added: 403] | [removed: 360] | | | [removed: 351] [added: 360] | | [added: |]
| [added: Windows and] Other Specialty Products | [added: (3] | | [removed: 57] [added: )] | | [added: 57] | [removed: 47] | | | [removed: 35] [added: 47] | | [added: |]
| Total | [removed: |] $ | [removed: 1,023] [added: 1,162] | | [added: |] $ | [removed: 857] [added: 1,023] | | [added: |] $ | [removed: 770] [added: 857] | |
[added: | (1) |] Amounts exclude discontinued operations. [added: |]
[added: | (2) |] Operating profit (loss) is before general corporate expense, net. [added: |]
[added: | (3) |] Operating profit (loss) is before income of $9 million regarding the 2014 litigation settlement in the Decorative Architectural Products segment. [added: |]
In North America, we manufacture and sell [removed: value-priced,] [added: value‑priced,] stock and [removed: semi-custom] [added: semi‑custom] assembled cabinetry for kitchen, bath, storage, home office and home entertainment applications in a broad range of styles and price points to address consumer preferences.
In the United Kingdom, we manufacture and sell kitchen, [removed: bath,] [added: bath] and storage cabinetry.
Our KRAFTMAID® [removed: brand is] [added: and CARDELL® products are] sold primarily to dealers and home center retailers, and our MERILLAT®, QUALITY CABINETS™, [removed: MOORES™] and [removed: CARDELL® brands] [added: MOORES™ products] are sold primarily to dealers and homebuilders for both home improvement and new home construction.
[removed: Plumbing Products][added: Plumbing Products]
[added: | • | The majority of our faucet, bathing and showering products are sold in North America and Europe under the brand names DELTA®, BRIZO®, PEERLESS®, HANSGROHE®, AXOR®, GINGER®, NEWPORT BRASS®, BRASSTECH® and WALTEC®. Our BRISTAN™ and HERITAGE™ products are sold primarily in the United Kingdom.] These plumbing products include faucets, showerheads, handheld showers, valves, bathing units, shower enclosures and toilets and are sold to home center retailers and to wholesalers and distributors that, in turn, sell them to plumbers, building contractors, remodelers, smaller retailers and consumers. [added: |]
[added: | • |] Our acrylic [removed: tub and shower systems,] [added: tubs,] bath and shower enclosure units and shower trays are manufactured and sold under the DELTA, PEERLESS, and MIROLIN® brand names. [added: These products are sold primarily to home center retailers. Our MIROLIN products are also sold to wholesalers and distributors in Canada. Our HÜPPE® shower enclosures are sold through wholesale channels in Europe and China. |]
[added: | • |] Our spas and exercise pools [added: and systems] are manufactured and sold under HOT SPRING®, CALDERA®, FREEFLOW SPAS®, FANTASY SPAS®, ENDLESS POOLS® and other trademarks. [added: Our spa products are sold to independent specialty retailers or online mass merchant retailers. Our exercise pools are available on a consumer-direct basis, while our fitness systems are sold through independent specialty retailers as well as on a consumer-direct basis. |]
Competitors [added: of our spas and exercise pools and systems] include Jacuzzi, Master Spas and Dynasty Spas.
[added: | • |] Also included in our Plumbing Products segment are brass and copper plumbing system components and other [added: non-decorative] plumbing [removed: specialties,] [added: products,] which are sold to plumbing, heating and hardware wholesalers, home center retailers, hardware stores, building supply outlets and other mass merchandisers. [added: These products are marketed in North and South America under our BRASSCRAFT®, PLUMB SHOP®, COBRA®, and MASTER PLUMBER® trademarks, and are also sold under private label. |]
Our major competitors [added: of our other products in this segment] include Lixil Group [removed: Corporation's] [added: Corporation’s] American Standard Brands and Grohe products, Kohler Co., Fortune Brands Home & Security [removed: Inc.] [added: Inc.'s Moen brands] and Spectrum Brands Holdings, [removed: LLC's] [added: LLC’s] Pfister faucets.
[removed: The businesses in our Plumbing] Products segment manufacture products in [removed: the United States,] [added: North America,] Europe and Asia and source products from Asia and other regions.
In addition to price, we believe that brand reputation is an important factor in consumer [added: selection.]
Competition for our plumbing products is based largely on [added: customer] service, product quality, product [removed: innovation and] features and [added: innovation and] breadth of product offering.
To drive the full potential of our core businesses during 2016, we continued to pursue sales growth opportunities by introducing new products, enhancing services and penetrating adjacent markets.
As a result, we achieved both top and bottom line growth.
We believe this contributed to our results of operations improving as compared to the prior year.
We also continued to actively manage our portfolio, the third pillar of our strategy, and remain committed to making selective acquisitions in attractive end markets.
| | | | | | | | | | | | |
| --- | --- | --- | --- | --- | --- | --- | --- | --- | --- | --- | --- |
| | | | | | | | | | | | |
| Cabinetry Products | 970 | | | | 1,025 | | | | 999 | | |
| | | | | | | | | | | | |
| --- | --- | --- | --- | --- | --- | --- | --- | --- | --- | --- | --- |
| | | | | | | | | | | | |
| | (In Millions) | | | | | | | | | | |
| | 2016 | | | | 2015 | | | | 2014 | | |
| Cabinetry Products | 93 | | | | 51 | | | | (62 | | ) |
____________________________________
| | |
| --- | --- |
| | |
| --- | --- |
| | |
| --- | --- |
| | |
| --- | --- |
| | |
| --- | --- |
| | |
| --- | --- |
| | |
| --- | --- |
Foreign manufacturers competing with us are located primarily in Germany and China.
The businesses in our Plumbing
To help reduce the impact of this volatility, from time to time we may enter into long-term agreements with certain significant suppliers or use derivative instruments.
Cabinetry Products
| | |
| --- | --- |
| | |
| --- | --- |
| | |
| --- | --- |
the protection of the environment and worker health and safety, will result in material capital expenditures or have a material adverse effect on our competitive position or results of operations and financial position.
We achieved gains in each of these areas.
As a result, our operating results (excluding the impact of foreign currency translation) improved across all of our segments, particularly at our U.S. cabinets business.
The third pillar of our strategy is to actively manage our portfolio.
On June 30, 2015, we completed the spin off of our Installation and Other Services businesses into an independent, publicly-traded, company, TopBuild Corp., through a tax-free distribution to our shareholders.
As a result of the spin off, our business has become less dependent on new home construction, and is, therefore, less cyclical, and a greater portion of our sales are derived from international markets.
In addition, we acquired two businesses in 2015 that complement our existing portfolio.
First, we expanded our product offering and distribution channels into the aquatic fitness category with the acquisition of the ENDLESS POOLS® brand.
We also acquired Evolution Manufacturing, which expands our offering of fiberglass and composite windows in the United Kingdom.
We also believe that completion of the spin off allows us to pursue a more focused strategy of growth.
for the three years ended December 31, 2015, is set forth in Note P to our consolidated financial statements included in Item 8 of this Report.
| | | | | | | | | | | |
| --- | --- | --- | --- | --- | --- | --- | --- | --- | --- | --- |
| Cabinets and Related Products | | $ | 1,025 | | $ | 999 | | $ | 1,014 | |
| | | | | | | | | | | |
| Cabinets and Related Products | | $ | 51 | | $ | (62 | ) | $ | (10 | ) |
(1)
(2)
(3)
Cabinets and Related Products
Our product offerings in this segment also include the fabrication and sale of integrated bathroom vanity and countertop products.
Our Cabinets and Related Products segment was particularly affected by the economic downturn and decline in new home construction and repair and remodel activity that began in 2008.
Consumer spending for big ticket remodeling projects is improving, including large kitchen and bath remodeling projects, but continues to be below normal levels, which impacts our profitability.
Home construction is also improving and is expected to continue to improve.
Demand has increased for multi-family housing units, which are generally smaller and require fewer kitchen and bathroom cabinets than single-family housing units.
Our initiatives to improve this segment have been complex, time-consuming and expensive.
Although the operating results of our cabinetry businesses improved in 2015, we continue to
focus on obtaining profitable sales, reducing our cost structure and improving cabinet production efficiencies.
We are pursuing strategies to increase sales through new product introductions and enhanced customer service, and to rationalize a portion of our customer base in our builder channel to focus on opportunities that offer more profitable growth.
In recent years, we have experienced significant competition in the form of new product offerings by our competitors, which have impacted the segment's results of operations.
The majority of our faucet, bathing and showering devices are sold in North America and Europe under the brand names DELTA®, PEERLESS®, HANSGROHE®, AXOR®, BRIZO®, GINGER®, NEWPORT BRASS®, BRASSTECH® and PLUMB SHOP®.
Our BRISTAN™ and HERITAGE™ products are principally sold in the United Kingdom.
These products are sold primarily to home center retailers for home improvement and new home construction in North America.
Our MIROLIN products are also sold to wholesalers and distributors in Canada.
Our HÜPPE® shower enclosures are sold through wholesale channels in Europe and China.
Spa products are sold to independent specialty retailers or online mass merchant retailers, while exercise pools are available on a consumer direct basis.
These products are marketed in North America for the wholesale trade under our BRASSCRAFT®, PLUMB SHOP®, COBRA®, BRASSTECH®, and MASTER PLUMBER® trademarks, and are also sold under private label.
We also experience competition from foreign manufacturers, including Grohe, particularly in Germany, China and the Middle East.
selection.
In 2015, we introduced a new BEHR® COLOR SOLUTIONS® Center, designed to enhance the color selection process and overall shopping experience, in all North American The Home Depot stores.
An excerpt. Shown here: 40 of 73 rewritten, all 40 added and 40 of 42 removed. The counts are complete. For every sentence, read Item 1. Business. in the FY2016 filing and the FY2015 filing.
Item 3. Legal Proceedings.
1 rewritten, 2 added, 1 removed, 0 unchanged
Information regarding legal proceedings involving us is set forth in Note U to [removed: our] [added: the] consolidated financial statements included in Item 8 of this Report and is incorporated herein by reference.
| | |
| --- | --- |
Cover and table of contents
41 rewritten, 14 added, 10 removed, 29 unchanged
[removed: [PART IV](#jb40101_part_iv)][added: PART I]
[removed: UNITED] [added: UNITED] STATES SECURITIES AND EXCHANGE COMMISSION
[removed: Washington,] [added: Washington,] DC 20549
[removed: FORM] [added: FORM] 10-K
[removed: ANNUAL] [added: ANNUAL] REPORT PURSUANT TO SECTION 13 OR 15(d) OF
THE SECURITIES EXCHANGE ACT OF [removed: 1934][added: 1934]
[removed: For] [added: For] the Fiscal Year Ended December 31, [removed: 2015] [added: 2016] Commission File Number 1-5794
[removed: MASCO] [added: MASCO] CORPORATION
[removed: (Exact] [added: (Exact] name of Registrant as Specified in its [removed: Charter)][added: Charter)]
| [removed: Delaware] [added: Delaware] | | [removed: 38-1794485] [added: 38-1794485] |
| [removed: 21001] [added: 21001] Van Born Road, Taylor, [removed: Michigan] [added: Michigan] | | [removed: 48180] [added: 48180] |
| [removed: Title] [added: Title] of Each [removed: Class] [added: Class] | | [removed: Name] [added: Name] of Each Exchange On Which [removed: Registered] [added: Registered] |
Indicate by check mark if disclosure of delinquent filers pursuant to Item 405 of Regulation S-K is not contained herein, and will not be contained, to the best of Registrant's knowledge, in definitive proxy or information statements incorporated by reference in Part III of this Form 10-K or any amendment to this Form 10-K. [added: o]
The aggregate market value of the Registrant's Common Stock held by non-affiliates of the Registrant on June 30, [removed: 2015] [added: 2016] (based on the closing sale price of [removed: $26.67] [added: $30.94] of the Registrant's Common Stock, as reported by the New York Stock Exchange on such date) was approximately [removed: $9,059,896,000.][added: $10,158,793,000.]
Number of shares outstanding of the Registrant's Common Stock at January 31, [removed: 2016:][added: 2017:]
[removed: 333,931,600] [added: 320,320,300] shares of Common Stock, par value $1.00 per share
[removed: DOCUMENTS] [added: DOCUMENTS] INCORPORATED BY [removed: REFERENCE][added: REFERENCE]
Portions of the Registrant's definitive Proxy Statement to be filed for its [removed: 2016] [added: 2017] Annual Meeting of Stockholders are incorporated by reference into Part III of this Form 10-K.
[removed: Masco] [added: Masco] Corporation
[removed: 2015] [added: 2016] Annual Report on Form 10-K
[removed: TABLE] [added: TABLE] OF CONTENTS
| [removed: Item] [added: Item] | | | | [removed: Page] [added: Page] |
| [removed: [1A.](#dc40101_item_1a._risk_factors.)] [added: [1A.](#s831AC0C85A79893463013020A975BB90)] | | [Risk [removed: Factors](#dc40101_item_1a._risk_factors.)] [added: Factors](#s831AC0C85A79893463013020A975BB90)] | | [removed: [8](#dc40101_item_1a._risk_factors.)] [added: [7](#s831AC0C85A79893463013020A975BB90)] |
| [removed: [1B.](#dc40101_item_1b._unresolved_staff_comments.)] [added: [1B.](#sBF2360AAAA031AC433583020A999C87A)] | | [Unresolved Staff [removed: Comments](#dc40101_item_1b._unresolved_staff_comments.)] [added: Comments](#sBF2360AAAA031AC433583020A999C87A)] | | [removed: [14](#dc40101_item_1b._unresolved_staff_comments.)] [added: [12](#sBF2360AAAA031AC433583020A999C87A)] |
| [removed: [4.](#dc40101_item_4._mine_safety_disclosures.)] [added: [4.](#sCD97556D2D022094EFCB3020AA23D0DE)] | | [Mine Safety [removed: Disclosures](#dc40101_item_4._mine_safety_disclosures.)] [added: Disclosures](#sCD97556D2D022094EFCB3020AA23D0DE)] | | [removed: [15](#dc40101_item_4._mine_safety_disclosures.)] [added: [13](#sCD97556D2D022094EFCB3020AA23D0DE)] |
| [removed: [5.](#de40101_item_5._market_for_registrant___ite04647)] [added: [5.](#sD14D0089B48D70282D753020A262B743)] | | [Market for Registrant's Common Equity, Related Stockholder Matters and Issuer Purchases of Equity [removed: Securities](#de40101_item_5._market_for_registrant___ite04647)] [added: Securities](#sD14D0089B48D70282D753020A262B743)] | | [removed: [16](#de40101_item_5._market_for_registrant___ite04647)] [added: [14](#sD14D0089B48D70282D753020A262B743)] |
| [removed: [6.](#de40101_item_6._selected_financial_data.)] [added: [6.](#s8155078F5DB3C6704B193020AA94F056)] | | [Selected Financial [removed: Data](#de40101_item_6._selected_financial_data.)] [added: Data](#s8155078F5DB3C6704B193020AA94F056)] | | [removed: [18](#de40101_item_6._selected_financial_data.)] [added: [16](#s8155078F5DB3C6704B193020AA94F056)] |
| [removed: [7.](#dg40101_item_7._management_s_discussio__ite03649)] [added: [7.](#s2A07C8835963964234773020AABBE077)] | | [Management's Discussion and Analysis of Financial Condition and Results of [removed: Operations](#dg40101_item_7._management_s_discussio__ite03649)] [added: Operations](#s2A07C8835963964234773020AABBE077)] | | [removed: [19](#dg40101_item_7._management_s_discussio__ite03649)] [added: [17](#s2A07C8835963964234773020AABBE077)] |
| [removed: [7A.](#dk40101_item_7a._quantitative_and_qual__ite02650)] [added: [7A.](#s5726D4F2BB6D66C088613020AD8466E4)] | | [Quantitative and Qualitative Disclosures About Market [removed: Risk](#dk40101_item_7a._quantitative_and_qual__ite02650)] [added: Risk](#s5726D4F2BB6D66C088613020AD8466E4)] | | [removed: [38](#dk40101_item_7a._quantitative_and_qual__ite02650)] [added: [34](#s5726D4F2BB6D66C088613020AD8466E4)] |
| [removed: [8.](#item8)] [added: [8.](#s8F1D6523A402DA5C32AC3020ADD73AA7)] | | [Financial Statements and Supplementary [removed: Data](#item8)] [added: Data](#s8F1D6523A402DA5C32AC3020ADD73AA7)] | | [removed: [39](#item8)] [added: [35](#s872B1A024C706951EF233020ADAFF036)] |
| [removed: [9.](#ge40101_item_9._changes_in_and_disagre__ite03557)] [added: [9.](#sE6523D5803A5DF4910DD3020B88FB6C3)] | | [Changes in and Disagreements with Accountants on Accounting and Financial [removed: Disclosure](#ge40101_item_9._changes_in_and_disagre__ite03557)] [added: Disclosure](#sE6523D5803A5DF4910DD3020B88FB6C3)] | | [removed: [85](#ge40101_item_9._changes_in_and_disagre__ite03557)] [added: [75](#sE6523D5803A5DF4910DD3020B88FB6C3)] |
| [removed: [9A.](#ge40101_item_9a._controls_and_procedures.)] [added: [9A.](#s19E191524D9ACABE25673020B89A5C78)] | | [Controls and [removed: Procedures](#ge40101_item_9a._controls_and_procedures.)] [added: Procedures](#s19E191524D9ACABE25673020B89A5C78)] | | [removed: [85](#ge40101_item_9a._controls_and_procedures.)] [added: [75](#s19E191524D9ACABE25673020B89A5C78)] |
| [removed: [9B.](#ge40101_item_9b._other_information.)] [added: [9B.](#sE9A09AAB65E925E8D6853020B8BE189B)] | | [Other [removed: Information](#ge40101_item_9b._other_information.)] [added: Information](#sE9A09AAB65E925E8D6853020B8BE189B)] | | [removed: [85](#ge40101_item_9b._other_information.)] [added: [75](#sE9A09AAB65E925E8D6853020B8BE189B)] |
| | | [removed: [PART III](#ja40101_part_iii)] [added: [PART III](#s50C2E8A1CEFF651ACA863020B8E98C2A)] | | |
| [removed: [10.](#ja40101_item_10._directors,_executive___ite02317)] [added: [10.](#s1310C9F19410F4FA1FBD3020B91208F5)] | | [Directors, Executive Officers and Corporate [removed: Governance](#ja40101_item_10._directors,_executive___ite02317)] [added: Governance](#s1310C9F19410F4FA1FBD3020B91208F5)] | | [removed: [86](#ja40101_item_10._directors,_executive___ite02317)] [added: [76](#s1310C9F19410F4FA1FBD3020B91208F5)] |
| [removed: [11.](#ja40101_item_11._executive_compensation.)] [added: [11.](#sE3BB16E62B39EB80B9743020B9330497)] | | [Executive [removed: Compensation](#ja40101_item_11._executive_compensation.)] [added: Compensation](#sE3BB16E62B39EB80B9743020B9330497)] | | [removed: [86](#ja40101_item_11._executive_compensation.)] [added: [76](#sE3BB16E62B39EB80B9743020B9330497)] |
| [removed: [12.](#ja40101_item_12._security_ownership_of__ite03985)] [added: [12.](#sE427E740E9F543C479BC3020B9693F79)] | | [Security Ownership of Certain Beneficial Owners and Management and Related Stockholder [removed: Matters](#ja40101_item_12._security_ownership_of__ite03985)] [added: Matters](#sE427E740E9F543C479BC3020B9693F79)] | | [removed: [86](#ja40101_item_12._security_ownership_of__ite03985)] [added: [76](#sE427E740E9F543C479BC3020B9693F79)] |
| [removed: [13.](#ja40101_item_13._certain_relationships__ite03048)] [added: [13.](#s7409970308DFBA2107E33020B98B9961)] | | [Certain Relationships and Related Transactions, and Director [removed: Independence](#ja40101_item_13._certain_relationships__ite03048)] [added: Independence](#s7409970308DFBA2107E33020B98B9961)] | | [removed: [86](#ja40101_item_13._certain_relationships__ite03048)] [added: [76](#s7409970308DFBA2107E33020B98B9961)] |
| [removed: [14.](#ja40101_item_14._principal_accountant_fees_and_services.)] [added: [14.](#s1E1F9E3F68CD817CC67C3020B9B668E1)] | | [Principal Accountant Fees and [removed: Services](#ja40101_item_14._principal_accountant_fees_and_services.)] [added: Services](#s1E1F9E3F68CD817CC67C3020B9B668E1)] | | [removed: [86](#ja40101_item_14._principal_accountant_fees_and_services.)] [added: [76](#s1E1F9E3F68CD817CC67C3020B9B668E1)] |
| [removed: [15.](#jb40101_item_15._exhibits_and_financial_statement_schedules.)] [added: [15.](#s3D4A083BB9F197E812603020BA0AC33D)] | | [Exhibits and Financial Statement [removed: Schedules](#jb40101_item_15._exhibits_and_financial_statement_schedules.)] [added: Schedules](#s3D4A083BB9F197E812603020BA0AC33D)] | | [removed: [87](#jb40101_item_15._exhibits_and_financial_statement_schedules.)] [added: [77](#s3D4A083BB9F197E812603020BA0AC33D)] |
10-K 1 mas_20161231x10k.htm 10-K
| | | |
| | | |
| | | | | | | |
| | | | | |
| [1.](#sF04E89B76999F1A2EA9B3020A2742E4B) | | [Business](#sF04E89B76999F1A2EA9B3020A2742E4B) | | [2](#sF04E89B76999F1A2EA9B3020A2742E4B) |
| [2.](#sA2F281FECFBD6FEA4FC33020A9C8084C) | | [Properties](#sA2F281FECFBD6FEA4FC33020A9C8084C) | | [12](#sA2F281FECFBD6FEA4FC33020A9C8084C) |
| [3.](#s6DDE31AA121E79CB24893020A9EF39D3) | | [Legal Proceedings](#s6DDE31AA121E79CB24893020A9EF39D3) | | [13](#s6DDE31AA121E79CB24893020A9EF39D3) |
| | | [PART II](#sFB7A69388F39C81CFB6B3020AA45315E) | | |
| | | [PART IV](#s9EC19A58F2BAF010C89E3020B9D91634) | | |
| [16.](#s041a2ac14f644b70b2ccba2905924c5e) | | [Form 10-K Summary](#s041a2ac14f644b70b2ccba2905924c5e) | | [77](#s3D4A083BB9F197E812603020BA0AC33D) |
| | | [Signatures](#s3D9C2CD552DBE79E4C043020BA31EC55) | | [78](#s3D9C2CD552DBE79E4C043020BA31EC55) |
| | |
| --- | --- |
10-K 1 a2227221z10-k.htm 10-K
Use these links to rapidly review the document
| | | [PART I](#da40101_part_i) | | |
| [1.](#da40101_item_1._business.) | | [Business](#da40101_item_1._business.) | | [2](#da40101_item_1._business.) |
| [2.](#dc40101_item_2._properties.) | | [Properties](#dc40101_item_2._properties.) | | [14](#dc40101_item_2._properties.) |
| [3.](#dc40101_item_3._legal_proceedings.) | | [Legal Proceedings](#dc40101_item_3._legal_proceedings.) | | [15](#dc40101_item_3._legal_proceedings.) |
| | | [PART II](#de40101_part_ii) | | |
| | | [PART IV](#jb40101_part_iv) | | |
| | | [Signatures](#jc40101_signatures) | | [88](#jc40101_signatures) |
An excerpt. Shown here: 40 of 41 rewritten, all 14 added and all 10 removed. The counts are complete. For every sentence, read Cover and table of contents in the FY2016 filing and the FY2015 filing.
Item 1B. Unresolved Staff Comments.
0 rewritten, 2 added, 1 removed, 1 unchanged
| | |
| --- | --- |
Item 2. Properties.
11 rewritten, 11 added, 6 removed, 13 unchanged
| [removed: Business Segment] [added: Business Segment] | | [removed: Manufacturing] [added: Manufacturing] | | | [removed: Warehouse] [added: Warehouse] and [removed: Distribution |] [added: Distribution] | |
| Plumbing Products | | [removed: | 19] [added: 20] | | | [removed: 4] [added: 5] | |
| Decorative Architectural Products | | [removed: |] 8 | | | [removed: 9] [added: 11] | |
| [added: Windows and] Other Specialty Products | | [removed: |] 11 | | | [removed: 6] [added: 5] | |
| Totals | | [removed: | 46] [added: 47] | | | [removed: 27] [added: 29] | |
| Plumbing Products | | [removed: |] 11 | | | 22 | |
| Decorative Architectural Products | | [removed: |] — | | | — | |
| [added: Windows and] Other Specialty Products | | [removed: | 8] [added: 9] | | | — | |
| Totals | | [removed: | 20] [added: 21] | | | 23 | |
We continue to lease an office facility in [removed: Luxembourg] [added: Luxembourg,] which serves as a headquarters for most of our foreign operations.
We have entered into a contract to lease a new corporate headquarters in Livonia, Michigan, which we expect to occupy [removed: beginning] in 2017.
| | | | | | | |
| --- | --- | --- | --- | --- | --- | --- |
| | | | | | | |
| Cabinetry Products | | 8 | | | 8 | |
| | | | | | | |
| --- | --- | --- | --- | --- | --- | --- |
| | | | | | | |
| Business Segment | | Manufacturing | | | Warehouse and Distribution | |
| Cabinetry Products | | 1 | | | 1 | |
| | |
| --- | --- |
| | | | | | | | |
| --- | --- | --- | --- | --- | --- | --- | --- |
| Cabinets and Related Products | | | 8 | | | 8 | |
| | | | | | | | |
| Cabinets and Related Products | | | 1 | | | 1 | |
Item 4. Mine Safety Disclosures.
1 rewritten, 2 added, 1 removed, 1 unchanged
[removed: PART] [added: PART] II
| | |
| --- | --- |
Item 5. Market for Registrant's Common Equity, Related Stockholder Matters and Issuer Purchases of Equity Securities.
17 rewritten, 26 added, 25 removed, 4 unchanged
| | [added: Market Price] | [removed: Market Price] | | | | | | | [added: Dividends Declared] | | [added: |]
| [removed: Quarter] [added: Quarter] | [added: High] | [removed: High] | | | [removed: Low] [added: Low] | | | | | | [added: |]
| 2015 | | | | | | | | | | | [added: |]
| Fourth | [removed: |] $ | 30.61 | | [added: |] $ | 24.89 | | [added: |] $ | [removed: .095] [added: 0.095] | |
| Third | [removed: | |] 28.59 | | | [added: |] 22.52 | | | [removed: .095] | [added: 0.095] | [added: | |]
| Second | [removed: | |] 28.38 | | | [added: |] 25.47 | | | [removed: .09] | [added: 0.090] | [added: | |]
| First | [removed: | |] 27.40 | | | [added: |] 23.23 | | | [removed: .09] | [added: 0.090] | [added: | |]
On January 31, [removed: 2016,] [added: 2017,] there were approximately [removed: 4,200] [added: 4,000] holders of record of our common stock.
During [removed: 2015,] [added: 2016,] we repurchased and retired [removed: 17] [added: nearly 15] million shares of our common stock for cash aggregating [removed: $456] [added: $459] million.
The following table provides information regarding the repurchase of our common stock for the three months ended December 31, [removed: 2015.][added: 2016.]
| [removed: Period |] [added: Period] | [removed: Total] [added: Total] Number of Shares [removed: Purchased] [added: Purchased] | | | [removed: Average] [added: Average] Price Paid Per Common [removed: Share] [added: Share] | | | [removed: Total] [added: | Total] Number of Shares Purchased as Part of Publicly Announced Plans or [removed: Programs] [added: Programs] | | | [removed: Maximum] [added: Maximum] Number of Shares That May Yet Be Purchased Under the Plans or [removed: Programs |] [added: Programs] | |
[removed: Performance Graph][added: Performance Graph]
The table below compares the cumulative total shareholder return on our common stock with the cumulative total return of (i) the Standard & Poor's 500 Composite Stock Index ("S&P 500 Index"), (ii) The Standard & Poor's Industrials Index ("S&P Industrials Index") and (iii) the Standard & Poor's Consumer Durables & Apparel Index ("S&P Consumer Durables & Apparel Index"), from December 31, [removed: 2010] [added: 2011] through December 31, [removed: 2015,] [added: 2016,] when the closing price of our common stock was [removed: $28.30.][added: $31.62.]
The graph assumes investments of $100 on December 31, [removed: 2010] [added: 2011] in our common stock and in each of the three indices and the reinvestment of dividends.
[removed: 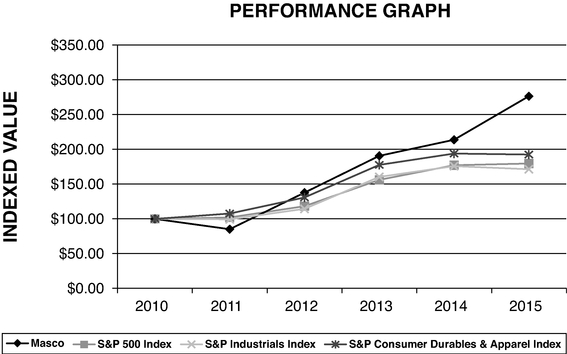][added: 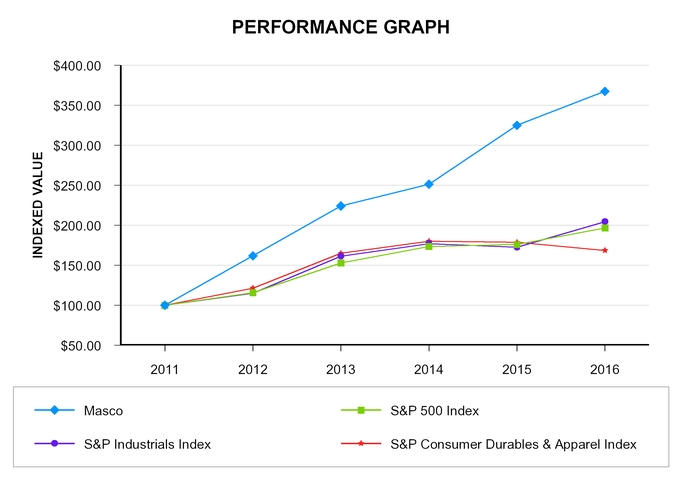]
The table below sets forth the value, as of December 31 for each of the years indicated, of a $100 investment made on December 31, [removed: 2010] [added: 2011] in each of our common stock, the S&P 500 Index, the S&P Industrials Index and the S&P Consumer Durables & Apparel Index and includes the reinvestment of dividends.
| | [added: 2012] | [removed: 2011] | | | [removed: 2012] [added: 2013] | | | [removed: 2013] | [added: 2014] | | [removed: 2014] | | [added: 2015] | [removed: 2015] | | | [added: 2016 | | |]
| | | | | | | | | | | | |
| --- | --- | --- | --- | --- | --- | --- | --- | --- | --- | --- | --- |
| | | | | | | | | | | | |
| 2016 | | | | | | | | | | | |
| Fourth | $ | 35.07 | | | $ | 29.38 | | | $ | 0.100 | |
| Third | 37.38 | | | | 30.31 | | | | 0.100 | | |
| Second | 32.92 | | | | 29.11 | | | | 0.095 | | |
| First | 31.71 | | | | 23.10 | | | | 0.095 | | |
| Total | | | | | | | | | $ | 0.390 | |
| Total | | | | | | | | | $ | 0.370 | |
| | | | | | | | | | | | | |
| --- | --- | --- | --- | --- | --- | --- | --- | --- | --- | --- | --- | --- |
| | | | | | | | | | | | | |
| 10/1/16 - 10/31/16 | 3,633,200 | | | $ | 32.00 | | | 3,633,200 | | | 15,809,196 | |
| 11/1/16 - 11/30/16 | 2,335,200 | | | $ | 30.62 | | | 2,335,200 | | | 13,473,996 | |
| 12/1/16 - 12/31/16 | 604,318 | | | $ | 30.79 | | | 604,318 | | | 12,869,678 | |
| Total for the quarter | 6,572,718 | | | | | | | 6,572,718 | | | 12,869,678 | |
| | | | | | | | | | | | | | | | | | | | |
| --- | --- | --- | --- | --- | --- | --- | --- | --- | --- | --- | --- | --- | --- | --- | --- | --- | --- | --- | --- |
| | | | | | | | | | | | | | | | | | | | |
| Masco | $ | 161.83 | | | $ | 224.10 | | | $ | 251.26 | | | $ | 324.95 | | | $ | 367.49 | |
| S&P 500 Index | $ | 115.88 | | | $ | 153.01 | | | $ | 173.69 | | | $ | 176.07 | | | $ | 196.78 | |
| S&P Industrials Index | $ | 115.17 | | | $ | 161.45 | | | $ | 177.05 | | | $ | 172.56 | | | $ | 204.60 | |
| S&P Consumer Durables & Apparel Index | $ | 121.50 | | | $ | 165.04 | | | $ | 180.20 | | | $ | 178.88 | | | $ | 168.67 | |
| | |
| --- | --- |
| | | | | | | | | | | |
| --- | --- | --- | --- | --- | --- | --- | --- | --- | --- | --- |
| | | Dividends Declared | | | | | | | | |
| | | | | | | | | | | |
| Total | | | | | | | | $ | .370 | |
| 2014 | | | | | | | | | | |
| Fourth | | $ | 25.58 | | $ | 19.84 | | $ | .09 | |
| Third | | | 24.91 | | | 20.18 | | | .09 | |
| Second | | | 23.42 | | | 19.50 | | | .09 | |
| First | | | 23.73 | | | 20.60 | | | .075 | |
| Total | | | | | | | | $ | .345 | |
| | | | | | | | | | | | | | |
| --- | --- | --- | --- | --- | --- | --- | --- | --- | --- | --- | --- | --- | --- |
| 10/1/15 - 10/31/15 | | | 960,000 | | $ | 26.63 | | | 960,000 | | | 28,573,000 | |
| 11/1/15 - 11/30/15 | | | 800,000 | | $ | 29.23 | | | 800,000 | | | 27,773,000 | |
| 12/1/15 - 12/31/15 | | | — | | $ | — | | | — | | | 27,773,000 | |
| | | | | | | | | | | | | | |
| Total for the quarter | | | 1,760,000 | | $ | 27.81 | | | 1,760,000 | | | 27,773,000 | |
| | | | | | | | | | | | | | | | | |
| --- | --- | --- | --- | --- | --- | --- | --- | --- | --- | --- | --- | --- | --- | --- | --- | --- |
| Masco | | $ | 85.15 | | $ | 137.80 | | $ | 190.82 | | $ | 213.95 | | $ | 276.69 | |
| S&P 500 Index | | $ | 102.09 | | $ | 118.30 | | $ | 156.21 | | $ | 177.32 | | $ | 179.76 | |
| S&P Industrials Index | | $ | 99.39 | | $ | 114.48 | | $ | 160.47 | | $ | 175.98 | | $ | 171.52 | |
| S&P Consumer Durables & Apparel Index | | $ | 107.71 | | $ | 130.87 | | $ | 177.77 | | $ | 194.10 | | $ | 192.67 | |
Item 6. Selected Financial Data.
13 rewritten, 21 added, 14 removed, 0 unchanged
| | [removed: | Dollars] [added: Dollars] in Millions (Except Per Common Share [removed: Data)] [added: Data)] | | | | | | | | | | | | | | | [added: | | | |]
| | [added: 2016] | [removed: 2015] | | | [removed: 2014] [added: 2015] | | | [removed: 2013] | [added: 2014] | | [removed: 2012] | | [added: 2013] | [removed: 2011] | | | [added: 2012 | | |]
| Net Sales [removed: (1)] [added: (1)] | [added: $] | [added: 7,357 | | |] $ | 7,142 | | [added: |] $ | 7,006 | | [added: |] $ | 6,761 | | [removed: $] | [removed: 6,286 | |] $ | [removed: 6,093] [added: 6,286] | |
| Operating profit [removed: (loss) (1)(3)(4)] [added: (1)(3)] | [added: 1,053] | | [added: | |] 914 | | | [added: |] 721 | | | [removed: 612] | [added: 612] | | [removed: 384] | | [added: 384] | [removed: (153] | [removed: )] |
| Income [removed: (loss)] from continuing operations attributable to Masco Corporation [removed: (1)(2)(3)(4)] [added: (1)(2)(3)] | [added: 491] | | [added: | |] 357 | | | [added: |] 821 | | | [removed: 259] | [added: 259] | | [removed: 54] | | [added: 54] | [removed: (297] | [removed: )] |
| Income [removed: (loss)] per common share from continuing operations: | | | | | | | | | | | | | | | | | [added: | | |]
| At December 31: | | | | | | | | | | | | | | | | | [added: | | |]
| Total assets [removed: |] [added: (4)] | $ | [removed: 5,680] [added: 5,137] | | [added: |] $ | [removed: 7,208] [added: 5,664] | | [added: |] $ | [removed: 6,885] [added: 7,208] | | [added: |] $ | [removed: 6,842] [added: 6,885] | | [added: |] $ | [removed: 7,294] [added: 6,842] | |
| Long-term debt [added: (4)] | [added: 2,995] | | [removed: 2,418] | | [added: 2,403] | [added: | | |] 2,919 | | | [removed: 3,421] | [added: 3,421] | | [removed: 3,422] | | [added: 3,422] | [removed: 3,222] | |
| Shareholders' [added: (deficit)] equity [removed: (5)] [added: (5)] | [added: (103] | | [added: ) | |] 58 | | | [added: |] 1,128 | | | [removed: 787] | [added: 787] | | [removed: 542] | | [added: 542] | [removed: 750] | |
[added: | (2) |] The year 2014 includes a $529 million tax benefit from the release of the valuation allowance on deferred tax assets. [added: Refer to Note S to the consolidated financial statements for additional information. |]
[added: | (3) |] The year 2012 includes non-cash impairment charges for other intangible assets aggregating $27 million after tax ($42 million pre-tax). [added: |]
[added: | (5) |] The decrease in shareholder's [added: (deficit)] equity from 2014 to 2015 relates primarily to the spin off of [removed: TopBuild Corp.][added: TopBuild. |]
| | | | | | | | | | | | | | | | | | | | |
| --- | --- | --- | --- | --- | --- | --- | --- | --- | --- | --- | --- | --- | --- | --- | --- | --- | --- | --- | --- |
| | | | | | | | | | | | | | | | | | | | |
| Basic | $ | 1.49 | | | $ | 1.04 | | | $ | 2.31 | | | $ | 0.72 | | | $ | 0.15 | |
| Diluted | 1.47 | | | | 1.03 | | | | 2.28 | | | | 0.72 | | | | 0.15 | | |
| Dividends declared | 0.390 | | | | 0.370 | | | | 0.345 | | | | 0.300 | | | | 0.300 | | |
| Dividends paid | 0.385 | | | | 0.365 | | | | 0.330 | | | | 0.300 | | | | 0.300 | | |
| | |
| --- | --- |
| (1) | Amounts exclude discontinued operations. Refer to Note B to the consolidated financial statements for additional information. |
| | |
| --- | --- |
| | |
| --- | --- |
| | |
| --- | --- |
| (4) | Total assets and long-term debt for the years 2012-2014 have not been recasted for the impact of the adoption of Accounting Standards Update 2015-03, as amended by Accounting Standards Update 2015-15, which required the reclassification of certain debt issuance costs from an asset to a liability. Refer to Note A to the consolidated financial statements for additional information. |
| | |
| --- | --- |
| | |
| --- | --- |
| | | | | | | | | | | | | | | | | |
| --- | --- | --- | --- | --- | --- | --- | --- | --- | --- | --- | --- | --- | --- | --- | --- | --- |
| Basic | | $ | 1.04 | | $ | 2.31 | | $ | .72 | | $ | .15 | | $ | (.86 | ) |
| Diluted | | | 1.03 | | | 2.28 | | | .72 | | | .15 | | | (.86 | ) |
| Dividends declared | | | .370 | | | .345 | | | .300 | | | .300 | | | .300 | |
| Dividends paid | | | .365 | | | .330 | | | .300 | | | .300 | | | .300 | |
(1)
Amounts exclude discontinued operations.
(2)
(3)
(4)
The year 2011 includes non-cash impairment charges for goodwill and other intangible assets aggregating $291 million after tax ($450 million pre-tax).
(5)
Item 8. Financial Statements and Supplementary Data.
741 rewritten, 512 added, 180 removed, 286 unchanged
[removed: Management's] [added: Management's] Report on Internal Control Over Financial [removed: Reporting][added: Reporting]
The management of Masco Corporation assessed the effectiveness of the Company's internal control over financial reporting as of December 31, [removed: 2015] [added: 2016] using the criteria set forth by the Committee of Sponsoring Organizations of the Treadway Commission (COSO) in "Internal Control – Integrated Framework." Based on this assessment, management has determined that the Company's internal control over financial reporting was effective as of December 31, [removed: 2015.][added: 2016.]
PricewaterhouseCoopers LLP, an independent registered public accounting firm, performed an audit of the Company's consolidated financial statements and of the effectiveness of Masco Corporation's internal control over financial reporting as of December 31, [removed: 2015.][added: 2016.]
Their report expressed an unqualified opinion on the effectiveness of Masco Corporation's internal control over financial reporting as of December 31, [removed: 2015] [added: 2016] and expressed an unqualified opinion on the Company's [removed: 2015] [added: 2016] consolidated financial statements.
[removed: Report] [added: Report] of Independent Registered Public Accounting Firm
In our opinion, the consolidated financial statements listed in the index appearing under Item 15(a) (1) present fairly, in all material respects, the financial position of Masco Corporation and its subsidiaries at December 31, [removed: 2015] [added: 2016] and [removed: 2014,] [added: 2015,] and the results of their operations and their cash flows for each of the three years in the period ended December 31, [removed: 2015] [added: 2016] in conformity with accounting principles generally accepted in the United States of America.
Also in our opinion, the Company maintained, in all material respects, effective internal control over financial reporting as of December 31, [removed: 2015,] [added: 2016,] based on criteria established in [removed: _Internal] [added: Internal] Control – Integrated Framework [removed: (2013)_] [added: (2013)] issued by the Committee of Sponsoring Organizations of the Treadway Commission (COSO).
at December 31, [removed: 2015] [added: 2016] and [removed: 2014][added: 2015]
| [removed: (In] [added: | (In] Millions, Except Share [removed: Data) |] [added: Data)] | | | | | | |
| | [added: 2016] | [removed: 2015] | | | [removed: 2014] [added: 2015] | | | [added: | 2014 | | |]
| [removed: ASSETS] [added: ASSETS] | | | | | | | |
| [removed: Current Assets:] [added: Current Assets:] | | | | | | | |
| Cash and cash investments | [removed: |] $ | [removed: 1,468] [added: 990] | | [added: |] $ | [removed: 1,379] [added: 1,468] | |
| Short-term bank deposits | [added: 201] | | [removed: 248] | | [added: 248] | [removed: 306] | |
| Receivables | [added: 917] | | [removed: 853] | | [added: 853] | [removed: 820] | |
| Inventories | [added: 712] | | [removed: 687] | | [added: 687] | [removed: 712] | |
| Prepaid expenses and other | [added: 114] | | [removed: 72] | | [added: 72] | [removed: 68] | |
| Assets held for sale | | | [added: | | | | | | | | | | | | | | | | | | | | | |] — | | | [removed: 335] | [added: —] | [added: | | | 1,476 | | |]
| Total current assets | [added: 2,934] | | [removed: 3,328] | | [added: 3,328] | [removed: 3,620] | |
| Property and equipment, net | [added: 1,060] | | [removed: 1,027] | | [added: 1,027] | [removed: 1,046] | |
| Goodwill | [added: 832] | | [removed: 839] | | [added: 839] | [removed: 840] | |
| Other intangible assets, net | [added: 154] | | [removed: 160] | | [added: 160] | [removed: 142] | |
[removed: | Other assets | | | 326 | | | 419 | |][added: OTHER ASSETS]
| Total [removed: Assets] [added: assets] | | [added: | | | | | | | | | | | | | | | | | | | | | | |] $ | [removed: 5,680] [added: 5,137] | | [added: |] $ | [added: 5,664 | | | $ |] 7,208 | |
| [removed: LIABILITIES] [added: LIABILITIES] and [removed: EQUITY] [added: EQUITY] | | | | | | | |
| [removed: Current Liabilities:] [added: Current Liabilities:] | | | | | | | |
| Accounts payable | [removed: |] $ | [removed: 749] [added: 800] | | [added: |] $ | [removed: 721] [added: 749] | |
| Notes payable | [added: 2] | | [removed: 1,005] | | [added: 1,004] | [removed: 505] | |
| Accrued liabilities | | | [removed: 752] | | [added: $] | [removed: 685] [added: (2] | [added: )] |
| Total current liabilities | [added: 1,460] | | [removed: 2,506] | | [added: 2,403] | [removed: 2,211] | |
| Long-term debt | [added: 2,995] | | [removed: 2,418] | | [added: 2,403] | [removed: 2,919] | |
| Other liabilities | | | [removed: 698] | | [added: (1] | [removed: 781] | [added: )] |
| [removed: Equity:] [added: Equity:] | | | | | | | |
| Masco Corporation's shareholders' equity Common shares authorized: 1,400,000,000; issued and outstanding: [removed: 2015] [added: 2016] – [removed: 330,500,000; 2014] [added: 318,000,000; 2015] – [removed: 345,000,000] [added: 330,500,000] | [added: 318] | | [removed: 330] | | [added: 330] | [removed: 345] | |
| Preferred shares authorized: 1,000,000; issued and outstanding: [removed: 2015] [added: 2016] and [removed: 2014] [added: 2015] – None | [removed: | |] — | | | [added: |] — | | [added: |]
| Paid-in capital | [removed: | |] — | | | [added: |] — | | [added: |]
| Retained [removed: (deficit) earnings |] [added: deficit] | [added: (381] | [removed: (300] | ) | | [removed: 690] [added: (300] | | [added: ) |]
| Accumulated other comprehensive loss | [removed: |] [added: (235] | [removed: (165] | ) | | [removed: (111] [added: (165] | [added: |] ) |
| Total Masco Corporation's shareholders' [removed: (deficit) equity |] [added: deficit] | [added: (298] | [removed: (135] | ) | | [removed: 924] [added: (135] | | [added: ) |]
| Noncontrolling interest | [added: 195] | | [removed: 193] | | [added: 193] | [removed: 204] | |
February 9, 2017
| Total Assets | $ | 5,137 | | | $ | 5,664 | |
| Accrued liabilities | 658 | | | | 650 | | |
| Total Liabilities | 5,240 | | | | 5,606 | | |
| | | | | | | | | | | | |
| | | | | | | | | | | | |
| (Loss) income from discontinued operations, net | — | | | | (0.01 | | ) | | 0.10 | | |
| | | | | | | | | | | | |
for the years ended December 31, 2016, 2015 and 2014
| | | | | | | | | | | | |
| --- | --- | --- | --- | --- | --- | --- | --- | --- | --- | --- | --- |
| | | | | | | | | | | | |
| Less: Net income attributable to noncontrolling interest | 43 | | | | 39 | | | | 47 | | |
| Net income attributable to Masco Corporation | $ | 491 | | | $ | 355 | | | $ | 856 | |
| Realized loss on available-for-sale securities | 12 | | | | — | | | | — | | |
| | (10 | | ) | | (14 | | ) | | (37 | | ) |
for the years ended December 31, 2016, 2015 and 2014
| | | | | | | | | | | | |
| --- | --- | --- | --- | --- | --- | --- | --- | --- | --- | --- | --- |
| | | | | | | | | | | | |
| Net income | $ | 534 | | | $ | 394 | | | $ | 903 | |
| | | | | | | | | | | | |
| Debt extinguishment costs | (40 | | ) | | — | | | | — | | |
| | | | | | | | | | | | |
for the years ended December 31, 2016, 2015 and 2014
| | | | | | | | | | | | | | | | | | | | | | | | |
| --- | --- | --- | --- | --- | --- | --- | --- | --- | --- | --- | --- | --- | --- | --- | --- | --- | --- | --- | --- | --- | --- | --- | --- |
| | | | | | | | | | | | | | | | | | | | | | | | |
| Shares retired: | | | | | | | | | | | | | | | | | | | | | | | |
| Shares retired: | | | | | | | | | | | | | | | | | | | | | | | |
| Repurchased | (459 | | ) | | (15 | | ) | | (14 | | ) | | (430 | | ) | | | | | | | | |
| Dividends paid to noncontrolling interest | (31 | | ) | | | | | | | | | | | | | | | | | | (31 | | ) |
| Balance, December 31, 2016 | $ | (103 | ) | | $ | 318 | | | $ | — | | | $ | (381 | ) | | $ | (235 | ) | | $ | 195 | |
A.
Principles of Consolidation.
Use of Estimates and Assumptions in the Preparation of Financial Statements.
Revenue Recognition.
Customer Promotion Costs.
Foreign Currency.
Cash and Cash Investments.
February 12, 2016
| --- | --- | --- | --- | --- | --- | --- | --- |
| | | | | | | | |
| Assets held for sale | | | — | | | 1,141 | |
| Liabilities held for sale | | | — | | | 300 | |
| Liabilities held for sale | | | — | | | 169 | |
| Total Liabilities | | | 5,622 | | | 6,080 | |
| | | | | | | | | | | |
| --- | --- | --- | --- | --- | --- | --- | --- | --- | --- | --- |
| | | | | | | | | | | |
| | | | (14 | ) | | (37 | ) | | 9 | |
| Non-cash loss on disposition of businesses, net | | | — | | | 2 | | | 15 | |
| Businesses, net of cash disposed | | | — | | | — | | | 17 | |
| --- | --- | --- | --- | --- | --- | --- | --- | --- | --- | --- | --- | --- | --- | --- | --- | --- | --- | --- | --- |
| Balance, January 1, 2013 | | $ | 542 | | $ | 349 | | $ | 16 | | $ | (94 | ) | $ | 59 | | $ | 212 | |
| Repurchased | | | (35 | ) | | (2 | ) | | (11 | ) | | (22 | ) | | | | | | |
| | | | | | | | | | | | | | | | | | | | |
A.
Such depreciation expense included accelerated depreciation of $1 million (in the Cabinets and Related Products segment) and $13 million (primarily in the Cabinets and Related Products and Plumbing Products segments) in 2014 and 2013, respectively.
Determining market values using a discounted cash flow method requires us to make significant estimates and assumptions, including long-term projections of cash flows, market conditions and appropriate discount rates.
Our weighted average cost of capital decreased in 2015 as compared to 2014 due to less risk associated with our stock in relation to the capital markets.
Noncontrolling Interest. We own 68 percent of Hansgrohe SE at both December 31, 2015 and 2014.
Recently Issued Accounting Pronouncements. In April 2014, the Financial Accounting Standards Board ("FASB") issued Accounting Standards Update 2014-8 ("ASU 2014-08"), "Reporting of Discontinued Operations and Disclosure of Disposals of Components of an Entity," which changes the criteria for determining which disposals can be presented as discontinued operations and modifies the related disclosure requirements.
We adopted this guidance beginning January 1, 2015.
In November 2015, the FASB issued Accounting Standards Update 2015-17 ("ASU 2015-17"), "Balance Sheet Classification of Deferred Taxes," which changes the criteria for classifying deferred tax balances by requiring all deferred taxes be presented as noncurrent on the balance sheet.
As a result of the retrospective adoption of this standard, current assets decreased by $244 million, non-current assets increased by $219 million and non-current liabilities decreased by $25 million as of December 31, 2014.
We do not expect that the adoptions will have a significant impact on our financial position.
B.
(Losses) gains from this discontinued operation were included in (loss) income from discontinued operations, net, in the consolidated statements of operations.
In February 2013, we determined that Tvilum, our Danish ready-to-assemble cabinet business, was no longer core to our long-term growth strategy and, accordingly, we embarked on a plan for disposition.
In December 2013, we completed the disposition of this business and a related Danish holding company for net proceeds of $17 million.
We have accounted for Tvilum as a discontinued operation.
| Impairment of assets held for sale (4) | | | — | | | — | | | (10 | ) |
(1)
(2)
(3)
Operating loss from discontinued operations reflects the results of Tvilum, including net sales of $265 million in 2013.
(4)
Included in impairment of assets held for sale in 2013 is the impairment of fixed assets.
An excerpt. Shown here: 40 of 741 rewritten, 40 of 512 added and 40 of 180 removed. The counts are complete. For every sentence, read Item 8. Financial Statements and Supplementary Data. in the FY2016 filing and the FY2015 filing.
Item 9. Changes in and Disagreements with Accountants on Accounting and Financial Disclosure.
0 rewritten, 0 added, 1 removed, 1 unchanged
Item 9A. Controls and Procedures.
5 rewritten, 6 added, 7 removed, 3 unchanged
[added: | a. |] Evaluation of Disclosure Controls and Procedures. [added: |]
The Company's principal executive officer and principal financial officer have concluded, based on an evaluation of the Company's disclosure controls and procedures (as defined in the Securities Exchange Act of 1934 Rules 13a-15(e) or 15d-15(e)) as required by paragraph (b) of Exchange Act Rules 13a-15 or 15d-15 that, as of December 31, [removed: 2015,] [added: 2016,] the Company's disclosure controls and procedures were effective.
[added: | b. |] Management's Report on Internal Control over Financial Reporting. [added: |]
[added: | c. |] Changes in Internal Control over Financial Reporting. [added: |]
In connection with the evaluation of the Company's [removed: "internal] [added: internal] control over financial [removed: reporting"] [added: reporting] that occurred during the quarter ended December 31, [removed: 2015,] [added: 2016,] which is required under the Securities Exchange Act of 1934 by paragraph (d) of Exchange Rules 13a-15 or 15d-15 (as defined in paragraph (f) of Rule 13a-15), management determined that there was no change that materially affected or is reasonably likely to materially affect internal control over financial reporting.
| | |
| --- | --- |
| | |
| --- | --- |
| | |
| --- | --- |
a.
b.
c.
During the first quarter of 2016, we started a phased deployment of a new Enterprise Resource Planning ("ERP") system at Milgard.
The system implementation is designed, in part, to enhance the overall system of internal control over financial reporting through further automation and improve business processes and is not in response to any identified deficiency or weakness in the Company's internal control over financial reporting.
However, this system implementation is significant in scale and complexity and will result in modification to certain Milgard internal controls.
Item 9B. Other Information.
1 rewritten, 2 added, 1 removed, 1 unchanged
[removed: PART] [added: PART] III
| | |
| --- | --- |
Item 10. Directors, Executive Officers and Corporate Governance.
1 rewritten, 3 added, 1 removed, 1 unchanged
Other information required by this Item will be contained in our definitive Proxy Statement for the [removed: 2016] [added: 2017] Annual Meeting of Stockholders, to be filed on or before [removed: April 29, 2016,] [added: May 1, 2017,] and such information is incorporated herein by reference.
Amendments to or waivers of our Code of Business Ethics for directors and executive officers, if any, will be posted on our website.
| | |
| --- | --- |
Item 11. Executive Compensation.
1 rewritten, 2 added, 1 removed, 0 unchanged
Information required by this Item will be contained in our definitive Proxy Statement for the [removed: 2016] [added: 2017] Annual Meeting of Stockholders, to be filed on or before [removed: April 29, 2016,] [added: May 1, 2017] and such information is incorporated herein by reference.
| | |
| --- | --- |
Item 12. Security Ownership of Certain Beneficial Owners and Management and Related Stockholder Matters.
4 rewritten, 6 added, 4 removed, 2 unchanged
[removed: Equity] [added: Equity] Compensation Plan [removed: Information][added: Information]
The following table sets forth information as of December 31, [removed: 2015] [added: 2016] concerning the [removed: 2015] [added: 2014] Plan, which was approved by our stockholders.
| [removed: Plan Category |] [added: Plan Category] | [removed: Number] [added: Number] of Securities to be Issued Upon Exercise of Outstanding Options, Warrants and [removed: Rights] [added: Rights] | | | [removed: Weighted-Average] [added: Weighted-Average] Exercise Price of Outstanding Options, Warrants and [removed: Rights] [added: Rights] | | | [removed: Number] [added: | Number] of Securities Remaining Available for Future Issuance Under Equity Compensation Plans (Excluding Securities Reflected in the First [removed: Column) |] [added: Column)] | |
The remaining information required by this Item will be contained in our definitive Proxy Statement for our [removed: 2016] [added: 2017] Annual Meeting of Stockholders, to be filed on or before [removed: April 29, 2016,] [added: May 1, 2017,] and such information is incorporated herein by reference.
| | | | | | | | | | |
| --- | --- | --- | --- | --- | --- | --- | --- | --- | --- |
| | | | | | | | | | |
| Equity compensation plans approved by stockholders | 7,024,915 | | | $ | 14.85 | | | 16,333,266 | |
| | |
| --- | --- |
| | | | | | | | | | | |
| --- | --- | --- | --- | --- | --- | --- | --- | --- | --- | --- |
| Equity compensation plans approved by stockholders | | | 12,278,037 | | $ | 17.44 | | | 17,126,332 | |
Item 13. Certain Relationships and Related Transactions, and Director Independence.
1 rewritten, 2 added, 1 removed, 0 unchanged
Information required by this Item will be contained in our definitive Proxy Statement for the [removed: 2016] [added: 2017] Annual Meeting of Stockholders, to be filed on or before [removed: April 29, 2016,] [added: May 1, 2017,] and such information is incorporated herein by reference.
| | |
| --- | --- |
Item 14. Principal Accountant Fees and Services.
2 rewritten, 2 added, 1 removed, 0 unchanged
Information required by this Item will be contained in our definitive Proxy Statement for the [removed: 2016] [added: 2017] Annual Meeting of Stockholders, to be filed on or before [removed: April 29, 2016,] [added: May 1, 2017,] and such information is incorporated herein by reference.
[removed: PART] [added: PART] IV
| | |
| --- | --- |
Item 15. Exhibits and Financial Statement Schedules.
7 rewritten, 15 added, 144 removed, 5 unchanged
[removed: _Financial Statements._] [added: | (1) | Financial Statements.] Our consolidated financial statements included in Item 8 hereof, as required at December 31, [removed: 2015] [added: 2016] and [removed: 2014,] [added: 2015,] and for the years ended December 31, [removed: 2015, 2014] [added: 2016, 2015] and [removed: 2013,] [added: 2014,] consist of the following: [added: |]
| [removed: [](#fi40101_masco_corporation_and_consolid__mas05193)] [Consolidated Statements of Comprehensive Income [removed: (Loss)](#fi40101_masco_corporation_and_consolid__mas05193) |] [added: (Loss)](#s36B739E0981F2DB02526302098B1B25A)] | [removed: [43](#fi40101_masco_corporation_and_consolid__mas05193)] [added: [39](#s36B739E0981F2DB02526302098B1B25A)] |
| [removed: [](#fo40101_masco_corporation_note__fo402517)] [Notes to Consolidated Financial [removed: Statements](#fo40101_masco_corporation_note__fo402517) |] [added: Statements](#s22D9E1AC8DCE512DF1863020AFADC5A2)] | [removed: [46](#fo40101_masco_corporation_note__fo402517)] [added: [42](#s22D9E1AC8DCE512DF1863020AFADC5A2)] |
[removed: _Financial] [added: | (2) | Financial] Statement [removed: Schedule._][added: Schedule. |]
Our Financial Statement Schedule appended hereto, as required for the years ended December 31, [removed: 2015, 2014] [added: 2016, 2015] and [removed: 2013,] [added: 2014,] consists of the following:
[removed: _Exhibits._][added: | (3) | Exhibits. |]
See separate Exhibit Index beginning on page [removed: 91.][added: 81.]
| | |
| --- | --- |
| | |
| --- | --- |
| | |
| [Consolidated Balance Sheets](#s656A00392445F4F84F6B3020985D5419) | [37](#s656A00392445F4F84F6B3020985D5419) |
| [Consolidated Statements of Operations](#s91B4C71BA9A185864FA630209884D0E1) | [38](#s91B4C71BA9A185864FA630209884D0E1) |
| [Consolidated Statements of Cash Flows](#s965FF9F8DB1DE75A07A7302098C7FB5D) | [40](#s965FF9F8DB1DE75A07A7302098C7FB5D) |
| [Consolidated Statements of Shareholders' Equity](#s0C0D8FEAB8F041EADC8A3020993F1D0F) | [41](#s0C0D8FEAB8F041EADC8A3020993F1D0F) |
| | |
| --- | --- |
| | |
| --- | --- |
| | |
| --- | --- |
_(1)_
| | | |
| --- | --- | --- |
| [](#fe40101_financial_statements_and_suppl__fin05323) [Consolidated Balance Sheets](#fe40101_financial_statements_and_suppl__fin05323) | | [41](#fe40101_financial_statements_and_suppl__fin05323) |
| [](#fg40101_masco_corporation_and_consolid__mas04635) [Consolidated Statements of Operations](#fg40101_masco_corporation_and_consolid__mas04635) | | [42](#fg40101_masco_corporation_and_consolid__mas04635) |
| [](#fk40101_masco_corporation_and_consolid__mas04608) [Consolidated Statements of Cash Flows](#fk40101_masco_corporation_and_consolid__mas04608) | | [44](#fk40101_masco_corporation_and_consolid__mas04608) |
| [](#fm40101_masco_corporation_and_consolid__mas05040) [Consolidated Statements of Shareholders' Equity](#fm40101_masco_corporation_and_consolid__mas05040) | | [45](#fm40101_masco_corporation_and_consolid__mas05040) |
_(2)_
Valuation and Qualifying Accounts
_(3)_
SIGNATURES
Pursuant to the requirements of Section 13 or 15(d) of the Securities Exchange Act of 1934, the Registrant has duly caused this Report to be signed on its behalf by the undersigned, thereunto duly authorized.
| | | | | |
| --- | --- | --- | --- | --- |
| | | MASCO CORPORATION | | |
| | | By: | | /s/ JOHN G. SZNEWAJS John G. Sznewajs |
| | | | | _Vice President, Treasurer and Chief Financial Officer _ |
February 12, 2016
Pursuant to the requirements of the Securities Exchange Act of 1934, this Report has been signed below by the following persons on behalf of the Registrant and in the capacities and on the date indicated.
| | | | | | | |
| --- | --- | --- | --- | --- | --- | --- |
| Principal Executive Officer: | | | | | | |
| /s/ KEITH ALLMAN Keith Allman | | _President, Chief Executive Officer and Director_ | | | | |
| Principal Financial Officer: | | | | | | |
| /s/ JOHN G. SZNEWAJS John G. Sznewajs | | _Vice President, Treasurer and Chief Financial Officer_ | | | | |
| Principal Accounting Officer: | | | | | | |
| /s/ JOHN P. LINDOW John P. Lindow | | _Vice President – Controller_ | | | | |
| /s/ J. MICHAEL LOSH J. Michael Losh | | _Chairman of the Board_ | | | | |
| /s/ MARK R. ALEXANDER Mark R. Alexander | | _Director_ | | | | |
| /s/ DENNIS W. ARCHER Dennis W. Archer | | _Director_ | | | | _February 12, 2016_ |
| /s/ RICHARD A. MANOOGIAN Richard A. Manoogian | | _Chairman Emeritus_ | | | | |
| /s/ CHRISTOPHER A. O'HERLIHY Christopher A. O'Herlihy | | _Director_ | | | | |
| /s/ DONALD R. PARFET Donald R. Parfet | | _Director_ | | | | |
| /s/ LISA A. PAYNE Lisa A. Payne | | _Director_ | | | | |
| /s/ JOHN C. PLANT John C. Plant | | _Director_ | | | | |
| /s/ REGINALD M. TURNER, JR. Reginald M. Turner, Jr. | | _Director_ | | | | |
| /s/ MARY ANN VAN LOKEREN Mary Ann Van Lokeren | | _Director_ | | | | |
MASCO CORPORATION
SCHEDULE II.
An excerpt. Shown here: all 7 rewritten, all 15 added and 40 of 144 removed. The counts are complete. For every sentence, read Item 15. Exhibits and Financial Statement Schedules. in the FY2016 filing and the FY2015 filing.
Item 16. Form 10-K Summary
0 rewritten, 162 added, 0 removed, 0 unchanged
New section this year
The optional summary in Item 16 has not been included in this Form 10-K.
SIGNATURES
Pursuant to the requirements of Section 13 or 15(d) of the Securities Exchange Act of 1934, the Registrant has duly caused this Report to be signed on its behalf by the undersigned, thereunto duly authorized.
| | | |
| --- | --- | --- |
| | | |
| | MASCO CORPORATION | |
| | By: | /s/ John G. Sznewajs |
| | | John G. Sznewajs Vice President and Chief Financial Officer |
February 9, 2017
Pursuant to the requirements of the Securities Exchange Act of 1934, this Report has been signed below by the following persons on behalf of the Registrant and in the capacities and on the date indicated.
| | | | | |
| --- | --- | --- | --- | --- |
| | | | | |
| Principal Executive Officer: | | | | |
| /s/ Keith Allman | | President, Chief Executive Officer and Director | | |
| Keith Allman | | | | |
| Principal Financial Officer: | | | | |
| /s/ John G. Sznewajs | | Vice President and Chief Financial Officer | | |
| John G. Sznewajs | | | | |
| Principal Accounting Officer: | | | | |
| /s/ John P. Lindow | | Vice President, Controller and Chief Accounting Officer | | |
| John P. Lindow | | | | |
| /s/ J. Michael Losh | | Chairman of the Board | | |
| J. Michael Losh | | | | |
| /s/ Mark R. Alexander | | Director | | |
| Mark R. Alexander | | | February 9, 2017 | |
| /s/ Richard A. Manoogian | | Chairman Emeritus | | |
| Richard A. Manoogian | | | | |
| /s/ Christopher A. O'Herlihy | | Director | | |
| Christopher A. O'Herlihy | | | | |
| /s/ Donald R. Parfet | | Director | | |
| Donald R. Parfet | | | | |
| /s/ Lisa A. Payne | | Director | | |
| Lisa A. Payne | | | | |
| /s/ John C. Plant | | Director | | |
| John C. Plant | | | | |
| /s/ Reginald M. Turner, Jr. | | Director | | |
| Reginald M. Turner, Jr. | | | | |
| /s/ Mary Ann Van Lokeren | | Director | | |
An excerpt. Shown here: all 0 rewritten, 40 of 162 added and all 0 removed. The counts are complete. For every sentence, read Item 16. Form 10-K Summary in the FY2016 filing.