 filings.tools
Item 5. Market for Registrant's Common Equity, Related Stockholder Matters and Issuer Purchases of Equity Securities.
6K characters. Original on sec.gov · Markdown
Item 5. Market for Registrant's Common Equity, Related Stockholder Matters and Issuer Purchases of Equity Securities.
The New York Stock Exchange is the principal market on which our common stock is traded. The following table indicates the high and low sales prices of our common stock as reported by the New York Stock Exchange and the cash dividends declared per common share for the periods indicated:
| Market Price | Dividends Declared | ||||||||||
| Quarter | High | Low | |||||||||
| 2017 | |||||||||||
| Fourth | $ | 44.44 | $ | 38.34 | $ | 0.105 | |||||
| Third | 39.15 | 36.08 | 0.105 | ||||||||
| Second | 39.37 | 32.97 | 0.100 | ||||||||
| First | 34.92 | 31.29 | 0.100 | ||||||||
| Total | $ | 0.410 | |||||||||
| 2016 | |||||||||||
| Fourth | $ | 35.07 | $ | 29.38 | $ | 0.100 | |||||
| Third | 37.38 | 30.31 | 0.100 | ||||||||
| Second | 32.92 | 29.11 | 0.095 | ||||||||
| First | 31.71 | 23.10 | 0.095 | ||||||||
| Total | $ | 0.390 |
On January 31, 2018, there were approximately 3,700 holders of record of our common stock.
We expect that our practice of paying quarterly dividends on our common stock will continue, although the payment of future dividends is at the discretion of our Board of Directors and will depend upon our earnings, capital requirements, financial condition and other factors.
In May 2017, our Board of Directors authorized the repurchase, for retirement, of up to $1.5 billion of shares of our common stock in open-market transactions or otherwise, replacing the previous Board of Directors authorization established in 2014. During 2017, we repurchased and retired 9.2 million shares of our common stock (including 0.9 million shares to offset the dilutive impact of long-term stock awards granted during the year), for approximately $331 million. At December 31, 2017, we had approximately $1.3 billion remaining under the 2017 authorization. The following table provides information regarding the repurchase of our common stock for the three-month period ended December 31, 2017.
| Period | Total Number of Shares Purchased | Average Price Paid Per Common Share | Total Number of Shares Purchased as Part of Publicly Announced Plans or Programs | Maximum Value of Shares That May Yet Be Purchased Under the Plans or Programs | |||||||||
| 10/1/17 - 10/31/17 (A) | 718,997 | — | 718,997 | $ | 1,308,607,235 | ||||||||
| 11/1/17 - 11/30/17 | 487,316 | $ | 39.04 | 487,316 | $ | 1,289,581,762 | |||||||
| 12/1/17 - 12/31/17 | — | — | — | $ | 1,289,581,762 | ||||||||
| Total for the quarter | 1,206,313 | 1,206,313 | $ | 1,289,581,762 |
| (A) | In August 2017, we entered into an accelerated stock repurchase transaction whereby we agreed to repurchase a total of $150 million of our common stock with an immediate delivery of 3.3 million shares. This transaction was completed in October 2017, at which time we received, at no additional cost, 0.7 million additional shares of our common stock resulting from changes in the volume weighted average stock price of our common stock over the term of the transaction. |
Performance Graph
The table below compares the cumulative total shareholder return on our common stock with the cumulative total return of (i) the Standard & Poor's 500 Composite Stock Index ("S&P 500 Index"), (ii) The Standard & Poor's Industrials Index ("S&P Industrials Index") and (iii) the Standard & Poor's Consumer Durables & Apparel Index ("S&P Consumer Durables & Apparel Index"), from December 31, 2012 through December 31, 2017, when the closing price of our common stock was $43.94. The graph assumes investments of $100 on December 31, 2012 in our common stock and in each of the three indices and the reinvestment of dividends.
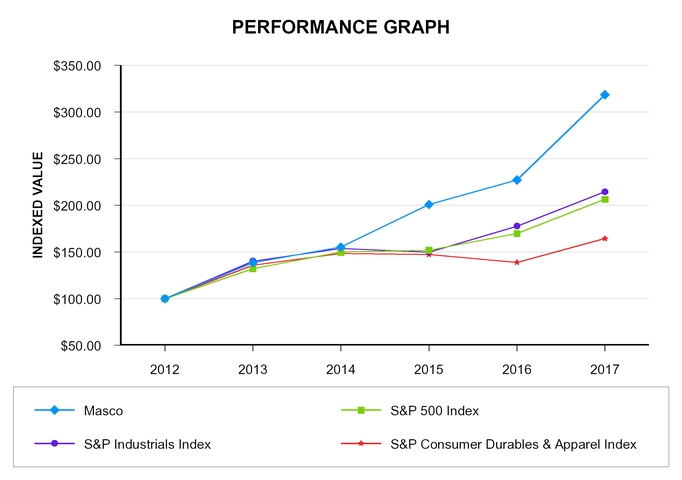
The table below sets forth the value, as of December 31 for each of the years indicated, of a $100 investment made on December 31, 2012 in each of our common stock, the S&P 500 Index, the S&P Industrials Index and the S&P Consumer Durables & Apparel Index and includes the reinvestment of dividends.
| 2013 | 2014 | 2015 | 2016 | 2017 | |||||||||||||||
| Masco | $ | 138.48 | $ | 155.26 | $ | 200.79 | $ | 227.08 | $ | 318.46 | |||||||||
| S&P 500 Index | $ | 132.04 | $ | 149.89 | $ | 151.94 | $ | 169.82 | $ | 206.49 | |||||||||
| S&P Industrials Index | $ | 140.18 | $ | 153.73 | $ | 149.83 | $ | 177.65 | $ | 214.55 | |||||||||
| S&P Consumer Durables & Apparel Index | $ | 135.84 | $ | 148.31 | $ | 147.23 | $ | 138.82 | $ | 164.39 |
Previous: Item 4. Mine Safety Disclosures. · Next: Item 6. Selected Financial Data.