 filings.tools
Item 5. Market for Registrant’s Common Equity, Related Shareholder Matters and Issuer Purchases of Equity Securities
7K characters. Original on sec.gov ·
Item 5. Market for Registrant’s Common Equity, Related Shareholder Matters and Issuer Purchases of Equity Securities
| |
MARKET INFORMATION AND DIVIDEND POLICY
The Company’s common stock trades under the symbol MCD and is listed on the New York Stock Exchange in the U.S. The following table sets forth the common stock price ranges on the New York Stock Exchange and dividends declared per common share:
| 2016 | 2015 | ||||||||||||||||||
| Dollars per share | High | Low | Dividend | High | Low | Dividend | |||||||||||||
| Quarter: | |||||||||||||||||||
| First | 126.96 | 112.71 | 0.89 | 101.09 | 88.77 | 0.85 | |||||||||||||
| Second | 131.96 | 116.08 | 0.89 | 101.08 | 94.02 | 0.85 | |||||||||||||
| Third | 128.60 | 113.96 | 1.83 | * | 101.88 | 87.50 | 0.85 | ||||||||||||
| Fourth | 124.00 | 110.33 | — | 120.23 | 97.13 | 0.89 | |||||||||||||
| Year | 131.96 | 110.33 | 3.61 | 120.23 | 87.50 | 3.44 |
| * | Includes an $0.89 per share dividend declared and paid in third quarter, and a $0.94 per share dividend declared in third quarter and paid in fourth quarter. |
The number of shareholders of record and beneficial owners of the Company’s common stock as of January 31, 2017 was estimated to be 1,658,000.
Given the Company’s returns on incremental invested capital and assets, management believes it is prudent to reinvest in the business in markets with acceptable returns and/or opportunity for long-term growth and use excess cash flow to return cash to shareholders through dividends and share repurchases. The Company has paid dividends on common stock for 41 consecutive years through 2016 and has increased the dividend amount at least once every year. As in the past, future dividend amounts will be considered after reviewing profitability expectations and financing needs, and will be declared at the discretion of the Company’s Board of Directors.
ISSUER PURCHASES OF EQUITY SECURITIES
The following table presents information related to repurchases of common stock the Company made during the quarter ended December 31, 2016*:
| Period | Total Number of Shares Purchased | Average Price Paid per Share | Total Number of Shares Purchased as Part of Publicly Announced Plans or Programs(1) | Approximate Dollar Value of Shares that May Yet Be Purchased Under the Plans or Programs(1) | ||||||||||
| October 1-31, 2016 | 5,902,572 | 113.43 | 5,902,572 | $ | 4,571,138,206 | |||||||||
| November 1-30, 2016 | 3,076,425 | 116.25 | 3,076,425 | 4,213,514,184 | ||||||||||
| December 1-31, 2016 | 2,915,083 | 121.76 | 2,915,083 | 3,858,569,963 | ||||||||||
| Total | 11,894,080 | 116.20 | 11,894,080 |
| * | Subject to applicable law, the Company may repurchase shares directly in the open market, in privately negotiated transactions, or pursuant to derivative instruments and plans complying with Rule 10b5-1, among other types of transactions and arrangements. |
| (1) | On December 3, 2015, the Company's Board of Directors approved a share repurchase program, effective January 1, 2016, that authorized the purchase of up to $15 billion of the Company's outstanding common stock with no specified expiration date. |
10 McDonald's Corporation 2016 Annual Report
| Stock Performance Graph |
At least annually, we consider which companies comprise a readily identifiable investment peer group. McDonald's is included in published restaurant indices; however, unlike most other companies included in these indices, which have no or limited international operations, McDonald's does business in more than 100 countries and a substantial portion of our revenues and income is generated outside the U.S. In addition, because of our size, McDonald's inclusion in those indices tends to skew the results. Therefore, we believe that such a comparison is not meaningful.
Our market capitalization, trading volume and importance in an industry that is vital to the U.S. economy have resulted in McDonald's inclusion in the Dow Jones Industrial Average (DJIA) since 1985. Like McDonald's, many DJIA companies generate meaningful revenues and income outside the U.S. and some manage global brands. Thus, we believe that the use of the DJIA companies as the group for comparison purposes is appropriate.
The following performance graph shows McDonald's cumulative total shareholder returns (i.e., price appreciation and reinvestment of dividends) relative to the Standard & Poor's 500 Stock Index (S&P 500 Index) and to the DJIA companies for the five-year period ended December 31, 2016. The graph assumes that the value of an investment in McDonald's common stock, the S&P 500 Index and the DJIA companies (including McDonald's) was $100 at December 31, 2011. For the DJIA companies, returns are weighted for market capitalization as of the beginning of each period indicated. These returns may vary from those of the Dow Jones Industrial Average Index, which is not weighted by market capitalization, and may be composed of different companies during the period under consideration.
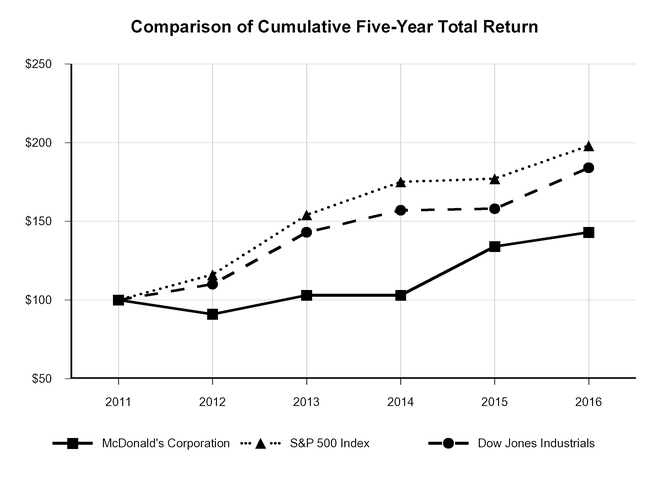
| Company/Index | 12/31/2011 | 12/31/2012 | 12/31/2013 | 12/31/2014 | 12/31/2015 | 12/31/2016 |
| McDonald's Corporation | $100 | $91 | $103 | $103 | $134 | $143 |
| S&P 500 Index | 100 | 116 | 154 | 175 | 177 | 198 |
| Dow Jones Industrials | 100 | 110 | 143 | 157 | 158 | 184 |
Source: S&P Capital IQ
McDonald's Corporation 2016 Annual Report 11
Previous: Item 4. Mine Safety Disclosures · Next: Item 6. Selected Financial Data