 filings.tools
McKesson 10-K 2018-03-31
Filed 2018-05-24. 21 sections, 597K characters. Original on sec.gov · Markdown · JSON
Cover and table of contents
10-K 1 mck_10kx3312018.htm 10-K
UNITED STATES
SECURITIES AND EXCHANGE COMMISSION
Washington, D.C. 20549
FORM 10-K
| x | ANNUAL REPORT PURSUANT TO SECTION 13 OR 15(d) OF THE SECURITIES EXCHANGE ACT OF 1934 |
For the fiscal year ended March 31, 2018
OR
| TRANSITION REPORT PURSUANT TO SECTION 13 OR 15(d) OF THE SECURITIES EXCHANGE ACT OF 1934 |
For the transition period from to
Commission File Number: 1-13252
McKESSON CORPORATION
(Exact name of registrant as specified in its charter)
| Delaware | 94-3207296 | |
| (State or other jurisdiction of incorporation or organization) | (I.R.S. Employer Identification No.) | |
| One Post Street, San Francisco, California | 94104 | |
| (Address of principal executive offices) | (Zip Code) |
(415) 983-8300
(Registrant’s telephone number, including area code)
Securities registered pursuant to Section 12(b) of the Act:
| (Title of each class) | (Name of each exchange on which registered) | |
| Common stock, $0.01 par value | New York Stock Exchange |
Securities registered pursuant to Section 12(g) of the Act: None
Indicate by check mark if the registrant is a well-known seasoned issuer, as defined in Rule 405 of the Securities Act. Yes x No ¨
Indicate by check mark if the registrant is not required to file reports pursuant to Section 13 or 15(d) of the Act. Yes ¨ No x
Indicate by check mark whether the registrant (1) has filed all reports required to be filed by Section 13 or 15(d) of the Securities Exchange Act of 1934 during the preceding 12 months (or for such shorter period that the registrant was required to file such reports), and (2) has been subject to such filing requirements for the past 90 days. Yes x No ¨
Indicate by check mark whether the registrant has submitted electronically and posted on its corporate Web site, if any, every Interactive Data File required to be submitted and posted pursuant to Rule 405 of Regulation S-T (§232.405 of this chapter) during the preceding 12 months (or for such shorter period that the registrant was required to submit and post such files). Yes x No ¨
Indicate by check mark if disclosure of delinquent filers pursuant to Item 405 of Regulation S-K (§229.405 of this chapter) is not contained herein, and will not be contained, to the best of registrant’s knowledge, in definitive proxy or information statements incorporated by reference in Part III of this Form 10-K or any amendment to this Form 10-K. x
Indicate by check mark whether the registrant is a large accelerated filer, an accelerated filer, a non-accelerated filer, or a smaller reporting company. See the definitions of “large accelerated filer,” “accelerated filer” and “smaller reporting company” in Rule 12b-2 of the Exchange Act. (Check one):
| Large accelerated filer | x | Accelerated filer | ¨ | |||
| Non-accelerated filer | ¨ (Do not check if a smaller reporting company) | Smaller reporting company | ¨ | |||
| Emerging growth company | ¨ |
If an emerging growth company, indicate by check mark if the registrant has elected not to use the extended transition period for complying with any new or revised financial accounting standards provided pursuant to Section 13(a) of the Exchange Act. ¨
Indicate by check mark whether the registrant is a shell company (as defined in Rule 12b-2 of the Act).
Yes ¨ No x
The aggregate market value of the voting and non-voting common equity held by non-affiliates of the registrant, computed by reference to the closing price as of the last business day of the registrant’s most recently completed second fiscal quarter, September 30, 2017, was approximately $32 billion.
Number of shares of common stock outstanding on April 30, 2018: 202,050,986
DOCUMENTS INCORPORATED BY REFERENCE
Portions of the registrant’s Proxy Statement for its 2018 Annual Meeting of Stockholders are incorporated by reference into Part III of this Annual Report on Form 10-K.
McKESSON CORPORATION
TABLE OF CONTENTS
McKESSON CORPORATION
PART I
Item 1. Business.
General
McKesson Corporation (“McKesson,” the “Company,” or “we” and other similar pronouns), currently ranked 6th on the FORTUNE 500, is a global leader in healthcare supply chain management solutions, retail pharmacy, community oncology and specialty care, and healthcare information technology. We partner with manufacturers, providers, pharmacies, governments and other organizations in healthcare to help provide the right medicines, medical products and healthcare services to the right patients at the right time, safely and cost-effectively.
The Company’s fiscal year begins on April 1 and ends on March 31. Unless otherwise noted, all references in this document to a particular year shall mean the Company’s fiscal year.
Our Annual Report on Form 10-K, Quarterly Reports on Form 10-Q, Current Reports on Form 8-K and amendments to those reports filed or furnished pursuant to Section 13(a) or 15(d) of the Securities Exchange Act of 1934, as amended (the “Exchange Act,”) are available free of charge on our website (www.mckesson.com under the “Investors — Financial Information — SEC Filings” caption) as soon as reasonably practicable after we electronically file such material with, or furnish it to, the Securities and Exchange Commission (“SEC” or the “Commission”). The content on any website referred to in this Annual Report on Form 10-K is not incorporated by reference into this report, unless expressly noted otherwise.
The public may also read or copy any materials that we file with the SEC at the SEC’s Public Reference Room at 100 F Street, N.E., Washington, DC 20549. The public may obtain information on the operation of the Public Reference Room by calling the SEC at 1-800-SEC-0330. The SEC maintains a website that contains reports, proxy and information statements, and other information regarding issuers, including the Company, that file electronically with the SEC. The address of the website is www.sec.gov.
Business Segments
Through the end of 2018, we operated our business through two reportable segments: McKesson Distribution Solutions (“MDS”) and McKesson Technology Solutions (“MTS”).
Our Distribution Solutions segment distributes brand, generic, specialty, biosimilar and over-the-counter (“OTC”) pharmaceutical drugs and other healthcare-related products worldwide. This segment provides practice management, technology, clinical support and business solutions to community-based oncology and other specialty practices. This segment also provides solutions for manufacturers including offering multiple distribution channels and clinical trial access to our network of oncology physicians. It also provides medical-surgical supply distribution, equipment, logistics, and other services to healthcare providers within the United States. Additionally, this segment operates retail pharmacy chains in Europe and Canada, and supports independent pharmacies within North America and Europe. It also sells financial, operational and clinical solutions to pharmacies (retail, hospital, alternate site) and provides consulting, outsourcing and other services.
Our Technology Solutions segment provides clinical, financial and supply chain management solutions to healthcare organizations and owns approximately 70% equity interest in a joint venture, Change Healthcare Holdings, LLC (“Change Healthcare”), which was formed in the fourth quarter of 2017.
Distribution Solutions segment:
Our Distribution Solutions segment consists of the following businesses: North America pharmaceutical distribution and services, International pharmaceutical distribution and services and Medical-Surgical distribution and services.
North America pharmaceutical distribution and services
Our North America pharmaceutical distribution and services business is the largest pharmaceutical distributor in the United States with more than 40,000 customers and is comprised of the following business units: U.S. Pharmaceutical Distribution, McKesson Specialty Health, McKesson Canada and McKesson Prescription Technology Solutions (“MRxTS”).
McKESSON CORPORATION
U.S. Pharmaceutical Distribution
This business is the largest pharmaceutical distributor in the United States with more than 40,000 customers. This business supplies brand, generic, specialty, biosimilar and OTC pharmaceutical drugs and other healthcare-related products to customers throughout the United States and Puerto Rico through three primary customer channels: (1) Retail national accounts which includes national and regional chains, food and drug combinations, mail order pharmacies and mass merchandisers; (2) Independent retail pharmacies; and (3) Institutional healthcare providers such as hospitals, health systems, integrated delivery networks and long-term care providers. This business also provides solutions and services to pharmaceutical manufacturers. This business provides secondary distribution of generics and medical supplies and consulting services. We also source generic pharmaceutical drugs through our joint sourcing entity, ClarusONE Sourcing Services, LLP (“ClarusONE”), which was formed in 2017.
Our U.S. pharmaceutical distribution business operates and serves customer locations in all 50 states and Puerto Rico through a network of 27 distribution centers, as well as a primary redistribution center, two strategic redistribution centers and two repackaging facilities. We invest in technology and other systems at all of our distribution centers to enhance safety and reliability and product availability. For example, we offer McKesson ConnectSM, an internet-based ordering system that provides item lookup and real-time inventory availability as well as ordering, purchasing, third-party reconciliation and account management functionality. We make extensive use of technology as an enabler to ensure customers have the right products at the right time in the right place.
To maximize distribution efficiency and effectiveness, we follow the Six Sigma methodology — an analytical approach that emphasizes setting high-quality objectives, collecting data and analyzing results to a fine degree in order to improve processes, reduce costs, enhance service accuracy and safety. We provide solutions to our customers including supply management technology, world-class marketing programs, managed care, repackaging products and services to help them meet their business and quality goals. We continue to implement information systems to help achieve greater consistency and accuracy both internally and for our customers.
The major customer groups of our U.S. Pharmaceutical Distribution business can be categorized as: retail national accounts, independent retail pharmacies and institutional healthcare providers.
Retail National Accounts: We provide business solutions that help retail national account customers increase revenues and profitability. Solutions include:
| • | Central FillSM — Prescription refill service that enables pharmacies to more quickly refill prescriptions remotely, more accurately and at a lower cost, while reducing inventory levels and improving customer service. |
| • | Redistribution Centers — Two facilities totaling over 750,000 square feet that offer access to inventory for single source warehouse purchasing, including pharmaceuticals and biologics. These distribution centers also provide the foundation for a two-tiered distribution network that supports best-in-class direct store delivery. |
| • | McKesson SynerGx® — Generic pharmaceutical purchasing program and inventory management that helps pharmacies maximize their cost savings with a broad selection of generic drugs, competitive pricing and one-stop shopping. |
| • | RxPakSM — Bulk-to-bottle repackaging service that leverages our purchasing scale and supplier relationships to provide pharmaceuticals at reduced prices, help increase inventory turns and reduce working capital investment. |
| • | Inventory Management — An integrated solution comprising forecasting software and automated replenishment technologies that reduce inventory-carrying costs. |
| • | ExpressRx Track™ — Pharmacy automation solution featuring state-of-the-art robotics, upgraded imaging and expanded vial capabilities, and industry-leading speed and accuracy in a small footprint. |
McKESSON CORPORATION
Independent Retail Pharmacies: We provide managed care contracting, branding and advertising, merchandising, purchasing, operational efficiency and automation that help independent pharmacists focus on patient care while improving profitability. Solutions include:
| • | Health Mart® — Health Mart® is a national network of more than 4,800 independently-owned pharmacies and is one of the industry’s most comprehensive pharmacy franchise programs. Health Mart® provides franchisees support for managed care contracting, branding and local marketing solutions, the Health Mart private label line of products, merchandising solutions and programs for enhanced patient support. |
| • | Health Mart Atlas® — Comprehensive managed care and reconciliation assistance services that help independent pharmacies save time, access competitive reimbursement rates and improve cash flow. |
| • | McKesson Reimbursement AdvantageSM (“MRA”) — MRA is one of the industry’s most comprehensive reimbursement optimization packages, comprising financial services (automated claim resubmission), analytic services and customer care. |
| • | McKesson OneStop Generics® — Generic pharmaceutical purchasing program that helps pharmacies maximize their cost savings with a broad selection of generic drugs, competitive pricing and one-stop shopping. |
| • | Sunmark® — Complete line of more than 600 products that provide independent retail pharmacies with value-priced alternatives to national brands. |
| • | FrontEdge™ — Strategic planning, merchandising and price maintenance program that helps independent pharmacies maximize store profitability. |
| • | McKesson Sponsored Clinical Services (“SCS”) Network — Access to patient-support services that allows pharmacists to earn service fees and to develop stronger patient relationships. |
Institutional Healthcare Providers: We provide electronic ordering/purchasing and supply chain management systems that help customers improve financial performance, increase operational efficiencies and deliver better patient care. Solutions include:
| • | Fulfill-RxSM — Ordering and inventory management system that empowers hospitals to optimize the often complicated processes related to unit-based cabinet replenishment and inventory management. |
| • | Asset Management — Award-winning inventory optimization and purchasing management program that helps institutional providers lower costs while ensuring product availability. |
| • | SKY Packaging — Blister-format packaging containing the most widely prescribed dosages and strengths in generic oral-solid medications. SKY Packaging enables acute care, long-term care and institutional pharmacies to provide cost-effective, uniform packaging. |
| • | McKesson Plasma and Biologics — A full portfolio of plasma-derivatives and biologic products. In the second quarter of 2018, we acquired BDI Pharma, LLC (“BDI”). |
| • | McKesson OneStop Generics® — Described above. |
McKesson Specialty Health (“MSH”)
Our MSH business provides a range of services and solutions to oncology and other specialty practices operating in communities across the country, to pharmaceutical and biotechnology suppliers who manufacture specialty drugs and vaccines, and to payers and hospitals. This business is focused on three core business lines: Manufacturer Solutions, Practice Management and Provider Solutions.
McKESSON CORPORATION
Manufacturer Solutions: This business helps manufacturers accelerate the approval and successful commercialization of specialty pharmaceuticals across the product life cycle. Our offerings include supply chain services, including specialty pharmacy services and third-party logistics (“3PL”), provider and patient engagement programs, clinical trial support, patient assistance programs, reimbursement services and analytics. In addition, we help manufacturers minimize reimbursement challenges while offering affordable, safe access to therapies through Risk Evaluation and Mitigation Strategies (“REMS”) programs.
In the fourth quarter of 2018, we completed our acquisition of RxCrossroads, a provider of tailored services to pharmaceutical and biotechnology manufacturers. RxCrossroads is headquartered in Louisville, Kentucky. This acquisition enhances our end-to-end solutions for manufacturers of branded, specialty, generic and biosimilar drugs, including comprehensive patient support services, custom pharmacy solutions and third-party logistics. In addition, this acquisition will add plasma logistics to our manufacturer solutions, complementing the Company’s established customer-facing plasma offerings. This is a continuation of our strategy to achieve better patient outcomes through efficiency and coordination across the supply chain, and throughout the patient journey.
Practice Management: This business provides a variety of solutions, including practice operations, healthcare information technology, revenue cycle management and managed care contracting solutions, evidence-based guidelines and quality measurements to support U.S. Oncology Network, one of the nation’s largest networks of physician-led, integrated, community-based oncology practices dedicated to advancing high-quality, evidence-based cancer care. We also support U.S. Oncology Research, one of the nation’s largest research networks, specializing in oncology clinical trials.
Provider Solutions: This business offers community specialists (oncologists, rheumatologists, ophthalmologists, urologists, neurologists and other specialists) an extensive set of customizable products and services designed to strengthen core practice operations, enhance value-based care delivery and expand their service offering to patients. Tools and services include specialty drug distribution and group purchasing organization (“GPO”) services, technology solutions, practice consulting services, and vaccine distribution, including our exclusive distributor relationship with the Centers for Disease Control and Prevention’s (“CDC”) Vaccines for Children program. Community-based physicians in this business line have broad flexibility and discretion to select the products and commitment levels that best meet their practice needs. In the second quarter of 2018, we acquired intraFUSION, Inc. (“intraFUSION”) of Houston, Texas, which provides management services to physician office infusion centers.
When we classify a pharmaceutical product or service as “specialty,” we consider the following factors: diseases requiring complex treatment regimens such as cancer and rheumatoid arthritis; plasma and biologics products; ongoing clinical monitoring requirements, high-cost, special handling, storage and delivery requirements and, in some cases, exclusive distribution arrangements. Our use of the term “specialty” to define a portion of our distribution business may not be comparable to that used by other industry participants, including our competitors.
McKesson Canada
McKesson Canada is one of the largest wholesale distributors and pharmacy retailers in Canada.
The wholesale business delivers their products to retail pharmacies, hospitals, long-term care centers, clinics and institutions in Canada through a network of 13 distribution centers and provides logistics and distribution services for manufacturers. Beyond wholesale pharmaceutical logistics and distribution, McKesson Canada provides automation solutions to its retail and hospital customers. McKesson Canada also provides health information exchange solutions that streamline clinical and administrative communication. Through specialty solutions and services, McKesson Canada works with health care providers, manufacturers and payers to help patients with complex diseases by improving access to life-saving treatments.
The retail business operates approximately 450 owned pharmacies under the Rexall Health brand in Canada where we provide patients with greater choice and access, integrated pharmacy care and industry-leading service levels. We also provide retail banner services that help independent pharmacists compete and grow through innovative services and operations support. In the second quarter of 2018, we expanded our support for Canadian banners to more than 2,400 independent pharmacies by adding more than 300 independent pharmacies in Quebec, Canada, with our acquisition of the Uniprix Group.
McKESSON CORPORATION
MRxTS
This business is comprised of McKesson Pharmacy Technology and Services, RelayHealth Pharmacy and CoverMyMeds. This business supports our customers, including physicians, with a comprehensive, expanded portfolio of solutions designed to help them drive business growth, realize greater business efficiencies, deliver high-quality care, enhance medication adherence and safety, and more effectively connect with other participants in the pharmaceutical supply chain. MRxTS focuses on customers across the pharmacy industry, including manufacturers, payers, providers, retail pharmacies, hospital pharmacies and government agencies.
International pharmaceutical distribution and services
Our International pharmaceutical distribution and services business provides distribution and services to wholesale, institutional and retail customers in 13 European countries where we own, partner or franchise with retail pharmacies, as further described below. The business consists of Pharmacy Solutions and Consumer Solutions.
Our Pharmacy Solutions business delivers pharmaceutical and other healthcare-related products to pharmacies across Europe. This business functions as a vital link connecting manufacturers to retail pharmacies. This business supplies medicines to patients by procuring pharmaceuticals approved in each country as well as supplying other products sold in pharmacies. Pharmaceutical and other healthcare-related products are stored at regional wholesale branches using technology-enabled management systems. Our European business leverages its scale and provides innovative and effective medical care services to create enhanced customer value.
Our Consumer Solutions business serves patients and consumers in European countries directly through over 2,000 of our own pharmacies and over 7,000 participant pharmacies operating under brand partnership arrangements. In addition, this business includes outpatient dispensing and homecare arrangements mainly in the United Kingdom (“U.K.”). This business provides traditional prescription pharmaceuticals, non-prescription products and medical services and operates under the Lloyds Pharmacy brand in Belgium, Ireland, Italy, Sweden and the U.K.. In addition, we partner with independent pharmacies under our franchise program.
Medical-Surgical distribution and services
Our Medical-Surgical distribution and services business provides medical-surgical supply distribution, logistics and other services to healthcare providers, including physicians’ offices, surgery centers, extended care facilities, hospital reference labs, and homecare and occupational health sites. Through a network of distribution centers within the U.S., we offer more than 275,000 national brand products plus McKesson’s own line of high-quality medical-surgical products. As a leading distributor of products and solutions to the full range of alternate-site healthcare facilities, we care for our customers so they can care for their patients. We serve our customers across the continuum of care to help improve efficiencies, profitability and compliance while promoting better patient outcomes. Our comprehensive portfolio of medical-surgical products helps our customers increase revenue with the right product mix. With 85% of patient visits happening beyond the hospital, each of these sites has unique needs and challenges. We serve more than 200,000 medical practices, including physician offices, surgery centers, seven of the top ten urgent care center chains and more than 1,800 community health centers. We develop customized plans to address the clinical support needs of our customers, including tackling reimbursements, reducing administrative burdens, and training and educating clinical staff.
On April 25, 2018, we entered into a definitive agreement to purchase Medical Specialties Distributors LLC, a leading national distributor of infusion and medical-surgical supplies as well as provider of biomedical services to alternate site and home health providers.
Technology Solutions Segment
Our Technology Solutions segment consists of our equity investment in Change Healthcare and our Enterprise Information Solutions (“EIS”) business.
McKESSON CORPORATION
Equity investment in Change Healthcare:
On March 1, 2017, we finalized a contribution agreement (“Contribution Agreement”) with Change Healthcare Holdings, Inc. (“Change”), a Delaware corporation, and others including shareholders of Change to form a joint venture, Change Healthcare. Under the terms of the Contribution Agreement, we contributed the majority of our McKesson Technology Solutions businesses (“Core MTS Business”) to Change Healthcare. In exchange for the contribution, we own approximately 70% of the joint venture with the remaining equity ownership held by Change shareholders. We retained our RelayHealth Pharmacy (“RHP”) and EIS businesses. Our investment in Change Healthcare is accounted for using the equity method of accounting. Change Healthcare is a healthcare technology company that leverages software and analytics, network solutions, and technology-enabled services to enable better patient care, choice, and outcomes at scale. We transferred our RHP business to our MDS segment, effective April 1, 2017.
Refer to Financial Note 2, “Healthcare Technology Net Asset Exchange” to the consolidated financial statements appearing in this Annual Report on Form 10-K for additional information.
EIS:
This business provided clinical and financial information systems for healthcare organizations including professional services, workflow management and supply chain management solutions.
On October 2, 2017, we sold our EIS business to a third party. We received net cash proceeds of $169 million after $16 million of assumed net debt by the third party. We recognized a pre-tax gain of $109 million (after-tax gain of $30 million) upon the disposition of this business in the third quarter of 2018.
Fiscal 2019 Operating Segments
As previously disclosed in our Quarterly Reports on Form 10-Q for the quarters ended September 30, 2017 and December 31, 2017, the executive who was our segment manager of the Distribution Solutions segment retired from the Company in January 2018. As a result, the Company’s chief operating decision maker (“CODM”) evaluated our management and operating structure. In connection with the completion of this evaluation in the first quarter of 2019, our operating structure is realigned, and we will report our financial results in three reportable segments on a retrospective basis commencing in the first quarter of 2019: U.S. Pharmaceutical and Specialty Solutions, European Pharmaceutical Solutions and Medical-Surgical Solutions. All remaining operating segments and business activities that are not significant enough to require separate reportable segment disclosure will be included in Other. Other primarily consists of McKesson Canada, McKesson Prescription Technology Solutions and our equity method investment in Change Healthcare. The segment changes will reflect how our CODM allocates resources and assesses performance commencing in the first quarter of 2019. Refer to Financial Note 28, “Segments of Business” to the consolidated financial statements appearing in this Annual Report on Form 10-K for additional information.
Business Combinations, Investments, Discontinued Operations and Divestitures
We have undertaken additional strategic initiatives in recent years designed to further focus on our core healthcare businesses and enhance our competitive position. We expect to continue to undertake such strategic initiatives in the future. These initiatives are detailed in Financial Notes 2, 5, 6 and 7, “Healthcare Technology Net Asset Exchange,” “Divestitures,” “Business Combinations” and “Discontinued Operations” to the consolidated financial statements appearing in this Annual Report on Form 10-K.
Competition
Our two reportable segments, Distribution Solutions and Technology Solutions, face highly competitive global environments with strong competition from international, national, regional and local full-line, short-line and specialty distributors, service merchandisers, self-warehousing chain drug stores, manufacturers engaged in direct distribution, third-party logistics companies and large payer organizations. In addition, these segments face competition from various other service providers and from pharmaceutical and other healthcare manufacturers as well as other potential customers of the segment, which may from time-to-time decide to develop, for their own internal needs, supply management capabilities that would otherwise be provided by the segment. In all areas, key competitive factors include price, quality of service, breadth of product lines, innovation and, in some cases, convenience to the customer.
McKESSON CORPORATION
Patents, Trademarks, Copyrights and Licenses
McKesson and its subsidiaries hold patents, copyrights, trademarks and trade secrets related to McKesson products and services. We pursue patent protection for our innovation, and obtain copyrights covering our original works of authorship, when such protection is advantageous. Through these efforts, we have developed a portfolio of patents and copyrights in the U.S. and worldwide. In addition, we have registered or applied to register certain trademarks and service marks in the U.S. and in foreign countries.
We believe that, in the aggregate, McKesson’s confidential information, patents, copyrights, and trademarks are important to its operations and market position, but we do not consider any of our businesses to be dependent upon any one patent, copyright, trademark, or trade secret, or any family or families of the same. We cannot guarantee that our intellectual property portfolio will be sufficient to deter misappropriation, theft, or misuse of our technology, nor that we can successfully enjoin infringers. We periodically receive notices alleging that our products or services infringe on third party patents and other intellectual property rights. These claims may result in McKesson entering settlement agreements, paying damages, discontinuing use or sale of accused products, or ceasing other activities. While the outcome of any litigation or dispute is inherently uncertain, we do not believe that the resolution of any of these infringement notices would have a material adverse impact on our results of operation.
We hold inbound licenses for certain intellectual property that is used internally, and in some cases, utilized in McKesson’s products or services. While it may be necessary in the future to seek or renew licenses relating to various aspects of our products and services, we believe, based upon past experience and industry practice, such licenses generally can be obtained on commercially reasonable terms. We believe our operations and products and services are not materially dependent on any single license or other agreement with any third party.
Other Information about the Business
Customers: During 2018, sales to our ten largest customers, including GPOs accounted for approximately 51.7% of our total consolidated revenues. Sales to our largest customer, CVS Health (“CVS”), accounted for approximately 19.9% of our total consolidated revenues. At March 31, 2018, trade accounts receivable from our ten largest customers were approximately 24.9% of total trade accounts receivable. Accounts receivable from CVS were approximately 16.4% of total trade accounts receivable. We also have agreements with GPOs, each of which functions as a purchasing agent on behalf of member hospitals, pharmacies and other healthcare providers, as well as with government entities and agencies. The accounts receivable balances are with individual members of the GPOs, and therefore no significant concentration of credit risk exists. Substantially all of these revenues and accounts receivable are included in our Distribution Solutions segment.
Suppliers: We obtain pharmaceutical and other products from manufacturers, none of which accounted for more than 6% of our purchases in 2018. The loss of a supplier could adversely affect our business if alternate sources of supply are unavailable. We believe that our relationships with our suppliers are generally sound. The ten largest suppliers in 2018 accounted for approximately 41% of our purchases.
A significant portion of our distribution arrangements with the manufacturers provides us compensation based on a percentage of our purchases. In addition, we have certain distribution arrangements with pharmaceutical manufacturers that include an inflation-based compensation component whereby we benefit when the manufacturers increase their prices as we sell our existing inventory at the new higher prices. For these manufacturers, a reduction in the frequency and magnitude of price increases, as well as restrictions in the amount of inventory available to us, could have an adverse impact on our gross profit margin.
Research and Development: Research and development (“R&D”) costs were $125 million, $341 million and $392 million during 2018, 2017 and 2016. Development expenditures in 2017 and 2016 were primarily incurred by our MTS segment. R&D costs were lower in 2018 due to the 2017 contribution of the majority of our MTS businesses. Additional information regarding our development activities is included in Financial Note 1, “Significant Accounting Policies,” to the consolidated financial statements appearing in this Annual Report on Form 10-K.
Environmental Regulation: Our operations are subject to regulations under various federal, state, local and foreign laws concerning the environment, including laws addressing the discharge of pollutants into the air and water, the management and disposal of hazardous substances and wastes, and the cleanup of contaminated sites. We could incur substantial costs, including cleanup costs, fines and civil or criminal sanctions and third-party damage or personal injury claims, if in the future we were to violate or become liable under environmental laws.
McKESSON CORPORATION
We are committed to maintaining compliance with all environmental laws applicable to our operations, products and services and to reducing our environmental impact across all aspects of our business. We meet this commitment through an environmental strategy and sustainability program.
We sold our chemical distribution operations in 1987 and retained responsibility for certain environmental obligations. Agreements with the Environmental Protection Agency and certain states may require environmental assessments and cleanups at several closed sites. These matters are described further in Financial Note 24, “Commitments and Contingent Liabilities,” to the consolidated financial statements appearing in this Annual Report on Form 10-K.
The liability for environmental remediation and other environmental costs is accrued when the Company considers it probable and can reasonably estimate the costs. Environmental costs and accruals, including that related to our legacy chemical distribution operations, are presently not material to our operations or financial position. Although there is no assurance that existing or future environmental laws applicable to our operations or products will not have a material adverse impact on our operations or financial condition, we do not currently anticipate material capital expenditures for environmental matters. Other than the expected expenditures that may be required in connection with our legacy chemical distribution operations, we do not anticipate making substantial capital expenditures either for environmental issues, or to comply with environmental laws and regulations in the future. The amount of our capital expenditures for environmental compliance was not material in 2018 and is not expected to be material in the next year.
Employees: On March 31, 2018, we employed approximately 78,000 employees, including approximately 20,000 part-time employees.
Financial Information About Foreign and Domestic Operations: Certain financial information relating to foreign and domestic operations is included in Financial Note 28, “Segments of Business,” to the consolidated financial statements appearing in this Annual Report on Form 10-K. See “Risk Factors” in Part I, Item 1A below for information regarding risks associated with our foreign operations.
Forward-Looking Statements
This Annual Report on Form 10-K, including “Management’s Discussion and Analysis of Financial Condition and Results of Operations” in Item 7 of Part II of this report and the “Risk Factors” in Item 1A of Part I of this report, contains forward-looking statements within the meaning of section 27A of the Securities Act of 1933, as amended and section 21E of the Securities Exchange Act of 1934, as amended. Some of these statements can be identified by use of forward-looking words such as “believes,” “expects,” “anticipates,” “may,” “will,” “should,” “seeks,” “approximately,” “intends,” “plans” or “estimates,” or the negative of these words, or other comparable terminology. The discussion of financial trends, strategy, plans or intentions may also include forward-looking statements. Forward-looking statements involve risks and uncertainties that could cause actual results to differ materially from those projected, anticipated, or implied. Although it is not possible to predict or identify all such risks and uncertainties, they may include, but are not limited to, the factors discussed in Item 1A of Part I of this report under “Risk Factors.” The reader should not consider the list to be a complete statement of all potential risks and uncertainties.
These and other risks and uncertainties are described herein and in other information contained in our publicly available SEC filings and press releases. Readers are cautioned not to place undue reliance on these forward-looking statements, which speak only as of the date such statements were first made. Except to the extent required by federal securities laws, we undertake no obligation to publicly release the result of any revisions to these forward-looking statements to reflect events or circumstances after the date hereof, or to reflect the occurrence of unanticipated events.
Item 1A. Risk Factors
The risks described below could have a material adverse impact on our financial position, results of operations, liquidity and cash flows. Although it is not possible to predict or identify all such risks and uncertainties, they may include, but are not limited to, the factors discussed below. Our business operations could also be affected by additional factors that are not presently known to us or that we currently consider not to be material. The reader should not consider this list to be a complete statement of all risks and uncertainties.
McKESSON CORPORATION
Changes in the United States healthcare industry and regulatory environment could have a material adverse impact on our results of operations.
Many of our products and services are intended to function within the structure of the healthcare financing and reimbursement system currently being used in the United States. In recent years, the healthcare industry in the United States has changed significantly in an effort to enhance efficiencies, reduce costs and improve patient outcomes. These changes have included cuts in Medicare and Medicaid reimbursement levels, changes in the basis for payments, shifting away from fee-for-service and towards value-based payments and risk-sharing models, increases in the use of managed care and consolidation in the healthcare industry. We expect the healthcare industry in the United States to continue to change and for healthcare delivery models to evolve in the future.
Changes in the healthcare industry’s or our pharmaceutical suppliers’ pricing, selling, inventory, distribution or supply policies or practices could significantly reduce our revenues and net income. Additionally, if we experience disruptions in our supply of generic drugs, our margins could be adversely affected. Due to the diverse range of healthcare supply management and healthcare information technology products and services that we offer, such changes could have a material adverse impact on our results of operations, while not affecting some of our competitors who offer a narrower range of products and services.
The majority of our U.S. pharmaceutical distribution business agreements with manufacturers are structured to ensure that we are appropriately and predictably compensated for the services we provide. However, failure to successfully renew these contracts in a timely and favorable manner could have a material adverse impact on our results of operations. Certain distribution business agreements we entered into with manufacturers continue to have pharmaceutical price inflation as a component of our compensation. Consequently, our results of operations could be adversely affected if the frequency or magnitude of pharmaceutical price increases or decreases, which we do not control. In addition, we distribute generic pharmaceuticals, which can be subject to both price deflation and price inflation. Our generic pharmaceutical sourcing program has benefited from the joint sourcing entity, ClarusONE. If ClarusONE does not continue to be successful, our margins could be adversely affected. Our Distribution Solutions segment experienced weaker pharmaceutical pricing trends over the last three years. Continued volatility in the availability, pricing trends or reimbursement of these generic drugs, or significant fluctuations in the nature, frequency and magnitude of generic pharmaceutical launches, could have a material adverse impact on our results of operations. Additionally, any future changes in branded and generics drug pricing could be significantly different than our projections.
Generic drug manufacturers are increasingly challenging the validity or enforceability of patents on branded pharmaceutical products. During the pendency of these legal challenges, a generics manufacturer may begin manufacturing and selling a generic version of the branded product prior to the final resolution of its legal challenge over the branded product’s patent. To the extent we source, contract manufacture, and distribute such generic products, the brand-name company could assert infringement claims against us. While we generally obtain indemnification against such claims from generic manufacturers as a condition of distributing their products, there can be no assurances that these rights will be adequate or sufficient to protect us.
The healthcare industry is highly regulated, and further regulation of our distribution businesses and technology products and services could impose increased costs, negatively impact our profit margins and the profit margins of our customers, delay the introduction or implementation of our new products, or otherwise negatively impact our business and expose the Company to litigation and regulatory investigations.
Healthcare Fraud: We are subject to extensive and frequently changing local, state and federal laws and regulations relating to healthcare fraud, waste and abuse. Local, state and federal governments continue to strengthen their position and scrutiny over practices involving fraud, waste and abuse affecting Medicare, Medicaid and other government healthcare programs. Our relationships with pharmaceutical and medical-surgical product manufacturers and healthcare providers, as well as our provision of products and services to government entities, subject our business to laws and regulations on fraud and abuse, which among other things: (1) prohibit persons from soliciting, offering, receiving or paying any remuneration in order to induce the referral of a patient for treatment or to induce the ordering or purchasing of items or services that are in any way paid for by Medicare, Medicaid or other government-sponsored healthcare programs; (2) impose a number of restrictions upon referring physicians and providers of designated health services under Medicare and Medicaid programs; and (3) prohibit the knowing submission of a false or fraudulent claim for payment to, and knowing retention of an overpayment by, a federal healthcare program such as Medicare and Medicaid. Many of the regulations applicable to us, including those relating to marketing incentives, are vague or indefinite and have not been interpreted by the courts. The regulations may be interpreted or applied by a prosecutorial, regulatory, or judicial authority in a manner that could require us to make changes in our operations. If we fail to comply with applicable laws and regulations, we could become liable for damages and suffer civil and criminal penalties, including the loss of licenses or our ability to participate in Medicare, Medicaid and other federal and state healthcare programs.
McKESSON CORPORATION
Reimbursements: Both our profit margins and the profit margins of our customers may be adversely affected by laws and regulations reducing reimbursement rates for pharmaceuticals, medical treatments and related services, or changing the methodology by which reimbursement levels are determined. For example, the Patient Protection and Affordable Care Act and the Health Care and Education Reconciliation Act (collectively the “Affordable Care Act”), signed into law in 2010, revised, subject to rulemaking, the federal upper limits (“FUL”) for Medicaid reimbursement for multiple source generic drugs available for purchase by retail community pharmacies on a nationwide basis. On February 1, 2016, the Centers for Medicare and Medicaid Services (“CMS”) published the Covered Outpatient Drugs final rule. The final rule, with limited exceptions, establishes the FUL to be 175% of the weighted average (determined on the basis of utilization across a drug molecule when multiple sources are available) of the most recently reported monthly average manufacturer price (“AMP”). Additionally, the final rule established actual acquisition cost as the basis by which states should determine their ingredient cost reimbursement, addressed the sufficiency of dispensing fees to reflect the cost of the pharmacist’s pr
Showing the first 8K of 79K characters. Open the full section
Item 1B. Unresolved Staff Comments.
None.
Item 2. Properties.
Because of the nature of our principal businesses, our plant, warehousing, retail pharmacies, office and other facilities are operated in widely dispersed locations, primarily throughout North America and Europe. The warehouses and retail pharmacies are typically owned or leased on a long-term basis. We consider our operating properties to be in satisfactory condition and adequate to meet our needs for the next several years without making capital expenditures materially higher than historical levels. Information as to material lease commitments is included in Financial Note 22, “Lease Obligations,” to the consolidated financial statements appearing in this Annual Report on Form 10-K.
McKESSON CORPORATION
Item 3. Legal Proceedings.
Certain legal proceedings in which we are involved are discussed in Financial Note 24, “Commitments and Contingent Liabilities,” to the consolidated financial statements appearing in this Annual Report on Form 10-K.
Item 4. Mine Safety Disclosures.
Not applicable.
McKESSON CORPORATION
Executive Officers of the Registrant
The following table sets forth information regarding the executive officers of the Company, including their principal occupations during the past five years. The number of years of service with the Company includes service with predecessor companies.
There are no family relationships between any of the executive officers or directors of the Company. The executive officers are elected on an annual basis generally and their term expires at the first meeting of the Board of Directors (“Board”) following the annual meeting of stockholders, or until their successors are elected and have qualified, or until death, resignation or removal, whichever is sooner.
| Name | Age | Position with Registrant and Business Experience | ||
| John H. Hammergren | 59 | Chairman of the Board since July 2002; President and Chief Executive Officer since April 2001; and a director since July 1999. Service with the Company — 22 years. | ||
| Britt J. Vitalone | 49 | Executive Vice President and Chief Financial Officer since January 2018; Senior Vice President and Chief Financial Officer, U.S. Pharmaceutical from July 2014 to December 2017; Senior Vice President and Chief Financial Officer, U.S. Pharmaceutical and Specialty Health from October 2017 to December 2017; Senior Vice President of Corporate Finance and M&A Finance from March 2012 to June 2014. Service with the Company — 12 years. | ||
| Jorge L. Figueredo | 57 | Executive Vice President, Human Resources since May 2008. Service with the Company — 10 years. | ||
| Kathleen D. McElligott | 62 | Executive Vice President, Chief Information Officer and Chief Technology Officer since July 2015; Chief Information Officer and Vice President, Information Technology, Emerson Electric from 2010 to July 2015. Service with the Company — 2 years. | ||
| Bansi Nagji | 53 | Executive Vice President, Corporate Strategy and Business Development since February 2015; Principal, Deloitte Consulting, LLP and Global Leader, Monitor Deloitte (which was formed by the global merger of Monitor Group with Deloitte) from January 2013 to February 2015; President, Monitor Group from July 2012 to January 2013; Partner, Monitor Group from 2001 to January 2013. Service with the Company — 3 years. | ||
| Lori A. Schechter | 56 | Executive Vice President, General Counsel and Chief Compliance Officer since June 2014; Associate General Counsel from January 2012 to June 2014; Litigation Partner, Morrison & Foerster LLP from January 1995 to December 2011. Service with the Company — 6 years. |
McKESSON CORPORATION
PART II
Item 5. Market for the Registrant’s Common Equity, Related Stockholder Matters and Issuer Purchases of Equity Securities.
| (a) | Market Information: The principal market on which the Company’s common stock is traded is the New York Stock Exchange (“NYSE”). |
The following table sets forth the high and low sales prices for our common stock as reported on NYSE for each quarterly period of the two most recently completed fiscal years:
| 2018 | 2017 | ||||||||||||
| High | Low | High | Low | ||||||||||
| First quarter | $ | 169.29 | $ | 133.82 | $ | 188.43 | $ | 154.33 | |||||
| Second quarter | $ | 168.87 | $ | 145.13 | $ | 199.43 | $ | 163.57 | |||||
| Third quarter | $ | 164.29 | $ | 134.25 | $ | 166.78 | $ | 114.53 | |||||
| Fourth quarter | $ | 178.86 | $ | 137.10 | $ | 153.07 | $ | 134.17 |
| (b) | Holders: The number of record holders of the Company’s common stock at March 31, 2018 was approximately 5,619. |
| (c) | Dividends: In July 2017, the Company’s quarterly dividend was raised from $0.28 to $0.34 per common share for dividends declared on or after such date by the Company’s Board of Directors (the “Board”). The Company declared regular cash dividends of $1.30 and $1.12 per share in the years ended March 31, 2018 and 2017. |
The Company anticipates that it will continue to pay quarterly cash dividends in the future. However, the payment and amount of future dividends remain within the discretion of the Board and will depend upon the Company’s future earnings, financial condition, capital requirements and other factors.
| (d) | Securities Authorized for Issuance under Equity Compensation Plans: Information relating to this item is provided under Part III, Item 12, to this Annual Report on Form 10-K. |
| (e) | Share Repurchase Plans: Stock repurchases may be made from time to time in open market transactions, privately negotiated transactions, through accelerated share repurchase (“ASR”) programs, or by any combination of such methods. The timing of any repurchases and the actual number of shares repurchased will depend on a variety of factors, including our stock price, corporate and regulatory requirements, restrictions under our debt obligations and other market and economic conditions. |
During the last three years, our share repurchases were transacted through both open market transactions and ASR programs with third-party financial institutions.
In May and October 2015, the Board authorized the repurchase of up to $500 million and $2 billion of the Company’s common stock.
In 2016, we repurchased 4.5 million of the Company’s shares for $854 million through open market transactions at an average price per share of $192.27. In February 2016, we entered into an ASR program with a third-party financial institution to repurchase $650 million of the Company’s common stock. The ASR program was completed during the fourth quarter of 2016 and we repurchased 4.2 million shares at an average price per share of $154.04. During 2016, we completed the May 2015 share repurchase authorization. At March 31, 2016, $1.0 billion remained available for future authorized repurchases of the Company’s common stock under the October 2015 authorization.
In 2016, we retired 115.5 million or $7.8 billion of the Company’s treasury shares previously repurchased. Under the applicable state law, these shares resume the status of authorized and unissued shares upon retirement. In accordance with our accounting policy, we allocate any excess of share repurchase price over par value between additional paid-in capital and retained earnings. Accordingly, our retained earnings and additional paid-in capital were reduced by $6.4 billion and $1.5 billion during 2016.
In October 2016, the Board authorized the repurchase of up to $4.0 billion of the Company’s common stock.
McKESSON CORPORATION
In 2017, we repurchased 14.1 million of the Company’s shares for $2.0 billion through open market transactions at an average price per share of $140.96. In March 2017, we entered into an ASR program with a third-party financial institution to repurchase $250 million of the Company’s common stock. As of March 31, 2017, we had received 1.4 million shares under this program. This ASR program was completed in April 2017 and we received 0.3 million additional shares. The total number of shares repurchased under this ASR program was 1.7 million shares at an average price per share of $143.19. During 2017, we completed the October 2015 share repurchase authorization. The total authorization outstanding for repurchases of the Company’s common stock was $2.7 billion at March 31, 2017.
In 2018, we repurchased 3.5 million of the Company’s shares for $500 million through open market transactions at an average price per share of $144.43. In June 2017, August 2017 and March 2018, we entered into three separate ASR programs with third-party financial institutions to repurchase $250 million, $400 million and $500 million of the Company’s common stock. As of March 31, 2018, we completed and received a total of 1.5 million shares under the June 2017 ASR program and a total of 2.7 million shares under the August 2017 ASR program. In addition, we received 2.5 million shares representing the initial number of shares due in March 2018 and an additional 0.5 million shares in April 2018 under the March 2018 ASR program. The total number of shares to be ultimately repurchased by the Company under the March 2018 ASR program will be determined at the completion of the program based on the average daily volume-weighted average price of the Company’s common stock during this program, less a discount. The program is anticipated to be completed during the first quarter of 2019. The total authorization outstanding for repurchase of the Company’s common stock was $1.1 billion at March 31, 2018.
In May 2018, the Board authorized the repurchase of up to $4.0 billion of the Company’s common stock. The total authorization outstanding for repurchases of the Company’s common stock was increased to $5.1 billion.
The following table provides information on the Company’s share repurchases during the fourth quarter of 2018:
| Share Repurchases (1) | |||||||||||||
| (In millions, except price per share) | Total Number of Shares Purchased | Average Price Paid per Share | Total Number of Shares Purchased as Part of Publicly Announced Programs | Approximate Dollar Value of Shares that May Yet Be Purchased Under the Programs | |||||||||
| January 1, 2018 - January 31, 2018 | — | $ | — | — | $ | 1,846 | |||||||
| February 1, 2018 - February 28, 2018 | 0.7 | 152.00 | 0.7 | 1,734 | |||||||||
| March 1, 2018 - March 31, 2018 | 3.5 | 155.87 (2) | 3.5 | 1,096 | |||||||||
| Total | 4.2 | 4.2 |
| (1) | This table does not include shares tendered to satisfy the exercise price in connection with cashless exercises of employee stock options or shares tendered to satisfy tax-withholding obligations in connection with employee equity awards. |
| (2) | The average price paid per share computation includes the initial share settlement of 2.5 million shares from the March 2018 ASR program, of which the actual average price of shares will be determined at the termination of the program. |
McKESSON CORPORATION
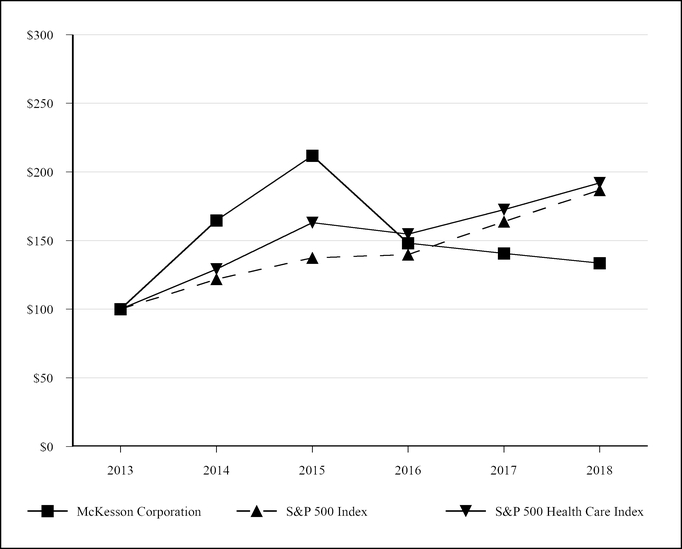
| (f) | Stock Price Performance Graph*: The following graph compares the cumulative total stockholder return on the Company’s common stock for the periods indicated with the Standard & Poor’s 500 Index and the S&P 500 Health Care Index. The S&P 500 Health Care Index was selected as a comparator because it is generally available to investors and broadly used by other companies in the same industry. |
| March 31, | |||||||||||||||||||||||
| 2013 | 2014 | 2015 | 2016 | 2017 | 2018 | ||||||||||||||||||
| McKesson Corporation | $ | 100.00 | $ | 164.63 | $ | 211.91 | $ | 148.16 | $ | 140.65 | $ | 133.64 | |||||||||||
| S&P 500 Index | $ | 100.00 | $ | 121.86 | $ | 137.37 | $ | 139.82 | $ | 163.83 | $ | 186.75 | |||||||||||
| S&P 500 Health Care Index | $ | 100.00 | $ | 129.24 | $ | 163.09 | $ | 154.64 | $ | 172.57 | $ | 192.01 |
- Assumes $100 invested in McKesson Common Stock and in each index on March 31, 2013 and that all dividends are reinvested.
McKESSON CORPORATION
Item 6. Selected Financial Data.
FIVE-YEAR HIGHLIGHTS
| As of and for the Years Ended March 31, | ||||||||||||||||||||
| (In millions, except per share data and ratios) | 2018 | 2017 | 2016 | 2015 | 2014 | |||||||||||||||
| Operating Results | ||||||||||||||||||||
| Revenues | $ | 208,357 | $ | 198,533 | $ | 190,884 | $ | 179,045 | $ | 137,392 | ||||||||||
| Percent change | 4.9 | % | 4.0 | % | 6.6 | % | 30.3 | % | 12.4 | % | ||||||||||
| Gross profit | $ | 11,184 | $ | 11,271 | $ | 11,416 | $ | 11,411 | $ | 8,352 | ||||||||||
| Income from continuing operations before income taxes (2) | 239 | 6,891 | 3,250 | 2,657 | 2,171 | |||||||||||||||
| Income (loss) after income taxes | ||||||||||||||||||||
| Continuing operations (2) | 292 | 5,277 | 2,342 | 1,842 | 1,414 | |||||||||||||||
| Discontinued operations | 5 | (124 | ) | (32 | ) | (299 | ) | (156 | ) | |||||||||||
| Net income | 297 | 5,153 | 2,310 | 1,543 | 1,258 | |||||||||||||||
| Net (income) loss attributable to noncontrolling interests (1) | (230 | ) | (83 | ) | (52 | ) | (67 | ) | 5 | |||||||||||
| Net income attributable to McKesson Corporation (2) | 67 | 5,070 | 2,258 | 1,476 | 1,263 | |||||||||||||||
| Financial Position | ||||||||||||||||||||
| Working capital | $ | 451 | $ | 1,336 | $ | 3,366 | $ | 3,173 | $ | 3,221 | ||||||||||
| Days sales outstanding for: (3) | ||||||||||||||||||||
| Customer receivables | 25 | 27 | 28 | 26 | 29 | |||||||||||||||
| Inventories | 30 | 30 | 32 | 31 | 33 | |||||||||||||||
| Drafts and accounts payable | 60 | 61 | 59 | 54 | 54 | |||||||||||||||
| Total assets | $ | 60,381 | $ | 60,969 | $ | 56,523 | $ | 53,870 | $ | 51,759 | ||||||||||
| Total debt, including capital lease obligations | 7,880 | 8,545 | 8,114 | 9,844 | 10,594 | |||||||||||||||
| Total McKesson stockholders’ equity (4) | 9,804 | 11,095 | 8,924 | 8,001 | 8,522 | |||||||||||||||
| Payments for property, plant and equipment | 405 | 404 | 488 | 376 | 278 | |||||||||||||||
| Acquisitions, net of cash and cash equivalents acquired | 2,893 | 4,237 | 40 | 170 | 4,634 | |||||||||||||||
| Common Share Information | ||||||||||||||||||||
| Common shares outstanding at year-end | 202 | 211 | 225 | 232 | 231 | |||||||||||||||
| Shares on which earnings per common share were based | ||||||||||||||||||||
| Diluted | 209 | 223 | 233 | 235 | 233 | |||||||||||||||
| Basic | 208 | 221 | 230 | 232 | 229 | |||||||||||||||
| Diluted earnings (loss) per common share attributable to McKesson Corporation (5) | ||||||||||||||||||||
| Continuing operations | $ | 0.30 | $ | 23.28 | $ | 9.84 | $ | 7.54 | $ | 6.08 | ||||||||||
| Discontinued operations | 0.02 | (0.55 | ) | (0.14 | ) | (1.27 | ) | (0.67 | ) | |||||||||||
| Total | 0.32 | 22.73 | 9.70 | 6.27 | 5.41 | |||||||||||||||
| Cash dividends declared | 270 | 249 | 249 | 226 | 214 | |||||||||||||||
| Cash dividends declared per common share | 1.30 | 1.12 | 1.08 | 0.96 | 0.92 | |||||||||||||||
| Book value per common share (5) (6) | 48.53 | 52.58 | 39.66 | 34.49 | 36.89 | |||||||||||||||
| Market value per common share - year-end | 140.87 | 148.26 | 157.25 | 226.20 | 176.57 | |||||||||||||||
| Supplemental Data | ||||||||||||||||||||
| Debt to capital ratio (7) | 40.6 | % | 39.2 | % | 43.6 | % | 50.3 | % | 55.4 | % | ||||||||||
| Average McKesson stockholders’ equity (8) | $ | 11,016 | $ | 9,282 | $ | 8,688 | $ | 8,703 | $ | 7,803 | ||||||||||
| Return on McKesson stockholders’ equity (9) | 0.6 | % | 54.6 | % | 26.0 | % | 17.0 | % | 16.2 | % |
McKESSON CORPORATION
Footnotes to Five-Year Highlights:
| (1) | Primarily reflects guaranteed dividends for 2015 and annual recurring compensation for 2016, 2017 and 2018 that McKesson became obligated to pay to the noncontrolling shareholders of McKesson Europe upon the effectiveness of the Domination Agreement in December 2014. 2018 and 2017 also include net income attributable to third-party equity interests in our consolidated entities including Vantage and ClarusONE Sourcing Services LLP, which was formed in 2017. |
| (2) | 2018 includes non-cash goodwill impairment charges (pre-tax and after-tax) of $1,738 million for our McKesson Europe and Rexall Health reporting units. 2017 includes a pre-tax gain of $3,947 million ($3,018 million after-tax) from the contribution of our Core MTS Business in connection with Healthcare Technology Net Asset Exchange. |
| (3) | Based on year-end balances and sales or cost of sales for the last 90 days of the year. |
| (4) | Excludes noncontrolling and redeemable noncontrolling interests. |
| (5) | Certain computations may reflect rounding adjustments. |
| (6) | Represents McKesson stockholders’ equity divided by year-end common shares outstanding. |
| (7) | Ratio is computed as total debt divided by the sum of total debt and McKesson stockholders’ equity excluding accumulated other comprehensive income (loss). |
| (8) | Represents a five-quarter average of McKesson stockholders’ equity. |
| (9) | Ratio is computed as net income attributable to McKesson Corporation for the last four quarters, divided by a five-quarter average of McKesson stockholders’ equity. |
McKESSON CORPORATION
FINANCIAL REVIEW
Item 7. Management’s Discussion and Analysis of Financial Condition and Results of Operations.
GENERAL
Management’s discussion and analysis of financial condition and results of operations, referred to as the Financial Review, is intended to assist the reader in the understanding and assessment of significant changes and trends related to the results of operations and financial position of McKesson Corporation (“McKesson,” the “Company,” or “we” and other similar pronouns) together with its subsidiaries. This discussion and analysis should be read in conjunction with the consolidated financial statements and accompanying financial notes in Item 8 of Part II of this Annual Report on Form 10-K. The Company’s fiscal year begins on April 1 and ends on March 31. Unless otherwise noted, all references to a particular year shall mean the Company’s fiscal year.
Certain statements in this report constitute forward-looking statements. See Item 1 - Business - Forward-Looking Statements in Part I of this Annual Report on Form 10-K for additional factors relating to these statements; also see Item 1A - Risk Factors in Part I of this Annual Report on Form 10-K for a list of certain risk factors applicable to our business, financial condition and results of operations.
We conduct our business through two reportable segments: McKesson Distribution Solutions (“MDS”) and McKesson Technology Solutions. Refer to Financial Note 28, “Segments of Business,” to the consolidated financial statements appearing in this Annual Report on Form 10-K for a description of these segments.
McKESSON CORPORATION
FINANCIAL REVIEW (Continued)
RESULTS OF OPERATIONS
Overview:
| (Dollars in millions, except per share data and ratios) | Years Ended March 31, | Change | |||||||||||||||||
| 2018 | 2017 | 2016 | 2018 | 2017 | |||||||||||||||
| Revenues | $ | 208,357 | $ | 198,533 | $ | 190,884 | 5 | % | 4 | % | |||||||||
| Gross Profit | $ | 11,184 | $ | 11,271 | $ | 11,416 | (1 | ) | % | (1 | ) | % | |||||||
| Gross Profit Margin | $ | 5.37 | $ | 5.68 | $ | 5.98 | (31 | ) | bp | (30 | ) | bp | |||||||
| Operating Expenses | |||||||||||||||||||
| Operating Expenses | $ | (8,263 | ) | $ | (7,801 | ) | $ | (7,771 | ) | 6 | % | — | % | ||||||
| Goodwill impairment charges | (1,738 | ) | (290 | ) | — | 499 | NM | ||||||||||||
| Restructuring and asset impairment charges | (567 | ) | (18 | ) | (203 | ) | 3,050 | (91 | ) | ||||||||||
| Gains from sales of businesses | 109 | — | 103 | NM | NM | ||||||||||||||
| Gain on healthcare technology net asset exchange, net | 37 | 3,947 | — | (99 | ) | NM | |||||||||||||
| Total Operating Expenses | $ | (10,422 | ) | $ | (4,162 | ) | $ | (7,871 | ) | 150 | % | (47 | ) | % | |||||
| Loss from Equity Method Investment in Change Healthcare | $ | (248 | ) | $ | — | $ | — | NM | NM | ||||||||||
| Loss on Debt Extinguishment | $ | (122 | ) | $ | — | $ | — | NM | NM | ||||||||||
| Income from Continuing Operations Before Income Taxes | $ | 239 | $ | 6,891 | $ | 3,250 | (97 | ) | % | 112 | % | ||||||||
| Income Tax Benefit (Expense) | 53 | (1,614 | ) | (908 | ) | (103 | ) | 78 | |||||||||||
| Income from Continuing Operations | 292 | 5,277 | 2,342 | (94 | ) | 125 | |||||||||||||
| Income (Loss) from Discontinued Operations, Net of Tax | 5 | (124 | ) | (32 | ) | (104 | ) | 288 | |||||||||||
| Net Income | 297 | 5,153 | 2,310 | (94 | ) | 123 | |||||||||||||
| Net Income Attributable to Noncontrolling Interests | (230 | ) | (83 | ) | (52 | ) | 177 | 60 | |||||||||||
| Net Income Attributable to McKesson Corporation | $ | 67 | $ | 5,070 | $ | 2,258 | (99 | ) | % | 125 | % | ||||||||
| Diluted Earnings (Loss) Per Common Share Attributable to McKesson Corporation | |||||||||||||||||||
| Continuing Operations | $ | 0.30 | $ | 23.28 | $ | 9.84 | (99 | ) | % | 137 | % | ||||||||
| Discontinued Operations | 0.02 | (0.55 | ) | (0.14 | ) | (104 | ) | 293 | |||||||||||
| Total | $ | 0.32 | $ | 22.73 | $ | 9.70 | (99 | ) | % | 134 | % | ||||||||
| Weighted Average Diluted Common Shares | 209 | 223 | 233 | (6 | ) | % | (4 | ) | % |
bp - basis points
NM - not meaningful
Revenues for 2018 and 2017 increased 5% and 4% compared to the same periods a year ago primarily due to market growth, reflecting growing drug utilization and price increases, our business acquisitions and expanded business with existing customers within our North America pharmaceutical distribution businesses. These increases for 2018 and 2017 were partially offset by price deflation associated with brand to generic drug conversion and loss of customers and for 2018 also by the contribution of the majority of our McKesson Technology Solutions businesses (“Core MTS Business”) to a joint venture in March 2017, as further discussed below.
McKESSON CORPORATION
FINANCIAL REVIEW (Continued)
Gross profit and gross profit margin decreased in 2018 and 2017 compared to the same periods a year ago. The decrease for 2018 was primarily due to the contribution of the Core MTS Business, significant government reimbursement reductions in the United Kingdom (“U.K.”), the competitive sell-side environment and weaker pharmaceutical manufacturer pricing trends. These decreases in 2018 were partially offset by market growth, procurement benefits realized through the joint sourcing entity, ClarusONE Sourcing Services LLP (“ClarusONE”), higher last-in, first-out (“LIFO”) credits and our business acquisitions.
Gross profit and gross profit margin decreased in 2017 primarily due to weaker pharmaceutical manufacturer pricing trends, the competitive sell-side pricing environment, our mix of business and lower compensation from a branded pharmaceutical manufacturer from our U.S. Pharmaceutical distribution business. These decreases for 2017 were partially offset by our business acquisitions, LIFO inventory credits, higher cash receipts from antitrust legal settlements and higher procurement benefits. Gross profit for 2017 and 2016 benefited from $144 million and $76 million of cash receipts representing our share of antitrust legal settlements. LIFO credits were $99 million and $7 million in 2018 and 2017 and LIFO charges were $244 million in 2016. LIFO credits were higher in 2018 compared to 2017 due to higher net effect of price declines, partially offset by the lower inventory level. LIFO expense was recognized in 2016 primarily due to net effects of price increases.
Our Distribution Solutions segment experienced weaker pharmaceutical manufacturer pricing trends over the last three years.
On March 1, 2017, we contributed our Core MTS Business to the newly formed joint venture, Change Healthcare, LLC (“Change Healthcare”) under the terms of a contribution agreement entered into between
Showing the first 8K of 106K characters. Open the full section
Item 7A. Quantitative and Qualitative Disclosures about Market Risk
Interest rate risk: Our long-term debt bears interest predominately at fixed rates, whereas our short-term borrowings are at variable interest rates.
Our cash and cash equivalents balances earn interest at variable rates. At March 31, 2018 and 2017, we had $2.7 billion and $2.8 billion and in cash and cash equivalents. The effect of a hypothetical 50 bp increase in the underlying interest rate on our cash and cash equivalents, net of short-term borrowings and variable rate debt, would have resulted in a favorable impact to earnings in 2018 and 2017 of approximately $10 million and $19 million.
Foreign exchange risk: We conduct our business worldwide in U.S. dollars and the functional currencies of our foreign subsidiaries, including Euro, British pound sterling and Canadian dollars. Changes in foreign currency exchange rates could have a material adverse impact on our financial results that are reported in U.S. dollars. We are also exposed to foreign exchange rate risk related to our foreign subsidiaries, including intercompany loans denominated in non-functional currencies.
We have certain foreign exchange rate risk programs that use foreign currency forward contracts and cross-currency swaps. The forward contracts and cross-currency swaps are designated to reduce the income statement effects from fluctuations in foreign exchange rates and have been designated as cash flow hedges. These programs reduce but do not entirely eliminate foreign exchange risk.
As of March 31, 2018 and 2017, the effect of a hypothetical adverse 10% change in the underlying foreign currency exchange rates would have impacted the fair value of our foreign exchange contracts by approximately $458 million and $357 million. However, our risk management programs are designed such that the potential loss in value of these risk management portfolios described above would be largely offset by changes in the value of the underlying exposure. Refer to Financial Note 20, “Hedging Activities,” for more information on our foreign currency forward contracts and cross-currency swaps.
The selected hypothetical change in interest rates and foreign currency exchange rates does not reflect what could be considered the best or worst case scenarios.
McKESSON CORPORATION
Item 8. Financial Statements and Supplementary Data
INDEX TO CONSOLIDATED FINANCIAL INFORMATION
McKESSON CORPORATION
MANAGEMENT’S ANNUAL REPORT ON INTERNAL CONTROL OVER FINANCIAL REPORTING
The management of McKesson Corporation is responsible for establishing and maintaining an adequate system of internal control over financial reporting, as such term is defined in Exchange Act Rules 13a-15(f) and 15d-15(f). With the participation of the Chief Executive Officer and the Chief Financial Officer, our management conducted an assessment of the effectiveness of our internal control over financial reporting based on the framework and criteria established in Internal Control—Integrated Framework (2013), issued by the Committee of Sponsoring Organizations of the Treadway Commission. Based on this assessment, our management has concluded that our internal control over financial reporting was effective as of March 31, 2018.
Deloitte & Touche LLP, an independent registered public accounting firm, audited the financial statements included in this Annual Report on Form 10-K and has also audited the effectiveness of the Company’s internal control over financial reporting as of March 31, 2018. This audit report appears on page 61 of this Annual Report on Form 10-K.
May 24, 2018
| /s/ John H. Hammergren |
| John H. Hammergren |
| Chairman of the Board, President and Chief Executive Officer |
| (Principal Executive Officer) |
| /s/ Britt J. Vitalone |
| Britt J. Vitalone |
| Executive Vice President and Chief Financial Officer |
| (Principal Financial Officer) |
McKESSON CORPORATION
REPORT OF INDEPENDENT REGISTERED PUBLIC ACCOUNTING FIRM
To the stockholders and the Board of Directors of McKesson Corporation
Opinions on the Financial Statements and Internal Control over Financial Reporting
We have audited the accompanying consolidated balance sheets of McKesson Corporation and subsidiaries (the “Company”) as of March 31, 2018 and 2017, the related consolidated statements of operations, comprehensive income, stockholders’ equity, and cash flows, for each of the three years in the period ended March 31, 2018, and the related notes and the schedule listed in the Index at Item 15 (collectively referred to as the “financial statements”). We also have audited the Company’s internal control over financial reporting as of March 31, 2018, based on criteria established in Internal Control—Integrated Framework (2013) issued by the Committee of Sponsoring Organizations of the Treadway Commission (“COSO”).
In our opinion, the financial statements referred to above present fairly, in all material respects, the financial position of the Company as of March 31, 2018 and 2017, and the results of its operations and its cash flows for each of the three years in the period ended March 31, 2018, in conformity with accounting principles generally accepted in the United States of America. Also, in our opinion, the Company maintained, in all material respects, effective internal control over financial reporting as of March 31, 2018, based on criteria established in Internal Control - Integrated Framework (2013) issued by COSO.
Basis for Opinions
The Company’s management is responsible for these financial statements, for maintaining effective internal control over financial reporting, and for its assessment of the effectiveness of internal control over financial reporting, included in the accompanying Management’s Annual Report on Internal Control Over Financial Reporting. Our responsibility is to express an opinion on these financial statements and an opinion on the Company’s internal control over financial reporting based on our audits. We are a public accounting firm registered with the Public Company Accounting Oversight Board (United States) (“PCAOB”) and are required to be independent with respect to the Company in accordance with the U.S. federal securities laws and the applicable rules and regulations of the Securities and Exchange Commission and the PCAOB.
We conducted our audits in accordance with the standards of the PCAOB. Those standards require that we plan and perform the audits to obtain reasonable assurance about whether the financial statements are free of material misstatement, whether due to error or fraud, and whether effective internal control over financial reporting was maintained in all material respects.
Our audits of the financial statements included performing procedures to assess the risks of material misstatement of the financial statements, whether due to error or fraud, and performing procedures to respond to those risks. Such procedures included examining, on a test basis, evidence regarding the amounts and disclosures in the financial statements. Our audits also included evaluating the accounting principles used and significant estimates made by management, as well as evaluating the overall presentation of the financial statements. Our audit of internal control over financial reporting included obtaining an understanding of internal control over financial reporting, assessing the risk that a material weakness exists, and testing and evaluating the design and operating effectiveness of internal control based on the assessed risk. Our audits also included performing such other procedures as we considered necessary in the circumstances. We believe that our audits provide a reasonable basis for our opinions.
Definition and Limitations of Internal Control over Financial Reporting
A company’s internal control over financial reporting is a process designed to provide reasonable assurance regarding the reliability of financial reporting and the preparation of financial statements for external purposes in accordance with generally accepted accounting principles. A company’s internal control over financial reporting includes those policies and procedures that (1) pertain to the maintenance of records that, in reasonable detail, accurately and fairly reflect the transactions and dispositions of the assets of the company; (2) provide reasonable assurance that transactions are recorded as necessary to permit preparation of financial statements in accordance with generally accepted accounting principles, and that receipts and expenditures of the company are being made only in accordance with authorizations of management and directors of the company; and (3) provide reasonable assurance regarding prevention or timely detection of unauthorized acquisition, use, or disposition of the company’s assets that could have a material effect on the financial statements.
McKESSON CORPORATION
Because of its inherent limitations, internal control over financ
Showing the first 8K of 304K characters. Open the full section
Item 9. Changes in and Disagreements with Accountants on Accounting and Financial Disclosure.
None.
Item 9A. Controls and Procedures.
Disclosure Controls and Procedures
Our Chief Executive Officer and our Chief Financial Officer, with the participation of other members of the Company’s management, have evaluated the effectiveness of the Company’s “disclosure controls and procedures” (as such term is defined in Exchange Act Rules 13a-15(e) and 15d-15(e)) as of the end of the period covered by this report and have concluded that our disclosure controls and procedures are effective based on their evaluation of these controls and procedures as required by paragraph (b) of Exchange Act Rules 13a-15 or 15d-15.
Internal Control over Financial Reporting
Management’s report on the Company’s internal control over financial reporting (as such term is defined in Exchange Act Rules 13a-15(f) and 15d-15(f)) and the related report of our independent registered public accounting firm are included in this Annual Report on Form 10-K, under the headings, “Management’s Annual Report on Internal Control Over Financial Reporting” and “Report of Independent Registered Public Accounting Firm” and are incorporated herein by reference.
Changes in Internal Controls
There were no changes in our internal control over financial reporting identified in connection with the evaluation required by paragraph (d) of Exchange Act Rules 13a-15 or 15d-15 that occurred during our fourth quarter of 2018 that have materially affected, or are reasonably likely to materially affect, our internal control over financial reporting.
Item 9B. Other Information.
None.
McKESSON CORPORATION
PART III
Item 10. Directors, Executive Officers and Corporate Governance.
Information about our Directors is incorporated by reference from the discussion under Item 1 of our Proxy Statement for the 2018 Annual Meeting of Stockholders (the “Proxy Statement”) under the heading “Election of Directors.” Information about compliance with Section 16(a) of the Exchange Act is incorporated by reference from the discussion under the heading “Section 16(a) Beneficial Ownership Reporting Compliance” in our Proxy Statement. Information about our Audit Committee, including the members of the committee and our Audit Committee Financial Expert, is incorporated by reference from the discussion under the headings “Audit Committee,” “Audit Committee Financial Expert” and “Audit Committee Report” in our Proxy Statement.
Information about the Code of Conduct applicable to all employees, officers and directors can be found on our website, www.mckesson.com, under the caption “Investors - Corporate Governance.” The Company’s Corporate Governance Guidelines and Charters for the Audit, Compensation and Governance Committees can also be found on our website under the same caption.
The Company intends to post on its website required information regarding any amendment to, or waiver from, the Code of Conduct that applies to our Chief Executive Officer, Chief Financial Officer, Controller and persons performing similar functions within four business days after any such amendment or waiver.
Item 11. Executive Compensation.
Information with respect to this item is incorporated by reference from the discussion under the heading “Executive Compensation” in our Proxy Statement.
Item 12. Security Ownership of Certain Beneficial Owners and Management and Related Stockholder Matters.
Information about security ownership of certain beneficial owners and management is incorporated by reference from the discussion under the heading “Principal Shareholders” in our Proxy Statement.
The following table sets forth information as of March 31, 2018 with respect to the plans under which the Company’s common stock is authorized for issuance:
| Plan Category (In millions, except per share amounts) | Number of securities to be issued upon exercise of outstanding options, warrants and rights | Weighted-average exercise price of outstanding options, warrants and rights (1) | Number of securities remaining available for future issuance under equity compensation plans (excluding securities reflected in the first column) | |||||
| Equity compensation plans approved by security holders | 4.0 (2) | $ | 161.27 | 31.2 (3) | ||||
| Equity compensation plans not approved by security holders | — | $ | — | — |
| (1) | The weighted-average exercise price set forth in this column is calculated excluding outstanding restricted stock unit (“RSU”) awards, since recipients are not required to pay an exercise price to receive the shares subject to these awards. |
| (2) | Represents option and RSU awards outstanding under the following plans: (i) 1997 Non-Employee Directors’ Equity Compensation and Deferral Plan; (ii) the 2005 Stock Plan; and (iii) the 2013 Stock Plan. |
| (3) | Represents 3,462,328 shares available for purchase under the 2000 Employee Stock Purchase Plan and 27,706,614 shares available for grant under the 2013 Stock Plan. |
The following are descriptions of equity plans that have been approved by the Company’s stockholders. The plans are administered by the Compensation Committee of the Board of Directors, except for the portion of the 2013 Stock Plan and 2005 Stock Plan related to non-employee directors, which is administered by the Board of Directors or its Governance Committee.
McKESSON CORPORATION
2013 Stock Plan: The 2013 Stock Plan was adopted by the Board of Directors on May 22, 2013 and approved by the Company’s stockholders on July 31, 2013. The 2013 Stock Plan permits the grant of awards in the form of stock options, stock appreciation rights, restricted stock (“RS”), restricted stock units (“RSUs”), performance-based restricted stock units (“PeRSUs”), performance shares and other share-based awards. The number of shares reserved for issuance under the 2013 Stock Plan equals the sum of (i) 30,000,000 shares, (ii) the number of shares reserved but unissued under the 2005 Stock Plan as of the effective date of the 2013 Stock Plan, and (iii) the number of shares that become available for reuse under the 2005 Stock Plan following the effective date of the 2013 Stock Plan. For any one share of common stock issued in connection with an RS, RSU, performance share or other full share award, three and one-half shares shall be deducted from the shares available for future grants. Shares of common stock not issued or delivered as a result of the net exercise of a stock option, including in respect of the payment of applicable taxes, or shares repurchased on the open market with proceeds from the exercise of options shall not be returned to the reserve of shares available for issuance under the 2013 Stock Plan. Shares withheld to satisfy tax obligations relating to the vesting of a full-share award shall be returned to the reserve of shares available for issuance under the 2013 Stock Plan.
Stock options are granted at no less than fair market value and those options granted under the 2013 Stock Plan generally have a contractual term of seven years. Options generally become exercisable in four equal annual installments beginning one year after the grant date. The vesting of RS or RSUs is determined by the Compensation Committee at the time of grant. RS and RSUs generally vest over four years. PeRSUs vest three years following the end of the performance period. Beginning in May 2014, the Company’s executive officers are annually granted performance awards called Total Shareholder Return Units (“TSRUs”), which have a three-year performance period and are payable in shares without an additional vesting period.
Non-employee directors may be granted an award on the date of each annual meeting of the stockholders for up to 5,000 RSUs, as determined by the Board. Such non-employee director award is fully vested on the date of the grant.
2005 Stock Plan: The 2005 Stock Plan was adopted by the Board of Directors on May 25, 2005 and approved by the Company’s stockholders on July 27, 2005. The 2005 Stock Plan permits the granting of up to 42.5 million shares in the form of stock options, RS, RSUs, PeRSUs, performance shares and other share-based awards. For any one share of common stock issued in connection with an RS, RSU, performance share or other full-share award, two shares shall be deducted from the shares available for future grants. Shares of common stock not issued or delivered as a result of the net exercise of a stock option, shares withheld to satisfy tax obligations relating to the vesting of a full-share award or shares repurchased on the open market with proceeds from the exercise of options shall not be returned to the reserve of shares available for issuance under the 2005 Stock Plan.
Following the effectiveness of the 2013 Stock Plan, no further shares were made subject to award under the 2005 Stock Plan. Shares reserved but unissued under the 2005 Stock Plan as of the effective date of the 2013 Stock Plan, and shares that become available for reuse under the 2005 Stock Plan following the effectiveness of the 2013 Stock Plan, will be available for awards under the 2013 Stock Plan.
Stock options are granted at no less than fair market value and those options granted under the 2005 Stock Plan generally have a contractual term of seven years. Options generally become exercisable in four equal annual installments beginning one year after the grant date. The vesting of RS or RSUs is determined by the Compensation Committee at the time of grant. RS and RSUs generally vest over four years. PeRSUs vest three years following the end of the performance period.
Non-employee directors may be granted an award on the date of each annual meeting of the stockholders for up to 5,000 RSUs, as determined by the Board. Such non-employee director award is fully vested on the date of the grant.
1997 Non-Employee Directors’ Equity Compensation and Deferral Plan: The 1997 Non-Employee Directors’ Equity Compensation and Deferral Plan was approved by the Company’s stockholders on July 30, 1997; however, stockholder approval of the 2005 Stock Plan on July 27, 2005 had the effect of terminating the 1997 Non-Employee Directors’ Equity Compensation and Deferral Plan such that no new awards would be granted under the 1997 Non-Employee Directors’ Equity Compensation and Deferral Plan.
2000 Employee Stock Purchase Plan (the “ESPP”): The ESPP is intended to qualify as an “employee stock purchase plan” within the meaning of Section 423 of the Internal Revenue Code. In March 2002, the Board amended the ESPP to allow for participation in the plan by employees of certain of the Company’s international and other subsidiaries. As to those employees, the ESPP does not qualify under Section 423 of the Internal Revenue Code. Currently, 21.1 million shares have been approved by stockholders for issuance under the ESPP.
McKESSON CORPORATION
The ESPP is implemented through a continuous series of three-month purchase periods (“Purchase Periods”) during which contributions can be made toward the purchase of common stock under the plan.
Each eligible employee may elect to authorize regular payroll deductions during the next succeeding Purchase Period, the amount of which may not exceed 15% of a participant’s compensation. At the end of each Purchase Period, the funds withheld by each participant will be used to purchase shares of the Company’s common stock. The purchase price of each share of the Company’s common stock is 85% of the fair market value of each share on the last day of the applicable Purchase Period. In general, the maximum number of shares of common stock that may be purchased by a participant for each calendar year is determined by dividing $25,000 by the fair market value of one share of common stock on the offering date.
There currently are no equity awards outstanding that were granted under equity plans that were not submitted for approval by the Company’s stockholders.
Item 13. Certain Relationships and Related Transactions, and Director Independence.
Information with respect to certain transactions with management is incorporated by reference from the Proxy Statement under the heading “Certain Relationships and Related Transactions.” Additional information regarding certain related party balances and transactions is included in the Financial Review section of this Annual Report on Form 10-K and Financial Note 26, “Related Party Balances and Transactions,” to the consolidated financial statements appearing in this Annual Report on Form 10‑K.
Item 14. Principal Accounting Fees and Services.
Information regarding principal accounting fees and services is set forth under the heading “Ratification of Appointment of Deloitte & Touche LLP as the Company’s Independent Registered Public Accounting Firm for Fiscal 2019” in our Proxy Statement and all such information is incorporated herein by reference.
McKESSON CORPORATION
PART IV
Item 15. Exhibits and Financial Statement Schedule.
McKESSON CORPORATION
SCHEDULE II
SUPPLEMENTARY CONSOLIDATED FINANCIAL STATEMENT SCHEDULE
VALUATION AND QUALIFYING ACCOUNTS
For the Years Ended March 31, 2018, 2017 and 2016
(In millions)
| Additions | |||||||||||||||||||
| Description | Balance at Beginning of Year | Charged to Costs and Expenses | Charged to Other Accounts (3) | Deductions From Allowance Accounts (1) | Balance at End of Year (2) | ||||||||||||||
| Year Ended March 31, 2018 | |||||||||||||||||||
| Allowances for doubtful accounts | $ | 243 | $ | 44 | $ | 13 | $ | (113 | ) | $ | 187 | ||||||||
| Other allowances | 42 | — | (3 | ) | — | 39 | |||||||||||||
| $ | 285 | $ | 44 | $ | 10 | $ | (113 | ) | $ | 226 | |||||||||
| Year Ended March 31, 2017 | |||||||||||||||||||
| Allowances for doubtful accounts | $ | 212 | $ | 93 | $ | 7 | $ | (69 | ) | $ | 243 | ||||||||
| Other allowances | 41 | — | 2 | (1 | ) | 42 | |||||||||||||
| $ | 253 | $ | 93 | $ | 9 | $ | (70 | ) | $ | 285 | |||||||||
| Year Ended March 31, 2016 | |||||||||||||||||||
| Allowances for doubtful accounts | $ | 141 | $ | 113 | $ | 2 | $ | (44 | ) | $ | 212 | ||||||||
| Other allowances | 33 | — | (3 | ) | 11 | 41 | |||||||||||||
| $ | 174 | $ | 113 | $ | (1 | ) | $ | (33 | ) | $ | 253 | ||||||||
| 2018 | 2017 | 2016 | |||||||||||
| (1) | Deductions: | ||||||||||||
| Written off | $ | (113 | ) | $ | (70 | ) | $ | (33 | ) | ||||
| Credited to other accounts | — | — | — | ||||||||||
| Total | $ | (113 | ) | $ | (70 | ) | $ | (33 | ) | ||||
| (2) | Amounts shown as deductions from current and non-current receivables | $ | 226 | $ | 285 | $ | 253 | ||||||
| (3) | Primarily represents reclassifications from other balance sheet accounts. |
McKESSON CORPORATION
EXHIBIT INDEX
The agreements included as exhibits to this report are included to provide information regarding their terms and not intended to provide any other factual or disclosure information about the Company or the other parties to the agreements. The agreements may contain representations and warranties by each of the parties to the applicable agreement that were made solely for the benefit of the other parties to the applicable agreement, and;
| • | should not in all instances be treated as categorical statements of fact, but rather as a way of allocating the risk to one of the parties if those statements prove to be inaccurate; |
| • | may apply standards of materiality in a way that is different from what may be viewed as material to you or other investors; and |
| • | were made only as of the date of the applicable agreement or such other date or dates as may be specified in the agreement and are subject to more recent developments. |
Accordingly, these representations and warranties may not describe the actual state of affairs as of the date they were made or at any other time.
Exhibits identified under “Incorporated by Reference” in the table below are on file with the Commission and are incorporated by reference as exhibits hereto.
McKESSON CORPORATION
McKESSON CORPORATION
McKESSON CORPORATION
| * | Management contract or compensation plan or arrangement in which directors and/or executive officers are eligible to participate. |
| † | Filed herewith. |
| †† | Furnished herewith. |
Registrant agrees to furnish to the Commission upon request a copy of each instrument defining the rights of security holders with respect to issues of long-term debt of the registrant, the authorized principal amount of which does not exceed 10% of the total assets of the registrant.
McKESSON CORPORATION
SIGNATURES
Pursuant to the requirements of Section 13 or 15(d) of the Securities Exchange Act of 1934, the registrant has duly caused this report to be signed on its behalf by the undersigned, thereunto duly authorized.
| MCKESSON CORPORATION | |||
| Date: May 24, 2018 | /s/ Britt J. Vitalone | ||
| Britt J. Vitalone | |||
| Executive Vice President and Chief Financial Officer |
Pursuant to the requirements of the Securities Exchange Act of 1934, this report has been signed below by the following persons on behalf of the Registrant and in the capacities and on the date indicated:
| * | * | |
| John H. Hammergren Chairman of the Board, President and Chief Executive Officer (Principal Executive Officer) | Donald R. Knauss, Director | |
| * | * | |
| Britt J. Vitalone Executive Vice President and Chief Financial Officer (Principal Financial Officer) | Marie L. Knowles, Director | |
| * | * | |
| Erin M. Lampert Senior Vice President and Chief Accounting Officer (Principal Accounting Officer) | Bradley E. Lerman, Director | |
| * | * | |
| Andy D. Bryant, Director | Edward A. Mueller, Director | |
| * | * | |
| N. Anthony Coles, M.D., Director | Susan R. Salka, Director | |
| * | /s/ Lori A. Schechter | |
| M. Christine Jacobs, Director | Lori A. Schechter *Attorney-in-Fact | |
| Date: May 24, 2018 |
McKESSON CORPORATION
| DIRECTORS AND OFFICERS | ||
| BOARD OF DIRECTORS | CORPORATE OFFICERS | |
| John H. Hammergren | John H. Hammergren | |
| Chairman of the Board, | Chairman of the Board, | |
| President and Chief Executive Officer, | President and Chief Executive Officer, | |
| McKesson Corporation | McKesson Corporation | |
| Andy D. Bryant | Britt J. Vitalone | |
| Chairman of the Board, | Executive Vice President and Chief Financial Officer | |
| Intel Corporation | ||
| Jorge L. Figueredo | ||
| N. Anthony Coles, M. D. | Executive Vice President, Human Resources | |
| Chairman and Chief Executive Officer, | ||
| Yumanity Therapeutics, LLC | Kathleen D. McElligott | |
| Executive Vice President, Chief Information Officer and | ||
| M. Christine Jacobs | Chief Technology Officer | |
| Chairman of the Board, President and | ||
| Chief Executive Officer, Retired, | Bansi Nagji | |
| Theragenics Corporation | Executive Vice President, | |
| Corporate Strategy and Business Development | ||
| Donald R. Knauss | ||
| Executive Chairman of the Board, Retired, | Lori A. Schechter | |
| The Clorox Company | Executive Vice President, General Counsel and | |
| Chief Compliance Officer | ||
| Marie L. Knowles | ||
| Executive Vice President and | Erin M. Lampert | |
| Chief Financial Officer, Retired, | Senior Vice President and Chief Accounting Officer | |
| Atlantic Richfield Company | ||
| Brian P. Moore | ||
| Bradley E. Lerman | Senior Vice President and Treasurer | |
| Senior Vice President, General Counsel and | ||
| Corporate Secretary, | Paul A. Smith | |
| Medtronic plc | Senior Vice President, Taxes | |
| Edward A. Mueller | Michele Lau | |
| Chairman of the Board and | Corporate Secretary | |
| Chief Executive Officer, Retired, | ||
| Qwest Communications International Inc. | ||
| Susan R. Salka | ||
| Chief Executive Officer and President, | ||
| AMN Healthcare Services, Inc. | ||
McKESSON CORPORATION
CORPORATE INFORMATION
Common Stock
McKesson Corporation common stock is listed on the New York Stock Exchange (ticker symbol MCK) and is quoted in the daily stock tables carried by most newspapers.
Stockholder Information
EQ Shareowner Services, 1110 Centre Pointe Curve, Suite 101, Mendota Heights, MN 55120-4100 acts as transfer agent, registrar, dividend-paying agent and dividend reinvestment plan agent for McKesson Corporation stock and maintains all registered stockholder records for the Company. For information about McKesson Corporation stock or to request replacement of lost dividend checks, stock certificates or 1099-DIVs, or to have your dividend check deposited directly into your checking or savings account, stockholders may call EQ Shareowner Services’ telephone response center at (866) 614-9635. For the hearing impaired call (651) 450-4144. EQ Shareowner Services also has a website—https://www.shareowneronline.com\-that stockholders may use 24 hours a day to request account information.
Dividends and Dividend Reinvestment Plan
Dividends are generally paid on the first business day of January, April, July and October. McKesson Corporation’s Dividend Reinvestment Plan offers stockholders the opportunity to reinvest dividends in common stock and to purchase additional shares of common stock. Stock in an individual’s Dividend Reinvestment Plan is held in book entry at the Company’s transfer agent, EQ Shareowner Services. For more information, or to request an enrollment form, call EQ Shareowner Services’ telephone response center at (866) 614-9635. From outside the United States, call +1-651-450-4064.
Annual Meeting
McKesson Corporation’s Annual Meeting of Stockholders will be held at 8:30 a.m. CDT, on July 25, 2018 at the Dallas/Fort Worth Airport Marriott, 8440 Freeport Parkway, Irving, TX 75063.