 filings.tools
Item 5. Market for the Registrant’s Common Equity, Related Stockholder Matters and Issuer Purchases of Equity Securities.
8K characters. Original on sec.gov · Markdown
Item 5. Market for the Registrant’s Common Equity, Related Stockholder Matters and Issuer Purchases of Equity Securities.
| (a) | Market Information: The principal market on which our common stock is traded is the New York Stock Exchange (“NYSE”) under the trading symbol of “MCK”. |
| (b) | Holders: The number of record holders of our common stock at March 31, 2020 was approximately 5,034. |
| (c) | Dividends: In July 2019, our quarterly dividend was raised from $0.39 to $0.41 per common share for dividends declared on or after such date by the Board. We declared regular cash dividends of $1.62 and $1.51 per share in the years ended March 31, 2020 and 2019. |
We anticipate that we will continue to pay quarterly cash dividends in the future. However, the payment and amount of future dividends remain within the discretion of the Board and will depend upon our future earnings, financial condition, capital requirements and other factors.
| (d) | Securities Authorized for Issuance under Equity Compensation Plans: Information relating to this item is provided under Part III, Item 12, to this Annual Report on Form 10-K. |
| (e) | Share Repurchase Plans: Stock repurchases may be made from time to time in open market transactions, privately negotiated transactions, through accelerated share repurchase (“ASR”) programs, or by any combination of such methods. The timing of any repurchases and the actual number of shares repurchased will depend on a variety of factors, including our stock price, corporate and regulatory requirements, restrictions under our debt obligations and other market and economic conditions. |
During the last three years, our share repurchases were transacted through both open market transactions and ASR programs with third-party financial institutions.
In 2018, we repurchased 3.5 million shares for $500 million through open market transactions at an average price per share of $144.43. In June 2017, August 2017 and March 2018, we entered into three separate ASR programs with third-party financial institutions to repurchase $250 million, $400 million and $500 million of our common stock. As of March 31, 2018, we completed and received a total of 1.5 million shares under the June 2017 ASR program and a total of 2.7 million shares under the August 2017 ASR program. In addition, we received 2.5 million shares representing the initial number of shares due in March 2018 and an additional 1.0 million shares in the first quarter of 2019. The March 2018 ASR program was completed at an average price per share of $143.66 during the first quarter of 2019. The total authorization outstanding for repurchase of our common stock was $1.1 billion at March 31, 2018.
In May 2018, the Board authorized the repurchase of up to $4.0 billion of our common stock. The total authorization outstanding for repurchases of our common stock was increased to $5.1 billion at that time. During 2019, we repurchased 10.4 million shares for $1.4 billion through open market transactions at an average price per share of $132.14. In December 2018, we entered into an ASR program with a third-party financial institution to repurchase $250 million of our common stock. The total number of shares repurchased under this ASR program was 2.1 million shares at an average price per share of $117.98. The total authorization outstanding for repurchase of our common stock was $3.5 billion at March 31, 2019.
In 2019, we retired 5.0 million or $542 million of our treasury shares previously repurchased. Under the applicable state law, these shares resume the status of authorized and unissued shares upon retirement. In accordance with our accounting policy, we allocate any excess of share repurchase price over par value between additional paid-in capital and retained earnings. Accordingly, our retained earnings and additional paid-in capital were reduced by $472 million and $70 million during 2019.
In 2020, we repurchased 9.2 million shares for $1.3 billion through open market transactions at an average price per share of $144.68. In May 2019, we entered into an ASR program with a third-party financial institution to repurchase $600 million of our common stock. The total number of shares repurchased under this ASR program was 4.7 million shares at an average price per share of $127.68. The total authorization outstanding for repurchase of our common stock was $1.5 billion at March 31, 2020.
McKESSON CORPORATION
The following table provides information on our share repurchases during the fourth quarter of 2020:
| Share Repurchases (1) | |||||||||||||
| (In millions, except price per share) | Total Number of Shares Purchased (2) | Average Price Paid per Share | Total Number of Shares Purchased as Part of Publicly Announced Programs (2) | Approximate Dollar Value of Shares that May Yet Be Purchased Under the Programs | |||||||||
| January 1, 2020 - January 31, 2020 | — | $ | — | — | $ | 1,535 | |||||||
| February 1, 2020 - February 29, 2020 | — | — | — | 1,535 | |||||||||
| March 1, 2020 - March 31, 2020 | 15.4 | — | 15.4 | 1,535 | |||||||||
| Total | 15.4 | 15.4 |
| (1) | This table does not include shares tendered to satisfy the exercise price in connection with cashless exercises of employee stock options or shares tendered to satisfy tax-withholding obligations in connection with employee equity awards. |
| (2) | On March 9, 2020, we completed the previously announced separation (“Split-off”) of our interest in the Change Healthcare JV. In connection with the Split-off, we distributed all 176.0 million outstanding shares of common stock of our wholly owned subsidiary, PF2 SpinCo, Inc. (“SpinCo”), which held all of McKesson’s interests in the Change Healthcare JV, to participating holders of our common stock in exchange for 15.4 million shares of McKesson stock which now are held as treasury stock on our consolidated balance sheet. Refer to Financial Note 22, “Stockholders' Equity,” to the accompanying consolidated financial statements included in this Annual Report on Form 10-K for more information. |
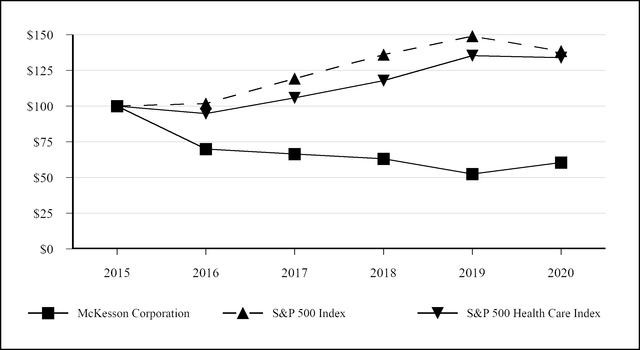
| (f) | Stock Price Performance Graph*: The following graph compares the cumulative total stockholder return on our common stock for the periods indicated with the Standard & Poor’s 500 Index and the S&P 500 Health Care Index. The S&P 500 Health Care Index was selected as a comparator because it is generally available to investors and broadly used by other companies in the same industry. |
| March 31, | |||||||||||||||||||||||
| 2015 | 2016 | 2017 | 2018 | 2019 | 2020 | ||||||||||||||||||
| McKesson Corporation | $ | 100.00 | $ | 69.92 | $ | 66.37 | $ | 63.06 | $ | 52.40 | $ | 60.55 | |||||||||||
| S&P 500 Index | $ | 100.00 | $ | 101.78 | $ | 119.26 | $ | 135.95 | $ | 148.86 | $ | 138.47 | |||||||||||
| S&P 500 Health Care Index | $ | 100.00 | $ | 94.82 | $ | 105.81 | $ | 117.74 | $ | 135.27 | $ | 133.90 | |||||||||||
| * Assumes $100 invested in McKesson Common Stock and in each index on March 31, 2015 and that all dividends are reinvested. |
McKESSON CORPORATION
Previous: Item 4. Mine Safety Disclosures. · Next: Item 6. Selected Financial Data.