 filings.tools
Mondelez International 10-K 2020-12-31
Filed 2021-02-05. 22 sections, 641K characters. Original on sec.gov · Markdown · JSON
Cover and table of contents
UNITED STATES
SECURITIES AND EXCHANGE COMMISSION
WASHINGTON, D.C. 20549
FORM 10-K
(Mark one)
| ☒ | ANNUAL REPORT PURSUANT TO SECTION 13 OR 15(d) OF THE SECURITIES EXCHANGE ACT OF 1934 |
For the fiscal year ended December 31, 2020
OR
| ☐ | TRANSITION REPORT PURSUANT TO SECTION 13 OR 15(d) OF THE SECURITIES EXCHANGE ACT OF 1934 |
For the transition period from ___________ to ______________
COMMISSION FILE NUMBER 1-16483
Mondelēz International, Inc.
(Exact name of registrant as specified in its charter)
| Virginia | 52-2284372 | |||||||
| (State or other jurisdiction of incorporation or organization) | (I.R.S. Employer Identification No.) | |||||||
| 905 West Fulton Market, Suite 200 | ||||||||
| Chicago, | Illinois | 60607 | ||||||
| (Address of principal executive offices) | (Zip Code) |
Registrant’s telephone number, including area code: 847-943-4000
Securities registered pursuant to Section 12(b) of the Act:
| Title of each class | Trading Symbol(s) | Name of each exchange on which registered | ||||||||||||
| Class A Common Stock, no par value | MDLZ | The Nasdaq Global Select Market | ||||||||||||
| 1.000% Notes due 2022 | MDLZ22 | The Nasdaq Stock Market LLC | ||||||||||||
| 1.625% Notes due 2023 | MDLZ23 | The Nasdaq Stock Market LLC | ||||||||||||
| 1.625% Notes due 2027 | MDLZ27 | The Nasdaq Stock Market LLC | ||||||||||||
| 2.375% Notes due 2035 | MDLZ35 | The Nasdaq Stock Market LLC | ||||||||||||
| 4.500% Notes due 2035 | MDLZ35A | The Nasdaq Stock Market LLC | ||||||||||||
| 3.875% Notes due 2045 | MDLZ45 | The Nasdaq Stock Market LLC |
Securities registered pursuant to Section 12(g) of the Act: None
Indicate by check mark if the registrant is a well-known seasoned issuer, as defined in Rule 405 of the Securities Act. Yes x No ¨
Indicate by check mark if the registrant is not required to file reports pursuant to Section 13 or Section 15(d) of the Act. Yes ¨ No x
Note: Checking the box above will not relieve any registrant required to file reports pursuant to Section 13 or 15(d) of the Exchange Act from their obligations under those Sections.
Indicate by check mark whether the registrant (1) has filed all reports required to be filed by Section 13 or 15(d) of the Securities Exchange Act of 1934 during the preceding 12 months (or for such shorter period that the registrant was required to file such reports), and (2) has been subject to such filing requirements for the past 90 days. Yes x No ¨
Indicate by check mark whether the registrant has submitted electronically every Interactive Data File required to be submitted pursuant to Rule 405 of Regulation S-T (§ 232.405 of this chapter) during the preceding 12 months (or for such shorter period that the registrant was required to submit such files). Yes x No ¨
Indicate by check mark whether the registrant is a large accelerated filer, an accelerated filer, a non-accelerated filer, a smaller reporting company, or an emerging growth company. See the definitions of “large accelerated filer,” “accelerated filer,” “smaller reporting company,” and “emerging growth company” in Rule 12b-2 of the Exchange Act.
| Large accelerated filer | x | Accelerated filer | ¨ | |||||||||||||||||
| Non-accelerated filer | ¨ | Smaller reporting company | ☐ | |||||||||||||||||
| Emerging growth company | ☐ |
If an emerging growth company, indicate by check mark if the registrant has elected not to use the extended transition period for complying with any new or revised financial accounting standards provided pursuant to Section 13(a) of the Exchange Act. ¨
Indicate by check mark whether the registrant has filed a report on and attestation to its management’s assessment of the effectiveness of its internal control over financial reporting under Section 404(b) of the Sarbanes-Oxley Act (15 U.S.C. 7262(b)) by the registered public accounting firm that prepared or issued its audit report. ☒
Indicate by check mark whether the registrant is a shell company (as defined in Rule 12b-2 of the Act). Yes ☐ No x
The aggregate market value of the shares of Class A Common Stock held by non-affiliates of the registrant, computed by reference to the closing price of such stock on June 30, 2020, was $72.2 billion. At January 29, 2021, there were 1,412,114,559 shares of the registrant’s Class A Common Stock outstanding.
Documents Incorporated by Reference
Portions of the registrant’s definitive proxy statement to be filed with the Securities and Exchange Commission in connection with its annual meeting of shareholders expected to be held on May 19, 2021 are incorporated by reference into Part III hereof.
Mondelēz International, Inc.
In this report, for all periods presented, “we,” “us,” “our,” “the Company” and “Mondelēz International” refer to Mondelēz International, Inc. and subsidiaries. References to “Common Stock” refer to our Class A Common Stock.
i
Forward-Looking Statements
This report contains a number of forward-looking statements. Words, and variations of words, such as “will,” “may,” “expect,” “would,” “could,” “might,” “plan,” “believe,” “estimate,” “anticipate,” “likely,” “drive,” “seek,” “aim,” “potential,” “project,” “objective,” “commitment,” “outlook” and similar expressions are intended to identify our forward-looking statements, including but not limited to statements about: the impact of the COVID-19 outbreak on consumer demand, costs, product mix, the availability of our products, our strategic initiatives, our and our partners’ global supply chains, operations and routes to market, and our financial results; our future performance, including our future revenue growth, profitability and earnings growth; our strategy to accelerate consumer-centric growth, drive operational excellence and create a winning growth culture; our leadership position in snacking; our ability to meet consumer needs and demand and identify innovation and renovation opportunities; the results of driving operational excellence; volatility in global consumer, commodity, currency and capital markets; price volatility and pricing actions; the cost environment and measures to address increased costs; our tax rate, tax positions, tax proceedings, transition tax liability and the impact of U.S. and Swiss tax reform on our future results; market share; the United Kingdom ("U.K.") withdrawal from the European Union ("E.U.") and its impact on our business and results, including in connection with disagreements on trade terms, increased costs or supply chain or distribution delays, or other disruptions or negative impacts; the costs of, timing of expenditures under and completion of our restructuring program; category growth; our effect on demand and our market position; consumer snacking behaviors; commodity prices and supply; our investments; research, development and innovation; political, business and economic conditions and volatility; the effect of the imposition of increased or new tariffs, quotas, trade barriers or similar restrictions on our sales or key commodities and potential changes in U.S. trade programs, trade relations, regulations, taxes or fiscal policies; currency exchange rates, controls and restrictions, volatility in foreign currencies and the effect of currency translation on our results of operations; the application of highly inflationary accounting for our Argentinean subsidiaries and the potential for and impacts from currency devaluation in other countries; our e-commerce channel strategies; manufacturing and distribution capacity; changes in laws and regulations, regulatory compliance and related costs; the outcome and effects on us of legal proceedings and government investigations; the estimated value of goodwill and intangible assets; amortization expense for intangible assets; impairment of goodwill and intangible assets and our projections of operating results and other factors that may affect our impairment testing; our accounting estimates and judgments and the impact of new accounting pronouncements; pension obligations, expenses, contributions and assumptions; employee benefit plan expenses, obligations and assumptions; compensation expense; our human capital initiatives; our sustainability and mindful snacking strategies, goals and initiatives and the impacts of climate change; our ability to prevent and respond to cybersecurity breaches and disruptions; our liquidity, funding sources and uses of funding, including debt issuances and our use of commercial paper; our capital structure and liquidity, credit availability and our ability to raise capital, and the impact of market disruptions on us, our counterparties and our business partners; the planned phase out of London Interbank Offered Rates; our risk management program, including the use of financial instruments and the impacts and effectiveness of our hedging activities; working capital; capital expenditures and funding; funding of debt maturities; share repurchases; dividends; long-term value for our shareholders; guarantees; compliance with our debt covenants; and our contractual and other obligations.
These forward-looking statements involve risks and uncertainties, many of which are beyond our control, and many of these risks and uncertainties are currently amplified by and may continue to be amplified by the COVID-19 outbreak. Important factors that could cause our actual results to differ materially from those described in our forward-looking statements include, but are not limited to, uncertainty about the magnitude, duration, geographic reach, impact on the global economy and related current and potential travel restrictions of the COVID-19 outbreak; the current, and uncertain future, impact of the COVID-19 outbreak on our business, growth, reputation, prospects, financial condition, operating results (including components of our financial results), cash flows and liquidity; risks from operating globally including in emerging markets; changes in currency exchange rates, controls and restrictions; volatility of commodity and other input costs; weakness in economic conditions; weakness in consumer spending; pricing actions; tax matters including changes in tax laws and rates, disagreements with taxing authorities and imposition of new taxes; use of information technology and third party service providers; unanticipated disruptions to our business, such as the malware incident, cyberattacks or other security breaches; global or regional health pandemics or epidemics, including COVID-19; competition; protection of our reputation and brand image; changes in consumer preferences and demand and our ability to innovate and differentiate our products; the restructuring program and our other transformation initiatives not yielding the anticipated benefits; changes in the assumptions on which the restructuring program is based; management of our workforce; consolidation of retail customers and competition with retailer and other economy brands; changes in our relationships with customers, suppliers or distributors; legal, regulatory, tax or benefit law changes, claims or actions; the impact of climate change on our supply chain and operations; strategic transactions; significant changes in valuation factors that may adversely affect our impairment testing of goodwill and intangible assets; perceived or actual product quality issues or product recalls; failure to maintain effective internal control over financial reporting; volatility of and access to capital or other markets and our liquidity; pension costs; the expected discontinuance of London Interbank Offered Rates and transition to any other interest rate benchmark; and our ability to protect our intellectual property and intangible assets. We disclaim and do not undertake any obligation to update or revise any forward-looking statement in this report except as required by applicable law or regulation.
PART I
Item 1. Business.
General
We are one of the world’s largest snack companies with global net revenues of $26.6 billion and net earnings of $3.6 billion in 2020. We make and sell primarily snacks, including biscuits (cookies, crackers and salted snacks), chocolate, gum & candy, as well as various cheese & grocery and powdered beverage products. Our portfolio includes snack brands such as Cadbury, Milka and Toblerone chocolate; Oreo, belVita and LU biscuits*; Halls* candy; Trident gum and Tang powdered beverages.
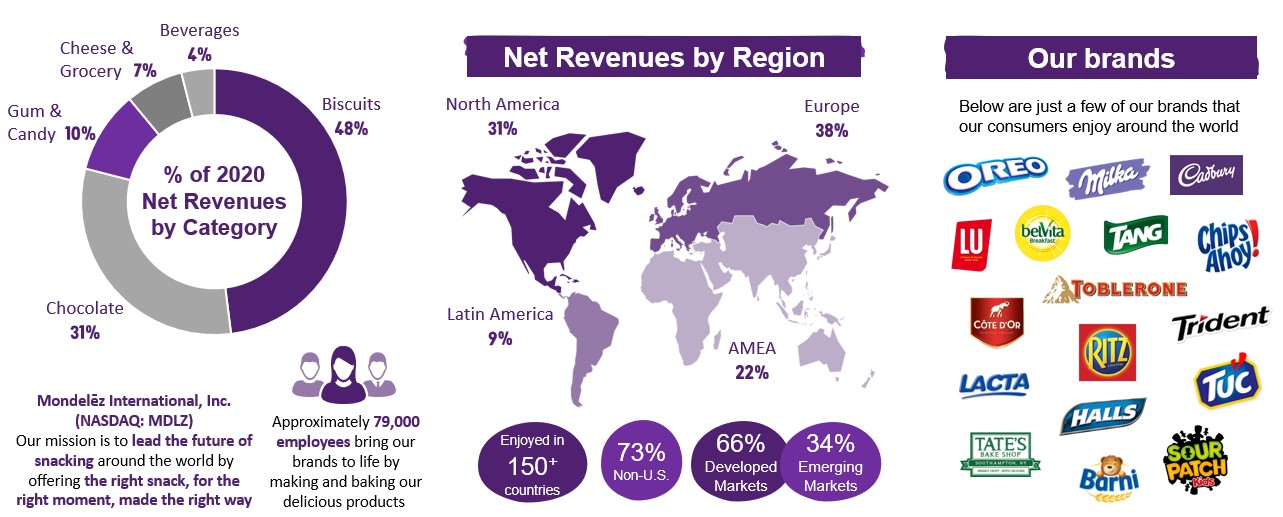
Mondelēz International at a Glance
Strategy
We aim to be the global leader in snacking by focusing on growth, execution and culture. In 2020, while the COVID-19 pandemic significantly affected economies, marketplaces, communities and businesses around the world, including ours, we prioritized our employees, customers and communities and largely continued to execute against our strategic priorities and positioned ourselves to emerge stronger. Please refer to our COVID-19 discussion in Management’s Discussion and Analysis of Financial Condition and Results of Operations. Our strategic plan builds on our strong foundations, including our unique portfolio of iconic global and local brands, our attractive global footprint, our market leadership in developed and emerging markets, our deep innovation, marketing and distribution capabilities, and our margin expansion in recent years that allows us to make ongoing investments in our brands and capabilities.
Our plan to drive long-term growth includes three strategic priorities: accelerating consumer-centric growth, driving operational excellence and creating a winning growth culture.
-
Accelerate consumer-centric growth. As demands on consumers’ time increase and consumer eating habits evolve, we aim to meet consumers' snacking needs by providing the right snack, for the right moment, made the right way. We have developed innovative approaches to identify and address how consumers snack across different emotional and functional needs and occasions that we believe will allow us to meet their needs and identify new innovation and renovation opportunities. We plan to test, learn and scale new product offerings quickly to meet diverse and evolving local and global snacking demand. We believe our understanding of consumers’ behavior will continue to lead to our meeting more of their needs and the growing demand for snacks.
-
Drive operational excellence. Our operational excellence and continuous improvement plans include a special focus on the consumer-facing areas of our business and optimizing our sales, marketing and customer service efforts. To drive productivity gains and cost improvements across our business, we also plan to continue leveraging our global shared services platform, driving greater efficiencies in our supply
chain and continuing to utilize Zero-Based Budgeting across our operations. We expect the improvements and efficiencies we drive will fuel our growth and continue to expand profit dollars. At the same time, we are continuing our efforts to sustainably source key ingredients, reduce our end-to-end environmental impact and innovate our processes and packaging to reduce waste and promote recycling.
- Build a winning growth culture. To support the acceleration of our growth, we are becoming more agile, digital and local-consumer focused. We are giving our local teams more autonomy to drive commercial and innovation plans as they are closer to the needs and desires of consumers. We will continue to leverage the efficiency and scale of our regional operating units while empowering our local commercial operations to respond faster to changing consumer preferences and capitalize on growth opportunities. Our digital transformation program will also help to enable consumer demand and sales opportunities. We believe these operating and cultural shifts will help drive profitable top-line growth.
We run our business with a long-term perspective, and we believe the successful delivery of our strategic plan will drive top- and bottom-line growth and enable us to create long-term value for our shareholders.
Global Operations
We sell our products in over 150 countries and have operations in approximately 80 countries, including 133 manufacturing and processing facilities across 45 countries. The portion of our net revenues generated outside the United States was 73.2% in 2020, 74.4% in 2019 and 75.3% in 2018. For more information on our U.S. and non-U.S. operations, refer to Note 18, Segment Reporting; on our manufacturing and other facilities, refer to Item 2, Properties; and risks related to our operations outside the United States, see Item 1A, Risk Factors.
We also monitor our revenue growth across emerging and developed markets—
-
Our emerging markets include our Latin America region in its entirety; the Asia, Middle East and Africa (“AMEA”) region, excluding Australia, New Zealand and Japan; and the following countries from the Europe region: Russia, Ukraine, Turkey, Kazakhstan, Georgia, Poland, Czech Republic, Slovak Republic, Hungary, Bulgaria, Romania, the Baltics and the East Adriatic countries.
-
Our developed markets include the entire North America region, the Europe region excluding the countries included in the emerging markets definition, and Australia, New Zealand and Japan from the AMEA region.
Operating Segments
Our operations and management structure are organized into four operating segments:
-
Latin America
-
AMEA
-
Europe
-
North America
We manage our operations by region to leverage regional operating scale, manage different and changing business environments more effectively and pursue growth opportunities as they arise across our key markets. Our regional management teams have responsibility for the business, product categories and financial results in the regions.
We use segment operating income to evaluate segment performance and allocate resources. We believe it is appropriate to disclose this measure to help investors analyze segment performance and trends. For a definition and reconciliation of segment operating income to consolidated pre-tax earnings as well as other information on our segments, see Note 18, Segment Reporting.
Our segment net revenues for each of the last three years were:
| For the Years Ended December 31, | |||||||||||||||||
| 2020 | 2019 | 2018 | |||||||||||||||
| (in millions) | |||||||||||||||||
| Net revenues: | |||||||||||||||||
| Latin America | $ | 2,477 | $ | 3,018 | $ | 3,202 | |||||||||||
| AMEA | 5,740 | 5,770 | 5,729 | ||||||||||||||
| Europe | 10,207 | 9,972 | 10,122 | ||||||||||||||
| North America | 8,157 | 7,108 | 6,885 | ||||||||||||||
| $ | 26,581 | $ | 25,868 | $ | 25,938 |
Our segment operating income for each of the last three years was:
| For the Years Ended December 31, | |||||||||||||||||||||||||||||||||||
| 2020 | 2019 | 2018 | |||||||||||||||||||||||||||||||||
| (in millions, except percentages) | |||||||||||||||||||||||||||||||||||
| Segment operating income: | |||||||||||||||||||||||||||||||||||
| Latin America | $ | 189 | 4.3 | % | $ | 341 | 8.1 | % | $ | 410 | 11.1 | % | |||||||||||||||||||||||
| AMEA | 821 | 18.8 | % | 691 | 16.4 | % | 702 | 19.0 | % | ||||||||||||||||||||||||||
| Europe | 1,775 | 40.6 | % | 1,732 | 41.1 | % | 1,734 | 46.9 | % | ||||||||||||||||||||||||||
| North America | 1,587 | 36.3 | % | 1,451 | 34.4 | % | 849 | 23.0 | % | ||||||||||||||||||||||||||
| $ | 4,372 | 100.0 | % | $ | 4,215 | 100.0 | % | $ | 3,695 | 100.0 | % |
Please see Management’s Discussion and Analysis of Financial Condition and Results of Operations for items affecting the comparability of results and a review of our operating results.
Product Categories
Our brands span five product categories:
-
Biscuits (including cookies, crackers and salted snacks)
-
Chocolate
-
Gum & candy
-
Beverages
-
Cheese & grocery
During 2020, our segments contributed to our net revenues in the following product categories:
| Percentage of 2020 Net Revenues by Product Category | ||||||||||||||||||||||||||||||||||||||
| Segment | Biscuits | Chocolate | Gum & Candy | Beverages | Cheese & Grocery | Total | ||||||||||||||||||||||||||||||||
| Latin America | 2.5 | % | 2.3 | % | 1.8 | % | 1.5 | % | 1.2 | % | 9.3 | % | ||||||||||||||||||||||||||
| AMEA | 7.7 | % | 7.6 | % | 2.6 | % | 2.0 | % | 1.7 | % | 21.6 | % | ||||||||||||||||||||||||||
| Europe | 11.4 | % | 19.9 | % | 2.3 | % | 0.4 | % | 4.4 | % | 38.4 | % | ||||||||||||||||||||||||||
| North America | 26.4 | % | 1.0 | % | 3.3 | % | — | % | — | % | 30.7 | % | ||||||||||||||||||||||||||
| 48.0 | % | 30.8 | % | 10.0 | % | 3.9 | % | 7.3 | % | 100.0 | % |
Within our product categories, classes of products that contributed 10% or more to consolidated net revenues were:
| For the Years Ended December 31, | |||||||||||||||||
| 2020 | 2019 | 2018 | |||||||||||||||
| Biscuits - Cookies and crackers | 39 | % | 37 | % | 36 | % | |||||||||||
| Chocolate - Tablets, bars and other | 31 | % | 32 | % | 32 | % |
Seasonality
Demand for our products is generally balanced over the second and third quarters of the year and increases in the first and fourth quarters primarily because of holidays and other seasonal events. Depending on the timing of Easter, the holiday sales may shift between and affect net revenue in the first and second quarter.
Customers
We generally sell our products to supermarket chains, wholesalers, supercenters, club stores, mass merchandisers, distributors, convenience stores, gasoline stations, drug stores, value stores and other retail food outlets. No single customer accounted for 10% or more of our net revenues from continuing operations in 2020. Our five largest customers accounted for 17.5% and our ten largest customers accounted for 24.0% of net revenues from continuing operations in 2020. For a discussion of long-term demographics, consumer trends and demand, refer to our Financial Outlook within Management’s Discussion and Analysis of Financial Condition and Results of Operations.
Distribution and Marketing
We distribute our products through direct store delivery, company-owned and satellite warehouses, distribution centers and other facilities. We use the services of independent sales offices and agents in some of our international locations. Through our global e-commerce organization and capabilities, we pursue online growth with partners in key markets around the world, including both pure e-tailers and omni-channel retailers. We continue to invest in both talent and digital capabilities. Our e-commerce channel strategies play a critical role in our ambition to be the global leader in snacking.
We conduct marketing efforts through three principal sets of activities: (i) consumer marketing and advertising including digital and social media, on-air, print, outdoor and other product promotions; (ii) consumer sales incentives such as coupons and rebates; and (iii) trade promotions to support price features, displays and other merchandising of our products by our customers.
Research, Development and Innovation
Our innovation and new product development objectives include continuous improvement in food safety and quality, growth through new products, superior consumer satisfaction and reduced production costs. Our innovation efforts focus on anticipating consumer demands and adapting quickly to changing market trends. Mindful snacking and sustainability are a significant focus of our current research and development initiatives. Our initiatives aim to accelerate our growth and margin dollars by addressing consumer needs and market trends and leveraging scalable innovation platforms, sustainability programs and initiatives as well as breakthrough technologies. We are focusing our technical research and development resources at 12 innovation technical centers around the globe to drive growth, creativity, greater effectiveness, improved efficiency and accelerated project delivery.
Competition
We face competition in all aspects of our business. Competitors include large multinational as well as numerous local and regional companies. Some competitors have different profit objectives and investment time horizons than we do and therefore may approach pricing and promotional decisions differently. We compete based on product quality, brand recognition and loyalty, service, product innovation, taste, convenience, nutritional value, the ability to identify and satisfy consumer preferences, effectiveness of digital and other sales and marketing, routes to market and distribution networks, promotional activity and price. Growing our market share or introducing a new product requires substantial research, development, advertising and promotional expenditures. We believe these investments lead to better products and stronger brands for the consumer and support our growth and market position.
Raw Materials and Packaging
We purchase and use large quantities of commodities, including cocoa, dairy, wheat, palm and other vegetable oils, sugar and other sweeteners, flavoring agents and nuts. In addition, we purchase and use significant quantities of packaging materials to package our products and natural gas, fuels and electricity for our factories and warehouses. We monitor worldwide supply, commodity cost and currency trends so we can sustainably and cost-effectively secure ingredients, packaging and fuel required for production.
A number of external factors such as changing weather patterns and conditions, commodity market conditions, currency fluctuations and the effects of governmental agricultural or other programs affect the cost and availability of raw materials and agricultural materials used in our products. We address higher commodity costs and currency impacts primarily through hedging, higher pricing and manufacturing and overhead cost control. We use hedging techniques to limit the impact of fluctuations in the cost of our principal raw materials; however, we may not be able to fully hedge against commodity cost changes, and our hedging strategies may not protect us from increases in specific raw material costs.
Due to factors noted above, the costs of our principal raw materials can fluctuate. At this time, we believe there will continue to be an adequate supply of the raw materials we use and that they will generally remain available from numerous sources. However, we continue to monitor the long-term impacts of climate change and related factors that could affect the availability or cost of raw materials, packaging and energy. For additional information on our commodity costs, refer to the Commodity Trends section within Management’s Discussion and Analysis of Financial Condition and Results of Operations. For information on our ongoing sustainability efforts and programs, refer to Sustainability and Mindful Snacking below.
Human Capital Resources
We believe the strength of our workforce is one of the significant contributors to our success as a global company that leads with purpose. All our employees contribute to our success and are instrumental in driving strong financial performance. Attracting, developing and retaining the best talent globally with the right skills to drive our success is central to our long-term growth strategy. At the end of 2020, our workforce consisted of approximately 79,000, compared to approximately 80,000 at the end of 2019. At December 31, 2020, we had approximately 12,000 U.S. employees and approximately 67,000 employees outside the United States, with employees represented by labor unions or workers’ councils representing approximately 26% of our U.S. employees and approximately 63% of our employees outside the United States.
COVID-19 Response: We have been actively responding to the COVID-19 pandemic and its impact globally. Our highest priorities continue to be the safety of our employees and working with our employees and network of suppliers and customers to help maintain the global food supply chain. For more information on our COVID-19 workplace and community response, see our COVID-19 disclosures in Management’s Discussion and Analysis of Financial Condition and Results of Operations.
Workplace Safety: The health, well-being and safety of our employees, customers and communities is our highest priority. Every day we strive to make all our employees, contractors and visitors feel safe. We foster safety leadership throughout the organization as part of our comprehensive health, safety and environment management. Through ongoing communications, capability building, defined standards and safety measures, we strive to improve our safety performance each year.
Total Rewards: We are committed to equal pay for equal work, regardless of gender, race, ethnicity or other personal characteristics. To deliver on that commitment, we benchmark and set pay ranges based on market data and consider various factors such as an employee’s role and experience, job location and performance. We also regularly review our compensation practices to promote fair and equitable pay.
With the support of an independent third-party expert in this field, we have conducted global total target cash (“TTC”) pay equity reviews for salaried employees comparing employees in the same pay grade within a country/area. Our last global analysis was in 2019 and encompassed 65 countries and over 32,000 employees. At the enterprise-wide level, our pay gap between male and female employees was less than 1% and decreasing through pay adjustments for employees identified during the review. In the United States, we also review TTC for salaried employees in the same pay grade by race/ethnicity (Asian, Black and Hispanic). The 2020 independent analysis found no systemic issues and no negative pay gap between non-white and white employees.
To foster a stronger sense of ownership and align the interests of employees with shareholders, we grant deferred stock units to eligible non-executive employees under our stock incentive program. Furthermore, to promote overall employee health and well-being, we provide access to medical and welfare benefits and offer programs to employees that support work-life balance as well as financial, physical and mental health resources. We also provide paid maternity and paternity time off for biological and adoptive parents.
We continue to evolve our programs to meet our employees’ health and wellness needs, which we believe is essential to attract and retain employees.
Diversity & Inclusion: We seek to create and sustain an inclusive and safe workplace for all of our employees. We want to reflect the diversity of our consumers and maximize the power and potential of our employees around the world to deliver stronger business performance. At the end of 2020, women held 38% of global management roles (defined as Associate Director and above) and 34% of executive leadership roles (defined as the management leadership team plus one level below). In September 2020, we announced our goal to double Black representation in our U.S. management team by 2024. For our U.S. leadership, Black employees held 3.2% of management roles (defined as Associate Director and above) at the end of 2020.
As a global employer, we recognize and value differences and are championing diversity and inclusion (“D&I”) around the world. We are creating local and global opportunities to further racial equity and economic empowerment by expanding our D&I initiatives across three key areas: colleagues, culture and communities. These opportunities include mobilizing our consumer-facing brands and leveraging our partnerships with agencies and advertising platforms to drive change, equity and inclusion. To further reinforce our commitment to D&I, we have included specific D&I metrics as a part of our strategic scorecard within our annual incentive plan for the CEO and other senior leaders. The scorecard is used consistently across the Company at both the corporate and region level and is linked directly to the three pillars of our strategy – growth, execution and culture.
Talent Management: Maintaining a robust pipeline of talent is crucial to our ongoing success and is a key aspect of succession planning efforts across the organization. Our leadership and people teams are responsible for attracting and retaining top talent by facilitating an environment where employees feel supported and encouraged in their professional and personal development. Specifically, we promote employee development by reviewing strategic positions regularly and identifying potential internal candidates to fill those roles, evaluating job skill sets to identify competency gaps and creating developmental plans to facilitate employee professional growth. We commit to investing in our employees through training and development programs, on the job experiences, coaching, as well as tuition reimbursement for a majority of our employees in the United States to promote continued professional growth. Additionally, we understand the importance of maintaining competitive compensation, benefits and appropriate training that provides growth, developmental opportunities and multiple career paths within the Company.
Employee Engagement: We conduct confidential engagement surveys of our global workforce that are administered and analyzed by an independent third-party. Aggregate survey results are reviewed by executive officers and the Board of Directors. We create action plans at global, business unit and functional levels as well as for individual managers with direct reports who participate in the survey. By acting on results both at an aggregate enterprise level and a department/business/work group level, and by analyzing our scores compared to both global and internal benchmarks, we have been able to enhance our culture and improve our overall engagement levels.
High impact initiatives including flexible working and proactive support to our people throughout the pandemic have been and will continue to be important drivers of engagement. We also have focused capability building initiatives on agile ways of working and streamlining decision making processes to drive engagement. We are building a winning growth culture that more effectively leverages local commercial expertise and invests in talent and key capabilities. This enables the Company to move with greater speed and agility.
For additional detail on D&I, our workplace safety practices and measurements and workplace wellness, please see our 2020 Snacking Made Right report, which will be published on our website in May 2021.
Sustainability and Mindful Snacking
By living our purpose to empower people to snack right, we believe we can continue to have a positive impact on the lives of our consumers and the world around us. Our mindful snacking strategy aims to encourage consumers to snack with moderation through portion control offerings and labeling, and we continue to evolve our portfolio to meet consumers’ needs. We have been focused on sustainability for many years and we continue to enhance our sustainability goals and reporting.
In May 2020, we issued our 2019 Snacking Made Right report, which includes expanded reporting on environmental, social and governance (“ESG”) topics and highlights our progress toward our sustainability and nutrition-related goals. We also released an ESG disclosure data sheet that outlines our alignment with the
Sustainability Accounting Standards Board (“SASB”) and Task Force on Climate-related Financial Disclosures (“TCFD”) reporting frameworks.
We also participate in the CDP Climate and Water annual disclosure survey and continue to work to reduce our carbon and water footprints. We are committed to continue this and other related work in the areas of sustainable resources and agriculture, mindful snacking, nutrition, community partnerships and safety of our products and people.
Our 2025 sustainability and mindful snacking goals include:
-
Minimizing food waste, end-to-end CO2 emissions and priority water usage by 2025
-
Designing all packaging to be recyclable by 2025 to further reduce our environmental footprint
-
Scaling our Cocoa Life sustainability program so that by 2025, Cocoa Life will produce 100% of the cocoa volume we require for our chocolate brands
-
Growing portion control products to 20 percent of snacks net revenue by 2025
-
Including portion amounts and mindful snacking information on all packages globally by 2025
The Governance, Membership and Public Affairs Committee of our Board of Directors is responsible for overseeing our sustainable snacking and mindful snacking strategies. Our goals are part of our strategic planning process, and therefore, progress and key activities are regularly reported to the Board of Directors and the business leadership teams. Climate change, CO2 emissions, energy, well-being and other sustainability matters are key focus areas in our strategy.
We have been recognized for our ongoing economic, environmental and social contributions. Each year since we created Mondelēz International in 2012 we have been listed on the Dow Jones Sustainability Index (“DJSI”) – World and North American Indices. The DJSI selects the top 10% of global companies and top 20% of North American companies based on an extensive review of financial and sustainability programs within each industry. We are at the 97th percentile of our industry according to the latest DJSI report.
Intellectual Property
Our intellectual property rights (including trademarks, patents, copyrights, registered designs, proprietary trade secrets, recipes, technology and know-how) are material to our business.
We own numerous trademarks and patents in many countries around the world. Depending on the country, trademarks remain valid for as long as they are in use or their registration status is maintained. Trademark registrations generally are renewable for fixed terms. We also have patents for a number of current and potential products. Our patents cover inventions ranging from packaging techniques to processes relating to specific products and to the products themselves. Our issued patents extend for varying periods according to the date of patent application filing or grant and the legal term of patents in the various countries where patent protection is obtained. The actual protection afforded by a patent, which can vary from country to country, depends upon the type of patent, the scope of its coverage as determined by the patent office or courts in the country, and the availability of legal remedies in the country. While our patent portfolio is material to our business, the loss of one patent or a group of related patents would not have a material adverse effect on our business.
From time to time, we grant third parties licenses to use one or more of our trademarks, patents and/or proprietary trade secrets in connection with the manufacture, sale or distribution of third-party products. Similarly, we sell some products under brands, patents and/or proprietary trade secrets we license from third parties. In our agreement with Kraft Foods Group, Inc. (which is now part of The Kraft Heinz Company), we each granted the other party various licenses to use certain of our and their respective intellectual property rights in named jurisdictions following the spin-off of our North American grocery business.
Regulation
Our food products and ingredients are subject to local, national and multinational regulations related to labeling, health and nutrition claims, packaging, pricing, marketing and advertising, data privacy and related areas. In addition, various jurisdictions regulate our operations by licensing and inspecting our manufacturing plants and facilities, enforcing standards for select food products, grading food products, and regulating trade practices related to the sale and pricing of our food products. Many of the food commodities we use in our operations are subject to government agricultural policy and intervention. These policies have substantial effects on prices and supplies and
are subject to periodic governmental and administrative review. In addition, increased attention to environmental and social issues in industry supply chains has led to developing different types of regulation in many countries. The lack of a harmonized approach can lead to uneven scrutiny or enforcement, which can impact our operations.
Examples of laws and regulations that affect our business include workplace safety regulations; selective food taxes; labeling requirements such as front-of-pack labeling based on nutrient profiles; sales or media and marketing restrictions such as those on promotions or advertising products with specified nutrient profiles on certain channels or platforms or during certain hours of the day; sanctions on sales or sourcing of raw materials; potential withdrawal of cross-border trade concessions as retaliation or imposition of new border barriers for other reasons; changes in the corporate tax policies of the United States and other countries; and packaging taxes. In addition, at least 25 countries in the European Union have implemented extended producer responsibility (“EPR”) policies as part of national packaging waste policies that make manufacturers responsible for the cost of recycling food and beverage packaging after consumers use it. These range from mandatory regulations to voluntary agreements between government and industry to voluntary industry initiatives. EPR policies are also being contemplated in other jurisdictions around the world, including certain states in the United States.
Throughout the countries in which we do business, we are subject to local, national and multinational environmental laws and regulations relating to the protection of the environment. We have programs across our business units designed to meet applicable environmental compliance requirements. In the United States, the laws and regulations include the Clean Air Act, the Clean Water Act, the Resource Conservation and Recovery Act and the Comprehensive Environmental Response, Compensation, and Liability Act. We are also subject to legislation designed to reduce emissions from greenhouse gases, and many countries are considering introducing carbon taxes that could increase our production costs or those of our suppliers.
We continue to monitor developments in laws and regulations. Also refer to Note 1, Summary of Significant Accounting Policies – Currency Translation and Highly Inflationary Accounting, for additional information on government regulations and currency-related impacts on our operations in the United Kingdom, Argentina and other countries.
Information about our Executive Officers
The following are our executive officers as of February 5, 2021:
| Name | Age | Title | ||||||||||||
| Dirk Van de Put | 60 | Chief Executive Officer | ||||||||||||
| Luca Zaramella | 51 | Executive Vice President and Chief Financial Officer | ||||||||||||
| Paulette Alviti | 50 | Executive Vice President and Chief People Officer | ||||||||||||
| Maurizio Brusadelli | 52 | Executive Vice President and President, Asia Pacific, Middle East and Africa | ||||||||||||
| Vinzenz P. Gruber | 55 | Executive Vice President and President, Europe | ||||||||||||
| Robin S. Hargrove | 55 | Executive Vice President, Research, Development and Quality | ||||||||||||
| Sandra MacQuillan | 54 | Executive Vice President and Chief Supply Chain Officer | ||||||||||||
| Gerhard W. Pleuhs | 64 | Executive Vice President, Corporate & Legal Affairs and General Counsel (retiring April 2021) | ||||||||||||
| Laura Stein | 59 | Executive Vice President, General Counsel, Corporate & Legal Affairs | ||||||||||||
| Gustavo C. Valle | 56 | Executive Vice President and President, Latin America | ||||||||||||
| Henry Glendon (Glen) Walter IV | 52 | Executive Vice President and President, North America |
Mr. Van de Put became Chief Executive Officer and a director in November 2017 and became Chairman of the Board of Directors in April 2018. He formerly served as President and Chief Executive Officer of McCain Foods Limited, a multinational frozen food provider, from July 2011 to November 2017 and as its Chief Operating Officer from May 2010 to July 2011. Mr. Van de Put served as President and Chief Executive Officer, Global Over-the-Counter, Consumer Health Division of Novartis AG, a global healthcare company, from 2009 to 2010. Prior to that, he worked for 24 years in a variety of leadership positions for several global food and beverage providers, including Danone SA, The Coca-Cola Company and Mars, Incorporated.
Mr. Zaramella became Executive Vice President and Chief Financial Officer in August 2018. He previously served as Senior Vice President Corporate Finance, CFO Commercial and Treasurer from June 2016 to July 2018. He also served as Interim Lead Finance North America from April to November 2017. Prior to that, he served as Senior Vice President and Corporate Controller from December 2014 to August 2016 and Senior Vice President, Finance of Mondelēz Europe from October 2011 to November 2014. Mr. Zaramella joined Mondelēz International in 1996.
Ms. Alviti became Executive Vice President and Chief Human Resources Officer (now Executive Vice President and Chief People Officer) in June 2018. Before joining Mondelēz International, Ms. Alviti served as Senior Vice President and Chief Human Resources Officer of Foot Locker, Inc., a leading global retailer of athletically inspired shoes and apparel, from June 2013 to May 2018. Prior to that, Ms. Alviti spent 17 years at PepsiCo, Inc., a global snack and beverage company, in various leadership roles, including Senior Vice President and Chief Human Resources Officer Asia, Middle East, Africa.
Mr. Brusadelli became Executive Vice President and President, Asia Pacific in January 2016 and Executive Vice President and President, Asia Pacific, Middle East and Africa in October 2016. He previously served as President Biscuits Business, South East Asia, Japan and Sales Asia Pacific from September 2015 to December 2015, President Markets and Sales Asia Pacific from September 2014 to September 2015 and President United Kingdom, Ireland and Nordics from September 2012 to August 2014. Prior to that, Mr. Brusadelli held various positions of increasing responsibility. Mr. Brusadelli joined Mondelēz International in 1993.
Mr. Gruber became Executive Vice President and President, Europe in January 2019. He previously served as President, Western Europe from October 2016 to December 2018 and President, Chocolate, Europe from August 2011 to September 2016. Mr. Gruber was formerly employed by Mondelēz International, in various capacities, from 1989 until 2000 and resumed his employment in September 2007.
Mr. Hargrove became Executive Vice President, Research, Development, Quality and Innovation in April 2015 and as of January 2019 serves as Executive Vice President, Research, Development and Quality. Prior to that, he served as Senior Vice President, Research, Development & Quality for Mondelēz Europe from January 2013 to
March 2015. Before joining Mondelēz International, Mr. Hargrove worked at PepsiCo, Inc., a global snack and beverage company, for 19 years in a variety of leadership positions, most recently as Senior Vice President, Research and Development, Europe from December 2006 to December 2012.
Ms. MacQuillan became Executive Vice President, Integrated Supply Chain (now Executive Vice President and Chief Supply Chain Officer) in June 2019. Before joining Mondelēz International, Ms. MacQuillan served as Chief Supply Chain Officer and Senior Vice President, Supply Chain, at Kimberly-Clark Corporation, a global manufacturer of personal care consumer products, from April 2015 to June 2019. Prior to that, Ms. MacQuillan spent more than 20 years at Mars, Incorporated, a global manufacturer of confectionery, pet food and other food products, in various leadership roles, including Global Vice President, Supply for Mars Global Petcare.
Mr. Pleuhs became Executive Vice President and General Counsel in April 2012 and as of May 2019 serves as Executive Vice President, Corporate & Legal Affairs and General Counsel. In this role, Mr. Pleuhs oversees the legal, compliance, security, corporate and governance affairs functions within Mondelēz International. He has served in various positions of increasing responsibility since joining Mondelēz International in 1990. Mr. Pleuhs has a law degree from the University of Kiel, Germany and is licensed to practice law in Germany and admitted as house counsel in Illinois. Mr. Pleuhs will retire from Mondelēz International in April 2021.
Ms. Stein became Executive Vice President, General Counsel, Corporate & Legal Affairs on January 11, 2021. Before joining Mondelēz International, Ms. Stein spent 15 years at The Clorox Company, a multinational manufacturer and marketer of consumer and professional products, most recently as Executive Vice President – General Counsel and Corporate Affairs from February 2016 to December 2020. She also served as Executive Vice President – General Counsel from February 2015 to February 2016 and as Senior Vice President – General Counsel from January 2005 to February 2015.
Mr. Valle became Executive Vice President and President, Latin America in February 2020. Before joining Mondelēz International, Mr. Valle served as Chief Executive Officer of Axia Plus, LLC, a management consulting firm, from February 2018 to January 2020. Prior to that he spent more than 20 years at Groupe Danone SA, a multinational provider of packaged water, dairy and baby food products, in a variety of leadership positions, most recently as Executive Vice President, Dairy Division Worldwide, from January 2015 to January 2018, and Vice President Dairy Division Europe, from January 2014 until December 2014.
Mr. Walter became Executive Vice President and President, North America in November 2017. Before joining Mondelēz International, Mr. Walter worked at The Coca-Cola Company, a global beverage company, in a variety of leadership positions, most recently as Chief Executive Officer of Coca-Cola Industries China from February 2014 to October 2017 and President and Chief Operating Officer of Cola-Cola Refreshments in North America from January 2013 to February 2014.
Ethics and Governance
We adopted the Mondelēz International Code of Conduct, which qualifies as a code of ethics under Item 406 of Regulation S-K. The code applies to all of our employees, including our principal executive officer, principal financial officer, principal accounting officer or controller, and persons performing similar functions. Our code of ethics is available free of charge on our web site at www.mondelezinternational.com/investors/corporate-governance and will be provided free of charge to any shareholder submitting a written request to: Corporate Secretary, Mondelēz International, Inc., 905 West Fulton Market, Suite 200, Chicago, IL 60607. We will disclose any waiver we grant to an executive officer or director under our code of ethics, or certain amendments to the code of ethics, on our web site at www.mondelezinternational.com/investors/corporate-governance.
In addition, we adopted Corporate Governance Guidelines, charters for each of the Board’s four standing committees and the Code of Business Conduct and Ethics for Non-Employee Directors. All of these materials are available on our web site at www.mondelezinternational.com/investors/corporate-governance and will be provided free of charge to any shareholder requesting a copy by writing to: Corporate Secretary, Mondelēz International, Inc., 905 West Fulton Market, Suite 200, Chicago, IL 60607.
Available Information
Our Internet address is www.mondelezinternational.com. Our Annual Reports on Form 10-K, Quarterly Reports on Form 10-Q, Current Reports on Form 8-K and amendments to those reports filed or furnished pursuant to Section 13(a) or 15(d) of the Securities Exchange Act of 1934, as amended (the “Exchange Act”), are available free of charge as soon as possible after we electronically file them with, or furnish them to, the U.S. Securities and Exchange Commission (the “SEC”). You can access our filings with the SEC by visiting www.sec.gov or our website: ir.mondelezinternational.com/sec-filings. The information on our web site is not, and shall not be deemed to be, a part of this Annual Report on Form 10-K or incorporated into any other filings we make with the SEC.
Item 1A. Risk Factors.
You should carefully read the following discussion of significant factors, events and uncertainties when evaluating our business and the forward-looking information contained in this Annual Report on Form 10-K. The events and consequences discussed in these risk factors could materially and adversely affect our business, operating results, liquidity and financial condition. While we believe we have identified and discussed below the key risk factors affecting our business, these risk factors do not identify all the risks we face, and there may be additional risks and uncertainties that we do not presently know or that we do not currently believe to be significant that may have a material adverse effect on our business, performance or financial condition in the future.
Strategic and Operational Risks
Global or regional health pandemics or epidemics, including COVID-19, could negatively impact our business operations, financial performance and results of operations.
Our business and financial results could be negatively impacted by the outbreak of COVID-19 or other pandemics or epidemics. The severity, magnitude and duration of the current COVID-19 pandemic is uncertain, rapidly changing and hard to predict. In 2020, COVID-19 significantly impacted economic activity and markets around the world, and it could negatively impact our business in numerous ways, including but not limited to those outlined below:
-
The COVID-19 outbreak has resulted and could continue to result in lower revenues in some of our emerging market countries that have a higher concentration of traditional trade outlets (such as small family-run stores), as well as in our travel retail (such as international duty-free stores) and foodservice businesses. We are unable to predict how long these trends will continue or whether they will worsen.
-
In addition, sales of some of our products for in-home consumption in some markets and channels, such as the United States and some European markets and modern trade, increased in 2020. We are unable to predict how long this sustained demand will last or how significant it will be.
-
The COVID-19 outbreak has disrupted and could materially disrupt our global supply chain, operations and routes to market or those of our suppliers, their suppliers, or our co-manufacturers or distributors. The outbreak has also necessitated increased expenditures to secure the safety and effectiveness of our personnel and operations. Disruptions or our failure to effectively respond to them could increase product or distribution costs or cause delays in delivering or an inability to deliver products to our customers. For example, we experienced temporary disruptions in operations in some of our emerging markets such as India and Nigeria in the first half of 2020.
-
Disruptions or uncertainties related to the COVID-19 outbreak for a sustained period of time could result in delays or modifications to our strategic plans and initiatives and hinder our ability to achieve our objective to reduce our operating cost structure in both our supply chain and overhead costs through our Simplify to Grow Program.
-
Illness, travel restrictions, absenteeism or other workforce disruptions have affected and could materially negatively affect our supply chain, manufacturing, distribution or other business processes.
-
Government or regulatory responses to pandemics could negatively impact our business. Mandatory lockdowns or other restrictions on operations in some countries temporarily disrupted our ability to distribute our products in some markets. Continuation or expansion of these disruptions could materially adversely impact our operations and results.
-
Commodity costs have become more volatile due to the COVID-19 outbreak. We expect continued commodity cost volatility, and our commodity hedging activities cannot fully offset this volatility.
-
Initially during the COVID-19 outbreak, the U.S. dollar appreciated materially against other currencies in the countries in which we operate, resulting in currency translation losses. If the U.S. dollar were to appreciate
again against some or all of those same currencies, the resulting currency translation losses, along with currency transaction losses, could adversely affect our reported results of operations and financial condition.
- The COVID-19 outbreak initially increased volatility and pricing in the capital markets and commercial paper markets, and volatility may increase again as COVID-19 evolves. We might not be able to continue to access preferred sources of liquidity when we would like or on terms we find acceptable, and our borrowing costs could increase. An economic or credit crisis could occur and impair credit availability and our ability to raise capital when needed. A disruption in the financial markets may have a negative effect on our derivative counterparties and could impair our banking or other business partners, on whom we rely for access to capital and as counterparties for a number of our derivative contracts.
These and other impacts of the COVID-19 or other global or regional health pandemics or epidemics could have the effect of heightening many of the other risks described in the risk factors below, including but not limited to those relating to our reputation, brands, consumer preferences, supply chain, product sales, results of operations or financial condition. We might not be able to predict or respond to all impacts on a timely basis to prevent near- or long-term adverse impacts to our results. The ultimate impact of these disruptions also depends on events beyond our knowledge or control, including the duration and severity of the COVID-19 and other outbreaks and actions taken by parties other than us to respond to them. Any of these disruptions could have a negative impact on our business operations, financial performance and results of operations, which impact could be material. Additionally, COVID-19 may also materially adversely affect our operating results and financial position in a manner that is not currently known to us or that we do not currently consider to present significant risks to our operations.
We operate in a highly competitive industry and we face risks related to the execution of our strategy and our timely response to channel shifts and pricing and other competitive pressures.
The food and snacking industry is highly competitive. Our principal competitors include food, snack and beverage companies that operate in multiple geographic areas and numerous local and regional companies. Failure to effectively respond to challenges from our competitors could adversely affect our business.
Competitor and customer pressures require that we timely and effectively respond to changes in distribution channels and technological developments that may require changes in our prices. These pressures could affect our ability to increase prices in response to commodity and other cost increases. Failure to effectively and timely assess new or developing trends, technological advancements or changes in distribution methods and set proper pricing or effective trade incentives will negatively impact our operating results, achievement of our strategic and financial goals and our ability to capitalize on new revenue or value-producing opportunities. The rapid growth of some channels, in particular in e-commerce which has expanded significantly following the outbreak of COVID-19, may impact our current operations or strategies more quickly than we planned for, create consumer price deflation, alter the buying behavior of consumers or disrupt our retail customer relationships. We may need to increase or reallocate spending on existing and new distribution channels and technologies, marketing, advertising and new product innovation to protect or increase revenues, market shar
Showing the first 8K of 69K characters. Open the full section
Item 1B. Unresolved Staff Comments.
Item 2. Properties.
On December 31, 2020, we had approximately 133 manufacturing and processing facilities in 45 countries and 111 distribution centers and depots worldwide that we owned or leased. During 2020, the number of manufacturing facilities increased by 7 and the number of distribution facilities increased by 1 due in part to our acquisition of Give & Go in 2020. In addition to our owned or leased properties, we also utilize a highly distributed network of warehouses and distribution centers that are owned or leased by third party logistics partners, contract manufacturers, co-packers or other strategic partners. We believe we have or will add sufficient capacity to meet our planned operating needs. It is our practice to maintain all of our plants and other facilities in good condition.
| As of December 31, 2020 | |||||||||||
| Number of Manufacturing Facilities | Number of Distribution Facilities | ||||||||||
| Latin America (1) | 12 | 12 | |||||||||
| AMEA | 43 | 31 | |||||||||
| Europe | 55 | 8 | |||||||||
| North America | 23 | 60 | |||||||||
| Total | 133 | 111 | |||||||||
| Owned | 116 | 14 | |||||||||
| Leased | 17 | 97 | |||||||||
| Total | 133 | 111 |
(1)Excludes our deconsolidated Venezuela operations. Refer to Note 1, Summary of Significant Accounting Policies, for more information.
Item 3. Legal Proceedings.
Information regarding legal proceedings is available in Note 14, Commitments and Contingencies, to the consolidated financial statements in this report.
Item 4. Mine Safety Disclosures.
Item 5. Market for Registrant’s Common Equity, Related Stockholder Matters and Issuer Purchases of Equity Securities.
We are proud members of the Standard and Poor's 500 and Nasdaq 100. Our Common Stock is listed on The Nasdaq Global Select Market under the symbol “MDLZ.” At January 29, 2021, there were 43,367 holders of record of our Common Stock.
Comparison of Five-Year Cumulative Total Return
The following graph compares the cumulative total return on our Common Stock with the cumulative total return of the S&P 500 Index and the Mondelēz International performance peer group index. The graph assumes, in each case, that an initial investment of $100 is made at the beginning of the five-year period. The cumulative total return reflects market prices at the end of each year and the reinvestment of dividends each year.

| As of December 31, | Mondelēz International | S&P 500 | Performance Peer Group | |||||||||||||||||
| 2015 | $ | 100.00 | $ | 100.00 | $ | 100.00 | ||||||||||||||
| 2016 | 100.57 | 111.96 | 104.70 | |||||||||||||||||
| 2017 | 98.98 | 136.40 | 121.55 | |||||||||||||||||
| 2018 | 94.75 | 130.42 | 114.36 | |||||||||||||||||
| 2019 | 133.06 | 171.49 | 145.00 | |||||||||||||||||
| 2020 | 144.48 | 203.04 | 158.62 |
The Mondelēz International performance peer group consists of the following companies considered our market competitors or that have been selected on the basis of industry, global focus or industry leadership: Campbell Soup Company, The Coca-Cola Company, Colgate-Palmolive Company, Danone S.A., General Mills, Inc., The Hershey Company, Kellogg Company, The Kraft Heinz Company, Nestlé S.A., PepsiCo, Inc., The Procter & Gamble Company and Unilever PLC. The Kraft Heinz Company performance history is included for 2016 through 2020 only as the company was formed in 2015.
Issuer Purchases of Equity Securities
Our stock repurchase activity for each of the three months in the quarter ended December 31, 2020 was:
| Period | Total Number of Shares Purchased (1) | Average Price Paid per Share (1) | Total Number of Shares Purchased as Part of Publicly Announced Plans or Programs (2) | Approximate Dollar Value of Shares That May Yet Be Purchased Under the Plans or Programs (2) | ||||||||||||||||||||||
| October 1-31, 2020 | 60,320 | $ | 57.57 | — | $ | 2,450 | ||||||||||||||||||||
| November 1-30, 2020 | 5,488,346 | 57.92 | 5,454,165 | 2,138 | ||||||||||||||||||||||
| December 1-31, 2020 | 6,704,171 | 57.90 | 6,699,294 | 5,750 | ||||||||||||||||||||||
| For the Quarter Ended December 31, 2020 | 12,252,837 | 57.71 | 12,153,459 |
(1)The total number of shares purchased (and the average price paid per share) reflects: (i) shares purchased pursuant to the repurchase program described in (2) below; and (ii) shares tendered to us by employees who used shares to exercise options and to pay the related taxes for grants of deferred stock units that vested, totaling 60,320 shares, 34,181 shares and 4,877 shares for the fiscal months of October, November and December 2020, respectively.
(2)Dollar values stated in millions. Our Board of Directors has authorized the repurchase of $23.7 billion of our Common Stock through December 31, 2023. Authorizations to increase and extend the program duration included: $4.0 billion on December 2, 2020, $6.0 billion on January 31, 2018, $6.0 billion on July 29, 2015, $1.7 billion on December 3, 2013, $6.0 billion on August 6, 2013 (cumulatively including amounts authorized on March 12, 2013) and the lesser of 40 million shares and $1.2 billion on March 12, 2013. Since the program inception on March 12, 2013 through December 31, 2020, we have repurchased $17.9 billion, and as of December 31, 2020, we had $5.8 billion share repurchase authorization remaining. See related information in Note 13, Capital Stock and in Management's Discussion and Analysis of Financial Condition and Results of Operations – Equity and Dividends.
Item 6. Selected Financial Data
Mondelēz International, Inc.
Selected Financial Data – Five Year Review (1)
| 2020 | 2019 | 2018 | 2017 | 2016 | |||||||||||||||||||||||||
| (in millions, except per share and employee data) | |||||||||||||||||||||||||||||
| Continuing Operations (2) | |||||||||||||||||||||||||||||
| Net revenues | $ | 26,581 | $ | 25,868 | $ | 25,938 | $ | 25,896 | $ | 25,923 | |||||||||||||||||||
| Earnings from continuing operations, net of taxes | 3,569 | 3,944 | 3,331 | 2,813 | 1,683 | ||||||||||||||||||||||||
| Net earnings attributable to Mondelēz International | 3,555 | 3,929 | 3,317 | 2,799 | 1,673 | ||||||||||||||||||||||||
| Per share, basic | 2.48 | 2.72 | 2.25 | 1.85 | 1.08 | ||||||||||||||||||||||||
| Per share, diluted | 2.47 | 2.69 | 2.23 | 1.83 | 1.06 | ||||||||||||||||||||||||
| Cash Flow and Financial Position (3) | |||||||||||||||||||||||||||||
| Net cash provided by operating activities | 3,964 | 3,965 | 3,948 | 2,593 | 2,838 | ||||||||||||||||||||||||
| Capital expenditures | 863 | 925 | 1,095 | 1,014 | 1,224 | ||||||||||||||||||||||||
| Property, plant and equipment, net | 9,026 | 8,733 | 8,482 | 8,677 | 8,229 | ||||||||||||||||||||||||
| Total assets | 67,810 | 64,515 | 62,618 | 62,907 | 61,460 | ||||||||||||||||||||||||
| Long-term debt | 17,276 | 14,207 | 12,532 | 12,972 | 13,217 | ||||||||||||||||||||||||
| Total Mondelēz International shareholders’ equity | $ | 27,578 | $ | 27,241 | $ | 25,526 | $ | 25,945 | $ | 25,096 | |||||||||||||||||||
| Shares outstanding at year end (4) | 1,419 | 1,435 | 1,451 | 1,488 | 1,528 | ||||||||||||||||||||||||
| Per Share and Other Data | |||||||||||||||||||||||||||||
| Book value per shares outstanding | $ | 19.43 | $ | 18.98 | $ | 17.59 | $ | 17.44 | $ | 16.42 | |||||||||||||||||||
| Dividends declared per share (5) | $ | 1.20 | $ | 1.09 | $ | 0.96 | $ | 0.82 | $ | 0.72 | |||||||||||||||||||
| Common Stock closing price at year end | $ | 58.47 | $ | 55.08 | $ | 40.03 | $ | 42.80 | $ | 44.33 | |||||||||||||||||||
| Number of employees | 79,000 | 80,000 | 80,000 | 83,000 | 90,000 |
(1)The selected financial data should be read in conjunction with Management’s Discussion and Analysis of Financial Condition and Results of Operations and our consolidated financial statements and related notes included elsewhere in this Annual Report on Form 10-K and Annual Reports on Form 10-K for earlier periods. During 2020, we moved to a quarter lag for recording Jacobs Douwe Egberts ("JDE") and JDE Peet's N.V. ("JDE Peet's") results and we recast all prior periods since the inception of our investment in JDE in 2015 on the same quarter lag basis. Please see Note 7, Equity Method Investments, for more information. During 2018, we adopted the new revenue recognition accounting standard update, and it did not have a material impact on any reported periods. During 2019, we adopted the new lease accounting standard and related updates. Please also refer to our previously filed Annual Reports on Form 10-K for additional information. A significant portion of our business is exposed to currency exchange rate fluctuation as a large portion of our assets, liabilities, revenue and expenses must be translated into U.S. dollars for reporting purposes. Refer to Management’s Discussion and Analysis of Financial Condition and Results of Operations for a discussion of operating results on a constant currency basis where noted.
(2)Significant items impacting the comparability of our results from continuing operations include: the Simplify to Grow Program; costs associated with JDE Peet's transaction in 2020, gain/loss on equity method investment transactions in 2016-2020; other divestitures and sales of property in 2016-2020; acquisitions in 2016 and 2018-2020; losses on debt extinguishment in 2016-2018 and 2020; debt tender offers completed in 2016, 2018 and 2020; the remeasurement of net monetary position in Argentina in 2018-2020; impairment charges related to intangible assets in 2016-2020; losses or gains related to interest rate swaps in 2016 and 2018-2020; impacts from the resolution of tax matters in 2017-2018; impacts from pension participation changes in 2018-2020; CEO transition remuneration in 2017-2019; malware incident incremental expenses in 2017; and our provision for income taxes in all years, including the U.S. tax reform discrete net tax benefits or expenses in primarily 2017-2018 and Swiss tax reform net impacts in 2019. Please refer to Note 1, Summary of Significant Accounting Policies; Note 2, Acquisitions and Divestitures; Note 5, Leases; Note 6, Goodwill and Intangible Assets; Note 7, Equity Method Investments; Note 8, Restructuring Program; Note 9, Debt and Borrowing Arrangements; Note 10, Financial Instruments; Note 11, Benefit Plans; Note 14, Commitments and Contingencies; Note 16, Income Taxes; and Note 18, Segment Reporting, and our Annual Reports on Form 10-K for earlier periods for additional information regarding items affecting comparability of our results from continuing operations.
(3)Items impacting comparability primarily relate to and acquisitions and divestitures during 2016-2020 and the Keurig and JDE coffee business transactions in 2016. Please refer to Note 2, Acquisitions and Divestitures, and our previously filed Annual Reports on Form 10-K for additional information.
(4)Refer to Note 13, Capital Stock, for additional information on our share repurchase program activity.
(5)Refer to the Equity and Dividends section within Management’s Discussion and Analysis of Financial Condition and Results of Operations for information on our dividends.
Item 7. Management’s Discussion and Analysis of Financial Condition and Results of Operations.
The following discussion and analysis contains forward-looking statements. It should be read in conjunction with the other sections of this Annual Report on Form 10-K, including the consolidated financial statements and related notes contained in Forward-Looking Statements and Item 1A, Risk Factors.
Overview of Business and Strategy
We make and sell primarily snacks, including biscuits (cookies, crackers and salted snacks), chocolate, gum & candy, as well as various cheese & grocery and powdered beverage products around the world.
We aim to be the global leader in snacking. Our strategy is to drive long-term growth by focusing on three strategic priorities: accelerating consumer-centric growth, driving operational excellence and creating a winning growth culture. We believe the successful implementation of our strategic priorities and leveraging of our strong foundation of iconic global and local brands, an attractive global footprint, our market leadership in developed and emerging markets, our deep innovation, marketing and distribution capabilities, and our efficiency and sustainability efforts, will drive top- and bottom-line growth, enabling us to continue to create long-term value for our shareholders.
For more detailed information on our business and strategy, refer to Item 1, Business.
Recent Developments and Significant Items Affecting Comparability
COVID-19
We have been actively monitoring the outbreak of COVID-19 and its impact globally. Our highest priorities continue to be the safety of our employees and working with our employees and network of suppliers and customers to help maintain the global food supply chain.
During 2020, we experienced a significant increase in demand and revenue growth in certain markets as consumers increased their food purchases for in-home consumption. Results were particularly strong in modern trade (such as large grocery supermarkets and retail chains) and e-commerce, and especially for categories such as biscuits. Other parts of our business were negatively affected by mandated lockdowns and other related restrictions including some of our emerging markets with a greater concentration of traditional trade (such as small family-run stores) as well as our world travel retail (such as international duty-free stores) and foodservice businesses. During the second quarter especially, lockdowns and other related measures or restrictions had a negative impact on emerging markets with a greater concentration of traditional trade due to store closures (particularly in our Latin America region as well as parts of our AMEA region) as well as in categories like gum and candy, which are more traditionally purchased and consumed out of home. In the second half of the year, demand grew in both developed and emerging markets as the negative impacts of COVID-19 during the second quarter subsided and a number of our key markets returned to higher growth. A sharp reduction in global travel continues to negatively impact our world travel retail business, and lower out-of-home consumption continues to negatively impact our foodservice business as well as sales of our gum and candy products. During 2020, we also experienced temporary disruptions in operations in some of our emerging markets that were not material to our consolidated results. We discuss these and other impacts of COVID-19 below.
Our Employees, Customers and Communities
We have taken a number of actions to promote the health and safety of our employees, customers and consumers, which is our first priority:
-
We implemented enhanced protocols to provide a safe and sanitary working environment for our employees. In many locations, our employees are working remotely whenever possible. For employees who are unable to work remotely, we have adopted a number of heightened protocols, consistent with those prescribed by the World Health Organization, related to social distancing (including staggering lunchtimes and shifts where possible and restricting in-person gatherings and non-essential travel) and enhanced hygiene and workplace sanitation. At a local level, we have also provided additional flexibility and support to employees in our manufacturing facilities, distribution and logistics operations and sales organization.
-
We have been hiring frontline employees in the U.S. and other locations to meet additional marketplace demand and promote uninterrupted functioning of our manufacturing, distribution and sales network.
- We increased our $15 million global commitment to assist those most impacted by COVID-19 to approximately $28 million to date. We have been supporting local and global organizations that are responding to food instability and providing emergency relief.
Our Supply Chain and Operations
We operate in the food and beverages industry and are part of the global food supply chain. One of our main objectives during the pandemic is to maintain the availability of our products to meet the needs of our consumers. In response to increased demand, we have increased production and, to date, we have not experienced material disruptions in our supply chain or operations:
-
We were able to leverage learnings from our timely response to the initial outbreak in China, and we put in place procedures across our supply chain to help mitigate the risk that our manufacturing sites will experience material closures or disruptions.
-
We have been able to continue to source raw ingredients, packaging, energy and transportation and deliver our products to our customers.
-
We have not experienced material disruptions in our workforce; however, mandatory and voluntary stay-at-home restrictions have resulted in increased levels of absenteeism.
-
Commodity costs have become more volatile due to the COVID-19 outbreak. Although we monitor our exposure to commodity prices and hedge against input price increases, we cannot fully hedge against changes in commodity costs, and our hedging strategies may not protect us from increases in specific raw material costs. We anticipate continued commodity cost volatility as the pandemic continues.
-
We have experienced temporary disruptions in operations in some of our emerging markets. The disruptions were not material to our consolidated results for 2020. In the future, the ongoing COVID-19 outbreak could disrupt our global supply chain, operations and routes to market or those of our suppliers, their suppliers, or our co-manufacturers or distributors. These disruptions or our failure to effectively respond to them could increase product or distribution costs, prices and potentially affect the availability of our products.
-
Our 2020 net revenue and net earnings in U.S. dollars were negatively affected by currency translation losses from a generally stronger U.S. dollar relative to other currencies in the countries in which we operate.
-
During the second quarter of 2020, we incurred higher operating costs primarily for labor, customer service and logistics, security, personal protective equipment and cleaning. In the second half of 2020, our spending in these areas was significantly less but still above pre-COVID levels. We continued to incur higher costs in these areas in response to the ongoing pandemic as we worked to protect our employees and deliver our products timely and safely to our customers. Most other aspects of our global supply chain and operations did not change materially during 2020. While we have not had material disruptions to date, we do not know whether or how our supply chain or operations may be negatively affected if the pandemic persists for an extended period or worsens. As we respond to this evolving situation, we intend to continue to execute on our strategic operating plans. However, disruptions, higher operating costs or uncertainties like those noted above could result i
Showing the first 8K of 175K characters. Open the full section
Item 7A. Quantitative and Qualitative Disclosures about Market Risk.
As we operate globally, we are primarily exposed to currency exchange rate, commodity price and interest rate market risks. We monitor and manage these exposures as part of our overall risk management program. Our risk management program focuses on the unpredictability of financial markets and seeks to reduce the potentially adverse effects that the volatility of these markets may have on our operating results.
During 2020, the COVID-19 pandemic and related global response significantly impacted economic activity and markets around the world. National and local governments imposed preventative or protective restrictions on travel and business operations and advised or required citizens to remain at home. Temporary closures of businesses were ordered and numerous other businesses temporarily closed voluntarily. The impact of the global pandemic and response has had a material unfavorable impact on global markets, including commodity, currency and capital markets. While some of these markets such as the U.S. and other major stock markets and certain currencies have rebounded significantly in the second and third quarters of 2020, these markets are likely to continue to remain volatile while the situation continues. An economic or credit crisis could occur and impair credit availability and our ability to raise capital when needed. A disruption in the financial markets may have a negative effect on our derivative counterparties and could impair our banking or other business partners, on whom we rely for access to capital and as counterparties for a number of our derivative contracts. We are actively working to mitigate these risks and we largely employed existing strategies that are described below to mitigate these market risks related to currency, commodity and interest rate risks.
We principally utilize derivative instruments to reduce significant, unanticipated earnings fluctuations that may arise from volatility in currency exchange rates, commodity prices and interest rates. For additional information on our derivative activity and the types of derivative instruments we use to hedge our currency exchange, commodity price and interest rate exposures, see Note 10, Financial Instruments.
Many of our non-U.S. subsidiaries operate in functional currencies other than the U.S. dollar. Fluctuations in currency exchange rates create volatility in our reported results as we translate the balance sheets, operating results and cash flows of these subsidiaries into the U.S. dollar for consolidated reporting purposes. The translation of non-U.S. dollar denominated balance sheets and statements of earnings of our subsidiaries into the U.S. dollar for consolidated reporting generally results in a cumulative translation adjustment to other comprehensive income within equity. A stronger U.S. dollar relative to other functional currencies adversely affects our consolidated earnings and net assets while a weaker U.S. dollar benefits our consolidated earnings and net assets. While we hedge significant forecasted currency exchange transactions as well as certain net assets of non-U.S. operations and other currency impacts, we cannot fully predict or eliminate volatility arising from changes in currency exchange rates on our consolidated financial results. See Consolidated Results of Operations and Results of Operations by Operating Segment under Discussion and Analysis of Historical Results for currency exchange effects on our financial results. Throughout our discussion and analysis of results, we isolate currency impacts and supplementally provide net revenues, operating income and diluted earnings per share on a constant currency basis. For additional information on the impact of currency policies, recent currency devaluations and highly inflationary accounting on our financial condition and results of operations, also see Note 1, Summary of Significant Accounting Policies – Currency Translation and Highly Inflationary Accounting.
We also continually monitor the market for commodities that we use in our products. Input costs may fluctuate widely due to international demand, weather conditions, government policy and regulation and unforeseen conditions such as the current COVID-19 pandemic. To manage input cost volatility, we enter into forward purchase agreements and other derivative financial instruments. We also pursue productivity and cost saving measures and take pricing actions when necessary to mitigate the impact of higher input costs on earnings.
We regularly evaluate our variable and fixed-rate debt as well as current and expected interest rates in the markets in which we raise capital. Our primary exposures include movements in U.S. Treasury rates, corporate credit spreads, commercial paper rates as well as limited debt tied to London Interbank Offered Rates (“LIBOR”). The Financial Conduct Authority in the United Kingdom plans to phase out LIBOR by the end of 2021. We do not anticipate a significant impact to our financial position from the planned phase out of LIBOR given our current mix of variable and fixed-rate debt. We periodically use interest rate swaps and forward interest rate contracts to achieve a desired proportion of variable versus fixed rate debt based on current and projected market conditions. For more information on our 2020 debt activity, see Note 9, Debt and Borrowing Arrangements.
See Note 10, Financial Instruments, for more information on our derivative activity.
Value at Risk:
We use a value at risk (“VAR”) computation to estimate: 1) the potential one-day loss in the fair value of our interest rate-sensitive financial instruments; and 2) the potential one-day loss in pre-tax earnings of our currency and commodity price-sensitive derivative financial instruments. The VAR analysis was done separately for our currency exchange, fixed income and commodity risk portfolios as of each quarter end during the periods presented below. The instruments included in the VAR computation were currency exchange forwards and options for currency exchange risk, debt and swaps for interest rate risk, and commodity forwards, futures and options for commodity risk. Excluded from the computation were anticipated transactions, currency trade payables and receivables, and net investments in non-U.S. subsidiaries, which the above-mentioned instruments are intended to hedge.
The VAR model assumes normal market conditions, a 95% confidence interval and a one-day holding period. A parametric delta-gamma approximation technique was used to determine the expected return distribution in interest rates, currencies and commodity prices for the purpose of calculating the fixed income, currency exchange and commodity VAR, respectively. The parameters used for estimating the expected return distributions were determined by observing interest rate, currency exchange and commodity price movements over the prior quarter for the calculation of VAR amounts at December 31, 2020 and 2019, and over each of the four prior quarters for the calculation of average VAR amounts during each year. The values of currency and commodity options do not change on a one-to-one basis with the underlying currency or commodity and were valued accordingly in the VAR computation.
As of December 31, 2020 and December 31, 2019, the estimated potential one-day loss in fair value of our interest rate-sensitive instruments, primarily debt, and the estimated potential one-day loss in pre-tax earnings from our currency and commodity instruments, as calculated in the VAR model, were:
| Pre-Tax Earnings Impact | Fair Value Impact | ||||||||||||||||||||||||||||||||||||||||||||||
| At 12/31/20 | Average | High | Low | At 12/31/20 | Average | High | Low | ||||||||||||||||||||||||||||||||||||||||
| (in millions) | |||||||||||||||||||||||||||||||||||||||||||||||
| Instruments sensitive to: | |||||||||||||||||||||||||||||||||||||||||||||||
| Interest rates | $ | 91 | $ | 142 | $ | 308 | $ | 76 | |||||||||||||||||||||||||||||||||||||||
| Foreign currency rates | $ | 16 | $ | 20 | $ | 31 | $ | 16 | |||||||||||||||||||||||||||||||||||||||
| Commodity prices | 6 | 25 | 42 | 6 | |||||||||||||||||||||||||||||||||||||||||||
| Pre-Tax Earnings Impact | Fair Value Impact | ||||||||||||||||||||||||||||||||||||||||||||||
| At 12/31/19 | Average | High | Low | At 12/31/19 | Average | High | Low | ||||||||||||||||||||||||||||||||||||||||
| (in millions) | |||||||||||||||||||||||||||||||||||||||||||||||
| Instruments sensitive to: | |||||||||||||||||||||||||||||||||||||||||||||||
| Interest rates | $ | 86 | $ | 70 | $ | 97 | $ | 49 | |||||||||||||||||||||||||||||||||||||||
| Foreign currency rates | $ | 15 | $ | 19 | $ | 25 | $ | 15 | |||||||||||||||||||||||||||||||||||||||
| Commodity prices | 11 | 13 | 14 | 11 |
This VAR computation is a risk analysis tool designed to statistically estimate the maximum expected daily loss, under the specified confidence interval and assuming normal market conditions, from adverse movements in interest rates, currency exchange rates and commodity prices. The computation does not represent actual losses in fair value or earnings we will incur, nor does it consider the effect of favorable changes in market rates. We cannot predict actual future movements in market rates and do not present these VAR results to be indicative of future movements in market rates or to be representative of any actual impact that future changes in market rates may have on our future financial results.
Item 8. Financial Statements and Supplementary Data.
Report of Independent Registered Public Accounting Firm
To the Board of Directors and Shareholders of Mondelēz International, Inc.
Opinions on the Financial Statements and Internal Control over Financial Reporting
We have audited the accompanying consolidated balance sheets of Mondelēz International, Inc. and its subsidiaries (the “Company”) as of December 31, 2020 and 2019, and the related consolidated statements of earnings, comprehensive earnings, equity and cash flows for each of the three years in the period ended December 31, 2020, including the related notes and financial statement schedule for each of the three years in the period ended December 31, 2020 listed in the index appearing under Item 15(a) (collectively referred to as the “consolidated financial statements”). We also have audited the Company's internal control over financial reporting as of December 31, 2020, based on criteria established in Internal Control - Integrated Framework (2013) issued by the Committee of Sponsoring Organizations of the Treadway Commission (COSO).
In our opinion, the consolidated financial statements referred to above present fairly, in all material respects, the financial position of the Company as of December 31, 2020 and 2019**,** and the results of its operations and its cash flows for each of the three years in the period ended December 31, 2020 in conformity with accounting principles generally accepted in the United States of America. Also in our opinion, the Company maintained, in all material respects, effective internal control over financial reporting as of December 31, 2020, based on criteria established in Internal Control - Integrated Framework (2013) issued by the COSO.
Changes in Accounting Principles
As discussed in Note 1 to the consolidated financial statements, the Company changed the manner in which it accounts for a certain equity method investment in 2020 and the manner in which it accounts for leases in 2019.
Basis for Opinions
The Company's management is responsible for these consolidated financial statements, for maintaining effective internal control over financial reporting, and for its assessment of the effectiveness of internal control over financial reporting, included in the Report of Management on Internal Control Over Financial Reporting appearing under Item 9A. Our responsibility is to express opinions on the Company’s consolidated financial statements and on the Company's internal control over financial reporting based on our audits. We are a public accounting firm registered with the Public Company Accounting Oversight Board (United States) (PCAOB) and are required to be independent with respect to the Company in accordance with the U.S. federal securities laws and the applicable rules and regulations of the Securities and Exchange Commission and the PCAOB.
We conducted our audits in accordance with the standards of the PCAOB. Those standards require that we plan and perform the audits to obtain reasonable assurance about whether the consolidated financial statements are free of material misstatement, whether due to error or fraud, and whether effective internal control over financial reporting was maintained in all material respects.
Our audits of the consolidated financial statements included performing procedures to assess the risks of material misstatement of the consolidated financial statements, whether due to error or fraud, and performing procedures that respond to those risks. Such procedures included examining, on a test basis, evidence regarding the amounts and disclosures in the consolidated financial statements. Our audits also included evaluating the accounting principles used and significant estimates made by management, as well as evaluating the overall presentation of the consolidated financial statements. Our audit of internal control over financial reporting included obtaining an understanding of internal control over financial reporting, assessing the risk that a material weakness exists, and testing and evaluating the design and operating effectiveness of internal control based on the assessed risk. Our audits also included performing such other procedures as we considered necessary in the circumstances. We believe that our audits provide a reasonable basis for our opinions.
As described in the Report of Management on Internal Control Over Financial Reporting appearing under Item 9A, management has excluded Give & Go from its assessment of internal control over financial reporting as of December 31, 2020 because it was acquired by the Company in a purchase business combination during 2020. We
have also excluded Give & Go from our audit of internal control over financial reporting. Give & Go is a majority-owned subsidiary whose total assets and total revenues excluded from management’s assessment and our audit of internal control over financial reporting represent 0.4% and 1%, respectively, of the related consolidated financial statement amounts as of and for the year ended December 31, 2020.
Definition and Limitations of Internal Control over Financial Reporting
A company’s internal control over financial reporting is a process designed to provide reasonable assurance regarding the reliability of financial reporting and the preparation of financial statements for external purposes in accordance with generally accepted accounting principles. A company’s internal control over financial reporting includes those policies and procedures that (i) pertain to the maintenance of records that, in reasonable detail, accurately and fairly reflect the transactions and dispositions of the assets of the company; (ii) provide reasonable assurance that transactions are recorded as necessary to permit preparation of financial statements in accordance with generally accepted accounting principles, and that receipts and expenditures of the company are being made only in accordance with authorizations of management and directors of the company; and (iii) provide reasonable assurance regarding prevention or timely detection of unauthorized acquisition, use, or disposition of the company’s assets that could have a material effect on the financial statements.
Because of its inherent limitations, internal control over financial reporting may not prevent or detect misstatements. Also, projections of any evaluation of effectiveness to future periods are subject to the risk that controls may become inadequate because of changes in conditions, or that the degree of compliance with the policies or procedures may deteriorate.
Critical Audit Matters
The critical audit matter communicated below is a matter arising from the current period audit of the consolidated financial statements that was communicated or required to be communicated to the audit committee and that (i) relates to accounts or disclosures that are material to the consolidated financial statements and (ii) involved our especially challenging, subjective, or complex judgments. The communication of critical audit matters does not alter in any way our opinion on the consolidated financial statements, taken as a whole, and we are not, by communicating the critical audit matter below, providing a separate opinion on the critical audit matter or on the accounts or disclosures to which it relates.
Indefinite-Life Intangible Assets Impairment Assessment
As described in Notes 1 and 6 to the consolidated financial statements, the Company’s consolidated indefinite-life intangible asset balance was $17.5 billion as of December 31, 2020. At least annually management assesses indefinite-life intangible assets for impairment by performing a qualitative review and assessing events and circumstances that could affect the fair value or carrying value of the indefinite-life intangible assets. If significant potential impairment risk exists
Showing the first 8K of 259K characters. Open the full section
Item 9. Changes in and Disagreements with Accountants on Accounting and Financial Disclosure.
None.
Item 9A. Controls and Procedures.
Evaluation of Disclosure Controls and Procedures
We have established disclosure controls and procedures that are designed to ensure that information required to be disclosed in our reports filed or submitted under the Exchange Act is recorded, processed, summarized and reported within the time periods specified in the rules and forms of the SEC, and such information is accumulated and communicated to our management, including our Chief Executive Officer (“CEO”) and Chief Financial Officer (“CFO”), as appropriate to allow timely decisions regarding required disclosure. Management, together with our CEO and CFO, evaluated the effectiveness of the Company’s disclosure controls and procedures as of December 31, 2020. Based on this evaluation, the CEO and CFO concluded that our disclosure controls and procedures were effective as of December 31, 2020.
Report of Management on Internal Control Over Financial Reporting
Management is responsible for establishing and maintaining adequate internal control over financial reporting as defined in Rules 13a-15(f) and 15d-15(f) under the Exchange Act. Our internal control over financial reporting is a process designed by, or under the supervision of, our CEO and CFO, or persons performing similar functions, and effected by the Company’s Board of Directors, management and other personnel to provide reasonable assurance regarding the reliability of financial reporting and the preparation of financial statements for external purposes in accordance with generally accepted accounting principles. Our internal control over financial reporting includes those written policies and procedures that:
-
pertain to the maintenance of records that, in reasonable detail, accurately and fairly reflect the transactions and dispositions of assets;
-
provide reasonable assurance that transactions are recorded as necessary to permit preparation of financial statements in accordance with generally accepted accounting principles;
-
provide reasonable assurance that receipts and expenditures are being made only in accordance with management and director authorization; and
-
provide reasonable assurance regarding prevention or timely detection of unauthorized acquisition, use or disposition of assets that could have a material effect on the consolidated financial statements.
Because of its inherent limitations, internal control over financial reporting may not prevent or detect misstatements. Also, projections of any evaluation of effectiveness to future periods are subject to the risk that controls may become inadequate because of changes in conditions, or that the degree of compliance with the policies or procedures may deteriorate.
Management assessed the effectiveness of our internal control over financial reporting as of December 31, 2020. Management based this assessment on criteria for effective internal control over financial reporting described in Internal Control Integrated Framework (2013) issued by the Committee of Sponsoring Organizations of the Treadway Commission (“COSO”). The scope of Management’s assessment of internal control over financial reporting excludes 0.4% of the Company’s consolidated total assets and 1% of the Company’s consolidated net revenues related to Give & Go, which was acquired on April 1, 2020.
Based on this assessment, management concluded that the Company’s internal control over financial reporting is effective as of December 31, 2020, based on the criteria in Internal Control Integrated Framework issued by the COSO.
PricewaterhouseCoopers LLP, an independent registered public accounting firm, has audited the effectiveness of our internal control over financial reporting as of December 31, 2020, as stated in their report that appears under Item 8.
February 5, 2021
Changes in Internal Control Over Financial Reporting
Management, together with our CEO and CFO, evaluated the changes in our internal control over financial reporting during the quarter ended December 31, 2020. Many of our employees and those of our outsourcing partners and other accounting service providers continued to work remotely as a significant number of our and their offices were closed in response to the COVID-19 outbreak. There were no changes in our internal control over financial reporting during the quarter ended December 31, 2020, that have materially affected, or are reasonably likely to materially affect, our internal control over financial reporting.
Item 9B. Other Information.
Item 10. Directors, Executive Officers and Corporate Governance.
Information required by this Item 10 is included under the heading “Information about our Executive Officers” in Part I, Item 1 of this Form 10-K, as well as under the headings “Election of Directors,” “Corporate Governance – Governance Guidelines,” “Corporate Governance – Codes of Conduct,” “Board Committees and Membership – Audit Committee” and if applicable, "Delinquent Section 16(a) Reports" in our definitive Proxy Statement for our Annual Meeting of Shareholders scheduled to be held on May 19, 2021 (“2021 Proxy Statement”). All of this information from the 2021 Proxy Statement is incorporated by reference into this Annual Report.
The information on our web site is not, and shall not be deemed to be, a part of this Annual Report or incorporated into any other filings we make with the SEC.
Item 11. Executive Compensation.
Information required by this Item 11 is included under the headings “Board Committees and Membership – Human Resources and Compensation Committee,” “Compensation of Non-Employee Directors,” “Compensation Discussion and Analysis,” “Executive Compensation Tables,” “Human Resources and Compensation Committee Report for the Year Ended December 31, 2020” and "CEO Pay Ratio" in our 2021 Proxy Statement. All of this information is incorporated by reference into this Annual Report.
Item 12. Security Ownership of Certain Beneficial Owners and Management and Related Stockholder Matters.
The number of shares to be issued upon exercise or vesting of grants issued under, and the number of shares remaining available for future issuance under, our equity compensation plans at December 31, 2020 were:
Equity Compensation Plan Information
| Number of Securities to be Issued Upon Exercise of Outstanding Options, Warrants and Rights (1) | Weighted Average Exercise Price of Outstanding Options, Warrants and Rights (2) | Number of Securities Remaining Available for Future Issuance under Equity Compensation Plans (excluding securities reflected in column (a)) (3) | |||||||||||||||
| (a) | (b) | (c) | |||||||||||||||
| Equity compensation plans approved by security holders | 32,642,113 | $ | 39.51 | 53,167,179 |
(1)Includes outstanding options, deferred stock units and performance share units and excludes restricted stock.
(2)Weighted average exercise price of outstanding options only.
(3)Shares available for grant under our Amended and Restated 2005 Performance Incentive Plan.
Information related to the security ownership of certain beneficial owners and management is included in our 2021 Proxy Statement under the heading “Ownership of Equity Securities” and is incorporated by reference into this Annual Report.
Item 13. Certain Relationships and Related Transactions, and Director Independence.
Information required by this Item 13 is included under the headings “Corporate Governance – Director Independence” and “Corporate Governance – Review of Transactions with Related Persons” in our 2021 Proxy Statement. All of this information is incorporated by reference into this Annual Report.
Item 14. Principal Accountant Fees and Services.
Item 15. Exhibits and Financial Statement Schedules.
*(a)*Index to Consolidated Financial Statements and Schedules
Schedules other than those listed above have been omitted either because such schedules are not required or are not applicable.
*(b)*The following exhibits are filed as part of, or incorporated by reference into, this Annual Report:
| * | Portions of this exhibit (indicated by asterisks) have been omitted pursuant to a request for confidential treatment and have been separately filed with the SEC. | ||||||||||
| + | Indicates a management contract or compensatory plan or arrangement. |
Item 16. Form 10-K Summary
None.
SIGNATURES
Pursuant to the requirements of Section 13 or 15(d) of the Securities Exchange Act of 1934, the registrant has duly caused this report to be signed on its behalf by the undersigned, thereunto duly authorized.
| MONDELĒZ INTERNATIONAL, INC. | ||||||||
| By: | /s/ LUCA ZARAMELLA | |||||||
| Luca Zaramella | ||||||||
| Executive Vice President | ||||||||
| and Chief Financial Officer | ||||||||
| (Duly Authorized Officer) |
Date: February 5, 2021
Pursuant to the requirements of the Securities Exchange Act of 1934, this report has been signed below by the following persons on behalf of the registrant and in the capacities and on the dates indicated:
| Signature | Title | Date | ||||||||||||
| /s/ DIRK VAN DE PUT | Director, Chairman and Chief Executive Officer | February 5, 2021 | ||||||||||||
| (Dirk Van de Put) | ||||||||||||||
| /s/ LUCA ZARAMELLA | Executive Vice President and Chief Financial Officer | February 5, 2021 | ||||||||||||
| (Luca Zaramella) | ||||||||||||||
| /s/ NELSON URDANETA | Senior Vice President, Corporate Controller and Chief Accounting Officer | February 5, 2021 | ||||||||||||
| (Nelson Urdaneta) | ||||||||||||||
| /s/ LEWIS W.K. BOOTH | Director | February 5, 2021 | ||||||||||||
| (Lewis W.K. Booth) | ||||||||||||||
| /s/ CHARLES E. BUNCH | Director | February 5, 2021 | ||||||||||||
| (Charles E. Bunch) | ||||||||||||||
| /s/ DEBRA A. CREW | Director | February 5, 2021 | ||||||||||||
| (Debra A. Crew) | ||||||||||||||
| /s/ LOIS D. JULIBER | Director | February 5, 2021 | ||||||||||||
| (Lois D. Juliber) | ||||||||||||||
| /s/ PETER W. MAY | Director | February 5, 2021 | ||||||||||||
| (Peter W. May) | ||||||||||||||
| /s/ JORGE S. MESQUITA | Director | February 5, 2021 | ||||||||||||
| (Jorge S. Mesquita) | ||||||||||||||
| /s/ FREDRIC G. REYNOLDS | Director | February 5, 2021 | ||||||||||||
| (Fredric G. Reynolds) | ||||||||||||||
| /s/ CHRISTIANA S. SHI | Director | February 5, 2021 | ||||||||||||
| (Christiana S. Shi) | ||||||||||||||
| /s/ PATRICK T. SIEWERT | Director | February 5, 2021 | ||||||||||||
| (Patrick T. Siewert) | ||||||||||||||
| /s/ MICHAEL A. TODMAN | Director | February 5, 2021 | ||||||||||||
| (Michael A. Todman) | ||||||||||||||
| /s/ JEAN-FRANÇOIS M. L. VAN BOXMEER | Director | February 5, 2021 | ||||||||||||
| (Jean-François M. L. van Boxmeer) |
Mondelēz International, Inc. and Subsidiaries
Valuation and Qualifying Accounts
For the Years Ended December 31, 2020, 2019 and 2018
(in millions)
| Col. A | Col. B | Col. C | Col. D | Col. E | ||||||||||||||||||||||||||||
| Additions | ||||||||||||||||||||||||||||||||
| Description | Balance at Beginning of Period | Charged to Costs and Expenses | Charged to Other Accounts | Deductions | Balance at End of Period | |||||||||||||||||||||||||||
| (a) | (b) | |||||||||||||||||||||||||||||||
| 2020: | ||||||||||||||||||||||||||||||||
| Allowance for trade receivables | $ | 35 | $ | 10 | $ | (1) | $ | 2 | $ | 42 | ||||||||||||||||||||||
| Allowance for other current receivables | 44 | 1 | (1) | 2 | 42 | |||||||||||||||||||||||||||
| Allowance for long-term receivables | 14 | 1 | (3) | — | 12 | |||||||||||||||||||||||||||
| Valuation allowance for deferred taxes | 1,243 | 119 | 24 | 109 | 1,277 | |||||||||||||||||||||||||||
| $ | 1,336 | $ | 131 | $ | 19 | $ | 113 | $ | 1,373 | |||||||||||||||||||||||
| 2019: | ||||||||||||||||||||||||||||||||
| Allowance for trade receivables | $ | 40 | $ | 2 | $ | (4) | $ | 3 | $ | 35 | ||||||||||||||||||||||
| Allowance for other current receivables | 47 | (1) | 1 | 3 | 44 | |||||||||||||||||||||||||||
| Allowance for long-term receivables | 24 | — | — | 10 | 14 | |||||||||||||||||||||||||||
| Valuation allowance for deferred taxes | 1,153 | 349 | 1 | 260 | 1,243 | |||||||||||||||||||||||||||
| $ | 1,264 | $ | 350 | $ | (2) | $ | 276 | $ | 1,336 | |||||||||||||||||||||||
| 2018: | ||||||||||||||||||||||||||||||||
| Allowance for trade receivables | $ | 50 | $ | 3 | $ | (6) | $ | 7 | $ | 40 | ||||||||||||||||||||||
| Allowance for other current receivables | 98 | (10) | (24) | 17 | 47 | |||||||||||||||||||||||||||
| Allowance for long-term receivables | 21 | — | 3 | — | 24 | |||||||||||||||||||||||||||
| Valuation allowance for deferred taxes | 853 | 409 | 4 | 113 | 1,153 | |||||||||||||||||||||||||||
| $ | 1,022 | $ | 402 | $ | (23) | $ | 137 | $ | 1,264 |
Notes:
(a)Primarily related to divestitures, acquisitions and currency translation.
(b)Represents charges for which allowances were created.
S-1