 filings.tools
Item 2. Management’s Discussion and Analysis of Financial Condition and Results of Operations
76K characters. Original on sec.gov · Markdown
Item 2. Management’s Discussion and Analysis of Financial Condition and Results of Operations
UNDERSTANDING OUR FINANCIAL INFORMATION
The following discussion and analysis provides information management believes to be relevant to understanding the financial condition and results of operations of Medtronic plc and its subsidiaries (Medtronic plc, Medtronic, or the Company, or we, us, or our). For a full understanding of financial condition and results of operations, you should read this discussion along with Management’s Discussion and Analysis of Financial Condition and Results of Operations in our Annual Report on Form 10-K for the fiscal year ended April 26, 2024. In addition, you should read this discussion along with our consolidated financial statements and related notes thereto at and for the three months ended July 26, 2024. Amounts reported in millions within this quarterly report are computed based on the amounts in thousands, and therefore, the sum of the components may not equal the total amount reported in millions due to rounding. Additionally, certain columns and rows within tables may not sum due to rounding.
Financial Trends
Throughout this Management’s Discussion and Analysis, we present certain financial measures that facilitate management's review of the operational performance of the Company and as a basis for strategic planning; however, such financial measures are not presented in our financial statements prepared in accordance with accounting principles generally accepted in the United States (U.S.) (U.S. GAAP). These financial measures are considered "non-GAAP financial measures" and are intended to supplement, and should not be considered as superior to, financial measures presented in accordance with U.S. GAAP. We believe that non-GAAP financial measures provide information useful to investors in understanding the Company's underlying operational performance and trends and may facilitate comparisons with the performance of other companies in the medical technologies industry.
As presented in the GAAP to Non-GAAP Reconciliations section on the following pages, our non-GAAP financial measures exclude the impact of amortization of intangible assets and certain charges or benefits that contribute to or reduce earnings and that may affect financial trends and include certain charges or benefits that result from transactions or events that we believe may or may not recur with similar materiality or impact to our operations in future periods (Non-GAAP Adjustments).
In the event there is a Non-GAAP Adjustment recognized in our operating results, the tax cost or benefit attributable to that item is separately calculated and reported. Because the effective rate can be significantly impacted by the Non-GAAP Adjustments that take place during the period, we often refer to our tax rate using both the effective rate and the non-GAAP nominal tax rate (Non-GAAP Nominal Tax Rate). The Non-GAAP Nominal Tax Rate is calculated as the income tax provision, adjusted for the impact of Non-GAAP Adjustments, as a percentage of income before income taxes, excluding Non-GAAP Adjustments.
Free cash flow is a non-GAAP financial measure calculated by subtracting property, plant, and equipment additions from operating cash flows.
Refer to the “GAAP to Non-GAAP Reconciliations," "Income Taxes," and "Free Cash Flow" sections for reconciliations of the non-GAAP financial measures to their most directly comparable financial measures prepared in accordance with U.S. GAAP.
EXECUTIVE LEVEL OVERVIEW
Medtronic is the leading global healthcare technology company — alleviating pain, restoring health, and extending life for millions of people around the world. Our primary products include those for cardiac rhythm disorders, cardiovascular disease, advanced and general surgical care, respiratory and monitoring solutions, neurological disorders, spinal conditions and musculoskeletal trauma, urological and digestive disorders, and ear, nose, and throat, and diabetes conditions.
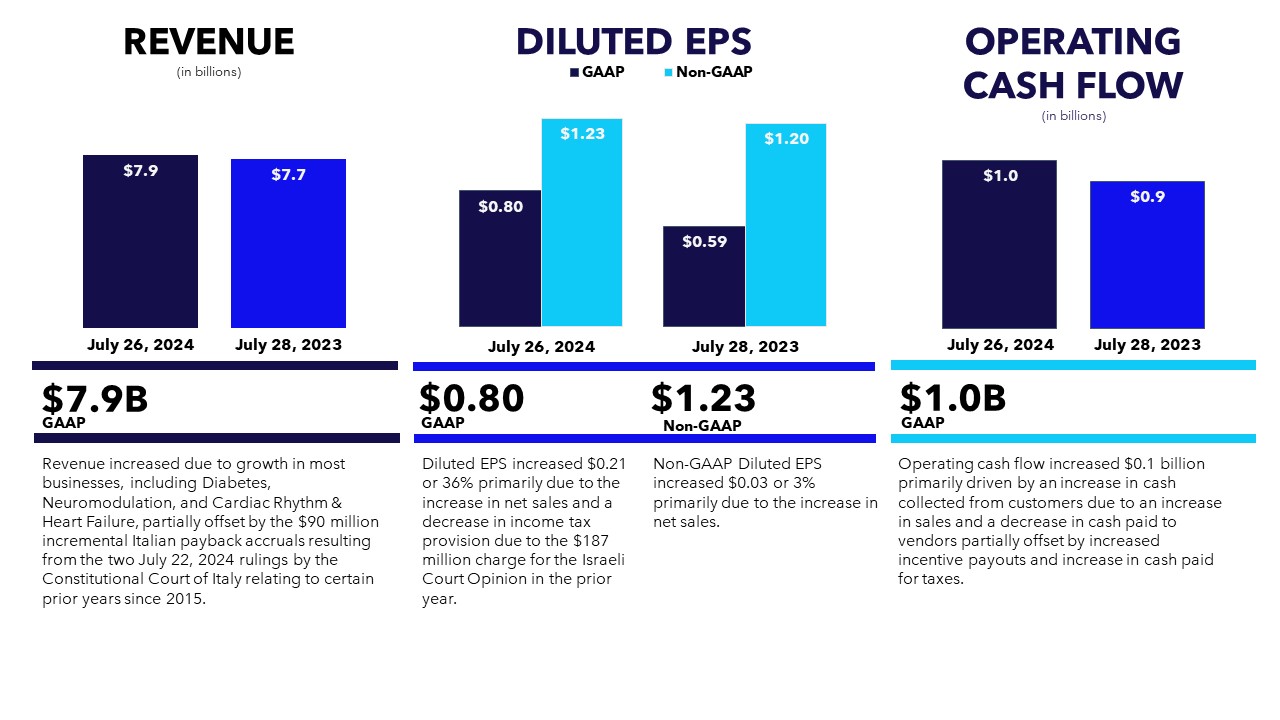
The following is a summary of revenue, diluted earnings per share, and operating cash flow for the three months ended July 26, 2024 and July 28, 2023:
GAAP to Non-GAAP Reconciliations
The tables below present our GAAP to Non-GAAP reconciliations for the three months ended July 26, 2024 and July 28, 2023:
| Three months ended July 26, 2024 | |||||||||||||||||||||||||||||
| (in millions, except per share data) | Income Before Income Taxes | Income Tax Provision (Benefit) | Net Income Attributable to Medtronic | Diluted EPS | Effective Tax Rate | ||||||||||||||||||||||||
| GAAP | $ | 1,268 | $ | 220 | $ | 1,042 | $ | 0.80 | 17.4 | % | |||||||||||||||||||
| Non-GAAP Adjustments: | |||||||||||||||||||||||||||||
| Amortization of intangible assets | 414 | 75 | 340 | 0.26 | 18.1 | ||||||||||||||||||||||||
| Restructuring and associated costs(1) | 62 | 12 | 51 | 0.04 | 19.4 | ||||||||||||||||||||||||
| Acquisition and divestiture-related items(2) | 12 | 1 | 11 | 0.01 | 8.3 | ||||||||||||||||||||||||
| Certain litigation charges, net | 81 | 13 | 68 | 0.05 | 16.0 | ||||||||||||||||||||||||
| (Gain)/loss on minority investments(3) | (17) | — | (17) | (0.01) | — | ||||||||||||||||||||||||
| Medical device regulations(4) | 14 | 3 | 11 | 0.01 | 21.4 | ||||||||||||||||||||||||
| Other(5) | 90 | 20 | 70 | 0.05 | 22.2 | ||||||||||||||||||||||||
| Certain tax adjustments, net | — | (17) | 17 | 0.01 | — | ||||||||||||||||||||||||
| Non-GAAP | $ | 1,925 | $ | 327 | $ | 1,592 | $ | 1.23 | 17.0 | % | |||||||||||||||||||
| Three months ended July 28, 2023 | |||||||||||||||||||||||||||||
| (in millions, except per share data) | Income Before Income Taxes | Income Tax Provision (Benefit) | Net Income Attributable to Medtronic | Diluted EPS | Effective Tax Rate | ||||||||||||||||||||||||
| GAAP | $ | 1,196 | $ | 400 | $ | 791 | $ | 0.59 | 33.4 | % | |||||||||||||||||||
| Non-GAAP Adjustments: | |||||||||||||||||||||||||||||
| Amortization of intangible assets | 429 | 65 | 364 | 0.27 | 15.2 | ||||||||||||||||||||||||
| Restructuring and associated costs(1) | 91 | 15 | 76 | 0.06 | 16.5 | ||||||||||||||||||||||||
| Acquisition and divestiture-related items(2) | 50 | 3 | 46 | 0.03 | 6.0 | ||||||||||||||||||||||||
| Certain litigation charges, net | 40 | 9 | 31 | 0.02 | 22.5 | ||||||||||||||||||||||||
| (Gain)/loss on minority investments(3) | 64 | — | 64 | 0.05 | — | ||||||||||||||||||||||||
| Medical device regulations(4) | 31 | 7 | 25 | 0.02 | 22.6 | ||||||||||||||||||||||||
| Certain tax adjustments, net (6) | — | (198) | 198 | 0.15 | — | ||||||||||||||||||||||||
| Non-GAAP | $ | 1,902 | $ | 300 | $ | 1,596 | $ | 1.20 | 15.8 | % |
(1)Associated and other costs primarily include salaries and wages for employees supporting the restructuring activities, consulting expenses, and asset write-offs.
(2)The charges primarily include business combination costs, changes in fair value of contingent consideration, and exit of business related charges.
(3)We exclude unrealized and realized gains and losses on our minority investments as we do not believe that these components of income or expense have a direct correlation to our ongoing or future business operations.
(4)The charges represent incremental costs of complying with the new European Union (E.U.) medical device regulations for previously registered products and primarily include charges for contractors supporting the project and other direct third-party expenses. We consider these costs to be duplicative of previously incurred costs and/or one-time costs, which are limited to a specific time period.
(5)Reflects the recognition of incremental Italian payback accruals resulting from the two July 22, 2024 rulings by the Constitutional Court of Italy relating to certain prior years since 2015.
(6)The charge relates to an income tax reserve adjustment associated with the June 2023 Israeli Central-Lod District Court decision in Medtronic Ventor Technologies Ltd v. Kfar Saba Assessing Office and amortization of previously established deferred tax assets from intercompany intellectual property transactions.
Free Cash Flow
Free cash flow, a non-GAAP financial measure, is calculated by subtracting additions to property, plant, and equipment from net cash provided by operating activities. Management uses this non-GAAP financial measure, in addition to U.S. GAAP financial measures, to evaluate our operating results. Free cash flow should be considered supplemental to, and not a substitute for, our reported financial results prepared in accordance with U.S. GAAP. Reconciliations between net cash provided by operating activities (the most comparable U.S. GAAP measure) and free cash flow are as follows:
| Three months ended | |||||||||||
| (in millions) | July 26, 2024 | July 28, 2023 | |||||||||
| Net cash provided by operating activities | $ | 986 | $ | 875 | |||||||
| Additions to property, plant, and equipment | (520) | (354) | |||||||||
| Free cash flow | $ | 466 | $ | 521 |
Refer to the Summary of Cash Flows section for drivers of the change in cash provided by operating activities.
NET SALES
Segment and Division
Certain prior period revenue has been recast to reflect the new reporting structure in the fourth quarter of fiscal year 2024. Refer to Note 17 to the consolidated financial statements for additional information regarding the Company's reporting structure. In addition, starting in the first quarter of fiscal year 2025, the Company combined the non-U.S. developed markets and the emerging markets into an international market geography. Prior period revenue has been recast to conform to the new presentation. The charts below illustrate the percent of net sales by segment for the three months ended July 26, 2024 and July 28, 2023:

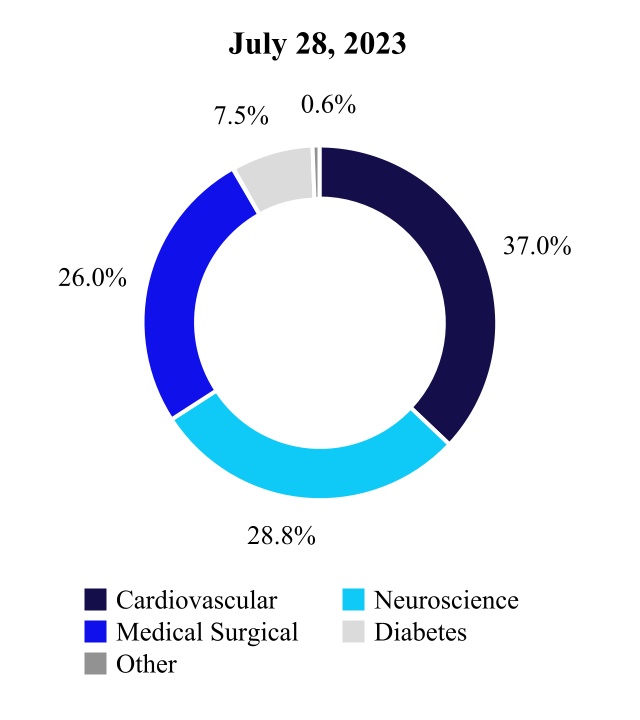
The table below illustrates net sales by segment and division for the three months ended July 26, 2024 and July 28, 2023:
| Three months ended | |||||||||||||||||||||||||||||||||||
| (in millions) | July 26, 2024 | July 28, 2023 | % Change | ||||||||||||||||||||||||||||||||
| Cardiac Rhythm & Heart Failure | $ | 1,535 | $ | 1,446 | 6 | % | |||||||||||||||||||||||||||||
| Structural Heart & Aortic | 856 | 814 | 5 | ||||||||||||||||||||||||||||||||
| Coronary & Peripheral Vascular | 616 | 589 | 5 | ||||||||||||||||||||||||||||||||
| Cardiovascular | 3,007 | 2,850 | 6 | ||||||||||||||||||||||||||||||||
| Cranial & Spinal Technologies | 1,147 | 1,103 | 4 | ||||||||||||||||||||||||||||||||
| Specialty Therapies | 713 | 695 | 3 | ||||||||||||||||||||||||||||||||
| Neuromodulation | 457 | 420 | 9 | ||||||||||||||||||||||||||||||||
| Neuroscience | 2,317 | 2,219 | 4 | ||||||||||||||||||||||||||||||||
| Surgical & Endoscopy | 1,544 | 1,546 | — | ||||||||||||||||||||||||||||||||
| Acute Care & Monitoring | 452 | 459 | (2) | ||||||||||||||||||||||||||||||||
| Medical Surgical | 1,996 | 2,005 | — | ||||||||||||||||||||||||||||||||
| Diabetes | 647 | 578 | 12 | ||||||||||||||||||||||||||||||||
| Total reportable segment net sales | 7,967 | 7,652 | 4 | ||||||||||||||||||||||||||||||||
| Other operating segment(1) | 38 | 50 | (24) | ||||||||||||||||||||||||||||||||
| Other adjustments(2) | (90) | — | 100 | ||||||||||||||||||||||||||||||||
| Total net sales | $ | 7,915 | $ | 7,702 | 3 | % |
(1)Includes the historical operations and ongoing transition agreements from businesses the Company has exited or divested.
(2)Incremental Italian payback accruals resulting from the two July 22, 2024 rulings by the Constitutional Court of Italy relating to certain prior years since 2015.
Segment and Market Geography
The charts below illustrate the percent of net sales by market geography for the three months ended July 26, 2024 and July 28, 2023:
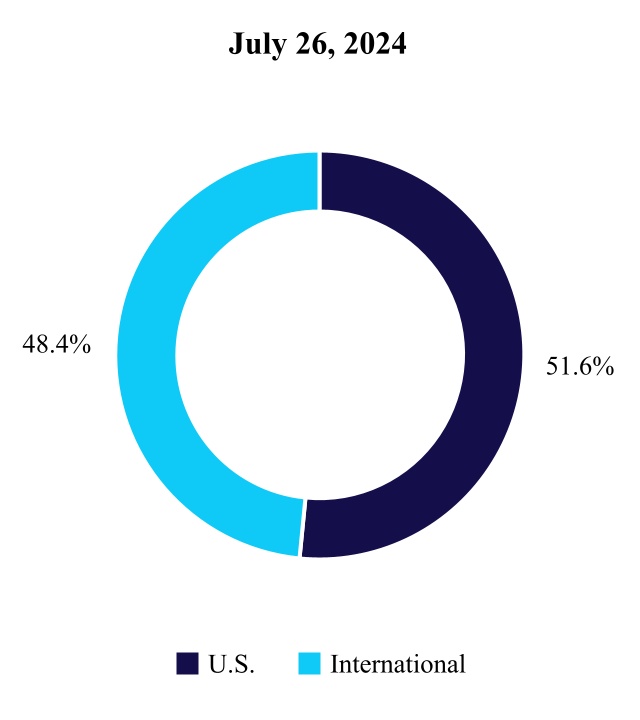
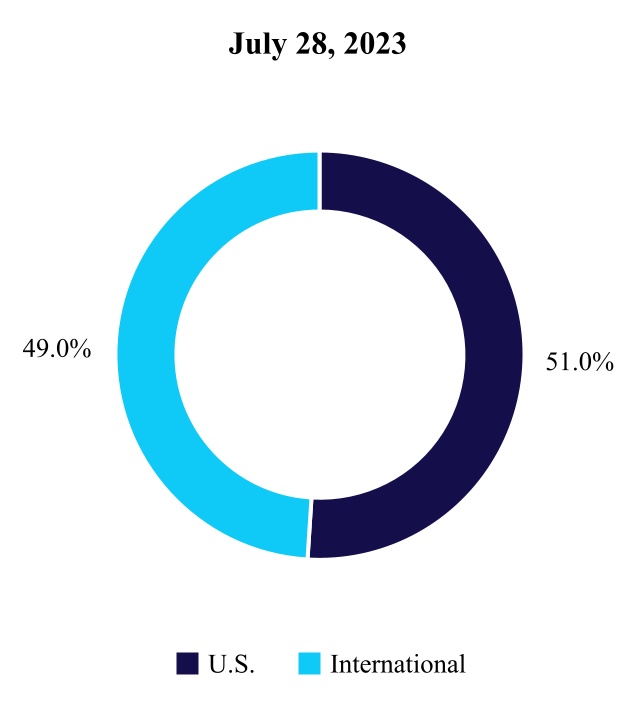
The table below includes net sales by market geography for each of our segments for the three months ended July 26, 2024 and July 28, 2023:
| U.S.****(1) | International**(2)** | ||||||||||||||||||||||||||||||||||||||||||||||||||||
| Three months ended | Three months ended | ||||||||||||||||||||||||||||||||||||||||||||||||||||
| (in millions) | July 26, 2024 | July 28, 2023 | % Change | July 26, 2024 | July 28, 2023 | % Change | |||||||||||||||||||||||||||||||||||||||||||||||
| Cardiovascular | $ | 1,403 | $ | 1,350 | 4 | % | $ | 1,604 | $ | 1,500 | 7 | % | |||||||||||||||||||||||||||||||||||||||||
| Neuroscience | 1,565 | 1,497 | 5 | 752 | 721 | 4 | |||||||||||||||||||||||||||||||||||||||||||||||
| Medical Surgical | 881 | 867 | 2 | 1,115 | 1,137 | (2) | |||||||||||||||||||||||||||||||||||||||||||||||
| Diabetes | 215 | 188 | 14 | 432 | 390 | 11 | |||||||||||||||||||||||||||||||||||||||||||||||
| Reportable segment net sales | 4,064 | 3,903 | 4 | 3,903 | 3,749 | 4 | |||||||||||||||||||||||||||||||||||||||||||||||
| Other operating segment(3) | 18 | 22 | (16) | 19 | 28 | (32) | |||||||||||||||||||||||||||||||||||||||||||||||
| Other adjustments(4) | — | — | — | (90) | — | 100 | |||||||||||||||||||||||||||||||||||||||||||||||
| Total net sales | $ | 4,082 | $ | 3,924 | 4 | % | $ | 3,832 | $ | 3,777 | 1 | % | |||||||||||||||||||||||||||||||||||||||||
(1)U.S. includes the United States and U.S. territories.
(2)Includes all other non-U.S. countries and U.S. territories.
(3)Includes historical operations and ongoing transition agreements from businesses the Company has exited or divested.
(4)Incremental Italian payback accruals resulting from the two July 22, 2024 rulings by the Constitutional Court of Italy relating to certain prior years since 2015.
The increase in net sales for the three months ended July 26, 2024, as compared to the corresponding period in the prior fiscal year, was driven primarily by growth in most businesses, including Diabetes, Neuromodulation, and Cardiac Rhythm & Heart Failure. The increase was partially offset by the $90 million incremental Italian payback accruals resulting from the two July 22, 2024 rulings by the Constitutional Court of Italy relating to certain prior years since 2015.
Looking ahead, a number of macro-economic and geopolitical factors could negatively impact our business, including without limitation:
-
Competitive product launches and pricing pressure, geographic macro-economic risks including fluctuations in currency exchange rates, general price inflation, changes in interest rates, reimbursement challenges, impacts from changes in the mix of our product offerings, delays in product registration approvals, replacement cycle challenges, and supply chain challenges from time to time;
-
National and provincial tender pricing for certain products, particularly in China;
-
The sanctions and other measures being imposed in response to the Russia-Ukraine conflict are having, and could continue to have impacts on revenue and supply chain. The financial impact of the conflict in the first quarter of fiscal year 2025, including on accounts receivable and inventory reserves, was not material, and for the three months ended July 26, 2024, the business of the Company in these countries represented less than 1% of the Company's consolidated revenues and assets. Although the implications of this conflict are difficult to predict at this time, the ongoing conflict may increase pressure on the global economy and supply chains, resulting in increased future volatility risk for our business operations and performance.
-
Although the long-term implications of Israel's recent conflict are difficult to predict at this time, the financial impact of the conflict in the first quarter of fiscal year 2025, including on accounts receivable and inventory reserves, was not material. For the three months ended July 26, 2024, the Company had 6 facilities and approximately 1,500 employees in Israel. For the three months ended July 26, 2024, the business of the Company in Israel represented less than 1% of the Company's consolidated revenues and assets.
Cardiovascular
Cardiovascular products include pacemakers, insertable cardiac monitors, cardiac resynchronization therapy devices, implantable cardioverter defibrillators, leads and delivery systems, electrophysiology catheters, products for the treatment of atrial fibrillation, information systems for the management of patients with Cardiac Rhythm & Heart Failure devices, products designed to reduce surgical site infections, coronary and peripheral stents and related delivery systems, balloons and related delivery systems, endovascular stent graft systems, heart valve replacement technologies, cardiac tissue ablation systems, and open heart and coronary bypass grafting surgical products. Cardiovascular also includes Care Management Services and Cath Lab Managed Services (CLMS) within the Cardiac Rhythm & Heart Failure division. Cardiovascular's net sales for the three months ended July 26, 2024 was $3.0 billion, an increase of 6 percent as
compared to the corresponding period in the prior fiscal year. The net sales increase was primarily due to strong performance of Pulsed Field Ablation, High Power, TAVR, Cardiac Surgery, and Coronary.
The graphs below illustrate the percent of Cardiovascular net sales by division for the three months ended July 26, 2024 and July 28, 2023:
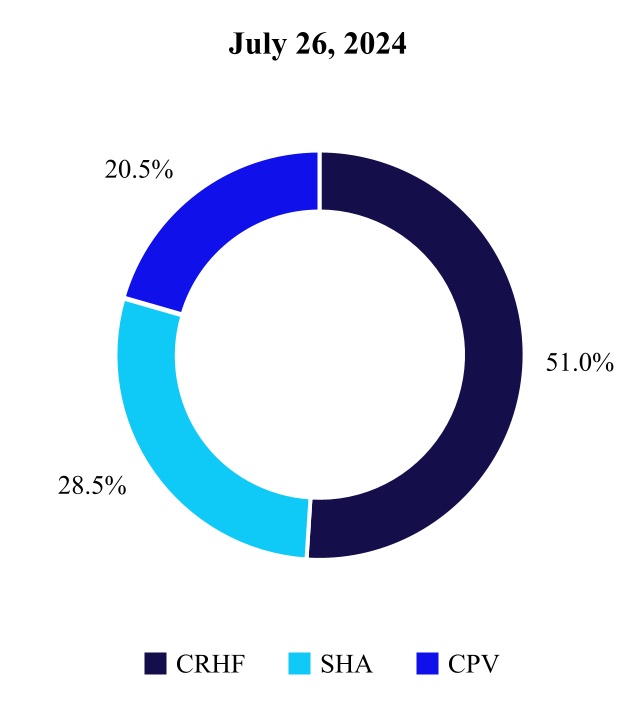
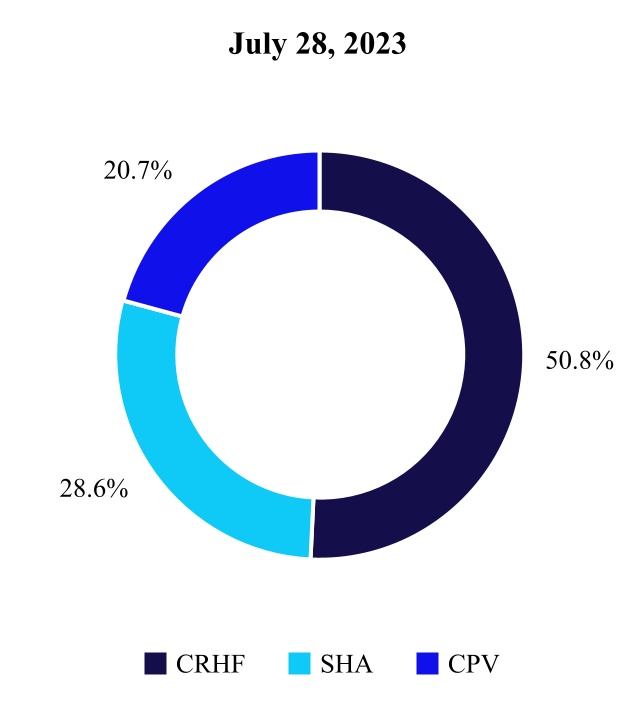
Cardiac Rhythm & Heart Failure (CRHF) net sales for the three months ended July 26, 2024 increased 6 percent, as compared to the corresponding period in the prior fiscal year. The net sales increase was driven by continued adoption of Micra AV2 and Micra VR2, PulseSelect Pulsed Field Ablation, and the Aurora extravascular implantable cardioverter defibrillator (EV-ICD) system.
Structural Heart & Aortic (SHA) net sales for the three months ended July 26, 2024 increased 5 percent, as compared to the corresponding period in the prior fiscal year. The net sales increase was driven by growth in TAVR, including strong growth internationally from adoption of Evolut FX TAVR system, and in Cardiac Surgery driven by growth in Perfusion, particularly in the U.S., and Surgical Valves.
Coronary & Peripheral Vascular (CPV) net sales for the three months ended July 26, 2024 increased 5 percent, as compared to the corresponding period in the prior fiscal year. The increase in net sales was driven by growth in guide catheters, balloons, and drug-eluting stents, as well as growth in our Vascular Embolization products.
In addition to the macro-economic and geopolitical factors described in the Executive Level Overview, looking ahead, we expect Cardiovascular could be affected by the following:
-
Continued global penetration of our Micra transcatheter pacing portfolio.
-
Continued acceptance and growth from the Azure XT and Azure S SureScan pacing systems and the 3830 lead.
-
Global adoption of Aurora Extravascular ICD.
-
Growth of the Cobalt and Crome portfolio of ICDs and CRT-Ds.
-
Growth of the CRT-P quadripolar pacing system.
-
Continued growth, adoption, and utilization of the TYRX Envelope for implantable devices.
-
Continued use and acceptance of Reveal LINQ and expansion of the LINQ II cardiac monitor.
-
Continued acceptance, adoption, and growth of our innovative portfolio of products in the electrophysiology (EP) segment, including the Arctic Front cryoablation system, PulseSelect PFA, and Affera mapping and ablation system.
-
Continued acceptance and growth of the self-expanding CoreValve Evolut transcatheter aortic valve replacement platform. This includes Evolut PRO which provides enhanced hemodynamics, reliable delivery, enhanced durability, advanced sealing, and Evolut FX, a system designed to improve the overall procedural experience through enhancements
in deliverability, implant visibility, and deployment stability. The Evolut FX+ TAVR system maintains the valve performance benefits of the legacy Evolut TAVR platform and is designed to facilitate coronary access. The system was approved by the U.S. FDA in March 2024.
-
Market acceptance and reimbursement for the Symplicity Spyral renal denervation system, also known as the Symplicity blood pressure procedure, for the treatment of hypertension.
-
Continued acceptance and growth of the Onyx Frontier DES platform. Onyx Frontier is a DES that introduces an enhanced delivery system and is used for complex percutaneous coronary intervention (PCI).
-
Acceptance and growth of IN.PACT 018 drug-coated balloons (DCB). IN.PACT 018 adds to the existing IN.PACT Admiral DCB portfolio and is used to treat femoropopliteal disease.
-
Our ability to meet growing demand for our existing products and to successfully develop, obtain regulatory approval of and commercialize the products within our pipeline.
Neuroscience
Neuroscience's products include various spinal implants, bone graft substitutes, biologic products, image-guided surgery and intra-operative imaging systems, robotic guidance systems used in the robot-assisted spine procedures, and systems that incorporate advanced energy surgical instruments. Neuroscience's products also focus on therapies to treat the diseases of the vasculature in and around the brain, including coils, neurovascular stents, and flow diversion products, as well as products to treat ear, nose, and throat (ENT), and the treatment of overactive bladder and urinary retention. Neuroscience also manufactures products related to implantable neurostimulation therapies and drug delivery systems for the treatment of chronic pain, movement disorders, and epilepsy. Neuroscience’s net sales for the three months ended July 26, 2024 was $2.3 billion, an increase of 4 percent compared to the corresponding period in the prior fiscal year. The net sales increase was primarily due to growth in Neuromodulation, Spine and Biologics, and Hemorrhagic Stroke.
The graphs below illustrate the percent of Neuroscience net sales by division for the three months ended July 26, 2024 and July 28, 2023:
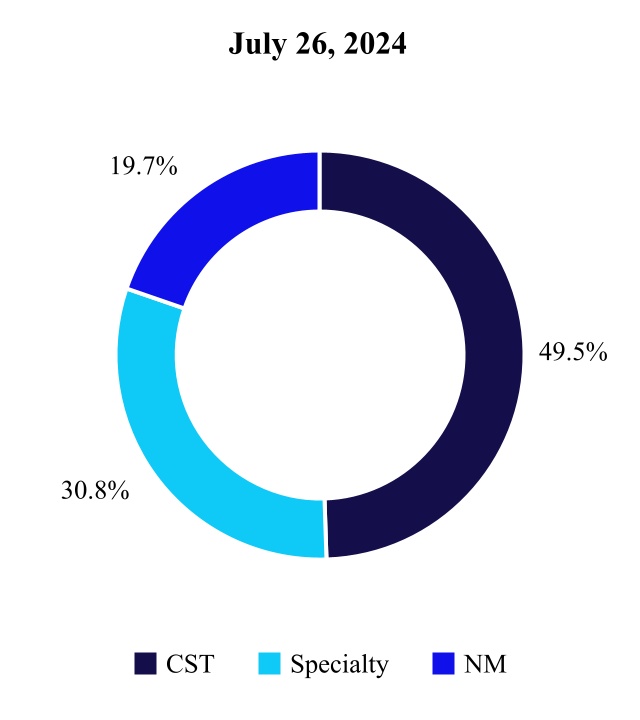
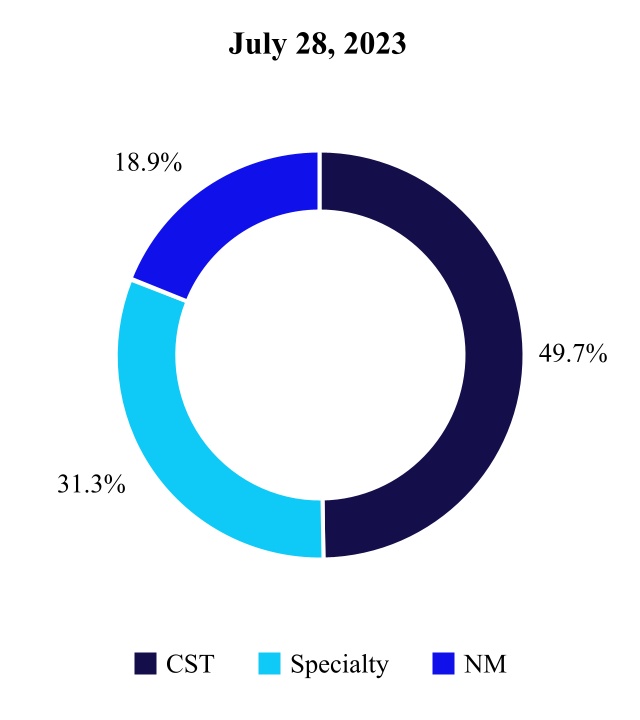
Cranial & Spinal Technologies (CST) net sales for the three months ended July 26, 2024 increased 4 percent as compared to the corresponding period in the prior fiscal year. The net sales increase was driven by increased sales of Core Spine and Biologics products driven by AiBLE spinal ecosystem pull-through.
Specialty Therapies (Specialty) net sales for the three months ended July 26, 2024 increased 3 percent as compared to the corresponding period in the prior fiscal year. The net sales increase was driven by hemorrhagic stroke products, growth on continued adoption of the Interstim X system, and ENT.
Neuromodulation (NM) net sales for the three months ended July 26, 2024 increased 9 percent as compared to the corresponding period in the prior fiscal year. The net sales increase was driven by growth within Brain Modulation, driven by the continued launch of the Percept RC deep brain neurostimulator, as well as growth in Pain Stim driven by the U.S. launch of the Inceptiv spinal cord stimulator and continued adoption in Western Europe.
In addition to the macro-economic and geopolitical factors described in the Executive Level Overview, looking ahead we expect Neuroscience could be affected by the following:
-
Continued adoption and growth of our integrated solutions through the AiBLE offering, which integrates spinal implants with enabling technologies (StealthStation, O-arm Imaging Systems, and Midas), Mazor robotics, and UNiD Adaptive Spine Intelligence AI-driven technology for surgical planning and personalized spinal implants.
-
Market acceptance and continued global adoption of innovative new spine products and procedural solutions within our CST operating unit, such as Catalyft PL, ModuLeX, CD Horizon Voyager System, and our Infinity OCT System, as well as continued growth from Titan spine titanium interbody implants with Nanolock technology.
-
Continued growth of Pipeline Embolization Devices, endovascular treatments for large or giant wide-necked brain aneurysms.
-
Continued acceptance and growth of the Solitaire X revascularization device for treatment of acute ischemic stroke and our React Catheter and Riptide aspiration system.
-
Continued acceptance and growth of our Pelvic Health therapies, including our InterStim therapy with InterStim X and InterStim II recharge-free neurostimulators and InterStim Micro rechargeable neurostimulator for patients suffering from overactive bladder, (non-obtrusive) urinary retention, and chronic fecal incontinence.
-
Continued acceptance and growth of our ENT therapies, including capital equipment sales of the StealthStation ENT surgical navigation system and intraoperative NIM nerve monitoring system, and the Propel sinus implants used in the treatment of chronic rhinosinusitis.
-
Continued acceptance and growth from spinal cord stimulation (SCS) therapy for treating chronic pain and Diabetic Peripheral Neuropathy (DPN) on the Inceptiv closed-loop rechargeable neurostimulator, Intellis rechargeable neurostimulator and Vanta recharge-free neurostimulator. The Inceptiv closed-loop rechargeable SCS received U.S. FDA approval in April 2024.
-
Continued acceptance and growth of our Percept family of deep brain stimulation (DBS) devices with proprietary BrainSense technology for objectifying and personalizing the treatment of Parkinson's Disease, epilepsy, and other movement disorders.
-
Our ability to meet growing demand for our existing products and to successfully develop, obtain regulatory approval of and commercialize the products within our pipeline, which include hemorrhagic stroke intravascular device and our next-generation spine enabling technologies.
Medical Surgical
Medical Surgical’s products span the entire continuum of patient care from diagnosis to recovery, with a focus on diseases of the gastrointestinal tract, lungs, pelvic region, obesity, and preventable complications. The products include those for advanced and general surgical products, surgical stapling devices, vessel sealing instruments, wound closure, electrosurgery products, hernia mechanical devices, mesh implants, advanced ablation, interventional lung, airway products, and sensors and monitors for pulse oximetry, capnography, level of consciousness and cerebral oximetry. Medical Surgical's net sales for the three months ended July 26, 2024 were $2.0 billion, flat, as compared to the corresponding period in the prior fiscal year. The net sales increases in Hernia, Wound Management, Endoscopy and Perioperative Complications, was offset by the net sales declines in Advanced Surgical Technologies and Respiratory Compromise.
The graphs below illustrate the percent of Medical Surgical net sales by division for the three months ended July 26, 2024 and July 28, 2023:
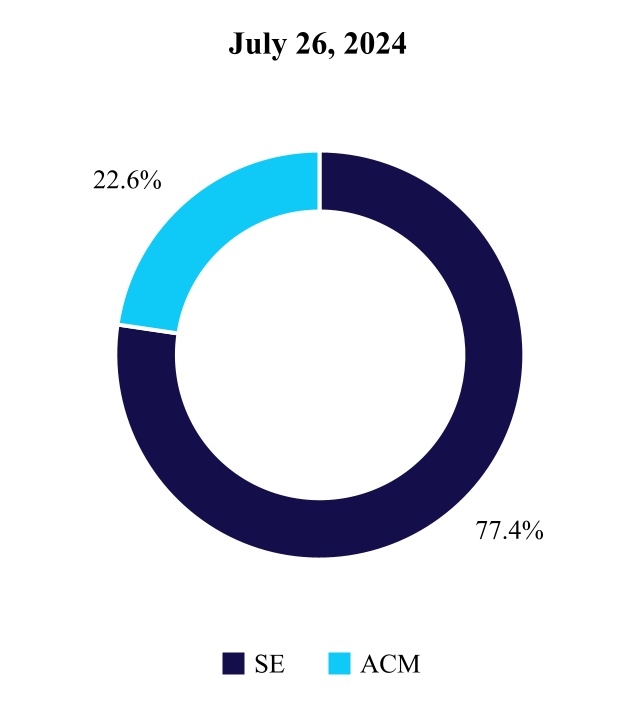
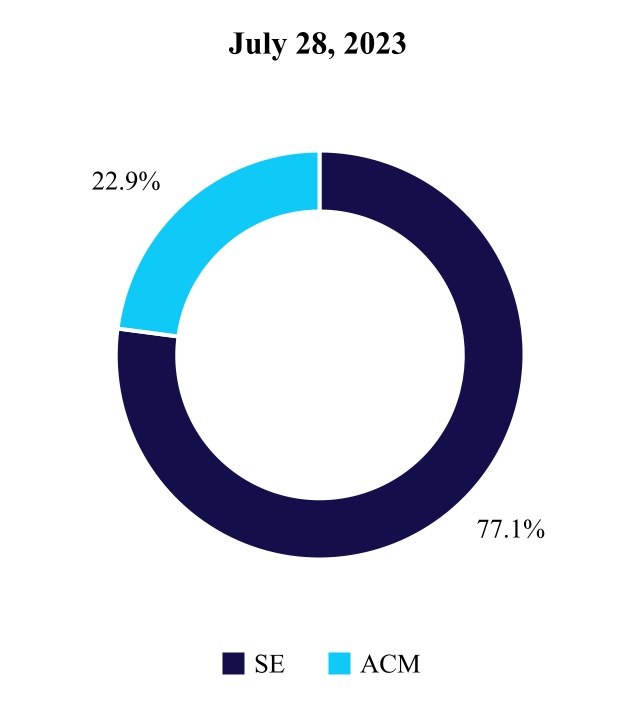
Surgical & Endoscopy (SE) net sales for the three months ended July 26, 2024 were flat, as compared to the corresponding period in the prior fiscal year. The net sales decrease in Advanced Surgical Technologies was offset by growth in Hernia, Wound Management, and Endoscopy.
Acute Care & Monitoring (ACM) net sales for the three months ended July 26, 2024 decreased 2 percent as compared to the corresponding period in the prior fiscal year. The net sales decrease was largely due to declines in Respiratory Compromise and airways, partially offset by growth in Perioperative Complications.
In addition to the macro-economic and geopolitical factors described in the Executive Level Overview, looking ahead we expect Medical Surgical could be affected by the following:
-
Acceptance and continued growth of Open-to-MIS (minimally invasive surgery) techniques and tools through our efforts to transition open surgery to MIS. Open-to-MIS initiative focuses on capturing the market opportunity that exists in transitioning open procedures to MIS, whether through traditional MIS, advanced instrumentation, or robotics. Through our approach, in parallel, we also expand our presence and optimize open surgery in current open surgery markets.
-
Continued global acceptance and future growth of powered stapling and energy platform.
-
Our ability to execute ongoing strategies addressing the near-term pressures to bariatric surgery procedure volumes in the U.S. from pharmaceuticals, and growth of surgical soft tissue robotics procedures in the U.S.
-
Our ability to create markets and drive products and procedures into emerging markets with our high quality and cost-effective surgical products designed for customers in emerging markets.
-
Continued acceptance and growth in patient monitoring and airway management. Key products in this area include Microstream Capnography, Nellcor pulse oximetry system with OxiMax technology, Shiley tracheostomy and endotracheal tubes, and McGRATH MAC video laryngoscopes.
-
Acceptance of less invasive standards of care in chronic and colorectal, as well as hepatology products, including products that span the care continuum from diagnostics to therapeutics. Recently launched products include GI Genius.
-
Expanding the use of less invasive treatments and furthering our commitment to improving options for women with abnormal uterine bleeding. Our expanded and strengthened surgical offerings complement our global gynecology business.
-
Global adoption of robotic-assisted surgery and installations of Hugo robotic assisted surgery (RAS) system for urologic, bariatric, gynecologic, hernia, and general surgery procedures. This includes continued integration and adoption of Touch Surgery Enterprise with the first artificial intelligence powered surgical videos and analytics platform to make it easier to train and discover new techniques within the robotics platform. The Hugo RAS system, which received CE Mark in October 2021, as well as secured additional regulatory approvals outside the U.S., is designed to help reduce unwanted variability, improve patient outcomes, and, by extension, lower per procedure cost.
-
Our ability to meet growing demand for our existing products and to successfully develop, obtain regulatory approval of and commercialize the products within our pipeline, which include our Hugo RAS system in the U.S., the adoption of AI in Endoscopy, Signia powered stapling devices, and our next-gen Ligasure and Sonicision vessel sealing devices.
Diabetes
Diabetes' products include insulin pumps, continuous glucose monitoring (CGM) systems, and consumables. Diabetes' net sales for the three months ended July 26, 2024 were $647 million an increase of 12 percent as compared to the corresponding period in the prior fiscal year. The increase in net sales was primarily driven by strong U.S growth as a result of the continued adoption of the MiniMed 780G insulin pump system, and strong international growth in CGM systems from increased attachment rates, and adoption of Simplera Sync.
In addition to the macro-economic and geopolitical factors described in the Executive Level Overview, looking ahead we expect Diabetes could be affected by the following:
-
Continued acceptance and growth for the MiniMed 780G insulin pump system, which is powered by SmartGuard technology and features the added benefits of meal detection technology that automatically adjusts and corrects sugar levels every five minutes. The global adoption of our Automated Insulin Delivery (AID) systems has resulted in strong sensor attachment rates. The MiniMed 780G insulin pump system with the Guardian 4 Sensor was approved by the U.S. FDA in late April 2023. The MiniMed 780G insulin pump system with Simplera Sync received CE Mark in early January 2024.
-
Continued acceptance and growth of the Guardian Connect CGM system, which displays glucose information directly to a smartphone to provide patients access to their glucose levels seamlessly and discretely. The Guardian Connect CGM system is available on both Apple iOS and Android devices.
-
Market acceptance and growth of our InPen smart pen system, which allows users to have their Medtronic CGM readings in real-time alongside insulin dose information, all in one view.
-
Continued pump, CGM, and consumable competition in an expanding global market.
-
Changes in medical reimbursement policies and programs, along with additional payor coverage on insulin pumps.
-
Our ability to meet growing demand for our existing products and to successfully develop, obtain regulatory approval of and commercialize the products within our pipeline, including our next-generation sensor Simplera, which received U.S. FDA approval in early August 2024 and CE Mark in September 2023, and the products resulting from our partnership with Abbott to expand CGM options for people living with diabetes.
COSTS AND EXPENSES
The following is a summary of cost of products sold, research and development, and selling, general, and administrative expenses as a percent of net sales for the three months ended July 26, 2024 and July 28, 2023:
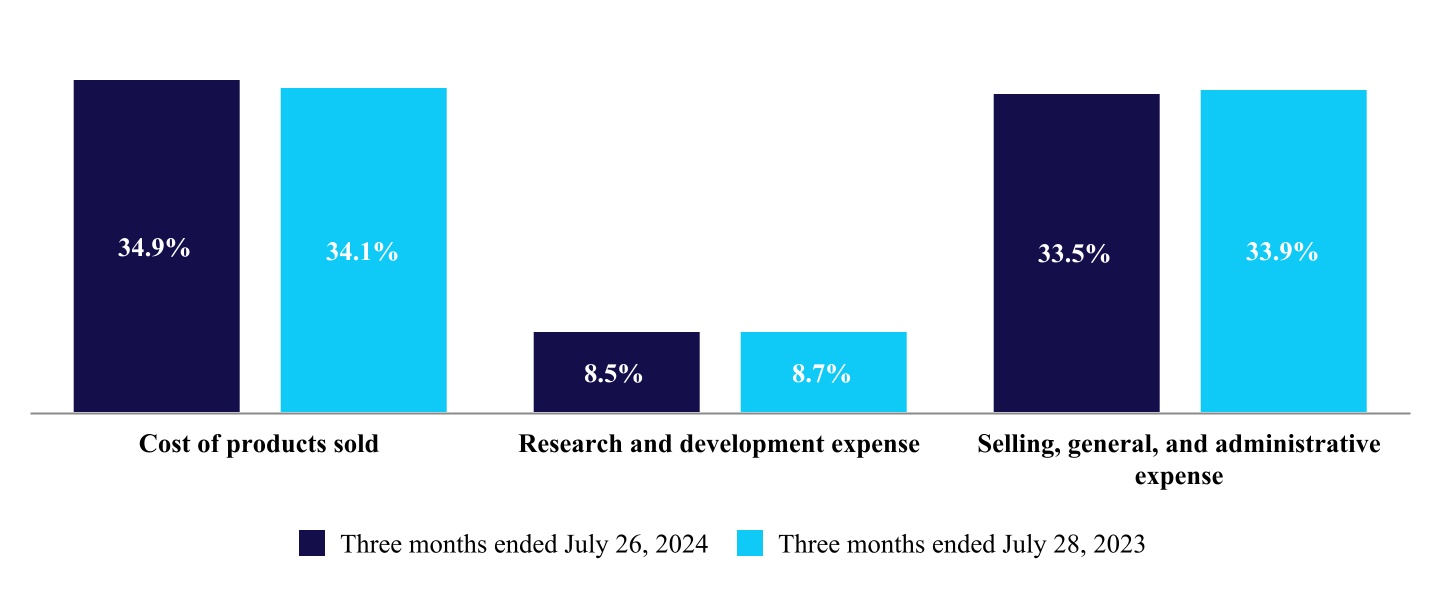
Cost of Products Sold Cost of products sold for the three months ended July 26, 2024 was $2.8 billion, as compared to $2.6 billion for the corresponding period in the prior fiscal year. The increase in cost products sold as a percentage of net sales for the three months ended July 26, 2024 was primarily due to unfavorable currency impact.
Research and Development Expense We remain committed to deliver the best possible experiences for patients, physicians, and caregivers we serve; to create technologies that expand what’s possible across the human body to transform lives; to turn data and insights into real action to serve patient needs, improving care; and to expand healthcare access and deliver positive outcomes. Research and development expense for the three months ended July 26, 2024 was $676 million, as compared to $668 million for the corresponding period in the prior fiscal year.
Selling, General, and Administrative Expense Our goal is to continue to leverage selling, general, and administrative expense management initiatives. Selling, general, and administrative expense primarily consists of salaries and wages, other administrative costs, such as professional fees and marketing expenses, certain acquisition and divestiture-related costs, and restructuring associated expenses. Selling, general, and administrative expense for the three months ended July 26, 2024 was $2.7 billion, as compared to $2.6 billion for the corresponding period in the prior fiscal year.
The following is a summary of other costs and expenses (income):
| Three months ended | |||||||||||||||||||||||
| (in millions) | July 26, 2024 | July 28, 2023 | |||||||||||||||||||||
| Amortization of intangible assets | $ | 414 | $ | 429 | |||||||||||||||||||
| Restructuring charges, net | 47 | 54 | |||||||||||||||||||||
| Certain litigation charges, net | 81 | 40 | |||||||||||||||||||||
| Other operating expense, net | 1 | 1 | |||||||||||||||||||||
| Other non-operating income, net | (157) | (76) | |||||||||||||||||||||
| Interest expense, net | 167 | 148 |
Amortization of Intangible Assets Amortization of intangible assets includes the amortization expense of our definite-lived intangible assets, consisting of purchased patents, trademarks, tradenames, customer relationships, purchased technology, and other intangible assets.
Restructuring Charges, Net For the three months ended July 26, 2024 and July 28, 2023, restructuring costs primarily related to employee termination benefits and facility consolidations to support cost reduction initiatives.
For additional information about our restructuring activities, refer to Note 5 to the current period's consolidated financial statements.
Certain Litigation Charges, Net We classify specified certain litigation charges and gains related to significant legal matters as certain litigation charges, net in the consolidated statements of income. For additional information, refer to Note 16 in the current period's consolidated financial statements.
Other Operating Expense, Net Other operating expense, net primarily includes expenses associated with royalties paid for the in-license of intellectual property from third parties, currency remeasurement and derivative gains and losses, changes in the fair value of contingent consideration, certain acquisition and divestiture-related items, and income from funded research and development arrangements.
For the three months ended July 26, 2024, other operating expense, net was flat compared to the corresponding period in the prior year.
Other Non-Operating Income, Net Other non-operating income, net includes the non-service component of net periodic pension and postretirement benefit cost, investment gains and losses, and interest income.
For the three months ended July 26, 2024, the increase in other non-operating income, net is primarily attributable to an increase in net gains on our minority investment portfolio. Net gains on minority investments were $17 million for the three months ended July 26, 2024, compared to a net loss of $64 million for the three months ended July 28, 2023.
Interest Expense, Net Interest expense, net includes interest incurred on our outstanding borrowings, amortization of debt issuance costs and debt premiums or discounts, and amortization of amounts excluded from the effectiveness assessment of certain net investment and fair value hedges.
For the three months ended July 26, 2024, the increase in interest expense, net was primarily driven by the €3.0 billion debt issuance on June 3, 2024 and the higher commercial paper balance during the quarter.
INCOME TAXES
| Three months ended | |||||||||||||||||||||||
| (in millions) | July 26, 2024 | July 28, 2023 | |||||||||||||||||||||
| Income tax provision | $ | 220 | $ | 400 | |||||||||||||||||||
| Income before income taxes | 1,268 | 1,196 | |||||||||||||||||||||
| Effective tax rate | 17.4 | % | 33.4 | % | |||||||||||||||||||
| Non-GAAP income tax provision | $ | 327 | $ | 300 | |||||||||||||||||||
| Non-GAAP income before income taxes | 1,925 | 1,902 | |||||||||||||||||||||
| Non-GAAP Nominal Tax Rate | 17.0 | % | 15.8 | % | |||||||||||||||||||
| Difference between the effective tax rate and Non-GAAP Nominal Tax Rate | (0.4) | % | (17.6) | % |
The Organization for Economic Co-operation and Development (OECD) published Pillar Two Model Rules defining the global minimum tax, which calls for the taxation of large multinational corporations at a minimum rate of 15% in each jurisdiction in which the group operates. The OECD has since issued administrative guidance providing transition and safe harbor rules around the implementation of the Pillar Two global minimum tax. A number of countries, including Ireland, have enacted legislation to implement the core elements of Pillar Two, which are effective for Medtronic in fiscal year 2025. We will continue to monitor the impacts of further legislation, regulatory guidance, and regulations issued in the countries in which we do business.
The Israeli Central-Lod District Court issued its decision in Medtronic Ventor Technologies Ltd (Ventor) v. Kfar Saba Assessing Office on June 1, 2023. The court determined that there was a deemed taxable transfer of intellectual property. As a result, the Company recorded a $187 million income tax charge during the first quarter of fiscal year 2024 and has filed an appeal with the Supreme Court of Israel.
Our effective tax rate for the three months ended July 26, 2024 was 17.4% as compared to 33.4% for the three months ended July 28, 2023. The decrease in the effective tax rate primarily relates to an income tax reserve adjustment made during the three months ended July 28, 2023 associated with the Medtronic Ventor Technologies Ltd court decision and year-over-year changes in operational results by jurisdiction, which were partially offset by the impact of the Pillar Two global minimum tax for the three months ended July 26, 2024.
Our Non-GAAP Nominal Tax Rate for the three months ended July 26, 2024 was 17.0% as compared to 15.8% for the three months ended July 28, 2023. The change in our Non-GAAP Nominal Tax Rate was primarily due to the implementation of the Pillar Two global minimum tax and year-over-year changes in operational results by jurisdiction. An increase in our Non-GAAP Nominal Tax Rate of 1 percent would result in an additional income tax provision for the three months ended July 26, 2024 of approximately $19 million.
LIQUIDITY AND CAPITAL RESOURCES
We are currently in a strong financial position, and we believe our balance sheet and liquidity as of July 26, 2024 provide us with flexibility, and our cash, cash equivalents, and current investments, along with our credit facility and related commercial paper programs will satisfy our foreseeable operating needs.
Our liquidity and capital structure are evaluated regularly within the context of our annual operating and strategic planning processes. We consider the liquidity necessary to fund our operations, which includes working capital needs, investments in research and development, property, plant, and equipment, and other operating costs. We also consider capital allocation alternatives that balance returning value to shareholders through dividends and share repurchases, satisfying maturing debt, and acquiring businesses and technology.
Summary of Cash Flows
The following is a summary of cash provided by (used in) operating, investing, and financing activities, the effect of exchange rate changes on cash and cash equivalents, and the net change in cash and cash equivalents:
| Three months ended | |||||||||||
| (in millions) | July 26, 2024 | July 28, 2023 | |||||||||
| Cash provided by (used in): | |||||||||||
| Operating activities | $ | 986 | $ | 875 | |||||||
| Investing activities | (259) | (539) | |||||||||
| Financing activities | (731) | (501) | |||||||||
| Effect of exchange rate changes on cash and cash equivalents | 31 | (39) | |||||||||
| Net change in cash and cash equivalents | $ | 27 | $ | (204) |
Operating Activities The $111 million increase in net cash provided was primarily driven by an increase in cash collected from customers due to an increase in sales and a decrease in cash paid to vendors. The increase in net cash was partially offset by increased annual incentive payouts and an increase in cash paid for taxes.
Investing Activities The $280 million decrease in cash used was primarily attributable to a increase in net sales and maturities of investments of $446 million partially offset by an increase in net additions to property, plant, and equipment of $166 million.
Financing Activities There was a $230 million increase in net cash used during the three months ended July 26, 2024, as compared to the corresponding period in the prior fiscal year. In the current period, there was an decrease in commercial paper that was issued and outstanding at quarter end of $624 million, as compared to an increase of $500 million in the prior year. Additionally, on June 3, 2024, Medtronic Inc. issued four tranches of EUR-denominated Senior Notes with an aggregate principal of €3.0 billion, or $3.2 billion, which was partially offset by a $2.3 billion increase in net share repurchases during the three months ended July 26, 2024, as compared to the corresponding period in the prior fiscal year. For more information on commercial paper and Senior Notes issued, refer to the Debt and Capital section below.
Debt and Capital
Our capital structure consists of equity and interest-bearing debt. We primarily utilize unsecured senior debt obligations to meet our financing needs and, to a lesser extent, bank borrowings. From time to time, we may repurchase our outstanding debt obligations in the open market or through privately negotiated transactions.
Total debt at July 26, 2024 was $27.9 billion as compared to $25.0 billion at April 26, 2024. The increase in total debt was driven by issuance of Euro-denominated Senior Notes and fluctuations in exchange rates.
On June 3, 2024, Medtronic Inc. issued four tranches of EUR-denominated Senior Notes with an aggregate principal of €3.0 billion, with maturities ranging from fiscal year 2030 to 2054, resulting in cash proceeds of approximately $3.2 billion, net of discounts and issuance costs. In anticipation of the Euro-denominated debt issuance, the Company entered into forward currency exchange rate contracts to manage the exposure to exchange rate movements. These contracts were settled in conjunction with the issuance of the June 2024 Notes.
We repurchase our ordinary shares on occasion as part of our focus on returning value to our shareholders. In March 2019, the Company's Board of Directors authorized the repurchase of $6.0 billion of the Company's ordinary shares. In March 2024, the Company's Board of Directors authorized the repurchase of an incremental $5.0 billion of the Company's ordinary shares. There is no specific time period associated with these repurchase authorizations. During the three months ended July 26, 2024, the Company repurchased a total of 30 million shares under this program at an average price of $82.28. At July 26, 2024, we had approximately $2.8 billion remaining under the share repurchase program authorized by our Board of Directors.
For more information on credit arrangements, refer to Note 7 to the current period's consolidated financial statements and Note 6 to the consolidated financial statements included in our Annual Report on Form 10-K for the fiscal year ended April 26, 2024.
Liquidity
Our liquidity sources at July 26, 2024 included $1.3 billion of cash and cash equivalents and $6.5 billion of current investments. Additionally, we maintain commercial paper programs and a Credit Facility.
Our investments primarily include available-for-sale debt securities, including U.S. and non-U.S. government and agency securities, corporate debt securities, mortgage-backed securities, and other asset-backed securities. Refer to Note 6 to the current period's consolidated financial statements for additional information regarding fair value measurements.
We maintain multicurrency commercial paper programs for short-term financing, which allow us to issue unsecured commercial paper notes on a private placement basis up to a maximum aggregate amount outstanding at any time of $3.5 billion. At July 26, 2024 and April 26, 2024, we had $449 million and $1.1 billion commercial paper outstanding, respectively. The issuance of commercial paper reduces the amount of credit available under our existing line of credit, as explained below.
We also have a $3.5 billion five-year syndicated credit facility (Credit Facility), which expires in December 2027. At each anniversary date of the Credit Facility we can request a one-year extension of the maturity date. The Credit Facility provides backup funding for the commercial paper programs and may also be used for general corporate purposes. The Credit Facility provides us with the ability to increase our borrowing capacity by an additional $1.0 billion at any time during the term of the agreement. At July 26, 2024 and April 26, 2024, no amounts were outstanding under the Credit Facility.
Interest rates on advances of our Credit Facility are determined by a pricing matrix based on our long-term debt ratings assigned by Standard & Poor's Ratings Services (S&P) and Moody's Investors Service (Moody’s). Facility fees are payable on the Credit Facility and are determined in the same manner as the interest rates. We are in compliance with all covenants related to the Credit Facility.
The following table is a summary of our S&P and Moody's long-term debt ratings and short-term debt ratings:
| Agency Rating**(1)** | ||||||||||||||
| July 26, 2024 | April 26, 2024 | |||||||||||||
| Standard & Poor's Ratings Services | ||||||||||||||
| Long-term debt | A | A | ||||||||||||
| Short-term debt | A-1 | A-1 | ||||||||||||
| Moody's Investors Service | ||||||||||||||
| Long-term debt | A3 | A3 | ||||||||||||
| Short-term debt | P-2 | P-2 |
(1) Agency ratings are subject to change, and there may be no assurance that an agency will continue to provide ratings and/or maintain its current ratings. A security rating is not a recommendation to buy, sell or hold securities, and may be subject to revision or withdrawal at any time by the rating agency, and each rating should be evaluated independently of any other rating.
S&P and Moody's long-term debt ratings and short-term debt ratings at July 26, 2024 were unchanged as compared to the ratings at April 26, 2024. We do not expect the S&P and Moody's ratings to have a significant impact on our liquidity or future flexibility to access additional liquidity given our balance sheet, Credit Facility, and related commercial paper programs.
We have future contractual obligations and other minimum commercial commitments that are entered into in the normal course of business. We believe our off-balance sheet arrangements do not have a material current or anticipated future effect on our consolidated earnings, financial position, and/or cash flows. Refer to the Debt and Capital section above for changes in debt obligations during the first quarter of fiscal year 2025; there have been no other material changes to our long-term contractual obligations as reported in our most recent Annual Report filed on Form 10-K for the fiscal year ended April 26, 2024.
ACQUISITIONS AND DISPOSITIONS
Information regarding acquisitions and dispositions activity is included in Note 4 to the current period's consolidated financial statements.
GOODWILL
We assess goodwill and indefinite-lived intangible assets for impairment annually in the third quarter of the fiscal year and whenever an event occurs or circumstances change that would indicate the carrying amount may be impaired.
The Company calculates the excess of each reporting unit's fair value over its carrying amount, including goodwill, utilizing a discounted cash flow analysis and revenue and earnings multiples using comparable public company information. The test for impairment of goodwill requires the Company to make several estimates related to projected future cash flows and appropriate multiples to determine the fair value of the goodwill reporting units. Significant assumptions used in the reporting unit fair value measurements include forecasted cash flows, including revenue and expense growth rates, discount rates, and revenue and earnings multiples. An impairment loss is recognized when the carrying amount of the reporting unit’s net assets exceeds the estimated fair value of the reporting unit.
Definite-lived intangible assets are tested for impairment whenever events or changes in circumstances indicate that the carrying amount of an intangible asset (asset group) may not be recoverable. There were no impairments of intangible assets in the current period. Further adverse changes to macroeconomic conditions or significant changes to our current and future expected financial performance could lead to goodwill or intangible asset impairment charges in future periods, and such charges could be material to our results of operations.
CRITICAL ACCOUNTING ESTIMATES
We have used various accounting policies to prepare the consolidated financial statements in accordance with U.S. GAAP. Our significant accounting policies are disclosed in Note 1 to the consolidated financial statements included in our Annual Report on Form 10-K for the fiscal year ended April 26, 2024.
The preparation of the consolidated financial statements, in conformity with U.S. GAAP, requires us to use judgment in making estimates and assumptions that affect the reported amounts of assets, liabilities, revenues, and expenses. These estimates reflect our best judgment about economic and market conditions and the potential effects on the valuation and/or carrying value of assets and liabilities based upon relevant information available. We base our estimates on historical experience and on various assumptions that are believed to be reasonable under the circumstances, the results of which form the basis for making judgments about the carrying values of assets and liabilities that are not readily apparent from other sources.
As of July 26, 2024, there were no material changes to our critical accounting estimates.
NEW ACCOUNTING PRONOUNCEMENTS
Information regarding new accounting pronouncements is included in Note 2 to the current period's consolidated financial statements.
SUPPLEMENTAL GUARANTOR FINANCIAL INFORMATION
Medtronic plc and Medtronic Global Holdings S.C.A. (Medtronic Luxco), a wholly-owned subsidiary guarantor, each have provided full and unconditional guarantees of the obligations of Medtronic, Inc., a wholly-owned subsidiary issuer, under the Senior Notes (Medtronic Senior Notes) and full and unconditional guarantees of the obligations of Covidien International Finance S.A. (CIFSA), a wholly-owned subsidiary issuer, under the Senior Notes (CIFSA Senior Notes). The guarantees of the CIFSA Senior Notes are in addition to the guarantees of the CIFSA Senior Notes by Covidien Ltd. and Covidien Group Holdings Ltd., both of which are wholly-owned subsidiary guarantors of the CIFSA Senior Notes. Medtronic plc and Medtronic, Inc. each have provided a full and unconditional guarantee of the obligations of Medtronic Luxco under the Senior Notes (Medtronic Luxco Senior Notes). The following is a summary of these guarantees:
Guarantees of Medtronic Senior Notes
-
Parent Company Guarantor – Medtronic plc
-
Subsidiary Issuer – Medtronic, Inc.
-
Subsidiary Guarantor – Medtronic Luxco
Guarantees of Medtronic Luxco Senior Notes
-
Parent Company Guarantor – Medtronic plc
-
Subsidiary Issuer – Medtronic Luxco
-
Subsidiary Guarantor – Medtronic, Inc.
Guarantees of CIFSA Senior Notes
-
Parent Company Guarantor – Medtronic plc
-
Subsidiary Issuer – CIFSA
-
Subsidiary Guarantors – Medtronic Luxco, Covidien Ltd., and Covidien Group Holdings Ltd. (CIFSA Subsidiary Guarantors)
The following tables present summarized financial information for the three months ended July 26, 2024 and summarized balance sheet information at July 26, 2024 and April 26, 2024 for the obligor groups of Medtronic and Medtronic Luxco Senior Notes, and CIFSA Senior Notes. The obligor group consists of the parent company guarantor, subsidiary issuer, and subsidiary guarantors for the applicable senior notes. The summarized financial information is presented after elimination of (i) intercompany transactions and balances among the guarantors and issuers and (ii) equity in earnings from and investments in any subsidiary that is a non-guarantor or issuer.
The summarized results of operations information for the three months ended July 26, 2024 was as follows:
| (in millions) | Medtronic & Medtronic Luxco Senior Notes (1) | CIFSA Senior Notes (2) | |||||||||
| Net sales | $ | 708 | $ | — | |||||||
| Operating profit | 78 | 11 | |||||||||
| (Loss) income before income taxes | (69) | 24 | |||||||||
| Net (loss) income attributable to Medtronic | (65) | 26 |
The summarized balance sheet information at July 26, 2024 was as follows:
| (in millions) | Medtronic & Medtronic Luxco Senior Notes (1) | CIFSA Senior Notes (2) | |||||||||
| Total current assets(3) | $ | 15,027 | $ | 4,164 | |||||||
| Total noncurrent assets(4) | 11,514 | 9,017 | |||||||||
| Total current liabilities(5) | 23,683 | 8,270 | |||||||||
| Total noncurrent liabilities(6) | 35,898 | 26,152 | |||||||||
| Noncontrolling interests | 213 | 213 |
(1)The Medtronic Senior Notes and Medtronic Luxco Senior Notes obligor group consists of the following entities: Medtronic plc, Medtronic Luxco, and Medtronic, Inc. Refer to the guarantee summary above for further details.
(2)The CIFSA Senior Notes obligor group consists of the following entities: Medtronic plc, Medtronic Luxco, CIFSA, and CIFSA Subsidiary Guarantors. Refer to the guarantee summary above for further details.
(3)Includes receivables due from non-guarantor subsidiaries of $11.9 billion and $1.7 billion for Medtronic & Medtronic Luxco Senior Notes, and CIFSA Senior Notes, respectively.
(4)Includes loans receivable due from non-guarantor subsidiaries of $5.2 billion and $8.8 billion for Medtronic & Medtronic Luxco Senior Notes, and CIFSA Senior Notes, respectively.
(5)Includes payables due to non-guarantor subsidiaries of $20.1 billion and $6.4 billion for Medtronic & Medtronic Luxco Senior Notes, and CIFSA Senior Notes, respectively.
(6)Includes loans payable due to non-guarantor subsidiaries of $7.7 billion and $7.7 billion for Medtronic & Medtronic Luxco Senior Notes, and CIFSA Senior Notes, respectively.
The summarized balance sheet information at April 26, 2024 was as follows:
| (in millions) | Medtronic & Medtronic Luxco Senior Notes (1) | CIFSA Senior Notes (2) | |||||||||
| Total current assets(3) | $ | 17,389 | $ | 4,179 | |||||||
| Total noncurrent assets(4) | 11,548 | 19,246 | |||||||||
| Total current liabilities(5) | 25,228 | 43,416 | |||||||||
| Total noncurrent liabilities(6) | 33,508 | 26,995 | |||||||||
| Noncontrolling interests | 206 | 206 |
(1)The Medtronic Senior Notes and Medtronic Luxco Senior Notes obligor group consists of the following entities: Medtronic plc, Medtronic Luxco, and Medtronic, Inc. Refer to the guarantee summary above for further details.
(2)The CIFSA Senior Notes obligor group consists of the following entities: Medtronic plc, Medtronic Luxco, CIFSA, and CIFSA Subsidiary Guarantors. Refer to the guarantee summary above for further details.
(3)Includes receivables due from non-guarantor subsidiaries of $14.3 billion and $1.7 billion for Medtronic & Medtronic Luxco Senior Notes, and CIFSA Senior Notes, respectively.
(4)Includes loans receivable due from non-guarantor subsidiaries of $5.2 billion and $19.1 billion for Medtronic & Medtronic Luxco Senior Notes, and CIFSA Senior Notes, respectively.
(5)Includes payables due to non-guarantor subsidiaries of $21.8 billion and $42.1 billion for Medtronic & Medtronic Luxco Senior Notes, and CIFSA Senior Notes, respectively.
(6)Includes loans payable due to non-guarantor subsidiaries of $7.7 billion and $7.7 billion for Medtronic & Medtronic Luxco Senior Notes, and CIFSA Senior Notes, respectively.
CAUTIONARY NOTE REGARDING FORWARD-LOOKING STATEMENTS
This Quarterly Report on Form 10-Q, and other written reports of Medtronic plc, organized under the laws of Ireland (together with its consolidated subsidiaries, Medtronic, the Company, or we, us, or our), and oral statements made by or with the approval of one of the Company’s executive officers from time to time, may include “forward-looking” statements. All statements other than statements of historical fact contained in this Quarterly Report on Form 10-Q, including statements regarding our future results of operations and financial position, business strategy and plans, objectives of management for future operations and current expectations or forecasts of future results, are forward-looking statements. These statements involve known and unknown risks, uncertainties, and other important factors that may cause our actual results, performance, or achievements to be materially different from any future results, performance, or achievements expressed or implied by the forward-looking statements. Our forward-looking statements may include statements related to our growth and growth strategies, developments in the markets for our products, therapies and services, financial results, product development launches and effectiveness, research and development strategy, regulatory approvals, competitive strengths, the potential or anticipated direct or indirect impact of public health crises and geopolitical conflicts on our business, results of operations and/or financial condition, restructuring and cost-saving initiatives, intellectual property rights, litigation and tax matters, governmental proceedings and investigations, mergers and acquisitions, divestitures, market acceptance of our products, therapies and services, accounting estimates, financing activities, ongoing contractual obligations, working capital adequacy, value of our investments, our effective tax rate, our expected returns to shareholders, and sales efforts. In some cases, such statements may be identified by the use of terminology such as “anticipate,” “believe,” “could,” “estimate,” “expect,” “forecast,” “intend,” “looking ahead,” “may,” “plan,” “possible,” “potential,” “project,” “should,” “will,” and similar words or expressions. Forward-looking statements in this Quarterly Report include, but are not limited to, statements regarding: our ability to drive long-term shareholder value; development and future launches of products and continued or future acceptance of products, therapies and services in our segments; expected timing for completion of research studies relating to our products; market positioning and performance of our products, including stabilization of certain product markets; divestitures and the potential benefits thereof; the costs and benefits of integrating previous acquisitions; anticipated timing for United States (U.S.) Food and Drug Administration (U.S. FDA) and non-U.S. regulatory approval of new products; increased presence in new markets, including markets outside the U.S.; changes in the market and our market share; acquisitions and investment initiatives, including the timing of regulatory approvals as well as integration of acquired companies into our operations; the resolution of tax matters; the effectiveness of our development activities in reducing patient care costs and hospital stay lengths; our approach towards cost containment; our expectations regarding healthcare costs, including potential changes to reimbursement policies and pricing pressures; our expectations regarding changes to patient standards of care; our ability to identify and maintain successful business partnerships; the elimination of certain positions or costs related to restructuring initiatives; outcomes in our litigation matters and governmental proceedings and investigations; general economic conditions; the adequacy of available working capital and our working capital needs; our payment of dividends and redemption of shares; the continued strength of our balance sheet and liquidity; our accounts receivable exposure; and the potential impact of our compliance with governmental regulations and accounting guidance.
We have based these forward-looking statements largely on our current expectations and projections about future events and financial trends that we believe may affect our business, results of operations, financial condition, and/or cash flows. These forward-looking statements speak only as of the date of this Quarterly Report on Form 10-Q and are subject to a number of risks, uncertainties and assumptions described in the “Risk Factors” section and elsewhere in our Annual Report on Form 10-K. Because forward-looking statements are inherently subject to risks and uncertainties, some of which cannot be predicted or quantified, you should not rely on these forward-looking statements as predictions of future events. One must carefully consider forward-looking statements and understand that such forward-looking statements are inherently subject to risks and uncertainties, some of which cannot be predicted or quantified, and involve a variety of risks and uncertainties, known and unknown, including, among others, those discussed in the sections entitled “Government Regulation” within “Item 1. Business” and “Item 1A. Risk Factors” in our Annual Report on Form 10-K, as well as those related to:
-
competition in the medical device industry;
-
delays in regulatory approvals;
-
public health crises;
-
reduction or interruption in our supply;
-
failure to complete or achieve the intended benefits of acquisitions or divestitures;
-
adverse regulatory action;
-
laws and governmental regulations;
-
litigation results;
-
quality problems;
-
healthcare policy changes;
-
cybersecurity and privacy incidents;
-
international operations, including the impact of armed conflicts;
-
self-insurance;
-
commercial insurance;
-
changes in applicable tax rates;
-
positions taken by taxing authorities;
-
decreasing selling prices and pricing pressure;
-
liquidity shortfalls;
-
fluctuations in currency exchange rates;
-
inflation; or
-
disruption of our current plans and operations.
Consequently, no forward-looking statement may be guaranteed, and actual results may vary materially from those projected in the forward-looking statements. We intend to take advantage of the Safe Harbor provisions of the Private Securities Litigation Reform Act of 1995 regarding our forward-looking statements and are including this sentence for the express purpose of enabling us to use the protections of the safe harbor with respect to all forward-looking statements. While we may elect to update these forward-looking statements at some point in the future, whether as a result of any new information, future events, or otherwise, we have no current intention of doing so except to the extent required by applicable law.
Previous: Item 1. Financial Statements · Next: Item 3. Quantitative and Qualitative Disclosures About Market Risk