 filings.tools
MetLife 10-K 2022-12-31
Filed 2023-02-23. 23 sections, 1605K characters. Original on sec.gov · Markdown · JSON
Cover and table of contents
UNITED STATES SECURITIES AND EXCHANGE COMMISSION
Washington, D.C. 20549
__________________________
Form 10-K
(Mark One)
| ☑ | ANNUAL REPORT PURSUANT TO SECTION 13 OR 15(d) OF THE SECURITIES EXCHANGE ACT OF 1934 |
For the fiscal year ended December 31, 2022
or
| ☐ | TRANSITION REPORT PURSUANT TO SECTION 13 OR 15(d) OF THE SECURITIES EXCHANGE ACT OF 1934 |
For the transition period from to
Commission file number: 001-15787
MetLife, Inc.
(Exact name of registrant as specified in its charter)
| Delaware | 13-4075851 | |||||||||||||
| (State or other jurisdiction of incorporation or organization) | (I.R.S. Employer Identification No.) | |||||||||||||
| 200 Park Avenue, | New York, | NY | 10166-0188 | |||||||||||
| (Address of principal executive offices) | (Zip Code) |
(212) 578-9500
(Registrant’s telephone number, including area code)
Securities registered pursuant to Section 12(b) of the Act:
| Title of each class | Trading Symbol(s) | Name of each exchange on which registered | ||||||
| Common Stock, par value $0.01 | MET | New York Stock Exchange | ||||||
| Floating Rate Non-Cumulative Preferred Stock, Series A, par value $0.01 | MET PRA | New York Stock Exchange | ||||||
| Depositary Shares, each representing a 1/1,000th interest in a share of 5.625% Non-Cumulative Preferred Stock, Series E | MET PRE | New York Stock Exchange | ||||||
| Depositary Shares, each representing a 1/1,000th interest in a share of 4.75% Non-Cumulative Preferred Stock, Series F | MET PRF | New York Stock Exchange |
Securities registered pursuant to Section 12(g) of the Act:
5.875% Fixed-to-Floating Rate Non-Cumulative Preferred Stock, Series D, par value $0.01
3.850% Fixed Rate Reset Non-Cumulative Preferred Stock, Series G, par value $0.01
Indicate by check mark if the registrant is a well-known seasoned issuer, as defined in Rule 405 of the Securities Act. Yes þ No ¨
Indicate by check mark if the registrant is not required to file reports pursuant to Section 13 or 15(d) of the Act. Yes ¨ No þ
Indicate by check mark whether the registrant: (1) has filed all reports required to be filed by Section 13 or 15(d) of the Securities Exchange Act of 1934 during the preceding 12 months (or for such shorter period that the registrant was required to file such reports), and (2) has been subject to such filing requirements for the past 90 days. Yes þ No ¨
Indicate by check mark whether the registrant has submitted electronically every Interactive Data File required to be submitted pursuant to Rule 405 of Regulation S-T (§ 232.405 of this chapter) during the preceding 12 months (or for such shorter period that the registrant was required to submit such files). Yes þ No ¨
Indicate by check mark whether the registrant is a large accelerated filer, an accelerated filer, a non-accelerated filer, a smaller reporting company, or an emerging growth company. See the definitions of “large accelerated filer,” “accelerated filer,” “smaller reporting company,” and “emerging growth company” in Rule 12b-2 of the Exchange Act.
| Large accelerated filer | þ | Accelerated filer | ☐ | ||||||||
| Non-accelerated filer | ☐ | Smaller reporting company | ☐ | ||||||||
| Emerging growth company | ☐ |
If an emerging growth company, indicate by check mark if the registrant has elected not to use the extended transition period for complying with any new or revised financial accounting standards provided pursuant to Section 13(a) of the Exchange Act. ¨
Indicate by check mark whether the registrant has filed a report on and attestation to its management’s assessment of the effectiveness of its internal control over financial reporting under Section 404(b) of the Sarbanes-Oxley Act (15 U.S.C. 7262(b)) by the registered public accounting firm that prepared or issued its audit report. ☑
If securities are registered pursuant to Section 12(b) of the Act, indicate by check mark whether the financial statements of the registrant included in the filing reflect the correction of an error to previously issued financial statements. ¨
Indicate by check mark whether any of those error corrections are restatements that required a recovery analysis of incentive-based compensation received by any of the registrant’s executive officers during the relevant recovery period pursuant to §240.10D-1(b). ¨
Indicate by check mark whether the registrant is a shell company (as defined in Rule 12b-2 of the Exchange Act). Yes ☐ No þ
The aggregate market value of the voting and non-voting common equity held by non-affiliates of the registrant at June 30, 2022 was approximately $50.1 billion.
At February 14, 2023, 774,362,092 shares of the registrant’s common stock were outstanding.
DOCUMENTS INCORPORATED BY REFERENCE
Part III of this Form 10-K incorporates by reference certain information from the registrant’s definitive proxy statement for the Annual Meeting of Shareholders to be held on June 20, 2023, to be filed by the registrant with the Securities and Exchange Commission pursuant to Regulation 14A not later than 120 days after the year ended December 31, 2022.
Table of Contents
As used in this Form 10-K, “MetLife,” the “Company,” “we,” “our” and “us” refer to MetLife, Inc., a Delaware corporation incorporated in 1999, its subsidiaries and affiliates.
Note Regarding Forward-Looking Statements
This Annual Report on Form 10‑K, including Management’s Discussion and Analysis of Financial Condition and Results of Operations, may contain or incorporate by reference information that includes or is based upon forward-looking statements within the meaning of the Private Securities Litigation Reform Act of 1995. Forward-looking statements give expectations or forecasts of future events and do not relate strictly to historical or current facts. They use words and terms such as “anticipate,” “assume,” “believe,” “continue,” “could,” “estimate,” “expect,” “if,” “intend,” “likely,” “may,” “plan,” “potential,” “project,” “should,” “will,” “would” and other words and terms of similar meaning or that are otherwise tied to future periods or future performance, in each case in all derivative forms. They include statements relating to future actions, prospective services or products, future performance or results of current and anticipated services or products, future sales efforts, future expenses, the outcome of contingencies such as legal proceedings, and future trends in operations and financial results.
Many factors determine Company results, and they involve unpredictable risks and uncertainties. Our forward-looking statements depend on our assumptions, our expectations, and our understanding of the economic environment, but they may be inaccurate and may change. We do not guarantee any future performance. Our results could differ materially from those we express or imply in forward-looking statements. The risks, uncertainties and other factors, including those relating to the COVID-19 pandemic, identified in MetLife, Inc.’s filings with the U.S. Securities and Exchange Commission, and others, may cause such differences. These factors include:
(1) economic condition difficulties, including risks relating to public health, interest rates, credit spreads, equity, real estate, obligors and counterparties, government default, currency exchange rates, derivatives, climate change and terrorism and security;
(2) global capital and credit market adversity;
(3) credit facility inaccessibility;
(4) financial strength or credit ratings downgrades;
(5) unavailability, unaffordability, or inadequate reinsurance;
(6) statutory life insurance reserve financing costs or limited market capacity;
(7) legal, regulatory, and supervisory and enforcement policy changes;
(8) changes in tax rates, tax laws or interpretations;
(9) litigation and regulatory investigations;
(10) London Interbank Offered Rate discontinuation and transition to alternative reference rates;
(11) unsuccessful efforts to meet all environmental, social, and governance standards or to enhance our sustainability;
(12) MetLife, Inc.’s inability to pay dividends and repurchase common stock;
(13) MetLife, Inc.’s subsidiaries’ inability to pay dividends to MetLife, Inc.;
(14) investment defaults, downgrades, or volatility;
(15) investment sales or lending difficulties;
(16) collateral or derivative-related payments;
(17) investment valuations, allowances, or impairments changes;
(18) claims or other results that differ from our estimates, assumptions, or models;
(19) global political, legal, or operational risks;
(20) business competition;
(21) technological changes;
(22) catastrophes;
(23) climate changes or responses to it;
(24) deficiencies in our closed block;
(25) goodwill or other asset impairment, or deferred income tax asset allowance;
(26) impairment of value of business acquired, value of distribution agreements acquired or value of customer relationships acquired;
(27) product guarantee volatility, costs, and counterparty risks;
(28) risk management failures;
(29) insufficient protection from operational risks;
(30) failure to protect confidentiality and integrity of data or other cybersecurity or disaster recovery failures;
(31) accounting standards changes;
(32) excessive risk-taking;
(33) marketing and distribution difficulties;
(34) pension and other postretirement benefit assumption changes;
(35) inability to protect our intellectual property or avoid infringement claims;
(36) acquisition, integration, growth, disposition, or reorganization difficulties;
(37) Brighthouse Financial, Inc. separation risks;
(38) MetLife, Inc.’s Board of Directors influence over the outcome of stockholder votes through the voting provisions of the MetLife Policyholder Trust; and
(39) legal- and corporate governance-related effects on business combinations.
MetLife, Inc. does not undertake any obligation to publicly correct or update any forward-looking statement if MetLife, Inc. later becomes aware that such statement is not likely to be achieved. Please consult any further disclosures MetLife, Inc. makes on related subjects in subsequent reports to the U.S. Securities and Exchange Commission.
Note Regarding Reliance on Statements in Our Contracts
See “Exhibit Index — Note Regarding Reliance on Statements in Our Contracts” for information regarding agreements included as exhibits to this Annual Report on Form 10-K.
Part I
Item 1. Business
Index to Business
Business Overview & Strategy
As used in this Form 10-K, “MetLife,” the “Company,” “we,” “our” and “us” refer to MetLife, Inc., a Delaware corporation incorporated in 1999, its subsidiaries and affiliates.
MetLife is one of the world’s leading financial services companies, providing insurance, annuities, employee benefits and asset management. We hold leading market positions in the United States (“U.S.”), Japan, Latin America, Asia, Europe and the Middle East. We are also one of the largest institutional investors in the U.S. with a general account portfolio invested primarily in fixed income securities (corporate, structured products, municipals, and government and agency) and mortgage loans, as well as real estate, real estate joint ventures, other limited partnerships and equity securities.
Our well-recognized brand, globally diversified and market-leading businesses, competitive and innovative product offerings and financial strength and expertise should help drive future growth and enhance shareholder value. We will continue to execute on our Next Horizon strategy, creating value focusing on the following three pillars:

| ● | Focus |
| – | Generate strong free cash flow by deploying capital and resources to the highest value opportunities. |
| ● | Simplify |
| – | Simplify our business to deliver operational efficiency and an outstanding customer experience. |
| ● | Differentiate |
| – | Drive competitive advantage through our brand, scale, talent, and innovation. |
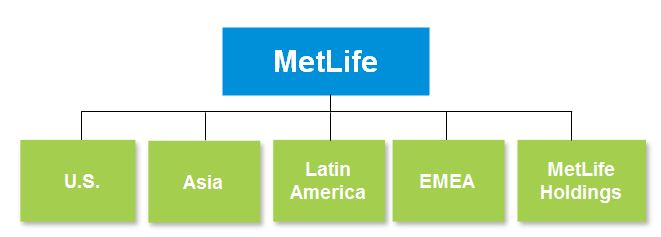
MetLife is organized into five segments: U.S.; Asia; Latin America; Europe, the Middle East and Africa (“EMEA”); and MetLife Holdings. In addition, the Company reports certain of its results of operations in Corporate & Other. See “— Segments and Corporate & Other” and Note 2 of the Notes to the Consolidated Financial Statements for further information on the Company’s segments and Corporate & Other.
In the U.S., we provide a variety of insurance and financial services products, including life, dental, disability, vision, accident & health, capital market investment, risk solutions, stable value and annuities. Outside the U.S., we provide life, accident & health and credit insurance, as well as retirement & savings products.
Segments and Corporate & Other
U.S.
Our businesses in the U.S. segment offer a broad range of protection products and services aimed at serving the financial needs of our customers throughout their lives. These products are sold to corporations and their respective employees, other institutions and their respective members, as well as individuals. Our U.S. segment is organized into two businesses: Group Benefits and Retirement and Income Solutions (“RIS”).
Group Benefits
We have built a leading position in the U.S. group insurance market through long-standing relationships with many of the largest corporate employers in the U.S.
Our Group Benefits business offers life insurance, dental, group short- and long-term disability (“LTD”), individual disability, accidental death and dismemberment (“AD&D”) insurance, vision, and accident & health insurance, as well as prepaid legal plans and pet insurance. We also sell administrative services-only (“ASO”) arrangements to some employers.
We distribute Group Benefits products and services through a sales force primarily comprised of MetLife employees that is segmented by the size of the target customer. Account executives sell either directly to corporate and other group customers or through an intermediary, such as a broker or consultant. Employers have been emphasizing voluntary products and, as a result, we have increased our focus on communicating and marketing to employees in order to further foster sales of those products.
We have entered into several operating joint ventures and other arrangements with third parties to expand opportunities to market and distribute Group Benefits products and services. We also sell our Group Benefits products and services through sponsoring associations and affinity groups and provide life, dental, accident & health, and vision coverage to certain employees of the U.S. Government. We have longstanding relationships with these employees and continue to cultivate and expand them through additional product offerings.
Group Benefits business quarterly claims experience may vary, as seasonal illnesses effect mortality and morbidity and due to utilization rate fluctuation in our non-medical health businesses. Annual benefit renewal implementation, enrollment, and marketing costs normally elevate Group Benefits business’ expenses in the fourth quarter.
| Major Products | |||||
| Term Life Insurance | A guaranteed benefit upon the death of the insured for a specified time period in return for the periodic payment of premiums. Premiums may be guaranteed at a level amount for the coverage period or may be non-level and non-guaranteed. Term contracts expire without value at the end of the coverage period when the insured party is still living. | ||||
| Variable Life Insurance | Insurance coverage through a contract that gives the policyholder flexibility in investment choices and, depending on the product, in premium payments and coverage amounts, with certain guarantees. Premiums and account balances can be d |
Showing the first 8K of 132K characters. Open the full section
Item 1A. Risk Factors
Any or each of the events described below may (or may continue to) adversely affect the global economy, global financial markets, our reputation, our regulatory, customer, or other relationships, our results of operations, our liquidity or cash flows, our statutory capital position, our ability to meet our obligations, our credit and financial strength ratings, our financial condition, or the market price of our common stock. The effects may vary depending on timing, product, market, region or segment.
Many of these risks are interrelated and could occur under similar business and economic conditions, and the occurrence of any of them may cause others to emerge or worsen. Such combinations could materially increase the severity of the cumulative or separate impact of these risks.
These risk factors do not describe all potential risks that could affect MetLife. You should carefully consider the risk factors together with other information contained in this Annual Report on Form 10-K, including “Business,” “Management’s Discussion and Analysis of Financial Condition and Results of Operations” and the consolidated financial statements and accompanying notes in “Financial Statements and Supplementary Data,” and other reports and materials MetLife submits to the SEC.
Economic Environment and Capital Markets Risks
We May Face Difficult Economic Conditions
Market factors, including interest rates, credit spreads, equity prices, derivative prices and availability, real estate conditions, foreign currency exchange rates, consumer and government spending, government default or spending reductions to avoid default, business investment, climate change, public health risks, volatility, disruptions and strength of the capital markets, deflation and inflation, and government actions in response thereto, may inhibit revenue growth, reduce investment opportunities and result in investment losses, derivative losses, changes in insurance liabilities, impairments, increased valuation allowances, increases in reserves, reduced net investment income and changes in unrealized gain or loss positions.
Higher unemployment, changes to inflation, lower family income, lower corporate earnings, greater government regulation, lower business investment, lower consumer spending, elevated incidence of claims, adverse utilization of benefits relative to our best estimate expectations, lapses or surrenders of policies, reduced demand for our products, and deferred or canceled payments of insurance premiums may negatively affect our earnings and capitalization.
Declining equity or debt markets may decrease the account value of our products, reducing certain fees generated by these products, which may increase the level of insurance liabilities we carry and require us to increase funding to our captive reinsurers. Additionally, higher or lower interest rates may impact the value and/or reduce returns in fixed income investments.
Public Health Risks
Pandemics and other public health issues, and governmental, business, and consumer reactions to them, have affected and may continue to affect economic conditions. They have and may continue to cause illnesses and deaths, changes in consumer or business confidence, behavior and investment and business activity, changes to interest rates and other market risk factors, and governmental or other restrictions on economic activity for prolonged periods. Any of these issues may cause or exacerbate any of the difficult economic conditions we describe in these risk factors.
Interest Rate Risks
Some of our products and investments expose us to interest rate risks, including changes in the difference between short-term and long-term interest rates, which may reduce or eliminate our investment spread and net income.
Interest rate increases may harm our profitability. During rapidly increasing interest rates, we may not be able to replace the investments in our general account with higher yielding investments needed to fund the higher crediting rates required to stay competitive. This could result in a lower spread, lower profitability, decreased sales, and greater loss of existing contracts and related assets. In addition, policy loans, surrenders and withdrawals may increase as policyholders seek investments with higher perceived returns. This may result in cash outflows requiring the sale of investments on less favorable terms, resulting in investment losses and reductions in net income. Reductions in net income may in turn harm our credit instrument covenants and rating agency assessment of our financial condition. Interest rate increases may harm the value of our investment portfolio, for example, by decreasing the estimated fair value of fixed income securities, and may increase our daily settlement payments on interest rate futures and cleared swaps, resulting in increased cash outflows and liquidity needs. Furthermore, if interest rates rise, our unrealized gains on fixed income securities may decrease and
our unrealized losses may increase. We would recognize the accumulated change in estimated fair value of these fixed income securities in net income when we realize a gain or loss upon the sale of the security or we determine that the decline in estimated fair value is due to a credit loss. During inflationary periods with rising interest rates, the value of fixed income investments falls which could increase realized and unrealized losses, resulting in additional deferred tax assets that may not be realizable. Finally, an increase in interest rates may decrease fee income associated with a decline in the value of variable annuity account balances invested in fixed income funds.
The rapidly rising interest rate environment may cause the interest maintenance reserve (“IMR”) balance of certain of our insurance subsidiaries to decrease or become negative because of their bond sales at a capital loss. Current statutory accounting guidance requires the non-admittance of negative IMR. If the IMR balance of our insurance subsidiaries becomes negative, surplus and financial strength of certain of our insurance subsidiaries may not be captured in the Consolidated Financial Statements due to lower surplus and RBC ratios. The NAIC is considering whether the allowance of a negative IMR balance in statutory accounting should be permitted, although the outcome of this initiative is uncertain.
Federal Reserve Board monetary policy (and that of other central banks) may also impact the pricing levels of risk-bearing investments and may harm our investment income or product sales.
The measures we take to mitigate the risks of investing in a changing interest rate environment, such as mitigating our fixed income investments relative to our interest rate sensitive liabilities, may not be sufficient. For some of our liability portfolios, we may not be able to invest assets at the full liability duration, thereby creating some asset/liability mismatch. In addition, asymmetrical and non-economic accounting may cause material changes to our net income and stockholders’ equity because we record our non-qualified derivatives at fair value through earnings, while certain hedged items may follow an accrual-based accounting model or are recorded at fair value through other comprehensive income.
Low interest rates and risk asset returns may reduce income from our investment portfolio, increase our liabilities for claims and future benefits, and increase the cost of risk transfer measures, decreasing our profit margins. During certain market events, such as a global credit crisis, a market downturn, or sustained low market returns, we may incur significant losses due to, among other reasons, losses incurred in our general account and the impact of guarantees, including increases in liabilities, capital maintenance obligations and collateral requirements. In addition, during periods of sustained lower interest rates, we may need to reinvest p
Showing the first 8K of 78K characters. Open the full section
Item 1B. Unresolved Staff Comments
MetLife has no unresolved comments from the SEC staff regarding its periodic or current reports under the Exchange Act.
Item 2. Properties
Not applicable.
Item 3. Legal Proceedings
See Note 21 of the Notes to the Consolidated Financial Statements.
Item 4. Mine Safety Disclosures
Not applicable.
Part II
Item 5. Market for Registrant’s Common Equity, Related Stockholder Matters and Issuer Purchases of Equity Securities
Issuer Common Equity
MetLife, Inc.’s common stock, par value $0.01 per share, began trading on the New York Stock Exchange under the symbol “MET” on April 5, 2000.
At February 14, 2023, there were 73,182 stockholders of record of our common stock.
See Item 12 for information about our equity compensation plans.
Issuer Purchases of Equity Securities
Purchases of MetLife, Inc. common stock made by or on behalf of MetLife, Inc. or its affiliates during the quarter ended December 31, 2022 are set forth below:
| Period | Total Number of Shares Purchased (1) | Average Price Paid per Share | Total Number of Shares Purchased as Part of Publicly Announced Plans or Programs | Maximum Number (or Approximate Dollar Value) of Shares that May Yet Be Purchased Under the Plans or Programs (2) | ||||||||||||||||||||||
| October 1 - October 31, 2022 | 2,790,495 | $63.24 | 2,790,495 | $1,625,053,649 | ||||||||||||||||||||||
| November 1 - November 30, 2022 | 2,301,836 | $74.94 | 2,301,836 | $1,452,554,390 | ||||||||||||||||||||||
| December 1 - December 31, 2022 | 3,373,502 | $73.37 | 3,373,371 | $1,205,055,962 | ||||||||||||||||||||||
| Total | 8,465,833 | 8,465,702 |
(1)During the periods October 1 through October 31, 2022, November 1 through November 30, 2022 and December 1 through December 31, 2022, separate account index funds purchased 0 shares, 0 shares and 131 shares, respectively, of MetLife, Inc. common stock on the open market in non-discretionary transactions.
(2)In May 2022, MetLife, Inc. announced that its Board of Directors authorized $3.0 billion of common stock repurchases. At December 31, 2022, MetLife, Inc. had $1.2 billion of common stock repurchases remaining under the authorization. For more information on common stock repurchases, see “Risk Factors — Capital Risks — We May Not be Able to Pay Dividends or Repurchase Our Stock Due to Legal and Regulatory Restrictions or Cash Buffer Needs,” “Management’s Discussion and Analysis of Financial Condition and Results of Operations — Liquidity and Capital Resources — The Company — Liquidity and Capital Uses — Common Stock Repurchases” and Note 16 of the Notes to the Consolidated Financial Statements.
Common Stock Performance Graph
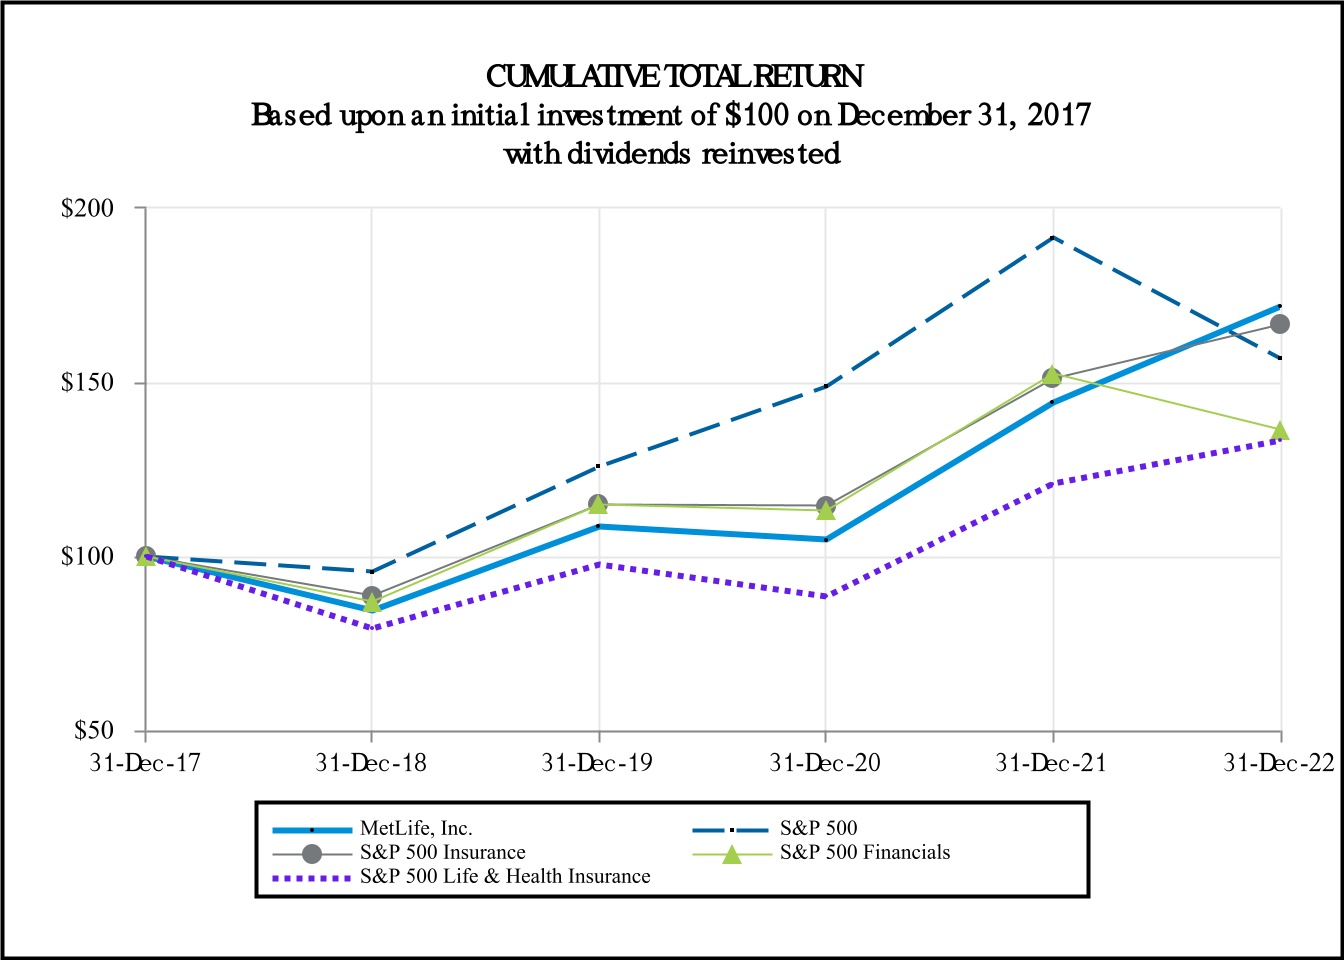
The graph and table below compare the total return on our common shares with the total return on the S&P Global Ratings (“S&P”) 500, S&P 500 Insurance, S&P 500 Financials and S&P 500 Life & Health Insurance indices, respectively, for the five-year period ended on December 31, 2022. The graph and table show the total return on a hypothetical $100 investment in our common shares and in each index, respectively, on December 31, 2017, including the reinvestment of all dividends. We have added the S&P 500 Life & Health Insurance Index to this Annual Report on Form 10-K, as the companies in this index comprise a more relevant comparator group in terms of business, scale, performance drivers, and competition for investor capital than the other indices included in the graph and table below. The graph and table below shall not be deemed to be “soliciting material” or to be “filed,” or to be incorporated by reference in future filings with the SEC, or to be subject to the liabilities of Section 18 of the Exchange Act, except to the extent that we specifically incorporate it by reference into a document filed under the Securities Act or the Exchange Act.
| As of December 31, | ||||||||||||||||||||||||||||||||||||||
| 2017 | 2018 | 2019 | 2020 | 2021 | 2022 | |||||||||||||||||||||||||||||||||
| MetLife, Inc. common stock | $ | 100.00 | $ | 84.23 | $ | 108.53 | $ | 104.82 | $ | 144.05 | $ | 171.75 | ||||||||||||||||||||||||||
| S&P 500 | 100.00 | 95.62 | 125.72 | 148.85 | 191.58 | 156.88 | ||||||||||||||||||||||||||||||||
| S&P 500 Insurance | 100.00 | 88.79 | 114.88 | 114.38 | 151.12 | 166.42 | ||||||||||||||||||||||||||||||||
| S&P 500 Financials | 100.00 | 86.97 | 114.91 | 112.96 | 152.54 | 136.48 | ||||||||||||||||||||||||||||||||
| S&P 500 Life & Health Insurance | 100.00 | 79.23 | 97.60 | 88.35 | 120.76 | 133.25 |
Item 6. Reserved
Item 7. Management’s Discussion and Analysis of Financial Condition and Results of Operations
Index to Management’s Discussion and Analysis of Financial Condition and Results of Operations
Forward-Looking Statements and Other Financial Information
For purposes of this discussion, “MetLife,” the “Company,” “we,” “our” and “us” refer to MetLife, Inc., a Delaware corporation incorporated in 1999, its subsidiaries and affiliates. This discussion should be read in conjunction with “Note Regarding Forward-Looking Statements,” “Risk Factors,” “Quantitative and Qualitative Disclosures About Market Risk” and the Company’s consolidated financial statements included elsewhere herein.
This Management’s Discussion and Analysis of Financial Condition and Results of Operations may contain or incorporate by reference information that includes or is based upon forward-looking statements within the meaning of the Private Securities Litigation Reform Act of 1995. See “Note Regarding Forward-Looking Statements” for cautionary language regarding forward-looking statements.
This Management’s Discussion and Analysis of Financial Condition and Results of Operations includes references to our performance measures, adjusted earnings and adjusted earnings available to common shareholders, that are not based on GAAP. See “— Non-GAAP and Other Financial Disclosures” for definitions and a discussion of these and other financial measures, and “— Results of Operations” and “— Investments” for reconciliations of historical non-GAAP financial measures to the most directly comparable GAAP measures.
For information relating to the Company’s financial condition and results of operations as of and for the year ended December 31, 2020, as well as for the year ended December 31, 2021 compared with the year ended December 31, 2020, see “Management’s Discussion and Analysis of Financial Condition and Results of Operations” in MetLife, Inc.’s Annual Report on Form 10-K for the year ended December 31, 2021.
Executive Summary
Overview
MetLife is one of the world’s leading financial services companies, providing insurance, annuities, employee benefits and asset management. MetLife is organized into five segments: U.S.; Asia; Latin America; EMEA; and MetLife Holdings. In addition, the Company reports certain of its results of operations in Corporate & Other. See “Business — Segments and Corporate & Other” and Note 2 of the Notes to the Consolidated Financial Statements for further information on the Company’s segments and Corporate & Other.
Current Year Highlights
During 2022, adjusted premiums, fees and other revenues, net of foreign currency fluctuations, increased compared to 2021 driven by growth in our U.S. segment, primarily in our RIS business. Equity market returns had a less favorable impact on our private equity funds and hedge funds compared to 2021 and resulted in lower investment yields, however, positive net flows drove an increase in our investment portfolio. An unfavorable change in net investment gains (losses) primarily reflects 2022 losses versus 2021 gains on sales of fixed maturity securities and the 2021 gain on the sale of Metropolitan Property and Casualty Insurance Company and certain of its wholly-owned subsidiaries (collectively, “MetLife P&C”), partially offset by the 2021 losses on the sale of certain subsidiaries. Higher long-term interest rates drove an unfavorable change in net derivative gains (losses). Underwriting experience was favorable and reflected an overall decline in COVID-19 related claims. Our actuarial assumption review resulted in a gain in 2022 versus a charge in 2021. In addition, 2022 results include the favorable impact from a reinsurance recapture and the unfavorable impact from model refinements.
The following represents segment level results and percentage contributions to total segment level adjusted earnings available to common shareholders for the year ended December 31, 2022:
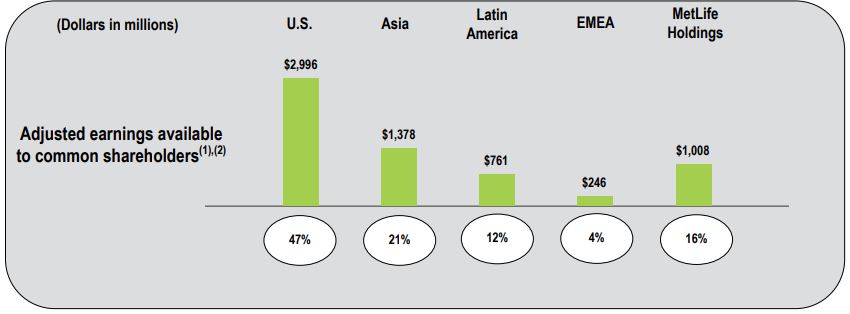
(1) Excludes Corporate & Other adjusted loss available to common shareholders of $844 million.
(2) Consistent with GAAP guidance for segment reporting, adjusted earnings is our GAAP measure of segment performance. For additional information, see Note 2 of the Notes to the Consolidated Financial Statements.
Year Ended December 31, 2022 Compared with the Year Ended December 31, 2021
 | Consolidated Results - Highlights | ||||||||||||||||
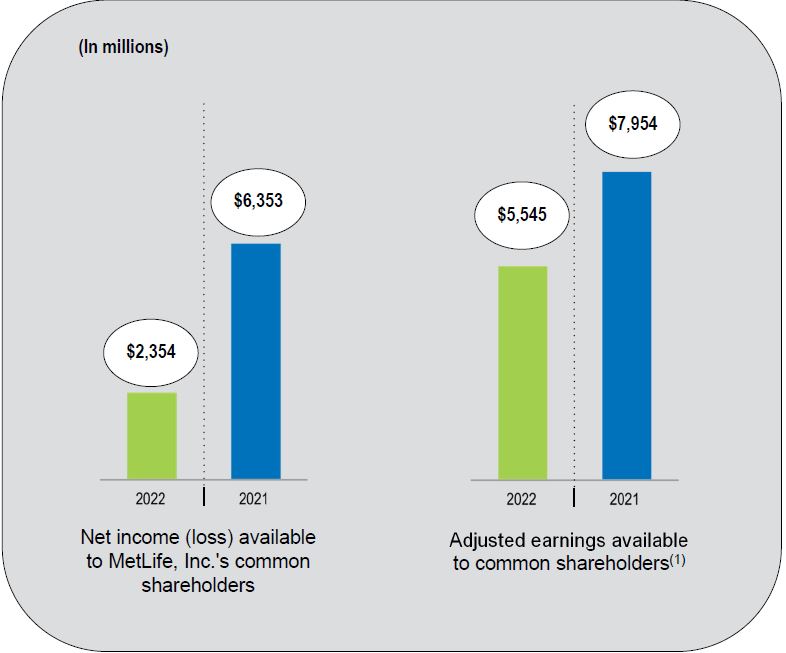
| Net income (loss) available to MetLife, Inc.’s common shareholders down $4.0 billion: | |||||||||||||||||
| • | Unfavorable change in net investment gains (losses) of $2.8 billion ($2.2 billion, net of income tax) | ||||||||||||||||
| • | Unfavorable change in net derivative gains (losses) of $144 million ($114 million, net of income tax)(2) | ||||||||||||||||
| • | Favorable change from actuarial assumption reviews of $356 million ($269 million, net of income tax)(3) | ||||||||||||||||
| • | Adjusted earnings available to common shareholders down $2.4 billion | ||||||||||||||||
Showing the first 8K of 370K characters. Open the full section
Item 7A. Quantitative and Qualitative Disclosures About Market Risk
The following discussion on market risk should be read in conjunction with “Management’s Discussion and Analysis of Financial Condition and Results of Operations — Risk Management.”
Market Risk Exposures
We regularly analyze our exposure to interest rate, foreign currency exchange rate and equity market price risk. As a result of that analysis, we have determined that the estimated fair values of certain assets and liabilities are materially exposed to changes in interest rates, foreign currency exchange rates and equity markets. We have exposure to market risk through our insurance operations and investment activities. For purposes of this disclosure, “market risk” is defined as the risk of loss due to potential changes in the value of assets and liabilities arising from fluctuation in the financial market and other economic factors.
Interest Rates
Our exposure to interest rate changes results most significantly from our holdings of fixed maturity securities AFS, mortgage loans and derivatives, as well as our interest rate sensitive liabilities. The fixed maturity securities AFS include U.S. and foreign government bonds, securities issued by government agencies, corporate bonds, mortgage-backed securities and ABS & CLO, all of which are mainly exposed to changes in medium- and long-term interest rates. The interest rate sensitive liabilities for purposes of this disclosure include debt, policyholder account balances related to certain investment type contracts, and embedded derivatives on variable annuities with guaranteed minimum benefits which have the same type of interest rate exposure (medium- and long-term interest rates) as fixed maturity securities AFS. The interest rate sensitive liabilities for purposes of this disclosure exclude a significant portion of the liabilities relating to insurance contracts. See “Risk Factors — Economic Environment and Capital Markets Risks — We May Face Difficult Economic Conditions.”
Foreign Currency Exchange Rates
Our exposure to fluctuations in foreign currency exchange rates against the U.S. dollar results from our holdings in non-U.S. dollar denominated fixed maturity and equity securities, mortgage loans, and certain liabilities, as well as through our investments in foreign subsidiaries. The foreign currency exchange rate liabilities for purposes of this disclosure exclude a significant portion of the liabilities relating to insurance contracts. The principal currencies that create foreign currency exchange rate risk in our investment portfolios and liabilities are the Japanese yen, the Euro and the British pound. Selectively, we use U.S. dollar assets to support certain long-duration foreign currency liabilities. Through our investments in foreign subsidiaries and joint ventures, we are primarily exposed to the Japanese yen, the Euro, the Australian dollar, the British pound, the Mexican peso, the Chilean peso and the Korean won. In addition to hedging with foreign currency swaps, forwards and options, local surplus in some countries may be held entirely or in part in U.S. dollar assets, which further minimize exposure to foreign currency exchange rate fluctuation risk. We have matched much of our foreign currency liabilities in our foreign subsidiaries with their respective foreign currency assets, thereby reducing our risk to foreign currency exchange rate fluctuation. See “Risk Factors — Economic Environment and Capital Markets Risks — We May Face Difficult Economic Conditions.”
Equity Market
Along with investments in equity securities, we have exposure to equity market risk through certain liabilities that involve long-term guarantees on equity performance such as embedded derivatives on variable annuities with guaranteed minimum benefits and certain policyholder account balances. Equity exposures associated with real estate and limited partnership interests are excluded from this discussion as they are not considered financial instruments under GAAP.
Management of Market Risk Exposures
We use a variety of strategies to manage interest rate, foreign currency exchange rate and equity market risk, including the use of derivatives.
Interest Rate Risk Management
To manage interest rate risk, we analyze interest rate risk using various models, including multi-scenario cash flow projection models that forecast cash flows of the liabilities and their supporting investments, including derivatives. These projections involve evaluating the potential gain or loss on most of our in-force business under various increasing and decreasing interest rate environments. The NYDFS regulations require that we perform some of these analyses annually as part of our review of the sufficiency of our regulatory reserves. For several of our legal entities, we maintain segmented operating and surplus asset portfolios for the purpose of ALM and the allocation of investment income to product lines. In the U.S., for each segment, invested assets greater than or equal to the GAAP liabilities net of certain non-invested assets allocated to the segment are maintained, with any excess allocated to Corporate & Other. The business segments may reflect differences in legal entity, statutory line of business and any product market characteristic which may drive a distinct investment strategy with respect to duration, liquidity or credit quality of the invested assets. Certain smaller entities make use of unsegmented general accounts for which the investment strategy reflects the aggregate characteristics of liabilities in those entities. We measure relative sensitivities of the value of our assets and liabilities to changes in key assumptions utilizing internal models. These models reflect specific product characteristics and include assumptions based on current and anticipated experience regarding lapse, mortality, morbidity and interest crediting rates. In addition, these models include asset cash flow projections reflecting interest payments, sinking fund payments, principal payments, bond calls, mortgage loan prepayments and defaults.
We employ product design, pricing and ALM strategies to reduce the potential effects of interest rate movements. Product design and pricing strategies include the use of surrender charges or restrictions on withdrawals in some products and the ability to reset crediting rates for certain products. ALM strategies include the use of derivatives. We also use reinsurance to mitigate interest rate risk.
We also use common industry metrics, such as duration and convexity, to measure the relative sensitivity of assets and liability values to changes in interest rates. In computing the duration of liabilities, we consider policyholder guarantees and how we intend to set indeterminate policy elements such as interest credits or dividends. Each asset portfolio or portfolio group has a duration target based on the liability duration and the investment objectives of that portfolio. Where a liability cash flow may exceed the maturity of available assets, we may support such liabilities with equity investments, derivatives or interest rate curve mismatch strategies.
Foreign Currency Exchange Rate Risk Management
MetLife has a well-established policy to manage foreign currency exchange rate exposures within its risk tolerance. In general, investments backing specific liabilities are currency matched. This is achieved through direct investments in matching currency or through the use of foreign currency exchange rate derivatives. Enterprise foreign currency exchange rate risk limits are established by the ERC. Management of each of our segments, with oversight from our FX Working Group and the ALM committee for the respective segment, is responsible for managing any foreign currency exchange rate exposure.
We use foreign currency swaps, forwards and options to mitigate the liability exposure, risk of loss and financial statement volatility associated with our investments in foreign subsidiaries, foreign currency denominated fixed income investments and the sale of certain insurance products.
Equity Market Risk Management
We manage equity market risk on an integrated basis with other risks through our ALM strategies, including the dynamic hedging with derivatives of certain variable annuity guarantee benefits, as well as reinsurance, in order to limit losses, minimize exposure to large risks, and provide additional capacity for future growth. We also manage equity market risk exposure in our investment portfolio through the use of derivatives. These derivatives include exchange-traded equity futures, equity index options contracts, TRRs and equity variance swaps.
Hedging Activities
We use derivative contracts primarily to hedge a wide range of risks including interest rate risk, foreign currency exchange rate risk, and equity market risk. Derivative hedges are designed to reduce risk on an economic basis while considering their impact on financial results under different accounting regimes, including GAAP and local statutory accounting. Our derivative hedge programs vary depending on the type of risk being hedged. Some hedge programs are asset or liability specific while others are portfolio hedges that reduce risk related to a group of liabilities or assets. Our use of derivatives by major hedge programs is as follows:
-
Risks Related to Guarantee Benefits — We use a wide range of derivative contracts to mitigate the risk associated with living guarantee benefits. These derivatives include equity and interest rate futures, interest rate swaps, currency futures/forwards, equity indexed options, TRRs, interest rate option contracts and equity variance swaps.
-
Minimum Interest Rate Guarantees — For certain liability contracts, we provide the contractholder a guaranteed minimum interest rate. These contracts include certain fixed annuities and other insurance liabilities. We purchase interest rate caps and floors to reduce risk associated with these liability guarantees.
-
Reinvestment Risk in Long-Duration Liability Contracts — Derivatives are used to hedge interest rate risk related to certain long-duration liability contracts. Hedges include interest rate swaps, swaptions and Treasury bond forwards.
-
Foreign Currency Exchange Rate Risk — We use foreign currency swaps, futures, forwards and options to hedge foreign currency exchange rate risk. These hedges are generally used to swap foreign currency denominated bonds, investments in foreign subsidiaries or equity market exposures to U.S. dollars. Our foreign subsidiaries also use these hedges to swap non-local currency assets to local currency, to match liabilities**.**
-
General ALM Hedging Strategies — In the ordinary course of managing our asset/liability risks, we use interest rate futures, interest rate swaps, interest rate caps, interest rate floors, and inflation swaps. These hedges are designed to reduce interest rate risk or inflation risk related to the existing assets or liabilities or related to expected future cash flows.
-
Macro Hedge Program — We use equity options, equity TRRs, interest rate swaptions, interest rate swaps and Treasury locks to mitigate the potential loss of legal entity statutory capital under stress scenarios.
Risk Measurement: Sensitivity Analysis
We measure market risk related to our market sensitive assets and liabilities based on changes in interest rates, foreign currency exchange rates and equity market prices utilizing a sensitivity analysis. For purposes of this disclosure, a significant portion of the liabilities relating to insurance contracts is excluded, as discussed further below. This analysis estimates the potential changes in estimated fair value based on a hypothetical 100 basis point change (increase or decrease) in interest rates, as well as a 10% change (increase or decrease) in foreign currency exchange rates and equity market prices. We believe these changes in market rates and prices are reasonably possible in the near term. In performing the analysis summarized below, we used market rates at December 31, 2022. The sensitivity analysis separately calculates each of our market risk exposures (interest rate, foreign currency exchange rate and equity market) relating to our assets and liabilities. We modeled the impact of changes (increases and decreases) in market rates and prices on the estimated fair values of our market sensitive assets and liabilities and present the results with the most adverse level of market risk impact to the Company for each of these market risk exposures as follows:
-
the net present values of our interest rate sensitive exposures resulting from a 100 basis point change (increase or decrease) in interest rates;
-
estimated fair values of our foreign currency exchange rate sensitive exposures due to a 10% change (appreciation or depreciation) in the value of the U.S. dollar compared to all other currencies; and
-
the estimated fair value of our equity market sensitive exposures due to a 10% change (increase or decrease) in equity market prices.
The sensitivity analysis is an estimate and should not be viewed as predictive of our future financial performance. We cannot ensure that our actual losses in any particular period will not exceed the amounts indicated in the table below. Limitations related to this sensitivity analysis include:
-
interest sensitive and foreign currency exchange rate sensitive liabilities do not include $223.9 billion, at carrying value, of insurance contracts. Management believes that the changes in the economic value of those contracts under changing interest rates and changing foreign currency exchange rates would offset a significant portion of the fair value changes of interest sensitive and foreign currency exchange rate sensitive assets;
-
the market risk information is limited by the assumptions and parameters established in creating the related sensitivity analysis, including the impact of prepayment rates on mortgage loans;
-
sensitivities do not include the impact on asset or liability valuation of changes in market liquidity or changes in market credit spreads;
-
foreign currency exchange rate risk is not isolated for certain embedded derivatives within host asset and liability contracts, as the risk on these instruments is reflected as equity;
-
for the derivatives that qualify as hedges, and for certain other assets such as mortgage loans, the impact on reported earnings may be materially different from the change in market values;
-
the analysis excludes liabilities pursuant to insurance contracts, as well as real estate holdings, private equity and hedge fund holdings; and
-
the model assumes that the composition of assets and liabilities remains unchanged throughout the period.
Accordingly, we use such models as tools and not as substitutes for the experience and judgment of our management. Based on our analysis of the impact of a 100 basis point change (increase or decrease) in interest rates, as well as a 10% change (increase or decrease) in foreign currency exchange rates and equity market prices, we have determined that such a change could have a material adverse effect on the estimated fair value of certain assets and liabilities from interest rate, foreign currency exchange rate and equity market exposures.
The table below illustrates the potential loss in estimated fair value for each market risk exposure based on market sensitive assets and liabilities at:
| December 31, 2022 | |||||
| (In millions) | |||||
| Interest rate risk | $ | 22,327 | |||
| Foreign currency exchange rate risk | $ | 5,929 | |||
| Equity market risk | $ | 97 | |||
The risk sensitivities derived used a 100 basis point increase to interest rates, a 10% strengthening of the U.S. dollar against foreign currencies, and a 10% increase in equity prices. The potential losses in estimated fair value presented are for non-trading securities.
The table below provides additional detail regarding the potential loss in estimated fair value of our interest sensitive financial instruments due to a 100 basis point increase in interest rates at:
| December 31, 2022 | |||||||||||||||||
| Notional Amount | Estimated Fair Value (1) | Assuming a 100 bps Increase in Interest Rates | |||||||||||||||
| (In millions) | |||||||||||||||||
| Assets | |||||||||||||||||
| Fixed maturity securities AFS | $ | 276,780 | $ | (20,707) | |||||||||||||
| Equity securities | $ | 1,684 | (80) | ||||||||||||||
| FVO Securities | $ | 1,435 | (26) | ||||||||||||||
| Mortgage loans | $ | 78,694 | (2,708) | ||||||||||||||
| Policy loans | $ | 9,682 | (268) | ||||||||||||||
| Short-term investments | $ | 4,935 | (11) | ||||||||||||||
| Other invested assets | $ | 2,078 | (156) | ||||||||||||||
| Cash and cash equivalents | $ | 20,195 | (6) | ||||||||||||||
| Accrued investment income | $ | 3,446 | — | ||||||||||||||
| Premiums, reinsurance and other receivables | $ | 2,963 | (37) | ||||||||||||||
| Other assets | $ | 265 | (14) | ||||||||||||||
| Embedded derivatives within asset host contracts (2) | $ | 29 | (8) | ||||||||||||||
| Total assets | $ | (24,021) | |||||||||||||||
| Liabilities (3) | |||||||||||||||||
| Policyholder account balances | $ | 115,408 | $ | 3,339 | |||||||||||||
| Payables for collateral under securities loaned and other transactions | $ | 20,937 | — | ||||||||||||||
| Short-term debt | $ | 175 | — | ||||||||||||||
| Long-term debt | $ | 14,241 | 1,031 | ||||||||||||||
| Collateral financing arrangement | $ | 591 | — | ||||||||||||||
| Junior subordinated debt securities | $ | 3,502 | 294 | ||||||||||||||
| Other liabilities | $ | 3,170 | 151 | ||||||||||||||
| Embedded derivatives within liability host contracts (2) | $ | 578 | 317 | ||||||||||||||
| Total liabilities | $ | 5,132 | |||||||||||||||
| Derivative Instruments | |||||||||||||||||
| Interest rate swaps | $ | 39,911 | $ | 938 | $ | (2,182) | |||||||||||
| Interest rate floors | $ | 25,270 | $ | 125 | (66) | ||||||||||||
| Interest rate caps | $ | 48,290 | $ | 950 | 302 | ||||||||||||
| Interest rate futures | $ | 1,453 | $ | 1 | 31 | ||||||||||||
| Interest rate options | $ | 44,391 | $ | 385 | (218) | ||||||||||||
| Interest rate forwards | $ | 7,828 | $ | (1,385) | (950) | ||||||||||||
| Synthetic GICs | $ | 46,316 | $ | — | — | ||||||||||||
| Foreign currency swaps | $ | 56,025 | $ | 3,008 | (307) | ||||||||||||
| Foreign currency forwards | $ | 18,211 | $ | (234) | 12 | ||||||||||||
| Currency futures | $ | 333 | $ | 8 | — | ||||||||||||
| Currency options | $ | 3,000 | $ | 236 | (8) | ||||||||||||
| Credit default swaps | $ | 14,437 | $ | 44 | 2 | ||||||||||||
| Equity futures | $ | 2,988 | $ | 4 | (4) | ||||||||||||
| Equity index options | $ | 16,701 | $ | 442 | (45) | ||||||||||||
| Equity variance swaps | $ | 163 | $ | 3 | — | ||||||||||||
| Equity total return swaps | $ | 2,799 | $ | (89) | (5) | ||||||||||||
| Total derivative instruments | $ | (3,438) | |||||||||||||||
| Net Change | $ | (22,327) |
(1)Separate account assets and liabilities and Unit-linked investments and associated policyholder account balances, which are interest rate sensitive, are not included herein as any interest rate risk is borne by the contractholder, notwithstanding any general account guarantees which are included within embedded derivatives (see footnote (2) below) or included within future policy benefits and other policy-related balances (see footnote (3) below).
(2)Embedded derivatives are recognized on the consolidated balance sheet in the same caption as the host contract.
(3)Excludes $223.9 billion of liabilities, at carrying value, pursuant to insurance contracts reported within future policy benefits and other policy-related balances. These liabilities would economically offset a significant portion of the net change in fair value of our financial instruments resulting from a 100 basis point increase in interest rates.
Sensitivity to interest rates decreased $9.0 billion to $22.0 billion at December 31, 2022 from $31.0 billion at December 31, 2021.
The table below provides additional detail regarding the potential loss in estimated fair value of our portfolio due to a 10% appreciation in the U.S. dollar compared to all other currencies at:
| December 31, 2022 | |||||||||||||||||
| Notional Amount | Estimated Fair Value (1) | Assuming a 10% Appreciation in the U.S. Dollar | |||||||||||||||
| (In millions) | |||||||||||||||||
| Assets | |||||||||||||||||
| Fixed maturity securities AFS | $ | 276,780 | $ | (7,836) | |||||||||||||
| Equity securities | $ | 1,684 | (42) | ||||||||||||||
| FVO Securities | $ | 1,435 | (59) | ||||||||||||||
| Mortgage loans | $ | 78,694 | (815) | ||||||||||||||
| Policy loans | $ | 9,682 | (123) | ||||||||||||||
| Short-term investments | $ | 4,935 | (234) | ||||||||||||||
| Other invested assets | $ | 2,078 | (50) | ||||||||||||||
| Cash and cash equivalents | $ | 20,195 | (424) | ||||||||||||||
| Accrued investment income | $ | 3,446 | (64) | ||||||||||||||
| Premiums, reinsurance and other receivables | $ | 2,963 | (59) | ||||||||||||||
| Other assets | $ | 265 | (18) | ||||||||||||||
| Embedded derivatives within asset host contracts (2) | $ | 29 | (5) | ||||||||||||||
| Total assets | $ | (9,729) | |||||||||||||||
| Liabilities (3) | |||||||||||||||||
| Policyholder account balances | $ | 115,408 | $ | 2,757 | |||||||||||||
| Payables for collateral under securities loaned and other transactions | $ | 20,937 | 188 | ||||||||||||||
| Long-term debt | $ | 14,241 | 148 | ||||||||||||||
| Other liabilities | $ | 3,170 | 14 | ||||||||||||||
| Embedded derivatives within liability host contracts (2) | $ | 578 | 7 | ||||||||||||||
| Total liabilities | $ | 3,114 | |||||||||||||||
| Derivative Instruments | |||||||||||||||||
| Interest rate swaps | $ | 39,911 | $ | 938 | $ | 41 | |||||||||||
| Interest rate floors | $ | 25,270 | $ | 125 | — | ||||||||||||
| Interest rate caps | $ | 48,290 | $ | 950 | — | ||||||||||||
| Interest rate futures | $ | 1,453 | $ | 1 | — | ||||||||||||
| Interest rate options | $ | 44,391 | $ | 385 | (1) | ||||||||||||
| Interest rate forwards | $ | 7,828 | $ | (1,385) | 80 | ||||||||||||
| Synthetic GICs | $ | 46,316 | $ | — | — | ||||||||||||
| Foreign currency swaps | $ | 56,025 | $ | 3,008 | 1,360 | ||||||||||||
| Foreign currency forwards | $ | 18,211 | $ | (234) | (931) | ||||||||||||
| Currency futures | $ | 333 | $ | 8 | (35) | ||||||||||||
| Currency options | $ | 3,000 | $ | 236 | 162 | ||||||||||||
| Credit default swaps | $ | 14,437 | $ | 44 | — | ||||||||||||
| Equity futures | $ | 2,988 | $ | 4 | — | ||||||||||||
| Equity index options | $ | 16,701 | $ | 442 | 9 | ||||||||||||
| Equity variance swaps | $ | 163 | $ | 3 | — | ||||||||||||
| Equity total return swaps | $ | 2,799 | $ | (89) | 1 | ||||||||||||
| Total derivative instruments | $ | 686 | |||||||||||||||
| Net Change | $ | (5,929) |
(1)Does not necessarily represent those financial instruments solely subject to foreign currency exchange rate risk. Separate account assets and liabilities and Unit-linked investments and associated policyholder account balances, which are foreign currency exchange rate sensitive, are not included herein as any foreign currency exchange rate risk is borne by the contractholder, notwithstanding any general account guarantees which are included within embedded derivatives (see footnote (2) below) or included within future policy benefits and other policy-related balances (see footnote (3) below).
(2)Embedded derivatives are recognized on the consolidated balance sheet in the same caption as the host contract.
(3)Excludes $223.9 billion of liabilities, at carrying value, pursuant to insurance contracts reported within future policy benefits and other policy-related balances. These liabilities would economically offset a significant portion of the net change in fair value of our financial instruments resulting from a 10% appreciation in the U.S. dollar compared to all other currencies.
Sensitivity to foreign currency exchange rates decreased $1.2 billion to $6.0 billion at December 31, 2022 from $7.2 billion at December 31, 2021.
The table below provides additional detail regarding the potential loss in estimated fair value of our portfolio due to a 10% increase in equity prices at:
| December 31, 2022 | |||||||||||||||||
| Notional Amount | Estimated Fair Value (1) | Assuming a 10% Increase in Equity Prices | |||||||||||||||
| (In millions) | |||||||||||||||||
| Assets | |||||||||||||||||
| Equity securities | $ | 1,684 | $ | 67 | |||||||||||||
| FVO Securities | $ | 1,435 | 72 | ||||||||||||||
| Other invested assets | $ | 2,078 | 30 | ||||||||||||||
| Embedded derivatives within asset host contracts (2) | $ | 29 | (3) | ||||||||||||||
| Total assets | $ | 166 | |||||||||||||||
| Liabilities (3) | |||||||||||||||||
| Policyholder account balances | $ | 115,408 | $ | — | |||||||||||||
| Embedded derivatives within liability host contracts (2) | $ | 578 | 191 | ||||||||||||||
| Total liabilities | $ | 191 | |||||||||||||||
| Derivative Instruments | |||||||||||||||||
| Interest rate swaps | $ | 39,911 | $ | 938 | $ | — | |||||||||||
| Interest rate floors | $ | 25,270 | $ | 125 | — | ||||||||||||
| Interest rate caps | $ | 48,290 | $ | 950 | — | ||||||||||||
| Interest rate futures | $ | 1,453 | $ | 1 | — | ||||||||||||
| Interest rate options | $ | 44,391 | $ | 385 | — | ||||||||||||
| Interest rate forwards | $ | 7,828 | $ | (1,385) | — | ||||||||||||
| Synthetic GICs | $ | 46,316 | $ | — | — | ||||||||||||
| Foreign currency swaps | $ | 56,025 | $ | 3,008 | — | ||||||||||||
| Foreign currency forwards | $ | 18,211 | $ | (234) | — | ||||||||||||
| Currency futures | $ | 333 | $ | 8 | — | ||||||||||||
| Currency options | $ | 3,000 | $ | 236 | — | ||||||||||||
| Credit default swaps | $ | 14,437 | $ | 44 | — | ||||||||||||
| Equity futures | $ | 2,988 | $ | 4 | (207) | ||||||||||||
| Equity index options | $ | 16,701 | $ | 442 | (39) | ||||||||||||
| Equity variance swaps | $ | 163 | $ | 3 | — | ||||||||||||
| Equity total return swaps | $ | 2,799 | $ | (89) | (208) | ||||||||||||
| Total derivative instruments | $ | (454) | |||||||||||||||
| Net Change | $ | (97) |
(1)Does not necessarily represent those financial instruments solely subject to equity price risk. Additionally, separate account assets and liabilities and Unit-linked investments and associated policyholder account balances, which are equity market sensitive, are not included herein as any equity market risk is borne by the contractholder, notwithstanding any general account guarantees which are included within embedded derivatives (see footnote (2) below) or included within future policy benefits and other policy-related balances (see footnote (3) below).
(2)Embedded derivatives are recognized on the consolidated balance sheet in the same caption as the host contract.
(3)Excludes $223.9 billion of liabilities, at carrying value, pursuant to insurance contracts reported within future policy benefits and other policy-related balances.
Sensitivity to equity market prices decreased $26 million to $97 million at December 31, 2022 from $123 million at December 31, 2021.
Item 8. Financial Statements and Supplementary Data
Index to Consolidated Financial Statements, Notes and Schedules
REPORT OF INDEPENDENT REGISTERED PUBLIC ACCOUNTING FIRM
To the stockholders and the Board of Directors of MetLife, Inc.
Opinion on the Financial Statements
We have audited the accompanying consolidated balance sheets of MetLife, Inc. and subsidiaries (the “Company”) as of December 31, 2022 and 2021, the related consolidated statements of operations, comprehensive income (loss), equity, and cash flows for each of the three years in the period ended December 31, 2022, and the related notes and the schedules listed in the Index to Consolidated Financial Statements, Notes and Schedules (collectively referred to as the “financial statements”). In our opinion, the financial statements present fairly, in all material respects, the financial position of the Company as of December 31, 2022 and 2021, and the results of its operations and its cash flows for each of the three years in the period ended December 31, 2022, in conformity with accounting principles generally accepted in the United States of America.
We have also audited, in accordance with the standards of the Public Company Accounting Oversight Board (United States) (PCAOB), the Company’s internal control over financial reporting as of December 31, 2022, based on criteria established in Internal Control — Integrated Framework (2013) issued by the Committee of Sponsoring Organizations of the Treadway Commission and our report dated February 23, 2023, expressed an unqualified opinion on the Company’s internal control over financial reporting.
Basis for Opinion
These financial statements are the responsibility of the Company’s management. Our responsibility is to express an opinion on the Company’s financial statements based on our audits. We are a public accounting firm registered with the PCAOB and are required to be independent with respect to the Company in accordance with the U.S. federal securities laws and the applicable rules and regulations of the Securities and Exchange Commission and the PCAOB.
We conducted our audits in accordance with the standards of the PCAOB. Those standards require that we plan and perform the audit to obtain reasonable assurance about whether the financial statements are free of material misstatement, whether due to error or fraud. Our audits included performing procedures to assess the risks of material misstatement of the financial statements, whether due to error or fraud, and performing procedures that respond to those risks. Such procedures included examining, on a test basis, evidence regarding the amounts and disclosures in the financial statements. Our audits also included evaluating the accounting principles used and significant estimates made by management, as well as evaluat
Showing the first 8K of 846K characters. Open the full section
Item 9. Changes in and Disagreements With Accountants on Accounting and Financial Disclosure
None.
Item 9A. Controls and Procedures
Evaluation of Disclosure Controls and Procedures
The Company maintains disclosure controls and procedures as defined in Rule 13a-15(e) and 15d-15(e) under the Exchange Act. The Company has designed these controls and procedures to ensure that information the Company is required to disclose in reports filed under the Exchange Act is recorded, processed, summarized and reported within the time periods specified in the SEC’s rules and forms, and is accumulated and communicated to Company management, including the CEO and CFO as appropriate, to allow timely decisions regarding required disclosure.
Management, including the CEO and CFO, evaluated the effectiveness of the design and operation of the Company’s disclosure controls and procedures pursuant to Rule 13a-15(b) under the Exchange Act as of the end of the period covered by this Annual Report on Form 10-K. Based on that evaluation, the CEO and CFO concluded that the disclosure controls and procedures were effective as of December 31, 2022.
There were no changes to the Company’s internal control over financial reporting as defined in Rule 13a-15(f) under the Exchange Act during the quarter ended December 31, 2022 that have materially affected, or are reasonably likely to materially affect, the Company’s internal control over financial reporting.
Management’s Annual Report on Internal Control Over Financial Reporting
Management is responsible for establishing and maintaining adequate internal control over financial reporting as defined in Rule 13a-15(f) and 15d-15(f) under the Exchange Act. In fulfilling this responsibility, management’s estimates and judgments must assess the expected benefits and related costs of control procedures. The Company’s internal control objectives include providing management with reasonable, but not absolute, assurance that the Company has safeguarded assets against loss from unauthorized use or disposition, and that the Company has executed transactions in accordance with management’s authorization and recorded them properly to permit the preparation of consolidated financial statements in conformity with GAAP.
Management evaluated the design and operating effectiveness of the Company’s internal control over financial reporting based on the criteria established in the Internal Control - Integrated Framework (2013) issued by the Committee of Sponsoring Organizations of the Treadway Commission. In the opinion of management, MetLife, Inc. maintained effective internal control over financial reporting as of December 31, 2022.
Deloitte has issued its report on its audit of the effectiveness of internal control over financial reporting, which is set forth below.
REPORT OF INDEPENDENT REGISTERED PUBLIC ACCOUNTING FIRM
To the stockholders and the Board of Directors of MetLife, Inc.
Opinion on Internal Control over Financial Reporting
We have audited the internal control over financial reporting of MetLife, Inc. and subsidiaries (the "Company") as of December 31, 2022, based on criteria established in Internal Control — Integrated Framework (2013) issued by the Committee of Sponsoring Organizations of the Treadway Commission (COSO). In our opinion, the Company maintained, in all material respects, effective internal control over financial reporting as of December 31, 2022, based on criteria established in Internal Control — Integrated Framework (2013) issued by COSO.
We have also audited, in accordance with the standards of the Public Company Accounting Oversight Board (United States) (PCAOB), the financial statements as of and for the year ended December 31, 2022, of the Company and our report dated February 23, 2023, expressed an unqualified opinion on those financial statements.
Basis for Opinion
The Company's management is responsible for maintaining effective internal control over financial reporting and for its assessment of the effectiveness of internal control over financial reporting, included in the accompanying Management’s Annual Report on Internal Control Over Financial Reporting. Our responsibility is to express an opinion on the Company's internal control over financial reporting based on our audit. We are a public accounting firm registered with the PCAOB and are required to be independent with respect to the Company in accordance with the U.S. federal securities laws and the applicable rules and regulations of the Securities and Exchange Commission and the PCAOB.
We conducted our audit in accordance with the standards of the PCAOB. Those standards require that we plan and perform the audit to obtain reasonable assurance about whether effective internal control over financial reporting was maintained in all material respects. Our audit included obtaining an understanding of internal control over financial reporting, assessing the risk that a material weakness exists, testing and evaluating the design and operating effectiveness of internal control based on the assessed risk, and performing such other procedures as we considered necessary in the circumstances. We believe that our audit provides a reasonable basis for our opinion.
Definition and Limitations of Internal Control over Financial Reporting
A company’s internal control over financial reporting is a process designed to provide reasonable assurance regarding the reliability of financial reporting and the preparation of financial statements for external purposes in accordance with generally accepted accounting principles. A company’s internal control over financial reporting includes those policies and procedures that (1) pertain to the maintenance of records that, in reasonable detail, accurately and fairly reflect the transactions and dispositions of the assets of the company; (2) provide reasonable assurance that transactions are recorded as necessary to permit preparation of financial statements in accordance with generally accepted accounting principles, and that receipts and expenditures of the company are being made only in accordance with authorizations of management and directors of the company; and (3) provide reasonable assurance regarding prevention or timely detection of unauthorized acquisition, use, or disposition of the company’s assets that could have a material effect on the financial statements.
Because of its inherent limitations, internal control over financial reporting may not prevent or detect misstatements. Also, projections of any evaluation of effectiveness to future periods are subject to the risk that controls may become inadequate because of changes in conditions, or that the degree of compliance with the policies or procedures may deteriorate.
/s/ DELOITTE & TOUCHE LLP
New York, New York
February 23, 2023
Item 9B. Other Information
None.
Item 9C. Disclosure Regarding Foreign Jurisdictions that Prevent Inspections
Not applicable.
Part III
Item 10. Directors, Executive Officers and Corporate Governance
The information called for by this Item pertaining to Directors is incorporated herein by reference to MetLife, Inc.’s definitive proxy statement for the Annual Meeting of Shareholders to be held on June 20, 2023, to be filed by MetLife, Inc. with the SEC pursuant to Regulation 14A within 120 days after the year ended December 31, 2022 (the “2023 Proxy Statement”).
The information called for by this Item pertaining to Executive Officers appears in “Business — Information About Our Executive Officers” in this Annual Report on Form 10-K.
The Company has adopted the MetLife Financial Management Code of Business Ethics (the “Financial Management Code”), a “code of ethics” as defined under the rules of the SEC, that applies to MetLife, Inc.’s CEO, CFO, Chief Accounting Officer and all professionals in finance and finance-related departments. In addition, the Company has adopted the Directors’ Code of Business Ethics (the “Directors’ Code”) which applies to all members of Board of Directors, including the CEO, and the Company’s Code of Business Ethics, which applies to all employees of the Company, including MetLife, Inc.’s CEO, CFO and Chief Accounting Officer. These codes are available on the Company’s website at www.metlife.com/about-us/corporate-governance/corporate-conduct/. The Company intends to satisfy any disclosure obligations under Item 5.05 of Form 8-K by posting information on the Company’s website at the address given above.
Item 11. Executive Compensation
The information called for by this Item is incorporated herein by reference to the 2023 Proxy Statement.
Item 12. Security Ownership of Certain Beneficial Owners and Management and Related Stockholder Matters
The information called for by this Item pertaining to ownership of shares of MetLife, Inc.’s common stock (“Shares”) is incorporated herein by reference to the 2023 Proxy Statement.
The following table provides information at December 31, 2022, regarding MetLife, Inc.’s equity compensation plans:
Equity Compensation Plan Information at December 31, 2022
| Number of Securities to be Issued upon Exercise of Outstanding Options, Warrants and Rights (1) | Weighted-average Exercise Price of Outstanding Options, Warrants and Rights (2) | Number of Securities Remaining Available for Future Issuance Under Equity Compensation Plans (Excluding Securities Reflected in Column (a)) (3) | ||||||||||||||||||
| Plan Category | (a) | (b) | (c) | |||||||||||||||||
| Equity compensation plans approved by security holders | 12,008,464 | $ | 49.24 | 33,355,850 | ||||||||||||||||
| Equity compensation plans not approved by security holders | None | — | None | |||||||||||||||||
| Total | 12,008,464 | $ | 49.24 | 33,355,850 |
(1) Column (a) reflects the following items outstanding as of December 31, 2022:
| Stock Options | 3,386,041 | ||||
| Restricted Stock Units | 1,999,964 | ||||
| Performance Shares (assuming future payout at maximum performance factor) | 5,611,791 | ||||
| Deferred Shares | 1,010,668 | ||||
| Shares that will or may be issued | 12,008,464 |
As of December 31, 2022:
-
Stock Options under the MetLife, Inc. 2015 Stock and Incentive Compensation Plan (the “2015 Stock Plan”) and its predecessor plan, the MetLife, Inc. 2005 Stock and Incentive Compensation Plan (the “2005 Stock Plan”) were outstanding;
-
Restricted Stock Units and Performance Shares under the 2015 Stock Plan were outstanding; and
-
Deferred Shares related to awards under the 2015 Stock Plan, MetLife, Inc. 2015 Non-Management Directors Stock Compensation Plan (the “2015 Director Stock Plan”), 2005 Stock Plan, MetLife, Inc. 2005 Non-Management Directors Stock Compensation Plan (the “2005 Director Stock Plan”), and earlier plans, were outstanding. Deferred Shares are related to awards that have become payable in Shares under any plan, the issuance of which has been deferred.
The maximum performance factor for Performance Shares granted in 2015 through 2022 was 175%. The number of Performance Shares outstanding as of December 31, 2022 at target (100%) performance factor was 3,206,738.
MetLife, Inc. may issue Shares pursuant to awards (including Stock Option exercises, if any) under any plan using Shares held in treasury by MetLife, Inc. or by issuing new Shares.
For a general description of how the number of Shares paid out on account of Performance Shares and Restricted Stock Units is determined, and the vesting periods applicable to Performance Shares and Restricted Stock Units, see Note 16 of the Notes to the Consolidated Financial Statements.
(2) Column (b) reflects the weighted average exercise price of all Stock Options under any plan that, as of December 31, 2022, had been granted but not forfeited, expired, or exercised. Performance Shares, Restricted Stock Units, and Deferred Shares are not included in determining the weighted average in column (b) because they have no exercise price.
(3) Column (c) reflects the following items outstanding as of December 31, 2022:
| Number of Shares | |||||
| At January 15, 2015, the effective date of the 2015 Stock Plan and 2015 Director Stock Plan: | |||||
| Shares newly authorized for issuance under the 2015 Stock Plan | 11,750,000 | ||||
| Shares remaining authorized for issuance under the 2005 Stock Plan or other plans that were not covered by awards (i) | 18,023,959 | ||||
| Shares authorized for issuance under the 2015 Director Stock Plan (ii) | 1,642,208 | ||||
| Net shares added to the 2015 Stock Plan and 2015 Director Stock Plan authorizations in light of the Separation (iii) | 3,979,727 | ||||
| Total Shares authorized for issuance at January 1, 2015 and net shares added in light of the Separation | 35,395,894 | ||||
| Additional Shares recovered for issuance (iv) in: | |||||
| 2015 - 2021 | 31,545,071 | ||||
| 2022 | 2,350,180 | ||||
| Total Shares recovered for issuance since January 1, 2015 | 33,895,251 | ||||
| Less: Shares covered by new awards and new imputed reinvested dividends on Deferred Shares (v) in: | |||||
| 2015 - 2021 | 32,867,851 | ||||
| 2022 | 3,067,444 | ||||
| Total Shares covered by new awards and new imputed reinvested dividends on Deferred Shares since January 1, 2015 | 35,935,295 | ||||
| Shares remaining available for future issuance under the 2015 Stock Plan and 2015 Director Stock Plan | 33,355,850 |
(i) Consists of Shares that were not covered by awards, including Shares previously covered by awards but recovered due to forfeiture of awards or other reasons and once again available for issuance.
(ii) Consists of Shares remaining authorized for issuance under the predecessor plan, the 2005 Director Stock Plan, that were not covered by awards, including Shares previously covered by awards but recovered due to forfeiture of awards or other reasons and once again available.
(iii) In 2017, MetLife, Inc. completed the separation of Brighthouse Financial, Inc. and its subsidiaries (“Brighthouse”) through a distribution of shares of Brighthouse Financial, Inc. common stock to the MetLife, Inc. common shareholders (the “Separation”). In light of the Separation, and in order to maintain the Share authorizations under each plan at the levels that shareholders had approved, MetLife, Inc. increased the number of Shares authorized for issuance under the 2015 Stock Plan and 2015 Director Stock Plan as of August 4, 2017, excluding those Shares from the authorizations that had already been issued, by the Adjustment Ratio. MetLife, Inc. also increased the number of Shares covered by outstanding Stock Options, Performance Shares, Restricted Stock Units, and Deferred Shares on that date by the Adjustment Ratio, in order to maintain the intrinsic value of those awards and Deferred Shares, which decreased the number of Shares available for issuance under both plans. The amount in this row is the net increase in the Share authorization under both the 2015 Stock Plan and 2015 Director Stock Plan as a result of these adjustments. For a description of the adjustment to Stock Options, Performance Shares, Restricted Stock Units, and Deferred Shares, see Note 16 of the Notes to the Consolidated Financial Statements.
(iv) Consists of Shares utilized under the 2005 Stock Plan or 2015 Stock Plan that were recovered during each of the indicated calendar years, and therefore once again available for issuance, due to: (i) termination of the award by expiration, forfeiture, cancellation, lapse, or otherwise without issuing Shares; (ii) settlement of the award in cash either in lieu of Shares or otherwise; (iii) exchange of the award for awards not involving Shares; (iv) payment of the exercise price of a Stock Option, or the tax withholding requirements with respect to an award, satisfied by tendering Shares to MetLife, Inc. (by either actual delivery or by attestation); (v) satisfaction of tax withholding requirements with respect to an award satisfied by MetLife, Inc. withholding Shares otherwise issuable; and (vi) the payout of Performance Shares at any performance factor less than the maximum performance factor.
(v) Consists of Shares covered by awards granted under the 2015 Stock Plan (including Performance Shares assuming future payout at maximum performance factor). Shares covered by awards granted under the 2015 Directors Stock Plan and Shares covered by imputed reinvested dividends credited on Deferred Shares owed to directors, employees or agents, in each case during each of the indicated calendar years.
Each Share MetLife, Inc. issues in connection with awards granted under the 2005 Stock Plan other than Stock Options or Stock Appreciation Rights (such as Shares payable on account of Performance Shares or Restricted Stock Units under that plan, including any Deferred Shares resulting from such awards) reduces the number of Shares remaining for issuance by 1.179 (“2005 Stock Plan Share Award Ratio”). Each Share MetLife, Inc. issues in connection with a Stock Option or Stock Appreciation Right granted under the 2005 Stock Plan, or in connection with any award under any other plan for employees and agents (including any Deferred Shares resulting from such awards), reduces the number of Shares remaining for issuance by 1.0. (“Standard Award Ratio”). Shares related to awards that are recovered, and therefore authorized for issuance under the 2015 Stock Plan, are recovered with consideration of the 2005 Stock Plan Share Award Ratio and Standard Award Ratio, as applicable. Each Share MetLife, Inc. issues under the 2005 Director Stock Plan or 2015 Director Stock Plan (including any Deferred Shares resulting from such awards) reduces the number of Shares remaining for issuance under that plan by one. Shares related to awards that are recovered, and therefore authorized for issuance under the 2015 Director Stock Plan are recovered with consideration of this ratio. If MetLife, Inc. was to grant a Share-settled Stock Appreciation Right under the 2015 Stock Plan and the award holder exercised it, only the number of Shares MetLife, Inc. issued, net of the Shares tendered, if any, would be deemed delivered for purposes of determining the maximum number of Shares MetLife, Inc. may issue under the 2015 Stock Plan.
Any Shares covered by awards under the 2015 Director Stock Plan that were to be recovered due to (i) termination of the award by expiration, forfeiture, cancellation, lapse, or otherwise without issuing Shares; (ii) settlement of the award in cash either in lieu of Shares or otherwise; (iii) exchange of the award for awards not involving Shares; and (iv) payment of the exercise price of a Stock Option, or the tax withholding requirements with respect to an award, satisfied by tendering Shares to MetLife, Inc. (by either actual delivery or by attestation) would be available to be issued under the 2015 Director Stock Plan. In addition, if MetLife, Inc. was to grant a Share-settled Stock Appreciation Right under the 2015 Director Stock Plan, only the number of Shares issued, net of the Shares tendered, if any, would be deemed delivered for purposes of determining the maximum number of Shares available for issuance under the 2015 Director Stock Plan.
Under both the 2015 Stock Plan and the 2015 Director Stock Plan, in the event of a corporate event or transaction (including, but not limited to, a change in the Shares or the capitalization of MetLife) such as a merger, consolidation, reorganization, recapitalization, separation, stock dividend, extraordinary dividend, stock split, reverse stock split, split up, spin-off, or other distribution of stock or property of MetLife, combination of securities, exchange of securities, dividend in kind, or other like change in capital structure or distribution (other than normal cash dividends) to shareholders of MetLife, or any similar corporate event or transaction, the appropriate committee of the Board of Directors of MetLife, in order to prevent dilution or enlargement of participants’ rights under the applicable plan, shall substitute or adjust, as applicable, the number and kind of Shares that may be issued under that plan and shall adjust the number and kind of Shares subject to outstanding awards. Any Shares related to awards under either plan which: (i) terminate by expiration, forfeiture, cancellation, or otherwise without the issuance of Shares; (ii) are settled in cash either in lieu of Shares or otherwise; or (iii) are exchanged with the appropriate committee’s permission for awards not involving Shares, are available again for grant under the applicable plan. If the option price of any Stock Option granted under either plan or the tax withholding requirements with respect to any award granted under either plan is satisfied by tendering Shares to MetLife (by either actual delivery or by attestation), or if a Stock Appreciation Right is exercised, only the number of Shares issued, net of the Shares tendered, if any, will be deemed delivered for purposes of determining the maximum number of Shares available for issuance under that plan. The maximum number of Shares available for issuance under either plan shall not be reduced to reflect any dividends or dividend equivalents that are reinvested into additional Shares or credited as additional Restricted Stock or Restricted Stock Units.
For a description of the kinds of awards that have been or may be made under the 2015 Stock Plan and 2015 Director Stock Plan and awards that remained outstanding under the 2005 Stock Plan, see Note 16 of the Notes to the Consolidated Financial Statements.
Item 13. Certain Relationships and Related Transactions, and Director Independence
The information called for by this Item is incorporated herein by reference to the 2023 Proxy Statement.
Item 14. Principal Accountant Fees and Services
The information called for by this item is incorporated herein by reference to the 2023 Proxy Statement.
Part IV
Item 15. Exhibits and Financial Statement Schedules
The following documents are filed as part of this report:
- Financial Statements
The financial statements are listed in the Index to Consolidated Financial Statements, Notes and Schedules on page 144.
- Financial Statement Schedules
The financial statement schedules are listed in the Index to Consolidated Financial Statements, Notes and Schedules on page 144.
- Exhibits
The exhibits are listed in the Exhibit Index which begins on page 319.
Item 16. Form 10-K Summary
None.
Exhibit Index
(Note Regarding Reliance on Statements in Our Contracts: In reviewing the agreements included as exhibits to this Annual Report on Form 10-K, please remember that they are included to provide you with information regarding their terms and are not intended to provide any other factual or disclosure information about MetLife, Inc., its subsidiaries or affiliates, or the other parties to the agreements. The agreements contain representations and warranties by each of the parties to the applicable agreement. These representations and warranties have been made solely for the benefit of the other parties to the applicable agreement and (i) should not in all instances be treated as categorical statements of fact, but rather as a way of allocating the risk to one of the parties if those statements prove to be inaccurate; (ii) have been qualified by disclosures that were made to the other party in connection with the negotiation of the applicable agreement, which disclosures are not necessarily reflected in the agreement; (iii) may apply standards of materiality in a way that is different from what may be viewed as material to investors; and (iv) were made only as of the date of the applicable agreement or such other date or dates as may be specified in the agreement and are subject to more recent developments. Accordingly, these representations and warranties may not describe the actual state of affairs as of the date they were made or at any other time. Additional information about MetLife, Inc., its subsidiaries and affiliates may be found elsewhere in this Annual Report on Form 10-K and MetLife, Inc.’s other public filings, which are available without charge through the U.S. Securities and Exchange Commission website at www.sec.gov.)
Showing the first 8K of 102K characters. Open the full section