 filings.tools
Item 2. Management’s Discussion and Analysis of Financial Condition and Results of Operations
338K characters. Original on sec.gov · Markdown
Item 2. Management’s Discussion and Analysis of Financial Condition and Results of Operations
Index to Management’s Discussion and Analysis of Financial Condition and Results of Operations
Forward-Looking Statements and Other Financial Information
For purposes of this discussion, “MetLife,” the “Company,” “we,” “our” and “us” refer to MetLife, Inc., a Delaware corporation incorporated in 1999, its subsidiaries and affiliates. This discussion should be read in conjunction with MetLife, Inc.’s Annual Report on Form 10-K for the year ended December 31, 2020 (the “2020 Annual Report”), the cautionary language regarding forward-looking statements included below, the “Risk Factors” set forth in Part II, Item 1A, and the additional risk factors referred to therein, “Quantitative and Qualitative Disclosures About Market Risk” and the Company’s interim condensed consolidated financial statements included elsewhere herein.
This Management’s Discussion and Analysis of Financial Condition and Results of Operations may contain or incorporate by reference information that includes or is based upon forward-looking statements within the meaning of the Private Securities Litigation Reform Act of 1995. See “Note Regarding Forward-Looking Statements” for cautionary language regarding forward-looking statements.
This Management’s Discussion and Analysis of Financial Condition and Results of Operations includes references to our performance measures, adjusted earnings and adjusted earnings available to common shareholders, that are not based on accounting principles generally accepted in the United States of America (“GAAP”). See “— Non-GAAP and Other Financial Disclosures” for definitions and a discussion of these and other financial measures, and “— Results of Operations” and “— Investments” for reconciliations of historical non-GAAP financial measures to the most directly comparable GAAP measures.
Executive Summary
Overview
MetLife is one of the world’s leading financial services companies, providing insurance, annuities, employee benefits and asset management. MetLife is organized into five segments: U.S.; Asia; Latin America; Europe, the Middle East and Africa (“EMEA”); and MetLife Holdings. In addition, the Company reports certain of its results of operations in Corporate & Other. See Note 2 of the Notes to the Interim Condensed Consolidated Financial Statements for further information on the Company’s segments and Corporate & Other.
COVID-19 Pandemic
We continue to closely monitor developments relating to the novel coronavirus COVID-19 pandemic (the “COVID-19 Pandemic”) and assess its impact on our business. The COVID-19 Pandemic continues to impact the global economy and financial markets and has caused volatility in the global equity, credit and real estate markets. See “— Industry Trends — Financial and Economic Environment.” We have implemented risk management and business continuity plans and taken preventive measures and other precautions, such as employee business travel restrictions and remote work arrangements which, to date, have enabled us to maintain our critical business processes, customer service levels, relationships with key vendors, financial reporting systems, internal controls over financial reporting and disclosure controls and procedures.
We continue to grant certain accommodations to our customers and borrowers, including (i) relaxing claim documentation requirements for disability claims and (ii) payment deferrals and other loan modifications on certain commercial, agricultural and residential mortgage loans. See Note 6 of the Notes to the Interim Condensed Consolidated Financial Statements for further information regarding COVID-19 Pandemic-related mortgage loan concessions. See also “— Results of Operations — Segment Results and Corporate & Other” for further information regarding the effect of the COVID-19 Pandemic on our businesses.
Current Period Highlights
During the three months ended September 30, 2021, adjusted premiums, fees and other revenues, net of foreign currency fluctuations, decreased compared to the prior period driven by the disposition of MetLife Property and Casualty Insurance Company and certain of its wholly-owned subsidiaries (collectively, “MetLife P&C”). Growth in our Group Benefits business in our U.S. segment was driven by the acquisition of Versant Health, Inc. (“Versant Health”). Strong returns in our private equity portfolio resulted in improved investment yields and changes in key equity indexes and long-term interest rates drove a favorable change in net derivative gains (losses). In addition, results in both periods included a charge due to the impact of our annual actuarial assumption review. Underwriting experience was unfavorable and reflected impacts from the COVID-19 Pandemic.
The following represents segment level results and percentage contributions to total segment level adjusted earnings available to common shareholders for the three months ended September 30, 2021:

(1)Excludes Corporate & Other adjusted loss available to common shareholders of $131 million.
(2)Consistent with GAAP guidance for segment reporting, adjusted earnings is our GAAP measure of segment performance. For additional information, see Note 2 of the Notes to the Interim Condensed Consolidated Financial Statements.
Three Months Ended September 30, 2021 Compared with the Three Months Ended September 30, 2020
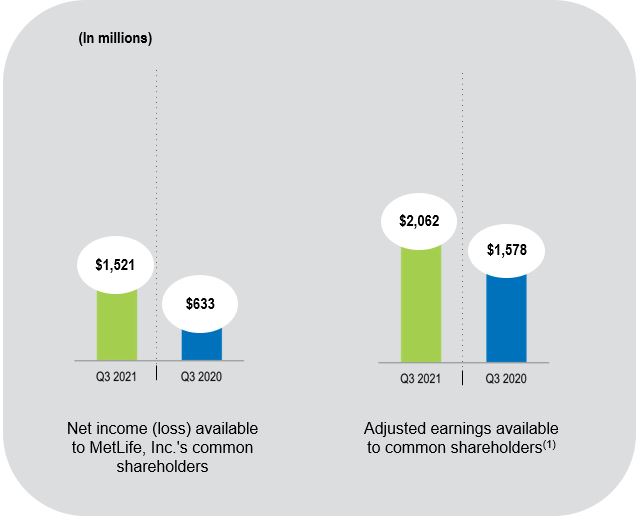 | Consolidated Results - Highlights | ||||||||||||||||||||||
| Net income (loss) available to MetLife, Inc.’s common shareholders up $888 million: | |||||||||||||||||||||||
| • | Favorable change in net derivative gains (losses) of $363 million ($287 million, net of income tax)(2) | ||||||||||||||||||||||
| • | Favorable change from annual actuarial assumption reviews of $97 million ($85 million, net of income tax)(3) | ||||||||||||||||||||||
| • | Unfavorable change in net investment gains (losses) of $64 million ($51 million, net of income tax) | ||||||||||||||||||||||
| • | Adjusted earnings available to common shareholders up $484 million | ||||||||||||||||||||||
| (1) See “— Results of Operations — Consolidated Results” and “— Non-GAAP and Other Financial Disclosures” for reconciliations and definitions of non-GAAP financial measures. | |||||||||||||||||||||||
| (2) Includes amounts relating to investment hedge adjustments, which are also included in adjusted earnings available to common shareholders. See “— Investments — Investment Portfolio Results” for additional information. | |||||||||||||||||||||||
| (3) Includes amounts recognized in net derivative gains (losses) and adjusted earnings available to common shareholders. See “— Results of Operations — Consolidated Results — Three Months Ended September 30, 2021 Compared with the Three Months Ended September 30, 2020 — Actuarial Assumption Review” for additional information. | |||||||||||||||||||||||
| Consolidated Results - Adjusted Earnings Highlights | |||||||||||||||||||||||
| Adjusted earnings available to common shareholders up $484 million primary due to (i) higher investment yields due to strong returns in our private equity portfolio, (ii) higher net investment income due to a larger asset base, (iii) the favorable change from our annual actuarial assumption reviews (see below), and (iv) higher fee income, partially offset by (i) unfavorable underwriting, which reflected impacts from the COVID-19 Pandemic, and (ii) the disposition of MetLife P&C, which decreased adjusted earnings by $18 million. | |||||||||||||||||||||||
| • | Current period results included the unfavorable impact from our annual actuarial assumption review of $140 million, net of income tax. | ||||||||||||||||||||||
| • | Prior period results included the unfavorable impact from our annual actuarial assumption review of $203 million, net of income tax. | ||||||||||||||||||||||
Nine Months Ended September 30, 2021 Compared with the Nine Months Ended September 30, 2020
 | Consolidated Results - Highlights | |||||||||||||||||||
| Net income (loss) available to MetLife, Inc.’s common shareholders up $110 million: | ||||||||||||||||||||
| • | Favorable change in net investment gains (losses) of $1.7 billion ($1.4 billion, net of income tax) | |||||||||||||||||||
| • | Favorable change from annual actuarial assumption reviews of $97 million ($85 million, net of income tax)(3) | |||||||||||||||||||
| • | Unfavorable change in net derivative gains (losses) of $4.9 billion ($3.9 billion, net of income tax)(2) | |||||||||||||||||||
| • | Adjusted earnings available to common shareholders up $2.3 billion | |||||||||||||||||||
| (1) See “— Results of Operations — Consolidated Results” and “— Non-GAAP and Other Financial Disclosures” for reconciliations and definitions of non-GAAP financial measures. | ||||||||||||||||||||
| (2) Includes amounts relating to investment hedge adjustments, which are also included in adjusted earnings available to common shareholders. See “— Investments — Investment Portfolio Results” for additional information. | ||||||||||||||||||||
| (3) Includes amounts recognized in net derivative gains (losses) and adjusted earnings available to common shareholders. See “— Results of Operations — Consolidated Results — Three Months Ended September 30, 2021 Compared with the Three Months Ended September 30, 2020 — Actuarial Assumption Review” for additional information. | ||||||||||||||||||||
| Consolidated Results - Adjusted Earnings Highlights | ||||||||||||||||||||
| Adjusted earnings available to common shareholders up $2.3 billion primarily due to (i) higher investment yields due to strong returns in our private equity portfolio, (ii) an increase in net investment income due to a larger asset base, (iii) lower interest credited expenses, (iv) the release of a legal reserve in the current period, and (v) the favorable change from our annual actuarial assumption reviews (see below), partially offset by (i) unfavorable underwriting, which reflected impacts from the COVID-19 Pandemic, and (ii) the disposition of MetLife P&C, which decreased adjusted earnings by $210 million. | ||||||||||||||||||||
| • | Current period results included the unfavorable impact from our annual actuarial assumption review of $140 million, net of income tax. | |||||||||||||||||||
| • | Prior period results included the unfavorable impact from our annual actuarial assumption review of $203 million, net of income tax. | |||||||||||||||||||
For a more in-depth discussion of our consolidated results, see “— Results of Operations — Consolidated Results,” “— Results of Operations — Consolidated Results — Adjusted Earnings” and “— Results of Operations — Segment Results and Corporate & Other.”
Consolidated Company Outlook
The following information should be read in conjunction with “Management’s Discussion and Analysis of Financial Condition and Results of Operations — Executive Summary — Consolidated Company Outlook” in Part II, Item 7, of the 2020 Annual Report. There have been no material changes to our consolidated company outlook from that previously discussed in the 2020 Annual Report except as noted below.
As disclosed in MetLife, Inc.’s Quarterly Report on Form 10-Q for the quarter ended June 30, 2021, we expect our direct expense ratio, excluding total notable items related to direct expenses and pension risk transfers, to be below 12.3% for the full year 2021 and 2022.
Industry Trends
We continue to be impacted by the changing global financial and economic environment that has been affecting the industry.
Financial and Economic Environment
Our business and results of operations are materially affected by conditions in the global capital markets and the economy generally due to our market presence in numerous countries, large investment portfolio and the sensitivity of our insurance liabilities and derivatives to changing market factors.
We are closely monitoring political and economic conditions that might contribute to global market volatility and impact our business operations, investment portfolio and derivatives, such as the COVID-19 Pandemic. See “— Investments — Current Environment.”
We are also monitoring the imposition of tariffs or other barriers to international trade, changes to international trade agreements, and their potential impacts on our business, results of operations and financial condition, including the impact of the trade agreement reached by the United Kingdom (“U.K.”) and the European Union (“EU”) in December 2020. See “Regulatory Developments — Cross-Border Trade and Investments” herein and “Business — Regulation — Cross-Border Trade and Investments” included in the 2020 Annual Report. In addition, the possibility of government shutdowns or a failure to raise the U.S. debt ceiling, due to a policy impasse or otherwise, could adversely impact our business and liquidity.
Governments and central banks around the world have responded to the COVID-19 Pandemic with unprecedented fiscal and monetary policies, which have had significant effects and may have ongoing effects on financial markets and the global economy. In the United States, the Board of Governors of the Federal Reserve System continues to expand its balance sheet, although it announced reductions in its asset purchases starting in November 2021. Additionally, the board members’ forecasts suggest the policy rate is likely to remain near zero into 2022, with possible increase thereafter. Separately, the U.S. Congress passed another COVID-related stimulus package in March 2021. The European Central Bank (“ECB”) continues its pandemic asset purchase program, albeit at a slower pace, and has signaled its intention to continue the program through at least March 31, 2022. The Bank of England (“BoE”) has maintained low interest rates and continued its expanded quantitative easing program which it has indicated will continue through year-end 2021. The ECB has stated its willingness to maintain its policies despite inflation currently above target levels, as economic activity and price levels rebound from COVID-19 Pandemic-depressed levels. The BoE officials, however, have indicated that interest rates may soon increase to combat rising inflation. Additionally, a number of European countries, including the U.K., have implemented large fiscal stimulus programs, as well as the provision of guarantees and loans for private sector companies. The EU also approved a regional stimulus package comprised of grants and low interest financing to member states, which became operational in mid-2021.
In Japan, the Bank of Japan has continued its monetary easing program but, in order to further enhance its effectiveness and sustainability, the Bank of Japan (i) introduced a program to promote lending which will enable the Bank of Japan to mitigate potential negative side effects of further reductions in short and long term interest rates; (ii) has clarified the target range of yield curve fluctuations for the 10-year Japanese government bond, including an upper limit when necessary, and (iii) announced greater purchasing flexibility for exchange-traded funds and Japan real estate investment trusts.
Impact of a Sustained Low Interest Rate Environment
Market interest rates are a key driver of our results. For discussion on the potential impact of low interest rates, as well as our mitigating actions, see “Management’s Discussion and Analysis of Financial Condition and Results of Operations — Industry Trends — Impact of a Sustained Low Interest Rate Environment” and “Risk Factors — Economic Environment and Capital Markets Risks” included in the 2020 Annual Report.
Competitive Pressures
See “Business — Competition” and “Management’s Discussion and Analysis of Financial Condition and Results of Operations — Industry Trends — Competitive Pressures” in the 2020 Annual Report for information on our competitive position.
Regulatory Developments
The following discussion on regulatory developments should be read in conjunction with “Business — Regulation” and “Management’s Discussion and Analysis of Financial Condition and Results of Operations — Industry Trends — Regulatory Developments” included in the 2020 Annual Report, as amended or supplemented here.
Insurance Regulatory Examinations and Other Activities
In 2019, we and other insurance and pension fund companies provided annuities sales practices information to the Chilean insurance and pension regulators. The regulators found that non-employee sales agents of MetLife Chile and other insurers had engaged in improper sales practices and that ProVida S.A. and other pension fund companies provided improper advice to customers. MetLife Chile and ProVida S.A.’s objections were rejected and the companies have paid applicable fines, which did not have a substantial impact on MetLife Chile or Provida S.A..
National Association of Insurance Commissioners
Risk-Based Capital
The National Association of Insurance Commissioners (“NAIC”) adopted revisions to certain factors used to calculate Life Risk-Based Capital (“RBC”), which is the denominator of the RBC ratios, in light of changes to U.S. tax laws in recent years. These revisions have resulted in increased RBC charges and reduced the RBC ratios of our insurance subsidiaries. The NAIC has approved RBC revisions for corporate bonds, real estate equity and longevity risk that will take effect at year-end 2021 and are expected to have a modest net positive RBC impact on us.
NYDFS Guidance on Diversity and Corporate Governance
On March 16, 2021, the New York State Department of Financial Services (“NYDFS”) stated it expects the insurers it regulates to make diversity of their leadership a business priority and a key element of their corporate governance. The NYDFS collected data from insurers that met certain New York premium thresholds, including MetLife, Inc. and certain of its subsidiaries, regarding the diversity of their corporate boards and management. The NYDFS plans to publish such data on an aggregate basis to measure progress in the industry. In addition, the NYDFS will include diversity-related questions in its examination process starting in 2022.
Securities, Broker-Dealer and Investment Adviser Regulation
In April 2021, the Appellate Division of the New York State Supreme Court overturned NYDFS Regulation 187- Suitability and Best Interests in Life Insurance and Annuity Transactions for being unconstitutionally vague. The NYDFS has appealed the decision.
Environmental Laws and Regulations
On March 25, 2021, the NYDFS issued for public comment proposed guidance for New York domestic insurers, which states that insurers are expected to take a proportionate approach, based on their business, to managing their exposure to the financial risks from climate change. The NYDFS intends to formally adopt the guidance, as modified by the comment process, and it has integrated questions on this topic as part of its supervisory activities.
On July 14, 2021, the NYDFS published notice of the adoption of amendments to regulations governing enterprise risk management, effective August 13, 2021. Among other provisions, the amendments require that certain additional risks, including climate change risk, be specifically included in an insurance group's enterprise risk management function.
The U.S. Securities and Exchange Commission (the “SEC”) is continuing its focus on climate, and environmental, social and governance (“ESG”) risks and opportunities, and has published its rulemaking list which contains several ESG-related rulemakings that the SEC is considering.
Cross-Border Trade and Investments
Recent U.S. sanctions have imposed new restrictions with respect to certain activity involving China. A series of U.S. presidential executive orders imposes prohibitions on engaging in certain transactions involving the purchase or sale of publicly traded securities, or any publicly traded securities that are derivative of, or are designed to provide investment exposure to such securities, of any listed Chinese Military-Industrial Complex Companies. In addition, the Biden administration issued an executive order directing a review of foreign adversary connected software applications to review transactions that risk sabotage of U.S. information and communications technology or services, critical infrastructure, digital economy, national security, or the security and safety of U.S. persons. This review could result in new actions to restrict U.S. persons from engaging in certain transactions with any identified foreign parties.
Employee Retirement Income Security Act of 1974, Fiduciary Considerations, and Other Pension and Retirement Regulation
In 2020, the Chilean Congress approved two bills, each of which allowed individuals to withdraw up to 10% of pension accounts or the account balance if it is below a certain amount. In April 2021, the Chilean Congress approved a third bill allowing for additional withdrawals of pension funds which could deplete approximately one third of pension accounts. The bill also requires insurance companies to advance payments of up to 10% of the reserves allocated to a customer’s annuity. ProVida S.A., MetLife Chile and other companies in the industry continue to process such payments. In August 2021, the Chilean Congress initiated discussion of a fourth bill allowing for additional withdrawals of up to 10% of pension funds and requiring insurance companies to advance payments of up to 10% of the reserves allocated to a customer’s annuity. A final vote on the proposal is expected in November 2021. Further, the Chilean Congress is considering a separate bill aimed at improving the pension system for lower income participants. A vote may occur on this proposal in early 2022. Additional major pension reform in Chile is possible in the future. The impact of any such pension reforms will depend on the final measures adopted, and in some cases could have an adverse effect on our Chilean pension business. We have initiated a formal consultation process with the Chilean government to seek a resolution of our concerns regarding these developments.
London Interbank Offered Rate
The Financial Conduct Authority, the U.K. regulator of London Interbank Offered Rates (“LIBOR”), previously indicated that it intends to stop persuading or compelling panel banks to submit quotes used to determine LIBOR after 2021. On March 5, 2021, the Intercontinental Exchange Benchmark Administration, the administrator of LIBOR, announced that it will cease the publication of one week and two-month U.S. Dollar LIBOR and all non-USD (GBP, EUR, CHF and JPY) LIBOR settings at the end of December 2021, but will extend the publication of the remaining U.S. Dollar LIBOR settings (overnight and one, three, six and 12 month U.S. Dollar LIBOR) until the end of June 2023. U.S. bank regulators have advised banks to cease writing, subject to certain limited exceptions, new U.S. Dollar LIBOR contracts by the end of 2021.
We use LIBOR and other interbank offered rates as interest reference rates in many of our financial instruments. Existing contract fallback provisions, and whether, how, and when we and others develop and adopt alternative reference rates, will influence the effect of any changes to or discontinuation of LIBOR on us. We actively participate in the New York Federal Reserve Bank convened Alternative Reference Rate Committee (“ARRC”) and other industry association efforts on the transition to alternative reference rates. In April 2021, the State of New York enacted legislation to address the transition from LIBOR for certain New York law governed agreements, which is generally consistent with the ARRC’s recommendations to facilitate the transition. We continue to assess current and alternative reference rates’ merits, limitations, risks and suitability for our investment and insurance processes.
Summary of Critical Accounting Estimates
The preparation of financial statements in conformity with GAAP requires management to adopt accounting policies and make estimates and assumptions that affect amounts reported on the Interim Condensed Consolidated Financial Statements. The most critical estimates include those used in determining:
(i)liabilities for future policy benefits and the accounting for reinsurance;
(ii)capitalization and amortization of deferred policy acquisition costs (“DAC”) and the establishment and amortization of value of business acquired (“VOBA”);
(iii)estimated fair values of investments in the absence of quoted market values;
(iv)investment allowance for credit loss (“ACL”) and impairments;
(v)estimated fair values of freestanding derivatives and the recognition and estimated fair value of embedded derivatives requiring bifurcation;
(vi)measurement of goodwill and related impairment;
(vii)measurement of employee benefit plan liabilities;
(viii)measurement of income taxes and the valuation of deferred tax assets; and
(ix)liabilities for litigation and regulatory matters.
In addition, the application of acquisition accounting requires the use of estimation techniques in determining the estimated fair values of assets acquired and liabilities assumed — the most significant of which relate to the aforementioned critical accounting estimates. In applying these policies and estimates, management makes subjective and complex judgments that frequently require assumptions about matters that are inherently uncertain. Many of these policies, estimates and related judgments are common in the insurance and financial services industries; others are specific to our business and operations. Actual results could differ from these estimates.
The Company’s critical accounting estimates are described in “Management’s Discussion and Analysis of Financial Condition and Results of Operations — Summary of Critical Accounting Estimates” and Note 1 of the Notes to the Consolidated Financial Statements included in the 2020 Annual Report.
Goodwill
Goodwill is tested for impairment at least annually or more frequently if events or circumstances, such as adverse changes in the business climate, indicate that there may be justification for conducting an interim test.
For purposes of goodwill impairment testing, if the carrying value of a reporting unit exceeds its estimated fair value, an impairment charge would be recognized for the amount by which the carrying value exceeds the reporting unit’s fair value; however, the loss recognized would not exceed the total amount of goodwill allocated to that reporting unit. Additionally, the Company will consider income tax effects from any tax deductible goodwill on the carrying value of the reporting unit when measuring the goodwill impairment loss, if applicable. The key inputs, judgments and assumptions necessary in determining estimated fair value of the reporting units include projected adjusted earnings, current book value, the level of economic capital required to support the mix of business, long-term growth rates, comparative market multiples, the account value of in-force business, projections of new and renewed business, as well as margins on such business, interest rate levels, credit spreads, equity market levels, and the discount rate that we believe is appropriate for the respective reporting unit.
We apply significant judgment when determining the estimated fair value of our reporting units and when assessing the relationship of market capitalization to the aggregate estimated fair value of our reporting units. The valuation methodologies utilized are subject to key judgments and assumptions that are sensitive to change. Estimates of fair value are inherently uncertain and represent only management’s reasonable expectation regarding future developments. These estimates and the judgments and assumptions upon which the estimates are based will, in all likelihood differ in some respects from actual future results. Declines in the estimated fair value of our reporting units could result in goodwill impairments in future periods which could materially adversely affect our results of operations or financial position.
In the third quarter of 2021, the Company performed its annual goodwill impairment tests on all of its reporting units, using both qualitative and quantitative assessments. The quantitative assessment utilized the market multiple, embedded value and discounted cash flow valuation approaches based on best available data as of June 30, 2021. The Company concluded that the estimated fair values of all its reporting units were substantially in excess of their carrying values and, therefore, goodwill was not impaired.
Economic Capital
Economic capital is an internally developed risk capital model, the purpose of which is to measure the risk in the business and to provide a basis upon which capital is deployed. The economic capital model accounts for the unique and specific nature of the risks inherent in our business. Our economic capital model, coupled with considerations of local capital requirements, aligns segment allocated equity with emerging standards and consistent risk principles. Economic capital-based risk estimation is an evolving science and industry best practices have emerged and continue to evolve. Areas of evolving industry best practices include stochastic liability valuation techniques, alternative methodologies for the calculation of diversification benefits, and the quantification of appropriate shock levels. MetLife’s management is responsible for the ongoing production and enhancement of the economic capital model and reviews its approach periodically to ensure that it remains consistent with emerging industry practice standards. For further information, see “Financial Measures and Segment Accounting Policies” in Note 2 of the Notes to the Interim Condensed Consolidated Financial Statements.
Acquisitions and Dispositions
Acquisitions
Pending Ownership Increase of PNB MetLife
In October 2021, the Company entered into a share purchase agreement to acquire 15.27% ownership in PNB MetLife India Insurance Company Limited (“PNB MetLife”). Upon completion of the transaction, the Company’s ownership in PNB MetLife, an operating joint venture accounted for under the equity method, will increase to 47.325%. The transaction will close upon receipt of all necessary regulatory approvals and satisfaction of other closing conditions. This transaction supports the Company’s continued growth in India and will enable us to deliver more value for our customers, partners and shareholders.
Acquisition of Versant Health
For information regarding the Company’s December 2020 acquisition of Versant Health, see Note 3 of the Notes to the Consolidated Financial Statements included in the 2020 Annual Report.
Dispositions
Disposition of MetLife Seguros
For information regarding the Company's September 2021 disposition of its wholly-owned Argentinian subsidiary, MetLife Seguros S.A. (“MetLife Seguros”), see Note 3 of the Notes to the Interim Condensed Consolidated Financial Statements.
Pending Disposition of MetLife Poland and Greece
For information regarding the Company's pending disposition of its wholly-owned subsidiaries in Poland and Greece (collectively, “MetLife Poland and Greece”) to NN Group N.V., reported as held-for-sale, see Notes 1 and 3 of the Notes to the Interim Condensed Consolidated Financial Statements.
Disposition of MetLife P&C
For information regarding the Company's April 2021 disposition of MetLife P&C, which was reported as held-for-sale, see Notes 1 and 3 of the Notes to the Interim Condensed Consolidated Financial Statements.
Disposition of MetLife Russia
For information regarding the Company's January 2021 disposition of its wholly-owned Russian subsidiary, the Joint-stock Company MetLife Insurance Company (“MetLife Russia”), see Note 3 of the Notes to the Consolidated Financial Statements included in the 2020 Annual Report.
Disposition of MetLife Seguros de Retiro
For information regarding the Company's October 2020 disposition of one of its wholly-owned Argentinian subsidiaries, MetLife Seguros de Retiro S.A. (“MetLife Seguros de Retiro”), see Note 3 of the Notes to the Consolidated Financial Statements included in the 2020 Annual Report.
Results of Operations
Consolidated Results
| Three Months Ended September 30, | Nine Months Ended September 30, | |||||||||||||||||||||||||
| 2021 | 2020 | 2021 | 2020 | |||||||||||||||||||||||
| (In millions) | ||||||||||||||||||||||||||
| Revenues | ||||||||||||||||||||||||||
| Premiums | $ | 9,455 | $ | 9,935 | $ | 28,914 | $ | 28,137 | ||||||||||||||||||
| Universal life and investment-type product policy fees | 1,521 | 1,497 | 4,334 | 4,227 | ||||||||||||||||||||||
| Net investment income | 5,568 | 4,729 | 16,162 | 11,877 | ||||||||||||||||||||||
| Other revenues | 663 | 455 | 1,958 | 1,350 | ||||||||||||||||||||||
| Net investment gains (losses) | (84) | (20) | 1,655 | (77) | ||||||||||||||||||||||
| Net derivative gains (losses) | (218) | (581) | (2,032) | 2,910 | ||||||||||||||||||||||
| Total revenues | 16,905 | 16,015 | 50,991 | 48,424 | ||||||||||||||||||||||
| Expenses | ||||||||||||||||||||||||||
| Policyholder benefits and claims and policyholder dividends | 10,292 | 10,206 | 30,703 | 28,477 | ||||||||||||||||||||||
| Interest credited to policyholder account balances | 1,287 | 1,416 | 4,153 | 3,458 | ||||||||||||||||||||||
| Capitalization of DAC | (635) | (764) | (2,052) | (2,209) | ||||||||||||||||||||||
| Amortization of DAC and VOBA | 816 | 1,066 | 1,943 | 2,414 | ||||||||||||||||||||||
| Amortization of negative VOBA | (6) | (15) | (25) | (35) | ||||||||||||||||||||||
| Interest expense on debt | 240 | 229 | 696 | 683 | ||||||||||||||||||||||
| Other expenses | 2,869 | 2,954 | 8,753 | 8,873 | ||||||||||||||||||||||
| Total expenses | 14,863 | 15,092 | 44,171 | 41,661 | ||||||||||||||||||||||
| Income (loss) before provision for income tax | 2,042 | 923 | 6,820 | 6,763 | ||||||||||||||||||||||
| Provision for income tax expense (benefit) | 453 | 214 | 1,456 | 1,503 | ||||||||||||||||||||||
| Net income (loss) | 1,589 | 709 | 5,364 | 5,260 | ||||||||||||||||||||||
| Less: Net income (loss) attributable to noncontrolling interests | 5 | 3 | 15 | 11 | ||||||||||||||||||||||
| Net income (loss) attributable to MetLife, Inc. | 1,584 | 706 | 5,349 | 5,249 | ||||||||||||||||||||||
| Less: Preferred stock dividends | 63 | 59 | 166 | 168 | ||||||||||||||||||||||
| Preferred stock redemption premium | — | 14 | 6 | 14 | ||||||||||||||||||||||
| Net income (loss) available to MetLife, Inc.’s common shareholders | $ | 1,521 | $ | 633 | $ | 5,177 | $ | 5,067 |
Three Months Ended September 30, 2021 Compared with the Three Months Ended September 30, 2020
During the three months ended September 30, 2021, net income (loss) increased $880 million from the prior period, primarily driven by favorable changes in adjusted earnings and net derivative gains (losses), net of investment hedge adjustments, as well as a favorable change from our annual actuarial assumption reviews.
Management of Investment Portfolio and Hedging Market Risks with Derivatives. We manage our investment portfolio using disciplined asset/liability management (“ALM”) principles, focusing on cash flow and duration to support our current and future liabilities. Our intent is to match the timing and amount of liability cash outflows with invested assets that have cash inflows of comparable timing and amount, while optimizing risk-adjusted investment income and risk-adjusted total return. Our investment portfolio is heavily weighted toward fixed income investments, with over 80% of our portfolio invested in fixed maturity securities available-for-sale (“AFS”) and mortgage loans. These securities and loans have varying maturities and other characteristics which cause them to be generally well suited for matching the cash flow and duration of insurance liabilities. In addition, our general account investment portfolio includes, within contractholder-directed equity securities and fair value option securities (“FVO Securities”), contractholder-directed equity securities supporting unit-linked variable annuity type liabilities (“Unit-linked investments”), which do not qualify as separate account assets. Returns on these Unit-linked investments, which can vary significantly from period to period, include changes in estimated fair value subsequent to purchase, inure to contractholders and are offset in earnings by a corresponding change in policyholder account balances through interest credited to policyholder account balances.
We purchase investments to support our insurance liabilities and not to generate net investment gains and losses. However, net investment gains and losses are incurred and can change significantly from period to period due to changes in external influences, including changes in market factors such as interest rates, foreign currency exchange rates, credit spreads and equity markets; counterparty specific factors such as financial performance, credit rating and collateral valuation; and internal factors such as portfolio rebalancing. Changes in these factors from period to period can significantly impact the levels of provision for credit loss and impairments on our investment portfolio, as well as realized gains and losses on investments sold.
We also use derivatives as an integral part of our management of the investment portfolio and insurance liabilities to hedge certain risks, including changes in interest rates, foreign currency exchange rates, credit spreads and equity market levels. We use freestanding interest rate, equity, credit and currency derivatives to hedge certain invested assets and insurance liabilities. A portion of these hedges are designated and qualify as accounting hedges, which reduce volatility in earnings. For those hedges not designated as accounting hedges, changes in market factors lead to the recognition of fair value changes in net derivative gains (losses) generally without an offsetting gain or loss recognized in earnings for the item being hedged, which creates volatility in earnings. We actively evaluate market risk hedging needs and strategies to ensure our free cash flow and capital objectives are met under a range of market conditions.
Certain variable annuity products with guaranteed minimum benefits contain embedded derivatives that are measured at estimated fair value separately from the host variable annuity contract, with changes in estimated fair value recorded in net derivative gains (losses). We use freestanding derivatives to hedge the market risks inherent in these variable annuity guarantees. The valuation of these embedded derivatives includes a nonperformance risk adjustment, which is unhedged, and can be a significant driver of net derivative gains (losses) and volatility in earnings, but does not have an economic impact on us.
We continuously review and refine our strategy and ongoing refinement of the strategy may be required to take advantage of the NAIC rules related to a statutory accounting election for derivatives that mitigate interest rate sensitivity related to variable annuity guarantees. As a part of our current hedge strategy, we maintain portfolio level derivatives in our macro hedge program. These macro hedge program derivatives, which are included in the non-VA program derivatives section of the table below, mitigate the potential loss of our overall statutory capital from significant adverse economic conditions.
Net Derivative Gains (Losses). The variable annuity embedded derivatives and associated freestanding derivative hedges are collectively referred to as “VA program derivatives.” All other derivatives that are economic hedges of certain invested assets and insurance liabilities are referred to as “non-VA program derivatives.” The table below presents the impact on net derivative gains (losses) from non-VA program derivatives and VA program derivatives:
| Three Months Ended September 30, | |||||||||||
| 2021 | 2020 | ||||||||||
| (In millions) | |||||||||||
| Non-VA program derivatives: | |||||||||||
| Interest rate | $ | (181) | $ | (402) | |||||||
| Foreign currency exchange rate | (147) | (104) | |||||||||
| Credit | 13 | (4) | |||||||||
| Equity | 70 | (249) | |||||||||
| Non-VA embedded derivatives | 45 | (2) | |||||||||
| Total non-VA program derivatives | (200) | (761) | |||||||||
| VA program derivatives: | |||||||||||
| Market risks in embedded derivatives | 65 | 336 | |||||||||
| Nonperformance risk adjustment on embedded derivatives | 3 | (12) | |||||||||
| Other risks in embedded derivatives | (66) | 86 | |||||||||
| Total embedded derivatives | 2 | 410 | |||||||||
| Freestanding derivatives hedging embedded derivatives | (20) | (230) | |||||||||
| Total VA program derivatives | (18) | 180 | |||||||||
| Net derivative gains (losses) | $ | (218) | $ | (581) |
The favorable change in net derivative gains (losses) on non-VA program derivatives was $561 million ($443 million, net of income tax). This was primarily due to key equity indexes decreasing in the current period versus increasing in the prior period or increasing less in the current period than in the prior period. This favorably impacted the estimated fair value of equity options and total rate of return swaps that are part of our macro hedge program. In addition, long-term rates increased less in the current period compared with the prior period. This favorably impacted the estimated fair value of receiver options that are part of our macro hedge program. Because certain of these hedging strategies are not designated or do not qualify as accounting hedges, the changes in the estimated fair value of these freestanding derivatives are recognized in net derivative gains (losses) without an offsetting gain or loss recognized in earnings for the items being hedged.
The unfavorable change in net derivative gains (losses) on VA program derivatives was $198 million ($156 million, net of income tax). This was due to (i) an unfavorable change of $152 million ($120 million, net of income tax) in other risks in embedded derivatives (primarily policyholder behavior and other non-market risks that generally cannot be hedged), and (ii) an unfavorable change of $61 million ($48 million, net of income tax) in market risks in embedded derivatives, net of freestanding derivatives hedging market risks in embedded derivatives, partially offset by a favorable change of $15 million ($12 million, net of income tax) in the nonperformance risk adjustment on embedded derivatives.
The aforementioned $152 million ($120 million, net of income tax) unfavorable change in other risks in embedded derivatives reflects actuarial assumption updates and a combination of factors, such as fees deducted from accounts, changes in the benefit base, premiums, lapses, withdrawals and deaths, in addition to changes to cross-effect, basis mismatch, risk margin and fund allocation.
The aforementioned $61 million ($48 million, net of income tax) unfavorable change reflects a $271 million ($214 million, net of income tax) unfavorable change in market risks in embedded derivatives, partially offset by a $210 million ($166 million, net of income tax) favorable change in freestanding derivatives that hedge market risks in embedded derivatives.
The primary changes in market factors affecting the valuation of VA program derivatives are summarized as follows:
-
Key equity index levels increased less in the current period compared with the prior period, contributing to an unfavorable change in our embedded derivatives and a favorable change in our freestanding derivatives. For example, the S&P Global Ratings (“S&P”) 500 Index increased 0.2% in the current period and increased 8% in the prior period.
-
Long-term interest rates increased less in the current period compared with the prior period, contributing to an unfavorable change in our embedded derivatives. For example, the 30-year U.S. swap rate increased 2 basis points in the current period and increased 20 basis points in the prior period.
The aforementioned $15 million ($12 million, net of income tax) favorable change in the nonperformance risk adjustment included in the valuation of embedded derivatives resulted from a favorable change of $15 million, before income tax, related to model changes and changes in capital market inputs, such as long-term interest rates and key equity index levels, on variable annuity guarantees.
When equity index levels decrease in isolation, the variable annuity guarantees become more valuable to policyholders, which results in an increase in the undiscounted embedded derivative liability. Discounting this unfavorable change by the risk adjusted rate results in a smaller loss than by discounting at the risk-free rate, thus creating a gain from including an adjustment for nonperformance risk.
When the risk-free interest rate decreases in isolation, discounting the embedded derivative liability produces a higher valuation of the liability than if the risk-free interest rate had remained constant. Discounting this unfavorable change by the risk adjusted rate results in a smaller loss than by discounting at the risk-free interest rate, thus creating a gain from including an adjustment for nonperformance risk.
When our own credit spread increases in isolation, discounting the embedded derivative liability produces a lower valuation of the liability than if our own credit spread had remained constant. As a result, a gain is created from including an adjustment for nonperformance risk. For each of these primary market drivers, the opposite effect occurs when the driver moves in the opposite direction.
Net Investment Gains (Losses). The unfavorable change in net investment gains (losses) of $64 million ($51 million, net of income tax) primarily reflects the current period loss on the sale of MetLife Seguros. This unfavorable change was partially offset by increased gains on sales of real estate investments and fixed maturity securities compared to the prior period.
Taxes. For the three months ended September 30, 2021, our effective tax rate on income (loss) before provision for income tax was 22%, which differed from the U.S. statutory rate of 21% primarily due to tax charges from foreign earnings taxed at different rates than the U.S. statutory rate and the completed sale of MetLife Seguros, partially offset by tax benefits related to tax credits and non-taxable investment income. For the three months ended September 30, 2020, our effective tax rate on income (loss) before provision for income tax was 23%, which differed from the U.S. statutory rate of 21% primarily due to tax charges from the sale of MetLife Seguros de Retiro and foreign earnings taxed at different rates than the U.S. statutory rate, partially offset by tax benefits related to non-taxable investment income and tax credits.
Actuarial Assumption Review. Results for the current period include a $281 million ($216 million, net of income tax) charge associated with our annual review of actuarial assumptions related to reserves and DAC, of which a $2 million ($1 million, net of income tax) loss was recognized in net derivative gains (losses).
Of the $281 million charge, $129 million ($96 million, net of income tax) was related to DAC and $152 million ($120 million, net of income tax) was associated with reserves. The portion of the $281 million charge that is included in adjusted earnings is $187 million ($140 million, net of income tax).
The $2 million ($1 million, net of income tax) loss recognized in net derivative gains (losses) associated with our annual review of actuarial assumptions is included within the other risks in embedded derivatives line in the table above.
As a result of our annual review of actuarial assumptions, changes were made to economic, biometric, policyholder behavior, and operational assumptions. The most significant impacts were in the MetLife Holdings segment, driven by updates to behavioral assumptions for variable annuities and in Asia, driven by economic assumption updates for interest sensitive whole life. The breakdown of total current period results is summarized as follows:
- Economic assumption updates resulted in unfavorable impacts to reserves and DAC, for a net charge of $136 million ($101 million, net of income tax).
-
Changes in biometric assumptions resulted in favorable impacts to reserves and slightly unfavorable impacts to DAC, for a net gain of $39 million ($29 million, net of income tax).
-
Changes in policyholder behavior assumptions resulted in unfavorable impacts to reserves and favorable impacts to DAC, for a net charge of $195 million ($152 million, net of income tax).
-
Changes in operational assumptions resulted in favorable impacts to reserves and unfavorable impacts to DAC, for a net gain of $11 million ($8 million, net of income tax).
Results for the prior period include a $378 million ($301 million, net of income tax) charge associated with our annual review of actuarial assumptions related to reserves and DAC, of which a $44 million ($34 million, net of income tax) gain was recognized in net derivative gains (losses). Of the $378 million charge, $120 million ($94 million, net of income tax) was related to DAC and $258 million ($207 million, net of income tax) was associated with reserves. The portion of the $378 million charge that is included in adjusted earnings is $255 million ($203 million, net of income tax).
Adjusted Earnings. As more fully described in “— Non-GAAP and Other Financial Disclosures,” we use adjusted earnings, which does not equate to net income (loss), as determined in accordance with GAAP, to analyze our performance, evaluate segment performance, and allocate resources. We believe that the presentation of adjusted earnings and other financial measures based on adjusted earnings, as we measure it for management purposes, enhances the understanding of our performance by highlighting the results of operations and the underlying profitability drivers of the business. Adjusted earnings and other financial measures based on adjusted earnings allow analysis of our performance relative to our business plan and facilitate comparisons to industry results. Adjusted earnings should not be viewed as a substitute for net income (loss). Adjusted earnings available to common shareholders and adjusted earnings available to common shareholders on a constant currency basis should not be viewed as substitutes for net income (loss) available to MetLife, Inc.’s common shareholders. Adjusted earnings available to common shareholders increased $484 million, net of income tax, to $2.1 billion, net of income tax, for the three months ended September 30, 2021 from $1.6 billion, net of income tax, for the three months ended September 30, 2020.
Nine Months Ended September 30, 2021 Compared with the Nine Months Ended September 30, 2020
During the nine months ended September 30, 2021, net income (loss) increased $104 million from the prior period, primarily driven by favorable changes in adjusted earnings and net investment gains (losses), as well as a favorable change from our annual actuarial assumption reviews, partially offset by an unfavorable change in net derivative gains (losses), net of investment hedge adjustments.
Net Derivative Gains (Losses). The table below presents the impact on net derivative gains (losses) from non-VA program derivatives and VA program derivatives:
| Nine Months Ended September 30, | |||||||||||
| 2021 | 2020 | ||||||||||
| (In millions) | |||||||||||
| Non-VA program derivatives: | |||||||||||
| Interest rate | $ | (1,206) | $ | 3,763 | |||||||
| Foreign currency exchange rate | (356) | (156) | |||||||||
| Credit | 75 | (109) | |||||||||
| Equity | (612) | (253) | |||||||||
| Non-VA embedded derivatives | 64 | (7) | |||||||||
| Total non-VA program derivatives | (2,035) | 3,238 | |||||||||
| VA program derivatives: | |||||||||||
| Market risks in embedded derivatives | 803 | (494) | |||||||||
| Nonperformance risk adjustment on embedded derivatives | (48) | 63 | |||||||||
| Other risks in embedded derivatives | (103) | (205) | |||||||||
| Total embedded derivatives | 652 | (636) | |||||||||
| Freestanding derivatives hedging embedded derivatives | (649) | 308 | |||||||||
| Total VA program derivatives | 3 | (328) | |||||||||
| Net derivative gains (losses) | $ | (2,032) | $ | 2,910 |
The unfavorable change in net derivative gains (losses) on non-VA program derivatives was $5.3 billion ($4.2 billion, net of income tax). This was primarily due to long-term rates increasing in the current period versus decreasing significantly in the prior period. This unfavorably impacted the estimated fair value of receive fixed interest rate swaps and options that are part of our macro hedge program. In addition, key equity indexes increased in the current period versus decreased in the prior period or increased more in the current period compared with the prior period. This unfavorably impacted the estimated fair value of equity options and equity total rate of return swaps that are part of our macro hedge program. Because certain of these hedging strategies are not designated or do not qualify as accounting hedges, the changes in the estimated fair value of these freestanding derivatives are recognized in net derivative gains (losses) without an offsetting gain or loss recognized in earnings for the items being hedged.
The favorable change in net derivative gains (losses) on VA program derivatives was $331 million ($261 million, net of income tax). This was due to (i) a favorable change of $340 million ($269 million, net of income tax) in market risks in embedded derivatives, net of freestanding derivatives that hedge market risks in embedded derivatives, and (ii) a favorable change of $102 million, ($81 million, net of income tax) in other risks in embedded derivatives, (primarily policyholder behavior and other non-market risks that generally cannot be hedged), partially offset by an unfavorable change of $111 million ($88 million, net of income tax) in the nonperformance risk adjustment included in the valuation of embedded derivatives.
The aforementioned $340 million ($269 million, net of income tax) favorable change reflects a $1.3 billion ($1.0 billion, net of income tax) favorable change in market risks in embedded derivatives, partially offset by a $957 million ($756 million, net of income tax) unfavorable change in freestanding derivatives that hedge market risks in embedded derivatives.
The primary changes in market factors affecting the valuation of VA program derivatives are summarized as follows:
-
Key equity index levels increased more in the current period compared with the prior period, contributing to a favorable change in our embedded derivatives and an unfavorable change in our freestanding derivatives. For example, the S&P 500 Index increased 15% in the current period and increased 4% in the prior period.
-
Long-term interest rates increased in the current period versus decreased significantly in the prior period, contributing to a favorable change in our embedded derivatives and an unfavorable change in our freestanding derivatives. For example, the 30-year U.S. swap rate increased 39 basis points in the current period and decreased 97 basis points in the prior period.
The aforementioned $102 million ($81 million, net of income tax) favorable change in other risks in embedded derivatives reflects actuarial assumption updates and a combination of factors, such as fees deducted from accounts, changes in the benefit base, premiums, lapses, withdrawals and deaths, in addition to changes to cross-effect, basis mismatch, risk margin and fund allocation.
The aforementioned $111 million ($88 million, net of income tax) unfavorable change in the nonperformance risk adjustment on embedded derivatives resulted from an unfavorable change of $91 million, before income tax, related to model changes and changes in capital market inputs, such as long-term interest rates and key equity index levels, on variable annuity guarantees, in addition to an unfavorable change of $20 million, before income tax, related to changes in our own credit spread.
Net Investment Gains (Losses). The favorable change in net investment gains (losses) of $1.7 billion ($1.4 billion, net of income tax) primarily reflects (i) the current period gain on the disposition of MetLife P&C, (ii) increased gains on sales of real estate investments compared to the prior period, (iii) a current period release compared to a prior period provision for mortgage loan credit loss, and (iv) mark-to-market gains in the current period compared to mark-to-market losses in the prior period on equity securities, which are measured at estimated fair value through net income (loss). These favorable changes were partially offset by the current period loss on the sale of MetLife Seguros and on the pending disposition of MetLife Poland and Greece, as well as lower gains on sales of fixed maturity securities compared to the prior period.
Divested Businesses. Income (loss) before provision for income tax related to divested businesses, excluding net investment gains (losses) and net derivative gains (losses), increased $118 million ($98 million, net of income tax) to $95 million ($81 million, net of income tax) in the current period from a loss of $23 million ($17 million, net of income tax) in the prior period. Included in this increase was an increase in total revenues of $905 million, before income tax, and an increase in total expenses of $787 million, before income tax. Divested businesses primarily include activity related to the disposition of MetLife P&C.
Taxes. For the nine months ended September 30, 2021, our effective tax rate on income (loss) before provision for income tax was equal to the U.S. statutory rate of 21% as tax charges from foreign earnings taxed at different rates than the U.S. statutory rate, the completed sales of MetLife P&C and MetLife Seguros, and the pending disposition of MetLife Poland and Greece, were offset by tax benefits related to tax credits, non-taxable investment income and the corporate tax deduction for stock compensation. For the nine months ended September 30, 2020, our effective tax rate on income (loss) before provision for income tax was 22%, which differed from the U.S. statutory rate of 21% primarily due to tax charges from foreign earnings taxed at different rates than the U.S. statutory rate and the sale of MetLife Seguros de Retiro, partially offset by tax benefits related to non-taxable investment income, tax credits and the finalization of bankruptcy proceedings for a leveraged lease investment.
Actuarial Assumption Review. For the results of our 2021 and 2020 annual actuarial assumption reviews, see “— Three Months Ended September 30, 2021 Compared with the Three Months Ended September 30, 2020 — Actuarial Assumption Review.”
Adjusted Earnings. Adjusted earnings available to common shareholders increased $2.3 billion, net of income tax, to $6.1 billion, net of income tax, for the nine months ended September 30, 2021 from $3.8 billion, net of income tax, for the nine months ended September 30, 2020.
Reconciliation of net income (loss) to adjusted earnings available to common shareholders and premiums, fees and other revenues to adjusted premiums, fees and other revenues
Three Months Ended September 30, 2021
| U.S. | Asia | Latin America | EMEA | MetLife Holdings | Corporate & Other | Total | ||||||||||||||||||||||||||||||||||||||
| (In millions) | ||||||||||||||||||||||||||||||||||||||||||||
| Net income (loss) available to MetLife, Inc.'s common shareholders | $ | 978 | $ | 610 | $ | (402) | $ | 74 | $ | 501 | $ | (240) | $ | 1,521 | ||||||||||||||||||||||||||||||
| Add: Preferred stock dividends | — | — | — | — | — | 63 | 63 | |||||||||||||||||||||||||||||||||||||
| Add: Preferred stock redemption premium | — | — | — | — | — | — | — | |||||||||||||||||||||||||||||||||||||
| Add: Net income (loss) attributable to noncontrolling interests | — | — | 1 | 1 | — | 3 | 5 | |||||||||||||||||||||||||||||||||||||
| Net income (loss) | 978 | 610 | (401) | 75 | 501 | (174) | 1,589 | |||||||||||||||||||||||||||||||||||||
| Less: adjustments from net income (loss) to adjusted earnings available to common shareholders: | ||||||||||||||||||||||||||||||||||||||||||||
| Revenues: | ||||||||||||||||||||||||||||||||||||||||||||
| Net investment gains (losses) | 115 | 122 | (199) | (13) | 48 | (157) | (84) | |||||||||||||||||||||||||||||||||||||
| Net derivative gains (losses) | 86 | (34) | (299) | (9) | (3) | 41 | (218) | |||||||||||||||||||||||||||||||||||||
| Premiums | — | — | — | 57 | — | — | 57 | |||||||||||||||||||||||||||||||||||||
| Universal life and investment-type product policy fees | — | 46 | — | 18 | 20 | — | 84 | |||||||||||||||||||||||||||||||||||||
| Net investment income | (89) | 16 | (9) | 61 | (74) | (5) | (100) | |||||||||||||||||||||||||||||||||||||
| Other revenues | — | — | — | 6 | — | 73 | 79 | |||||||||||||||||||||||||||||||||||||
| Expenses: | ||||||||||||||||||||||||||||||||||||||||||||
| Policyholder benefits and claims and policyholder dividends | (8) | (21) | — | (43) | (108) | (1) | (181) | |||||||||||||||||||||||||||||||||||||
| Interest credited to policyholder account balances | 1 | (55) | (8) | (58) | — | — | (120) | |||||||||||||||||||||||||||||||||||||
| Capitalization of DAC | — | — | — | 15 | — | — | 15 | |||||||||||||||||||||||||||||||||||||
| Amortization of DAC and VOBA | — | (30) | — | (13) | (15) | — | (58) | |||||||||||||||||||||||||||||||||||||
| Amortization of negative VOBA | — | — | — | — | — | — | — | |||||||||||||||||||||||||||||||||||||
| Interest expense on debt | — | — | — | — | — | — | — | |||||||||||||||||||||||||||||||||||||
| Other expenses | — | — | 1 | (36) | — | (74) | (109) | |||||||||||||||||||||||||||||||||||||
| Goodwill impairment | — | — | — | — | — | — | — | |||||||||||||||||||||||||||||||||||||
| Provision for income tax (expense) benefit | (22) | (3) | 84 | (4) | 27 | 17 | 99 | |||||||||||||||||||||||||||||||||||||
| Adjusted earnings | $ | 895 | $ | 569 | $ | 29 | $ | 94 | $ | 606 | (68) | 2,125 | ||||||||||||||||||||||||||||||||
| Less: Preferred stock dividends | 63 | 63 | ||||||||||||||||||||||||||||||||||||||||||
| Adjusted earnings available to common shareholders | $ | (131) | $ | 2,062 | ||||||||||||||||||||||||||||||||||||||||
| Premiums, fees and other revenues | $ | 6,408 | $ | 2,134 | $ | 988 | $ | 751 | $ | 1,161 | $ | 197 | $ | 11,639 | ||||||||||||||||||||||||||||||
| Less: adjustments to premiums, fees and other revenues | — | 46 | — | 81 | 20 | 73 | 220 | |||||||||||||||||||||||||||||||||||||
| Adjusted premiums, fees and other revenues | $ | 6,408 | $ | 2,088 | $ | 988 | $ | 670 | $ | 1,141 | $ | 124 | $ | 11,419 |
Three Months Ended September 30, 2020
| U.S. | Asia | Latin America | EMEA | MetLife Holdings | Corporate & Other | Total | ||||||||||||||||||||||||||||||||||||||
| (In millions) | ||||||||||||||||||||||||||||||||||||||||||||
| Net income (loss) available to MetLife, Inc.'s common shareholders | $ | 766 | $ | 422 | $ | (18) | $ | 58 | $ | (369) | $ | (226) | $ | 633 | ||||||||||||||||||||||||||||||
| Add: Preferred stock dividends | — | — | — | — | — | 59 | 59 | |||||||||||||||||||||||||||||||||||||
| Add: Preferred stock redemption premium | — | — | — | — | — | 14 | 14 | |||||||||||||||||||||||||||||||||||||
| Add: Net income (loss) attributable to noncontrolling interests | — | — | — | 1 | — | 2 | 3 | |||||||||||||||||||||||||||||||||||||
| Net income (loss) | 766 | 422 | (18) | 59 | (369) | (151) | 709 | |||||||||||||||||||||||||||||||||||||
| Less: adjustments from net income (loss) to adjusted earnings available to common shareholders: | ||||||||||||||||||||||||||||||||||||||||||||
| Revenues: | ||||||||||||||||||||||||||||||||||||||||||||
| Net investment gains (losses) | 34 | 69 | (109) | (10) | 10 | (14) | (20) | |||||||||||||||||||||||||||||||||||||
| Net derivative gains (losses) | (93) | (67) | 67 | 24 | (442) | (70) | (581) | |||||||||||||||||||||||||||||||||||||
| Premiums | — | — | — | — | — | — | — | |||||||||||||||||||||||||||||||||||||
| Universal life and investment-type product policy fees | — | 3 | — | 4 | 21 | — | 28 | |||||||||||||||||||||||||||||||||||||
| Net investment income | (103) | 31 | 13 | 184 | (84) | — | 41 | |||||||||||||||||||||||||||||||||||||
| Other revenues | — | — | — | — | — | 39 | 39 | |||||||||||||||||||||||||||||||||||||
| Expenses: | ||||||||||||||||||||||||||||||||||||||||||||
| Policyholder benefits and claims and policyholder dividends | (10) | (21) | 25 | (8) | (223) | — | (237) | |||||||||||||||||||||||||||||||||||||
| Interest credited to policyholder account balances | 1 | (71) | (11) | (186) | — | — | (267) | |||||||||||||||||||||||||||||||||||||
| Capitalization of DAC | — | — | — | — | — | — | — | |||||||||||||||||||||||||||||||||||||
| Amortization of DAC and VOBA | — | (4) | — | 2 | (69) | — | (71) | |||||||||||||||||||||||||||||||||||||
| Amortization of negative VOBA | — | — | — | — | — | — | — | |||||||||||||||||||||||||||||||||||||
| Interest expense on debt | — | — | — | — | — | — | — | |||||||||||||||||||||||||||||||||||||
| Other expenses | — | — | (4) | (2) | — | (49) | (55) | |||||||||||||||||||||||||||||||||||||
| Goodwill impairment | — | — | — | — | — | — | — | |||||||||||||||||||||||||||||||||||||
| Provision for income tax (expense) benefit | 37 | 17 | (38) | (1) | 165 | 15 | 195 | |||||||||||||||||||||||||||||||||||||
| Adjusted earnings | $ | 900 | $ | 465 | $ | 39 | $ | 52 | $ | 253 | (72) | 1,637 | ||||||||||||||||||||||||||||||||
| Less: Preferred stock dividends | 59 | 59 | ||||||||||||||||||||||||||||||||||||||||||
| Adjusted earnings available to common shareholders | $ | (131) | $ | 1,578 | ||||||||||||||||||||||||||||||||||||||||
| Adjusted earnings available to common shareholders on a constant currency basis (1) | $ | 900 | $ | 466 | $ | 41 | $ | 52 | $ | 253 | $ | (131) | $ | 1,581 | ||||||||||||||||||||||||||||||
| Premiums, fees and other revenues | $ | 6,833 | $ | 2,268 | $ | 761 | $ | 684 | $ | 1,227 | $ | 114 | $ | 11,887 | ||||||||||||||||||||||||||||||
| Less: adjustments to premiums, fees and other revenues | — | 3 | — | 4 | 21 | 39 | 67 | |||||||||||||||||||||||||||||||||||||
| Adjusted premiums, fees and other revenues | $ | 6,833 | $ | 2,265 | $ | 761 | $ | 680 | $ | 1,206 | $ | 75 | $ | 11,820 | ||||||||||||||||||||||||||||||
| Adjusted premiums, fees and other revenues on a constant currency basis (1) | $ | 6,833 | $ | 2,225 | $ | 807 | $ | 682 | $ | 1,206 | $ | 75 | $ | 11,828 |
(1)Amounts for U.S., MetLife Holdings and Corporate & Other are shown on a reported basis, as constant currency impact is not significant.
Nine Months Ended September 30, 2021
| U.S. | Asia | Latin America | EMEA | MetLife Holdings | Corporate & Other | Total | ||||||||||||||||||||||||||||||||||||||
| (In millions) | ||||||||||||||||||||||||||||||||||||||||||||
| Net income (loss) available to MetLife, Inc.'s common shareholders | $ | 2,905 | $ | 1,171 | $ | (319) | $ | 34 | $ | 746 | $ | 640 | $ | 5,177 | ||||||||||||||||||||||||||||||
| Add: Preferred stock dividends | — | — | — | — | — | 166 | 166 | |||||||||||||||||||||||||||||||||||||
| Add: Preferred stock redemption premium | — | — | — | — | — | 6 | 6 | |||||||||||||||||||||||||||||||||||||
| Add: Net income (loss) attributable to noncontrolling interests | — | 1 | 4 | 2 | — | 8 | 15 | |||||||||||||||||||||||||||||||||||||
| Net income (loss) | 2,905 | 1,172 | (315) | 36 | 746 | 820 | 5,364 | |||||||||||||||||||||||||||||||||||||
| Less: adjustments from net income (loss) to adjusted earnings available to common shareholders: | ||||||||||||||||||||||||||||||||||||||||||||
| Revenues: | ||||||||||||||||||||||||||||||||||||||||||||
| Net investment gains (losses) | 473 | 62 | (195) | (200) | 94 | 1,421 | 1,655 | |||||||||||||||||||||||||||||||||||||
| Net derivative gains (losses) | 127 | (737) | (412) | 6 | (964) | (52) | (2,032) | |||||||||||||||||||||||||||||||||||||
| Premiums | 865 | — | — | 57 | — | — | 922 | |||||||||||||||||||||||||||||||||||||
| Universal life and investment-type product policy fees | — | 59 | — | 26 | 60 | — | 145 | |||||||||||||||||||||||||||||||||||||
| Net investment income | (236) | 77 | (27) | 479 | (216) | 6 | 83 | |||||||||||||||||||||||||||||||||||||
| Other revenues | 11 | — | — | 6 | — | 168 | 185 | |||||||||||||||||||||||||||||||||||||
| Expenses: | ||||||||||||||||||||||||||||||||||||||||||||
| Policyholder benefits and claims and policyholder dividends | (603) | (59) | 91 | (92) | (257) | (1) | (921) | |||||||||||||||||||||||||||||||||||||
| Interest credited to policyholder account balances | 2 | (194) | (33) | (470) | — | — | (695) | |||||||||||||||||||||||||||||||||||||
| Capitalization of DAC | 89 | — | — | 15 | — | — | 104 | |||||||||||||||||||||||||||||||||||||
| Amortization of DAC and VOBA | (98) | (27) | — | (12) | — | — | (137) | |||||||||||||||||||||||||||||||||||||
| Amortization of negative VOBA | — | — | — | — | — | — | — | |||||||||||||||||||||||||||||||||||||
| Interest expense on debt | — | — | — | — | — | (1) | (1) | |||||||||||||||||||||||||||||||||||||
| Other expenses | (222) | 1 | 3 | (40) | — | (181) | (439) | |||||||||||||||||||||||||||||||||||||
| Goodwill impairment | — | — | — | — | — | — | — | |||||||||||||||||||||||||||||||||||||
| Provision for income tax (expense) benefit | (84) | 278 | 92 | 2 | 269 | (344) | 213 | |||||||||||||||||||||||||||||||||||||
| Adjusted earnings | $ | 2,581 | $ | 1,712 | $ | 166 | $ | 259 | $ | 1,760 | (196) | 6,282 | ||||||||||||||||||||||||||||||||
| Less: Preferred stock dividends | 166 | 166 | ||||||||||||||||||||||||||||||||||||||||||
| Adjusted earnings available to common shareholders | $ | (362) | $ | 6,116 | ||||||||||||||||||||||||||||||||||||||||
| Premiums, fees and other revenues | $ | 19,812 | $ | 6,345 | $ | 2,797 | $ | 2,181 | $ | 3,545 | $ | 526 | $ | 35,206 | ||||||||||||||||||||||||||||||
| Less: adjustments to premiums, fees and other revenues | 876 | 59 | — | 89 | 60 | 168 | 1,252 | |||||||||||||||||||||||||||||||||||||
| Adjusted premiums, fees and other revenues | $ | 18,936 | $ | 6,286 | $ | 2,797 | $ | 2,092 | $ | 3,485 | $ | 358 | $ | 33,954 |
Nine Months Ended September 30, 2020
| U.S. | Asia | Latin America | EMEA | MetLife Holdings | Corporate & Other | Total | ||||||||||||||||||||||||||||||||||||||
| (In millions) | ||||||||||||||||||||||||||||||||||||||||||||
| Net income (loss) available to MetLife, Inc.'s common shareholders | $ | 2,317 | $ | 1,428 | $ | (107) | $ | 359 | $ | 1,872 | $ | (802) | $ | 5,067 | ||||||||||||||||||||||||||||||
| Add: Preferred stock dividends | — | — | — | — | — | 168 | 168 | |||||||||||||||||||||||||||||||||||||
| Add: Preferred stock redemption premium | — | — | — | — | — | 14 | 14 | |||||||||||||||||||||||||||||||||||||
| Add: Net income (loss) attributable to noncontrolling interests | — | 1 | 3 | 4 | — | 3 | 11 | |||||||||||||||||||||||||||||||||||||
| Net income (loss) | 2,317 | 1,429 | (104) | 363 | 1,872 | (617) | 5,260 | |||||||||||||||||||||||||||||||||||||
| Less: adjustments from net income (loss) to adjusted earnings available to common shareholders: | ||||||||||||||||||||||||||||||||||||||||||||
| Revenues: | ||||||||||||||||||||||||||||||||||||||||||||
| Net investment gains (losses) | 11 | 226 | (81) | (1) | (86) | (146) | (77) | |||||||||||||||||||||||||||||||||||||
| Net derivative gains (losses) | 395 | 533 | (202) | 35 | 2,238 | (89) | 2,910 | |||||||||||||||||||||||||||||||||||||
| Premiums | — | 52 | — | — | — | — | 52 | |||||||||||||||||||||||||||||||||||||
| Universal life and investment-type product policy fees | — | 31 | (3) | 13 | 64 | — | 105 | |||||||||||||||||||||||||||||||||||||
| Net investment income | (237) | (94) | (2) | (45) | (200) | 2 | (576) | |||||||||||||||||||||||||||||||||||||
| Other revenues | — | — | — | — | — | 120 | 120 | |||||||||||||||||||||||||||||||||||||
| Expenses: | ||||||||||||||||||||||||||||||||||||||||||||
| Policyholder benefits and claims and policyholder dividends | (34) | (93) | (116) | 87 | (276) | — | (432) | |||||||||||||||||||||||||||||||||||||
| Interest credited to policyholder account balances | 8 | 21 | (17) | 58 | — | — | 70 | |||||||||||||||||||||||||||||||||||||
| Capitalization of DAC | — | 5 | — | — | — | — | 5 | |||||||||||||||||||||||||||||||||||||
| Amortization of DAC and VOBA | — | (47) | — | 1 | (66) | — | (112) | |||||||||||||||||||||||||||||||||||||
| Amortization of negative VOBA | — | — | — | — | — | — | — | |||||||||||||||||||||||||||||||||||||
| Interest expense on debt | — | — | — | — | — | — | — | |||||||||||||||||||||||||||||||||||||
| Other expenses | — | (24) | — | (4) | — | (148) | (176) | |||||||||||||||||||||||||||||||||||||
| Goodwill impairment | — | — | — | — | — | — | — | |||||||||||||||||||||||||||||||||||||
| Provision for income tax (expense) benefit | (29) | (252) | 51 | (27) | (352) | 27 | (582) | |||||||||||||||||||||||||||||||||||||
| Adjusted earnings | $ | 2,203 | $ | 1,071 | $ | 266 | $ | 246 | $ | 550 | (383) | 3,953 | ||||||||||||||||||||||||||||||||
| Less: Preferred stock dividends | 168 | 168 | ||||||||||||||||||||||||||||||||||||||||||
| Adjusted earnings available to common shareholders | $ | (551) | $ | 3,785 | ||||||||||||||||||||||||||||||||||||||||
| Adjusted earnings available to common shareholders on a constant currency basis (1) | $ | 2,203 | $ | 1,104 | $ | 291 | $ | 254 | $ | 550 | $ | (551) | $ | 3,851 | ||||||||||||||||||||||||||||||
| Premiums, fees and other revenues | $ | 18,714 | $ | 6,446 | $ | 2,416 | $ | 2,050 | $ | 3,711 | $ | 377 | $ | 33,714 | ||||||||||||||||||||||||||||||
| Less: adjustments to premiums, fees and other revenues | — | 83 | (3) | 13 | 64 | 120 | 277 | |||||||||||||||||||||||||||||||||||||
| Adjusted premiums, fees and other revenues | $ | 18,714 | $ | 6,363 | $ | 2,419 | $ | 2,037 | $ | 3,647 | $ | 257 | $ | 33,437 | ||||||||||||||||||||||||||||||
| Adjusted premiums, fees and other revenues on a constant currency basis (1) | $ | 18,714 | $ | 6,426 | $ | 2,571 | $ | 2,087 | $ | 3,647 | $ | 257 | $ | 33,702 |
(1)Amounts for U.S., MetLife Holdings and Corporate & Other are shown on a reported basis, as constant currency impact is not significant.
Consolidated Results — Adjusted Earnings
Business Overview. Adjusted premiums, fees and other revenues for the three months ended September 30, 2021 decreased $401 million, or 3%, compared to the prior period. Adjusted premiums, fees and other revenues, net of foreign currency fluctuations, decreased $409 million, or 3%, compared to the prior period, primarily due to a decrease of $908 million attributable to the disposition of MetLife P&C. Growth in our Group Benefits business, including the acquisition of Versant Health, was partially offset by lower premiums in our Retirement and Income Solutions (“RIS”) business. In our Asia segment, adjusted premiums, fees and other revenues declined compared to the prior period mainly due to the impact of our annual actuarial assumption review in both periods. A decrease in adjusted premiums, fees and other revenues in our EMEA segment was primarily due to the disposition of MetLife Russia and the pending disposition of MetLife Poland and Greece. Higher annuitizations in Chile due to improved market conditions, coupled with higher sales and persistency in Mexico, resulted in an increase in adjusted premiums, fees and other revenues in our Latin America segment. In our MetLife Holdings segment, we anticipate an average decline in adjusted premiums, fees and other revenues of approximately 5% to 7% per year from expected business run-off.
Three Months Ended September 30, 2021 Compared with the Three Months Ended September 30, 2020
Unless otherwise stated, all amounts discussed below are net of income tax.
Overview. The primary drivers of the increase in adjusted earnings were higher investment yields due to strong returns in our private equity portfolio, higher net investment income due to a larger asset base, higher fee income and a favorable change from our annual actuarial assumption reviews, partially offset by unfavorable underwriting, which reflected impacts from the COVID-19 Pandemic. The disposition of MetLife P&C decreased adjusted earnings by $18 million. All amounts discussed below are net of the results of this business.
Foreign Currency. Changes in foreign currency exchange rates did not have a material impact on adjusted earnings for the third quarter of 2021 compared to the prior period. Unless otherwise stated, all amounts discussed below are net of foreign currency fluctuations. Foreign currency fluctuations can result in significant variances in the financial statement line items.
Business Growth. We benefited from positive net flows in the majority of our businesses, which increased our invested asset base. Growth in the investment portfolios of our U.S. and Asia segments resulted in higher net investment income. However, consistent with the growth in average invested assets, interest credited expenses on certain insurance-related liabilities increased. In addition, higher premiums, net of corresponding changes in policyholder benefits improved adjusted earnings, primarily from growth in our EMEA and Latin America segments, partially offset by a decline in our MetLife Holdings segment. Higher fee income in our EMEA, Latin America and Asia segments was partially offset by a decrease in our MetLife Holdings segment. Also, an increase in expenses due to business growth, net of DAC capitalization, was more than offset by the 2021 abatement of the annual health insurer fee under the Patient Protection and Affordable Care Act (“PPACA”). The combined impact of the items affecting our business growth, in addition to higher DAC amortization, resulted in a $90 million increase in adjusted earnings.
Market Factors. Market factors, including interest rate levels, variability in equity market returns, and foreign currency fluctuations, continued to impact our results; however, certain impacts were mitigated by derivatives used to hedge these risks. Excluding the impact of changes in foreign currency exchange rates on net investment income in our non-U.S. segments and changes in inflation rates on our inflation-indexed investments, investment yields increased. The increase in investment yields was primarily driven by the favorable impact of strong equity market returns on our private equity funds and higher income on real estate investments. These increases were partially offset by lower yields on fixed income securities and mortgage loans, as well as decreased returns on FVO Securities. The net impact of interest rate fluctuations resulted in a decline in our average interest credited rates on deposit-type and long-duration liabilities, which drove a decrease in interest credited expenses. The changes in market factors discussed above resulted in a $744 million increase in adjusted earnings.
Underwriting, Actuarial Assumption Review and Other Insurance Adjustments. Unfavorable underwriting resulted in a $481 million decrease in adjusted earnings and reflected impacts from the COVID-19 Pandemic. This was primarily driven by unfavorable mortality experience in our U.S., Latin America and MetLife Holdings segments coupled with unfavorable claims experience in our MetLife Holdings, U.S. and Asia segments. The favorable change from our annual actuarial assumption reviews resulted in a net increase of $63 million in adjusted earnings. Changes in operational, biometric and economic assumptions were less unfavorable in the current period when compared to the prior period. Refinements to certain insurance and other liabilities in both periods resulted in a $48 million increase in adjusted earnings. Dividend scale reductions, as well as run-off in Metropolitan Life Insurance Company’s (“MLIC”) closed block, contributed to lower dividend expenses of $9 million and lower associated DAC amortization of $84 million, which increased adjusted earnings.
Expenses. Adjusted earnings decreased $15 million compared to the prior period, primarily due to lower interest expenses on tax positions due to an audit settlement in the prior period, as well as higher corporate-related expenses in the current period, partially offset by higher legal expenses in the prior period.
Taxes. For the three months ended September 30, 2021, our effective tax rate on adjusted earnings was equal to the U.S. statutory rate of 21% as benefits from tax credits and non-taxable investment income were offset by tax charges from foreign earnings taxed at different rates than the U.S. statutory rate. For the three months ended September 30, 2020, our effective tax rate on adjusted earnings was 20%, which differed from the U.S. statutory rate of 21% primarily due to tax benefits from non-taxable investment income and tax credits, partially offset by tax charges from foreign earnings taxed at different rates than the U.S. statutory rate.
Nine Months Ended September 30, 2021 Compared with the Nine Months Ended September 30, 2020
Unless otherwise stated, all amounts discussed below are net of income tax.
Overview. The primary drivers of the increase in adjusted earnings were higher investment yields due to strong returns in our private equity portfolio, an increase in net investment income due to a larger asset base, lower interest credited expenses, the release of a legal reserve in the current period and a favorable change from our annual actuarial assumption reviews, partially offset by unfavorable underwriting, which reflected impacts from the COVID-19 Pandemic, and the disposition of MetLife P&C. The disposition of MetLife P&C decreased adjusted earnings by $210 million. All amounts discussed below are net of the results of this business.
Foreign Currency. Changes in foreign currency exchange rates had a $65 million positive impact on adjusted earnings for the first nine months of 2021 compared to the prior period. Unless otherwise stated, all amounts discussed below are net of foreign currency fluctuations. Foreign currency fluctuations can result in significant variances in the financial statement line items.
Business Growth. We benefited from positive net flows in the majority of our businesses, which increased our invested asset base. Growth in the investment portfolios of our U.S. and Asia segments resulted in higher net investment income. However, consistent with the growth in average invested assets, interest credited expenses on certain insurance-related liabilities increased. In addition, higher premiums, net of corresponding changes in policyholder benefits improved adjusted earnings, primarily from growth in our EMEA, Asia and Latin America segments, partially offset by a decline in our MetLife Holdings segment. Lower fee income in our MetLife Holdings and EMEA segments was partially offset by increases in our Asia and Latin America segments. Also, an increase in expenses due to business growth was more than offset by the related increase in DAC capitalization and the 2021 abatement of the annual health insurer fee under the PPACA. The combined impact of the items affecting our business growth resulted in a $211 million increase in adjusted earnings.
Market Factors. Market factors, including interest rate levels, variability in equity market returns, and foreign currency fluctuations, continued to impact our results; however, certain impacts were mitigated by derivatives used to hedge these risks. Excluding the impact of changes in foreign currency exchange rates on net investment income in our non-U.S. segments and changes in inflation rates on our inflation-indexed investments, investment yields increased. The increase in investment yields was primarily driven by the favorable impact of strong equity market returns on our private equity funds and higher income on real estate investments. These increases were partially offset by lower yields on fixed income securities and mortgage loans, as well as decreased returns on FVO Securities. The net impact of interest rate fluctuations resulted in a decline in our average interest credited rates on deposit-type and long-duration liabilities, which drove a decrease in interest credited expenses. The changes in market factors discussed above resulted in a $2.8 billion increase in adjusted earnings.
Underwriting, Actuarial Assumption Review and Other Insurance Adjustments. Unfavorable underwriting resulted in an $850 million decrease in adjusted earnings and reflected impacts from the COVID-19 Pandemic. This was primarily driven by unfavorable mortality in our U.S. and Latin America segments, coupled with unfavorable claims experience in our EMEA and U.S. segments. The favorable change from our annual actuarial assumption reviews resulted in a net increase of $63 million in adjusted earnings. Changes in operational, biometric and economic assumptions were less unfavorable in the current period when compared to the prior period. Refinements to certain insurance and other liabilities in both periods resulted in a $43 million increase in adjusted earnings. Dividend scale reductions, as well as run-off in MLIC’s closed block, contributed to lower dividend expenses of $82 million and lower associated DAC amortization of $84 million, which increased adjusted earnings.
Expenses. Adjusted earnings increased $106 million compared to the prior period, primarily due to the release of a legal reserve in the current period and lower legal expenses.
Taxes. For the nine months ended September 30, 2021, our effective tax rate on adjusted earnings was equal to the U.S. statutory rate of 21% as tax benefits from tax credits, non-taxable investment income and the corporate tax deduction for stock compensation were offset by tax charges from foreign earnings taxed at different rates than the U.S. statutory rate. For the nine months ended September 30, 2020, our effective tax rate on adjusted earnings was 19%, which differed from the U.S. statutory rate of 21% primarily due to tax benefits from non-taxable investment income, tax credits and the finalization of bankruptcy proceedings for a leveraged lease investment, partially offset by tax charges from foreign earnings taxed at different rates than the U.S. statutory rate.
Segment Results and Corporate & Other
U.S.
Business Overview. Adjusted premiums, fees and other revenues for the three months ended September 30, 2021 decreased $425 million, or 6%, compared to the prior period. This was primarily due to a decrease of $908 million attributable to the disposition of MetLife P&C, as well as lower premiums in our RIS business, partially offset by growth in our Group Benefits business. See Note 3 of the Notes to the Interim Condensed Consolidated Financial Statements for further information regarding the MetLife P&C disposition. The increase in our Group Benefits business was primarily due to the current period impact of the Versant Health acquisition. In addition, growth in other core products was driven by increases in the group life and group disability businesses. Growth from our group life business included increased premiums from our participating contracts, which can fluctuate with claims experience. Growth in voluntary products was due to the impact of new sales and growth in membership in our accident & health and legal plans businesses. These increases were partially offset by lower dental premiums, driven by the impact of the release of an unearned premium reserve in the prior period. The decrease in premiums in RIS was mainly driven by the impact of prior period sales in the pension risk transfer business, partially offset by increases in our post-retirement, U.K. longevity reinsurance and structured settlement businesses. Changes in RIS premiums are mostly offset by a corresponding change in policyholder benefits.
Growth in RIS’s stable value and capital market investments businesses drove increases in policyholder account and separate account balances, resulting in higher fees and interest margins.
| Three Months Ended September 30, | Nine Months Ended September 30, | ||||||||||||||||||||||
| 2021 | 2020 | 2021 | 2020 | ||||||||||||||||||||
| (In millions) | |||||||||||||||||||||||
| Adjusted revenues | |||||||||||||||||||||||
| Premiums | $ | 5,746 | $ | 6,333 | $ | 16,919 | $ | 17,191 | |||||||||||||||
| Universal life and investment-type product policy fees | 279 | 263 | 858 | 806 | |||||||||||||||||||
| Net investment income | 2,098 | 1,827 | 6,106 | 5,018 | |||||||||||||||||||
| Other revenues | 383 | 237 | 1,159 | 717 | |||||||||||||||||||
| Total adjusted revenues | 8,506 | 8,660 | 25,042 | 23,732 | |||||||||||||||||||
| Adjusted expenses | |||||||||||||||||||||||
| Policyholder benefits and claims and policyholder dividends | 6,118 | 6,108 | 17,999 | 16,581 | |||||||||||||||||||
| Interest credited to policyholder account balances | 362 | 381 | 1,080 | 1,251 | |||||||||||||||||||
| Capitalization of DAC | (17) | (119) | (48) | (353) | |||||||||||||||||||
| Amortization of DAC and VOBA | 26 | 123 | 50 | 357 | |||||||||||||||||||
| Interest expense on debt | 1 | 2 | 4 | 6 | |||||||||||||||||||
| Other expenses | 886 | 1,026 | 2,695 | 3,104 | |||||||||||||||||||
| Total adjusted expenses | 7,376 | 7,521 | 21,780 | 20,946 | |||||||||||||||||||
| Provision for income tax expense (benefit) | 235 | 239 | 681 | 583 | |||||||||||||||||||
| Adjusted earnings | $ | 895 | $ | 900 | $ | 2,581 | $ | 2,203 | |||||||||||||||
| Adjusted premiums, fees and other revenues | $ | 6,408 | $ | 6,833 | $ | 18,936 | $ | 18,714 |
Three Months Ended September 30, 2021 Compared with the Three Months Ended September 30, 2020
Unless otherwise stated, all amounts discussed below are net of income tax.
The disposition of MetLife P&C decreased adjusted earnings by $18 million. All amounts discussed below are net of the results of this business.
Business Growth. The impact of positive flows from pension risk transfer transactions and funding agreement issuances resulted in higher average invested assets, improving net investment income. However, consistent with the growth in average invested assets, interest credited expenses on long-duration and deposit-type liabilities increased. Higher volume-related, premium tax and direct expenses, driven by business growth, were partially offset by the 2021 abatement of the annual health insurer fee under the PPACA. This net increase in expenses was more than offset by a corresponding increase in adjusted premiums, fees and other revenues. The combined impact of the items affecting our business growth increased adjusted earnings by $42 million.
Market Factors. Market factors, including interest rate levels, variability in equity market returns and foreign currency fluctuations, continued to impact our results; however, certain impacts were mitigated by derivatives used to hedge these risks. Investment yields increased primarily driven by the favorable impact of equity market returns on our private equity funds and higher income from real estate investments, partially offset by lower yields on fixed income securities and mortgage loans. The net impact of interest rate fluctuations resulted in a decline in our average interest credited rates on deposit-type and long-duration liabilities, which drove a decrease in interest credited expenses. The changes in market factors discussed above resulted in a $250 million increase in adjusted earnings.
Underwriting and Other Insurance Adjustments. Unfavorable mortality in our Group Benefits business resulted in a decrease in adjusted earnings of $312 million. This was primarily driven by increases in both incidence and severity in both COVID-19 and core claims in the current period. Favorable mortality in our RIS business, including the impact of the COVID-19 Pandemic, resulted in an increase in adjusted earnings of $38 million, driven by our structured settlement, pension risk transfer and institutional income annuity businesses. Unfavorable claims experience, partially offset by the impact of growth in our Group Benefits business, resulted in a $44 million decrease in adjusted earnings. This decrease was primarily driven by: (i) unfavorable dental results due to the impact of the release of an unearned premium reserve and reduced utilization, both in the prior period; and (ii) unfavorable claims experience in our group disability business. This unfavorable claims experience was partially offset by: (i) the impact of the acquisition of Versant Health on our vision business; (ii) the impact of business growth in our accident & health business; and (iii) favorable claims experience in our individual disability business. Refinements to certain insurance and other liabilities in both periods resulted in a $34 million increase in adjusted earnings.
Nine Months Ended September 30, 2021 Compared with the Nine Months Ended September 30, 2020
Unless otherwise stated, all amounts discussed below are net of income tax.
The disposition of MetLife P&C decreased adjusted earnings by $210 million. All amounts discussed below are net of the results of this business.
Business Growth. The impact of positive flows from pension risk transfer transactions and funding agreement issuances resulted in higher average invested assets, improving net investment income. However, consistent with the growth in average invested assets, interest credited expenses on long-duration and deposit-type liabilities increased. Higher volume-related, premium tax and direct expenses, driven by business growth, were partially offset by the 2021 abatement of the annual health insurer fee under the PPACA. This net increase in expenses was more than offset by a corresponding increase in adjusted premiums, fees and other revenues. The combined impact of the items affecting our business growth increased adjusted earnings by $115 million.
Market Factors. Market factors, including interest rate levels, variability in equity market returns and foreign currency fluctuations, continued to impact our results; however, certain impacts were mitigated by derivatives used to hedge these risks. Investment yields increased primarily driven by the favorable impact of equity market returns on our private equity funds and higher income on real estate investments, partially offset by lower yields on fixed income securities and mortgage loans. The net impact of interest rate fluctuations resulted in a decline in our average interest credited rates on deposit-type and long-duration liabilities, which drove a decrease in interest credited expenses. The changes in market factors discussed above resulted in a $1.0 billion increase in adjusted earnings.
Underwriting and Other Insurance Adjustments. Unfavorable mortality in our Group Benefits business resulted in a decrease in adjusted earnings of $587 million. This was primarily driven by: (i) increases in both incidence and severity in both COVID-19 and core claims across our life businesses; and (ii) unfavorable results in our accidental death & dismemberment business due to lower incidence in the prior period as a result of the COVID-19 Pandemic. Favorable mortality in our RIS business, including the impact of the COVID-19 Pandemic, resulted in an increase in adjusted earnings of $73 million, driven by our pension risk transfer, specialized benefit resource and structured settlement businesses, partially offset by unfavorable results in our institutional income annuity business. Unfavorable claims experience, partially offset by the impact of growth in our Group Benefits business, resulted in a $43 million decrease in adjusted earnings, primarily due to: (i) unfavorable claims experience in our group disability business; and (ii) unfavorable dental results, as a result of the COVID-19 Pandemic, which limited availability of services and reduced utilization in the prior period, partially offset by: (i) the impact of the acquisition of Versant Health on our vision business; (ii) favorable claims experience in the individual disability business; and (iii) the impact of business growth in our accident & health business. Refinements to certain insurance and other liabilities in both periods resulted in a $4 million increase in adjusted earnings.
Asia
Business Overview. Adjusted premiums, fees and other revenues for the three months ended September 30, 2021 decreased $177 million, or 8%, compared to the prior period. Adjusted premiums, fees and other revenues, net of foreign currency fluctuations, decreased $137 million, or 6% compared to the prior period, mainly due to the impact of our annual actuarial assumption review in both periods. In addition, higher fees from foreign currency-denominated life products and business growth in other markets were largely offset by a decrease in premiums from yen-denominated life products.
| Three Months Ended September 30, | Nine Months Ended September 30, | ||||||||||||||||||||||
| 2021 | 2020 | 2021 | 2020 | ||||||||||||||||||||
| (In millions) | |||||||||||||||||||||||
| Adjusted revenues | |||||||||||||||||||||||
| Premiums | $ | 1,594 | $ | 1,654 | $ | 4,861 | $ | 4,874 | |||||||||||||||
| Universal life and investment-type product policy fees | 477 | 595 | 1,371 | 1,445 | |||||||||||||||||||
| Net investment income | 1,354 | 1,088 | 3,776 | 2,792 | |||||||||||||||||||
| Other revenues | 17 | 16 | 54 | 44 | |||||||||||||||||||
| Total adjusted revenues | 3,442 | 3,353 | 10,062 | 9,155 | |||||||||||||||||||
| Adjusted expenses | |||||||||||||||||||||||
| Policyholder benefits and claims and policyholder dividends | 1,220 | 1,291 | 3,750 | 3,867 | |||||||||||||||||||
| Interest credited to policyholder account balances | 513 | 470 | 1,498 | 1,362 | |||||||||||||||||||
| Capitalization of DAC | (373) | (431) | (1,203) | (1,203) | |||||||||||||||||||
| Amortization of DAC and VOBA | 470 | 506 | 1,080 | 1,105 | |||||||||||||||||||
| Amortization of negative VOBA | (5) | (14) | (20) | (30) | |||||||||||||||||||
| Other expenses | 811 | 869 | 2,542 | 2,540 | |||||||||||||||||||
| Total adjusted expenses | 2,636 | 2,691 | 7,647 | 7,641 | |||||||||||||||||||
| Provision for income tax expense (benefit) | 237 | 197 | 703 | 443 | |||||||||||||||||||
| Adjusted earnings | $ | 569 | $ | 465 | $ | 1,712 | $ | 1,071 | |||||||||||||||
| Adjusted earnings on a constant currency basis | $ | 569 | $ | 466 | $ | 1,712 | $ | 1,104 | |||||||||||||||
| Adjusted premiums, fees and other revenues | $ | 2,088 | $ | 2,265 | $ | 6,286 | $ | 6,363 | |||||||||||||||
| Adjusted premiums, fees and other revenues on a constant currency basis | $ | 2,088 | $ | 2,225 | $ | 6,286 | $ | 6,426 |
Three Months Ended September 30, 2021 Compared with the Three Months Ended September 30, 2020
Unless otherwise stated, all amounts discussed below are net of income tax.
Foreign Currency. Changes in foreign currency exchange rates did not have a material impact on adjusted earnings for the third quarter of 2021 compared to the prior period. Unless otherwise stated, all amounts discussed below are net of foreign currency fluctuations. Foreign currency fluctuations can result in significant variances in the financial statement line items.
Business Growth. Asia’s adjusted premiums, fees and other revenues decreased compared to the prior period as discussed above; however, this was more than offset by a decline in policyholder benefits, lower commissions and variable expenses, net of DAC capitalization, which resulted in an increase to adjusted earnings. Positive net flows in Japan and Korea resulted in higher average invested assets, which improved net investment income. The increase in net investment income was partially offset by a corresponding increase in interest credited expenses on certain insurance liabilities. The combined impact of the items affecting our business growth improved adjusted earnings by $23 million.
Market Factors. Market factors, including interest rate levels and variability in equity market returns, continued to impact our results. Investment yields increased driven by the favorable impact of equity market returns on our private equity funds and higher income on real estate investments, partially offset by lower yields on fixed income securities supporting products sold in Japan denominated in U.S. and Australian dollars. In addition, a decrease in interest credited expense improved adjusted earnings. The changes in market factors discussed above increased adjusted earnings by $157 million.
Underwriting and Actuarial Assumption Review. Higher claims, primarily in Japan and Korea decreased adjusted earnings by $28 million. The unfavorable change from our annual actuarial assumption reviews resulted in a net decrease of $51 million in adjusted earnings.
Nine Months Ended September 30, 2021 Compared with the Nine Months Ended September 30, 2020
Unless otherwise stated, all amounts discussed below are net of income tax.
Foreign Currency. Changes in foreign currency exchange rates increased adjusted earnings by $33 million for the first nine months of 2021 compared to the prior period, primarily due to the strengthening of the Australian dollar and Korean won against the U.S. dollar. Unless otherwise stated, all amounts discussed below are net of foreign currency fluctuations. Foreign currency fluctuations can result in significant variances in the financial statement line items.
Business Growth. Asia’s adjusted premiums, fees and other revenues decreased as compared to the prior period; however, this was more than offset by a decline in policyholder benefits, which improved adjusted earnings. Positive net flows in Japan and Korea resulted in higher average invested assets, which improved net investment income. The increase in net investment income was offset by a corresponding increase in interest credited expenses on certain insurance liabilities. The combined impact of the items affecting our business growth improved adjusted earnings by $56 million.
Market Factors. Market factors, including interest rate levels and variability in equity market returns, continued to impact our results; however, certain impacts were mitigated by derivatives used to hedge these risks. Investment yields increased driven by the favorable impact of equity market returns on our private equity funds and higher income on real estate investments, partially offset by lower yields on fixed income securities supporting products sold in Japan denominated in U.S. and Australian dollars. In addition, a decrease in interest credited expense improved adjusted earnings. The changes in market factors discussed above increased adjusted earnings by $587 million.
Underwriting, Actuarial Assumption Review and Other Insurance Adjustments. Higher lapses in Japan and claims in Korea, partially offset by lower claims in Japan, resulted in a slight decrease in adjusted earnings. The unfavorable change from our annual actuarial assumption reviews resulted in a net decrease of $51 million in adjusted earnings. Refinements to certain insurance liabilities and other liabilities in both periods resulted in a $10 million increase in adjusted earnings.
Expenses. Adjusted earnings increased by $12 million, primarily driven by lower operating expenses in Japan and lower corporate overhead.
Latin America
Business Overview. Adjusted premiums, fees and other revenues for the three months ended September 30, 2021 increased $227 million, or 30%, compared to the prior period. Adjusted premiums, fees and other revenues, net of foreign currency fluctuations, increased $181 million, or 22%, compared to the prior period, mainly driven by an improvement in the annuity market in Chile and strong sales and persistency across the region.
| Three Months Ended September 30, | Nine Months Ended September 30, | ||||||||||||||||||||||
| 2021 | 2020 | 2021 | 2020 | ||||||||||||||||||||
| (In millions) | |||||||||||||||||||||||
| Adjusted revenues | |||||||||||||||||||||||
| Premiums | $ | 705 | $ | 529 | $ | 1,936 | $ | 1,658 | |||||||||||||||
| Universal life and investment-type product policy fees | 274 | 225 | 831 | 733 | |||||||||||||||||||
| Net investment income | 306 | 221 | 913 | 699 | |||||||||||||||||||
| Other revenues | 9 | 7 | 30 | 28 | |||||||||||||||||||
| Total adjusted revenues | 1,294 | 982 | 3,710 | 3,118 | |||||||||||||||||||
| Adjusted expenses | |||||||||||||||||||||||
| Policyholder benefits and claims and policyholder dividends | 885 | 575 | 2,370 | 1,634 | |||||||||||||||||||
| Interest credited to policyholder account balances | 63 | 52 | 182 | 178 | |||||||||||||||||||
| Capitalization of DAC | (109) | (84) | (304) | (258) | |||||||||||||||||||
| Amortization of DAC and VOBA | 62 | 62 | 205 | 206 | |||||||||||||||||||
| Interest expense on debt | 2 | 1 | 4 | 3 | |||||||||||||||||||
| Other expenses | 363 | 313 | 1,041 | 965 | |||||||||||||||||||
| Total adjusted expenses | 1,266 | 919 | 3,498 | 2,728 | |||||||||||||||||||
| Provision for income tax expense (benefit) | (1) | 24 | 46 | 124 | |||||||||||||||||||
| Adjusted earnings | $ | 29 | $ | 39 | $ | 166 | $ | 266 | |||||||||||||||
| Adjusted earnings on a constant currency basis | $ | 29 | $ | 41 | $ | 166 | $ | 291 | |||||||||||||||
| Adjusted premiums, fees and other revenues | $ | 988 | $ | 761 | $ | 2,797 | $ | 2,419 | |||||||||||||||
| Adjusted premiums, fees and other revenues on a constant currency basis | $ | 988 | $ | 807 | $ | 2,797 | $ | 2,571 |
Three Months Ended September 30, 2021 Compared with the Three Months Ended September 30, 2020
Unless otherwise stated, all amounts discussed below are net of income tax.
Foreign Currency. Changes in foreign currency exchange rates resulted in a slight increase in adjusted earnings for the third quarter of 2021 compared to the prior period. Unless otherwise stated, all amounts discussed below are net of foreign currency fluctuations. Foreign currency fluctuations can result in significant variances in the financial statement line items.
Business Growth. Latin America experienced growth across several lines of business, primarily within Chile and Mexico. While this growth resulted in increased premiums and policy fee income, it was largely offset by related changes in policyholder benefits. A decrease in average invested assets, primarily in Argentina, resulted in lower net investment income. Although business growth drove an increase in commissions and other variable expenses, this was largely offset by a corresponding increase in DAC capitalization. The combined impact of the items affecting business growth increased adjusted earnings by $31 million.
Market Factors. Market factors, including interest rate levels and variability in equity market returns, continued to impact our results; however, certain impacts were mitigated by derivatives used to hedge these risks. Investment yields increased driven by higher returns on private equity funds and higher prepayment income. The changes in market factors discussed above increased adjusted earnings by $22 million.
Underwriting, Actuarial Assumption Review and Other Insurance Adjustments. Unfavorable underwriting drove a $86 million decrease in adjusted earnings which includes impacts from COVID-19-related claims, primarily in Mexico and Brazil. The favorable change from our annual actuarial assumption reviews resulted in a net increase of $7 million in adjusted earnings. Refinements to certain insurance liabilities and other liabilities in both periods resulted in an $11 million increase in adjusted earnings.
Expenses and Taxes. Our focus on investing in growth drove increases in technology and employee-related expenses, partially offset by the impact of continued expense discipline, resulting in a net decrease in adjusted earnings of $7 million. Tax-related adjustments in both periods resulted in a $12 million increase in adjusted earnings, primarily driven by a recurring tax item related to inflation in both Mexico and Chile, as well as a current period tax adjustment in Brazil.
Nine Months Ended September 30, 2021 Compared with the Nine Months Ended September 30, 2020
Unless otherwise stated, all amounts discussed below are net of income tax.
Foreign Currency. Changes in foreign currency exchange rates increased adjusted earnings by $25 million for the first nine months of 2021 compared to the prior period, mainly due to the strengthening of foreign currencies against the U.S. dollar, primarily the Mexican and Chilean pesos. Unless otherwise stated, all amounts discussed below are net of foreign currency fluctuations. Foreign currency fluctuations can result in significant variances in the financial statement line items.
Business Growth. Despite a decrease in annuity premiums in Chile driven by the COVID-19 Pandemic, Latin America experienced premium and fee growth in Mexico. The net increase in premiums and fees was largely offset by related changes in policyholder benefits. An increase in average invested assets, primarily in Chile, generated higher net investment income. In addition, DAC amortization and interest credited expenses on certain insurance liabilities decreased. Although business growth in Mexico drove an increase in commissions and other variable expenses, this was mostly offset by higher DAC capitalization. The combined impact of the items affecting business growth increased adjusted earnings by $57 million.
Market Factors. Market factors, including interest rate levels and variability in equity market returns, continued to impact our results; however, certain impacts were mitigated by derivatives used to hedge these risks. Investment yields increased driven by higher returns on private equity funds and higher prepayment income, partially offset by lower yields on fixed income securities and the unfavorable impact of rising rates on FVO Securities within our Chilean encaje. In addition, interest credited expense decreased. The changes in market factors discussed above increased adjusted earnings by $40 million.
Underwriting, Actuarial Assumption Review and Other Insurance Adjustments. Unfavorable underwriting drove a $264 million decrease in adjusted earnings which includes impacts from COVID-19-related life claims, primarily in Mexico. The favorable change from our annual actuarial assumption reviews resulted in a net increase of $7 million in adjusted earnings. Refinements to certain insurance liabilities and other liabilities in both periods resulted in a $15 million increase in adjusted earnings.
Expenses and Taxes. A prior period information technology charge and expense discipline across the region, partially offset by investments in technology in the current period, drove an increase in adjusted earnings of $8 million. Tax-related adjustments in both periods resulted in a $12 million increase in adjusted earnings, primarily driven by a recurring tax item related to inflation in both Mexico and Chile.
EMEA
Business Overview. Adjusted premiums, fees and other revenues for the three months ended September 30, 2021 decreased $10 million, or 1%, compared to the prior period. Adjusted premiums, fees and other revenues, net of foreign currency fluctuations, decreased $12 million, or 2%, compared to the prior period primarily due to the disposition of MetLife Russia and the pending disposition of MetLife Poland and Greece, partially offset by growth in our (i) corporate solutions business in the U.K., (ii) accident & health and ordinary life businesses across the region, and (iii) pension business in Romania, as well as a favorable refinement to an unearned revenue reserve in Czech Republic and Slovakia.
| Three Months Ended September 30, | Nine Months Ended September 30, | ||||||||||||||||||||||
| 2021 | 2020 | 2021 | 2020 | ||||||||||||||||||||
| (In millions) | |||||||||||||||||||||||
| Adjusted revenues | |||||||||||||||||||||||
| Premiums | $ | 532 | $ | 551 | $ | 1,751 | $ | 1,676 | |||||||||||||||
| Universal life and investment-type product policy fees | 128 | 116 | 302 | 324 | |||||||||||||||||||
| Net investment income | 46 | 67 | 171 | 199 | |||||||||||||||||||
| Other revenues | 10 | 13 | 39 | 37 | |||||||||||||||||||
| Total adjusted revenues | 716 | 747 | 2,263 | 2,236 | |||||||||||||||||||
| Adjusted expenses | |||||||||||||||||||||||
| Policyholder benefits and claims and policyholder dividends | 268 | 304 | 944 | 877 | |||||||||||||||||||
| Interest credited to policyholder account balances | 17 | 29 | 66 | 83 | |||||||||||||||||||
| Capitalization of DAC | (110) | (122) | (359) | (367) | |||||||||||||||||||
| Amortization of DAC and VOBA | 118 | 125 | 274 | 340 | |||||||||||||||||||
| Amortization of negative VOBA | (1) | (1) | (5) | (5) | |||||||||||||||||||
| Other expenses | 308 | 340 | 1,006 | 1,000 | |||||||||||||||||||
| Total adjusted expenses | 600 | 675 | 1,926 | 1,928 | |||||||||||||||||||
| Provision for income tax expense (benefit) | 22 | 20 | 78 | 62 | |||||||||||||||||||
| Adjusted earnings | $ | 94 | $ | 52 | $ | 259 | $ | 246 | |||||||||||||||
| Adjusted earnings on a constant currency basis | $ | 94 | $ | 52 | $ | 259 | $ | 254 | |||||||||||||||
| Adjusted premiums, fees and other revenues | $ | 670 | $ | 680 | $ | 2,092 | $ | 2,037 | |||||||||||||||
| Adjusted premiums, fees and other revenues on a constant currency basis | $ | 670 | $ | 682 | $ | 2,092 | $ | 2,087 |
Three Months Ended September 30, 2021 Compared with the Three Months Ended September 30, 2020
Unless otherwise stated, all amounts discussed below are net of income tax.
Foreign Currency. Changes in foreign currency exchange rates did not have a material impact on adjusted earnings for the third quarter of 2021 as compared to the prior period. Unless otherwise stated, all amounts discussed below are net of foreign currency fluctuations. Foreign currency fluctuations can result in significant variances in the financial statement line items.
Business Growth. Growth in our (i) corporate solutions business in the U.K., (ii) pension business in Romania, (iii) ordinary life and accident & health businesses in Europe, and (iv) credit life business in Turkey resulted in a $14 million increase in adjusted earnings.
Market Factors. Market factors, including interest rate levels and variability in equity market returns favorably impacted results and increased adjusted earnings by $6 million.
Underwriting and Actuarial Assumption Review. Adjusted earnings increased $3 million as a result of favorable underwriting experience in our corporate solutions business across the region, partially offset by unfavorable underwriting experience in our (i) accident & health business in Europe and the Gulf, (ii) ordinary life business in Portugal, the Gulf and Hungary, and (iii) variable life business in Czech Republic. The favorable change from our annual actuarial assumption reviews resulted in a net increase of $25 million in adjusted earnings.
Expenses. Lower expenses resulted in a slight increase in adjusted earnings.
Other. In addition to the items discussed above, adjusted earnings decreased by $8 million due to the pending disposition of MetLife Poland and Greece and the disposition of MetLife Russia.
Nine Months Ended September 30, 2021 Compared with the Nine Months Ended September 30, 2020
Unless otherwise stated, all amounts discussed below are net of income tax.
Foreign Currency. Changes in foreign currency exchange rates increased adjusted earnings by $8 million for the first nine months of 2021 as compared to the prior period, primarily driven by the weakening of the U.S. dollar against the euro, the British pound, Czech koruna and the Polish zloty, partially offset by the strengthening of the U.S. dollar against the Turkish lira. Unless otherwise stated, all amounts discussed below are net of foreign currency fluctuations. Foreign currency fluctuations can result in significant variances in the financial statement line items.
Business Growth. Growth in our (i) corporate solutions business in the U.K., (ii) pension business in Romania, and (iii) ordinary life and accident & health businesses in Europe resulted in a $32 million increase in adjusted earnings.
Market Factors. Market factors, including interest rate levels and variability in equity market returns favorably impacted results and increased adjusted earnings by $14 million. This was primarily due to a decrease in DAC amortization in our variable life business.
Underwriting, Actuarial Assumption Review and Other Insurance Adjustments. Adjusted earnings decreased $50 million as a result of unfavorable underwriting experience, primarily due to the impact of the COVID-19 Pandemic, which resulted in lower utilization in the prior period and higher claims in the current period. Unfavorable underwriting experience in our (i) corporate solutions business across the region, (ii) variable life business in the Gulf, Lebanon and Czech Republic, and (iii) accident & health business in Europe and the Gulf was partially offset by favorable underwriting experience in our ordinary life business in France. The favorable change from our annual actuarial assumption reviews resulted in a net increase of $25 million in adjusted earnings. Refinements to certain insurance-related assets and liabilities in both periods resulted in a $14 million increase in adjusted earnings.
Expenses and Taxes. Higher expenses resulted in a $3 million decrease in adjusted earnings. Taxes decreased adjusted earnings by $13 million, primarily due to changes in business mix among tax jurisdictions, as well as a revision to a tax asset in Greece.
Other. In addition to the items discussed above, adjusted earnings decreased by $14 million due to the pending disposition of MetLife Poland and Greece and the disposition of MetLife Russia.
MetLife Holdings
Business Overview. Our MetLife Holdings segment consists of operations relating to products and businesses, previously included in our former retail business, that we no longer actively market in the United States. We anticipate an average decline in adjusted premiums, fees and other revenues of approximately 5% to 7% per year from expected business run-off. A significant portion of our adjusted earnings is driven by separate account balances. Most directly, these balances determine asset-based fee income but they also impact DAC amortization and asset-based commissions. Separate account balances are driven by movements in the market, surrenders, deposits, withdrawals, benefit payments, transfers and policy charges. Although we have discontinued selling our long-term care product, we continue to collect premiums and administer the existing block of business, which contributed to asset growth in the segment, and we expect the related reserves to grow as this block matures.
| Three Months Ended September 30, | Nine Months Ended September 30, | ||||||||||||||||||||||
| 2021 | 2020 | 2021 | 2020 | ||||||||||||||||||||
| (In millions) | |||||||||||||||||||||||
| Adjusted revenues | |||||||||||||||||||||||
| Premiums | $ | 805 | $ | 876 | $ | 2,471 | $ | 2,669 | |||||||||||||||
| Universal life and investment-type product policy fees | 279 | 269 | 826 | 812 | |||||||||||||||||||
| Net investment income | 1,771 | 1,427 | 4,960 | 3,723 | |||||||||||||||||||
| Other revenues | 57 | 61 | 188 | 166 | |||||||||||||||||||
| Total adjusted revenues | 2,912 | 2,633 | 8,445 | 7,370 | |||||||||||||||||||
| Adjusted expenses | |||||||||||||||||||||||
| Policyholder benefits and claims and policyholder dividends | 1,611 | 1,697 | 4,683 | 5,063 | |||||||||||||||||||
| Interest credited to policyholder account balances | 212 | 217 | 632 | 654 | |||||||||||||||||||
| Capitalization of DAC | (8) | (5) | (25) | (15) | |||||||||||||||||||
| Amortization of DAC and VOBA | 80 | 177 | 190 | 288 | |||||||||||||||||||
| Interest expense on debt | 1 | 2 | 4 | 5 | |||||||||||||||||||
| Other expenses | 255 | 231 | 752 | 698 | |||||||||||||||||||
| Total adjusted expenses | 2,151 | 2,319 | 6,236 | 6,693 | |||||||||||||||||||
| Provision for income tax expense (benefit) | 155 | 61 | 449 | 127 | |||||||||||||||||||
| Adjusted earnings | $ | 606 | $ | 253 | $ | 1,760 | $ | 550 | |||||||||||||||
| Adjusted premiums, fees and other revenues | $ | 1,141 | $ | 1,206 | $ | 3,485 | $ | 3,647 |
Three Months Ended September 30, 2021 Compared with the Three Months Ended September 30, 2020
Unless otherwise stated, all amounts discussed below are net of income tax.
Business Growth. Negative net flows in our annuity business resulted in lower asset-based fee income. In addition, premiums declined due to business run-off and the impact of dividend scale reductions in both periods. These reductions to adjusted earnings were partially offset by a slight increase to net investment income as a result of higher average invested assets. The combined impact of the items affecting our business growth resulted in a $16 million decrease in adjusted earnings.
Market Factors. Market factors, including interest rate levels, variability in equity market returns, and foreign currency fluctuations, continued to impact our results; however, certain impacts were mitigated by derivatives used to hedge these risks. Investment yields increased driven by the favorable impact of equity market returns on our private equity funds and higher prepayment income, partially offset by lower yields on fixed income securities. In our deferred annuity business, higher equity market returns drove higher asset-based fee income, which increased adjusted earnings. The changes in market factors discussed above, partially offset by higher DAC amortization, resulted in a $266 million increase in adjusted earnings.
Underwriting, Actuarial Assumption Review, and Other Insurance Adjustments. Adjusted earnings decreased by $62 million, driven by unfavorable underwriting in our long-term care and life business. Underwriting results are inclusive of the impact of the COVID-19 Pandemic, where the current period was more negatively impacted. The favorable change from our annual actuarial assumption reviews resulted in a net increase of $82 million in adjusted earnings. Dividend scale reductions, as well as run-off in MLIC’s closed block, contributed to lower dividend expenses of $9 million and lower associated DAC amortization of $84 million, which increased adjusted earnings.
Expenses. Adjusted earnings decreased by $13 million mainly due to higher corporate-related expenses.
Nine Months Ended September 30, 2021 Compared with the Nine Months Ended September 30, 2020
Unless otherwise stated, all amounts discussed below are net of income tax.
Business Growth. Negative net flows in our annuity business resulted in lower asset-based fee income. In addition, premiums declined due to business run-off and the impact of dividend scale reductions in both periods. Average invested assets were essentially unchanged with no impact to net investment income. The combined impact of the items affecting our business growth, including higher DAC amortization, resulted in a $51 million decrease in adjusted earnings.
Market Factors. Market factors, including interest rate levels, variability in equity market returns, and foreign currency fluctuations, continued to impact our results; however, certain impacts were mitigated by derivatives used to hedge these risks. Investment yields increased driven by the favorable impact of equity market returns on our private equity funds and higher prepayment income, partially offset by lower yields on fixed income securities. In our deferred annuity business, higher equity market returns drove higher asset-based fee income, which increased adjusted earnings. The changes in market factors discussed above, partially offset by higher DAC amortization, resulted in a $1.0 billion increase in adjusted earnings.
Underwriting, Actuarial Assumption Review, and Other Insurance Adjustments. Favorable underwriting, mainly in our long-term care business, resulted in a $15 million increase in adjusted earnings, which reflects the impact of the COVID-19 Pandemic. The favorable change from our annual actuarial assumption reviews resulted in a net increase of $82 million in adjusted earnings. Dividend scale reductions, as well as run-off in MLIC’s closed block, contributed to lower dividend expenses of $82 million and lower associated DAC amortization of $84 million, which increased adjusted earnings.
Expenses. Adjusted earnings decreased by $32 million mainly due to higher corporate-related expenses.
Corporate & Other
| Three Months Ended September 30, | Nine Months Ended September 30, | ||||||||||||||||||||||
| 2021 | 2020 | 2021 | 2020 | ||||||||||||||||||||
| (In millions) | |||||||||||||||||||||||
| Adjusted revenues | |||||||||||||||||||||||
| Premiums | $ | 16 | $ | (8) | $ | 54 | $ | 17 | |||||||||||||||
| Universal life and investment-type product policy fees | — | 1 | 1 | 2 | |||||||||||||||||||
| Net investment income | 93 | 58 | 153 | 22 | |||||||||||||||||||
| Other revenues | 108 | 82 | 303 | 238 | |||||||||||||||||||
| Total adjusted revenues | 217 | 133 | 511 | 279 | |||||||||||||||||||
| Adjusted expenses | |||||||||||||||||||||||
| Policyholder benefits and claims and policyholder dividends | 9 | (6) | 36 | 23 | |||||||||||||||||||
| Capitalization of DAC | (3) | (3) | (9) | (8) | |||||||||||||||||||
| Amortization of DAC and VOBA | 2 | 2 | 7 | 6 | |||||||||||||||||||
| Interest expense on debt | 236 | 224 | 683 | 669 | |||||||||||||||||||
| Other expenses | 137 | 120 | 278 | 390 | |||||||||||||||||||
| Total adjusted expenses | 381 | 337 | 995 | 1,080 | |||||||||||||||||||
| Provision for income tax expense (benefit) | (96) | (132) | (288) | (418) | |||||||||||||||||||
| Adjusted earnings | (68) | (72) | (196) | (383) | |||||||||||||||||||
| Less: Preferred stock dividends | 63 | 59 | 166 | 168 | |||||||||||||||||||
| Adjusted earnings available to common shareholders | $ | (131) | $ | (131) | $ | (362) | $ | (551) | |||||||||||||||
| Adjusted premiums, fees and other revenues | $ | 124 | $ | 75 | $ | 358 | $ | 257 |
The table below presents adjusted earnings available to common shareholders by source:
| Three Months Ended September 30, | Nine Months Ended September 30, | |||||||||||||||||||||||||
| 2021 | 2020 | 2021 | 2020 | |||||||||||||||||||||||
| (In millions) | ||||||||||||||||||||||||||
| Business activities | $ | 41 | $ | 30 | $ | 98 | $ | 60 | ||||||||||||||||||
| Net investment income | 95 | 59 | 159 | 26 | ||||||||||||||||||||||
| Interest expense on debt | (247) | (238) | (716) | (705) | ||||||||||||||||||||||
| Corporate initiatives and projects | (25) | (27) | (74) | (83) | ||||||||||||||||||||||
| Other | (28) | (28) | 49 | (99) | ||||||||||||||||||||||
| Provision for income tax (expense) benefit and other tax-related items | 96 | 132 | 288 | 418 | ||||||||||||||||||||||
| Preferred stock dividends | (63) | (59) | (166) | (168) | ||||||||||||||||||||||
| Adjusted earnings available to common shareholders | $ | (131) | $ | (131) | $ | (362) | $ | (551) |
Three Months Ended September 30, 2021 Compared with the Three Months Ended September 30, 2020
Unless otherwise stated, all amounts discussed below are net of income tax.
Business Activities. Adjusted earnings from business activities increased $9 million. This was primarily related to improved results from certain of our businesses.
Net Investment Income. Net investment income increased $28 million, primarily due to increased returns on our equity market sensitive investments, including private equity funds, and higher income on real estate investments. These increases were partially offset by lower yields on our fixed income securities and decreased returns on FVO Securities.
Interest Expense on Debt. Interest expense on debt increased $7 million, primarily due to excess premium associated with redeemed debt in the current period.
Provision for Income Tax (Expense) Benefit and Other Tax-Related Items. An unfavorable change in Corporate & Other’s effective tax rate was primarily due to lower utilization of tax preferenced items, which include foreign earnings taxed at different rates than the U.S. statutory rate, non-taxable investment income, and tax credits.
Nine Months Ended September 30, 2021 Compared with the Nine Months Ended September 30, 2020
Unless otherwise stated, all amounts discussed below are net of income tax.
Business Activities. Adjusted earnings from business activities increased $30 million. This was primarily related to improved results from certain of our businesses.
Net Investment Income. Net investment income increased $105 million, primarily due to increased returns on our equity market sensitive investments, including private equity funds, as well as increased income on real estate investments. These increases were partially offset by lower yields on our fixed income securities and decreased returns on FVO Securities.
Interest Expense on Debt. Interest expense on debt increased $9 million, primarily due to excess premium associated with redeemed debt in the current period.
Provision for Income Tax (Expense) Benefit and Other Tax-Related Items. An unfavorable change in Corporate & Other’s taxes was primarily due to the finalization of bankruptcy proceedings for a leveraged lease investment in the prior period, lower taxes on stock compensation and lower utilization of tax preferenced items, which include non-taxable investment income, tax credits and foreign earnings taxed at different rates than the U.S. statutory rate.
Other. Adjusted earnings increased $117 million, primarily as a result of the release of a legal reserve in the current period, lower legal expenses and a decrease in certain corporate-related expenses, partially offset by an increase in employee-related expenses and higher interest expense on tax positions due to audit settlements in both periods.
Investments
Investment Risks
Our primary investment objective is to optimize, net of income tax, risk-adjusted investment income and risk-adjusted total return while ensuring that assets and liabilities are managed on a cash flow and duration basis. The Investments Department, led by the Chief Investment Officer, manages investment risks using a risk control framework comprised of policies, procedures and limits. The Investment Risk Committee and Asset-Liability Steering Committee review and monitor investment risk limits and tolerances. See “Management’s Discussion and Analysis of Financial Condition and Results of Operations — Investments — Investment Risks” included in the 2020 Annual Report for an explanation of investment risks and our risk control framework.
Current Environment
As a global insurance company, we continue to be impacted by the changing global financial and economic environment, the fiscal and monetary policy of governments and central banks around the world and other governmental measures. The COVID-19 Pandemic continues to impact the global economy and financial markets and has caused volatility in the global equity, credit and real estate markets. See “— Industry Trends — Financial and Economic Environment.” Uncertainty created by the COVID-19 Pandemic may persist for some time and may continue to impact pricing levels of risk-bearing investments, as well as our business operations, investment portfolio and derivatives.
Governments and central banks around the world responded to the COVID-19 Pandemic with unprecedented fiscal and monetary policies, which have had significant effects and may have ongoing effects on financial markets and the global economy. These policy responses include both fiscal and monetary stimulus measures. Many of these policy responses have concluded, and the Federal Reserve announced reductions in the amount of support provided by asset purchases starting in November 2021 and its officials suggested that they may raise interest rates in 2022.
Selected Country and Sector Investments
Selected Country: We have a market presence in numerous countries and, therefore, our investment portfolio, which supports our insurance operations and related policyholder liabilities, as well as our global portfolio diversification objectives, is exposed to risks posed by local political and economic conditions, as well as those resulting from the COVID-19 Pandemic. Our investment portfolio is currently the most affected by these conditions for the countries in the table below. The following table presents a summary of selected country fixed maturity securities AFS, at estimated fair value. The information below is presented on a “country of risk basis” (e.g. where the issuer primarily conducts business).
| Selected Country Fixed Maturity Securities AFS at September 30, 2021 | |||||||||||||||||||||||||||||
| Country | Sovereign (1) | Financial Services | Non-Financial Services | Structured Products | Total (2) | ||||||||||||||||||||||||
| (Dollars in millions) | |||||||||||||||||||||||||||||
| Mexico | $ | 2,583 | $ | 752 | $ | 2,127 | $ | 34 | $ | 5,496 | |||||||||||||||||||
| Chile | 1,377 | 849 | 2,961 | 2 | 5,189 | ||||||||||||||||||||||||
| Colombia | 369 | 74 | 195 | — | 638 | ||||||||||||||||||||||||
| Peru | 119 | 48 | 256 | — | 423 | ||||||||||||||||||||||||
| Turkey | 98 | 2 | 16 | — | 116 | ||||||||||||||||||||||||
| Argentina | 12 | — | 7 | — | 19 | ||||||||||||||||||||||||
| Total | $ | 4,558 | $ | 1,725 | $ | 5,562 | $ | 36 | $ | 11,881 | |||||||||||||||||||
| Investment grade % | 88.9 | % | 92.0 | % | 89.4 | % | 90.5 | % | 89.6 | % |
(1)Sovereign includes government and agency.
(2)The par value, amortized cost net of ACL, and estimated fair value, net of purchased credit default swaps, of these selected country fixed maturity securities AFS were $11.4 billion, $10.9 billion and $11.1 billion, respectively, at September 30, 2021. The notional value and estimated fair value of the purchased credit default swaps were $760 million and $3 million, respectively, at September 30, 2021.
Selected Sector: As a result of current economic conditions including the effects on the global economy and financial markets from the COVID-19 Pandemic, certain sectors of our investment portfolio have continued to experience stress. Our fixed maturity securities AFS exposure to stressed sectors is summarized below:
| Selected Sectors at September 30, 2021 | |||||||||||||||||
| Sectors | Book Value (1) | Investment Grade % | % of Total Investments | ||||||||||||||
| (Dollars in millions) | |||||||||||||||||
| Airports | $ | 3,234 | 82 | % | 0.6 | % | |||||||||||
| Cruise Lines / Leisure | 896 | 94 | % | 0.2 | |||||||||||||
| Airlines | 465 | 69 | % | 0.1 | |||||||||||||
| Restaurants | 421 | 96 | % | 0.1 | |||||||||||||
| Lodging | 185 | 65 | % | — | |||||||||||||
| Fixed Maturity Securities AFS Exposure to Stressed Sectors (2) | $ | 5,201 | 1.0 | % | |||||||||||||
| Total Investments (3) | $ | 514,635 | |||||||||||||||
(1)Fixed maturity securities AFS at amortized cost, net of ACL.
(2)The par value, estimated fair value, and estimated fair value, net of written credit default swaps, of these securities were $5.2 billion, $5.6 billion and $5.7 billion, respectively, at September 30, 2021. The notional value and estimated fair value of the written credit default swaps were $169 million and $3 million, respectively, at September 30, 2021.
(3)Represents total cash, cash equivalents and invested assets.
We maintain a portfolio of Airports sector fixed maturity securities AFS that is diversified across issuers and geographies, with 46%, 23% and 23% of the exposure in Europe, Asia and U.S., respectively. This portfolio is primarily invested in higher quality, highly rated investment grade securities. At September 30, 2021, this securities portfolio was in an unrealized gain position of $249 million.
We manage direct and indirect investment exposure in the selected countries and sectors through fundamental analysis and we continually monitor and adjust our level of investment exposure.
Investment Portfolio Results
The reconciliation of net investment income under GAAP to adjusted net investment income is presented below.
| For the Three Months Ended September 30, | For the Nine Months Ended September 30, | ||||||||||||||||||||||
| 2021 | 2020 | 2021 | 2020 | ||||||||||||||||||||
| (In millions) | |||||||||||||||||||||||
| Net investment income — GAAP basis | $ | 5,568 | $ | 4,729 | $ | 16,162 | $ | 11,877 | |||||||||||||||
| Investment hedge adjustments | 228 | 229 | 660 | 555 | |||||||||||||||||||
| Unit-linked investment income | (114) | (262) | (699) | 60 | |||||||||||||||||||
| Other | (14) | (8) | (44) | (39) | |||||||||||||||||||
| Adjusted net investment income (1) | $ | 5,668 | $ | 4,688 | $ | 16,079 | $ | 12,453 |
(1)See “Financial Measures and Segment Accounting Policies” in Note 2 of the Notes to the Interim Condensed Consolidated Financial Statements for a discussion of the adjustments made to net investment income under GAAP in calculating adjusted net investment income.
The following yield table presentation is consistent with how we measure our investment performance for management purposes, and we believe it enhances understanding of our investment portfolio results.
| For the Three Months Ended September 30, | For the Nine Months Ended September 30, | ||||||||||||||||||||||||||||||||||||||||||||||
| 2021 | 2020 | 2021 | 2020 | ||||||||||||||||||||||||||||||||||||||||||||
| Asset Class | Yield % (1) | Amount | Yield % (1) | Amount | Yield % (1) | Amount | Yield % (1) | Amount | |||||||||||||||||||||||||||||||||||||||
| (Dollars in millions) | |||||||||||||||||||||||||||||||||||||||||||||||
| Fixed maturity securities (2), (3) | 3.71 | % | $ | 2,761 | 3.87 | % | $ | 2,849 | 3.73 | % | $ | 8,330 | 3.89 | % | $ | 8,473 | |||||||||||||||||||||||||||||||
| Mortgage loans (3) | 4.12 | 837 | 4.27 | 885 | 4.18 | 2,583 | 4.28 | 2,631 | |||||||||||||||||||||||||||||||||||||||
| Real estate and real estate joint ventures | 6.00 | 181 | 0.39 | 11 | 4.28 | 385 | 1.30 | 110 | |||||||||||||||||||||||||||||||||||||||
| Policy loans | 5.09 | 118 | 5.15 | 124 | 5.14 | 359 | 5.18 | 374 | |||||||||||||||||||||||||||||||||||||||
| Equity securities | 4.85 | 8 | 5.56 | 15 | 4.69 | 28 | 5.03 | 40 | |||||||||||||||||||||||||||||||||||||||
| Other limited partnership interests | 48.43 | 1,542 | 28.28 | 578 | 45.04 | 3,877 | 4.90 | 296 | |||||||||||||||||||||||||||||||||||||||
| Cash and short-term investments | 0.70 | 20 | 1.28 | 34 | 0.76 | 62 | 1.44 | 116 | |||||||||||||||||||||||||||||||||||||||
| Other invested assets | — | 342 | — | 331 | — | 906 | — | 844 | |||||||||||||||||||||||||||||||||||||||
| Investment income | 5.36 | % | 5,809 | 4.52 | % | 4,827 | 5.09 | % | 16,530 | 4.07 | % | 12,884 | |||||||||||||||||||||||||||||||||||
| Investment fees and expenses | (0.12) | (125) | (0.12) | (131) | (0.12) | (399) | (0.12) | (387) | |||||||||||||||||||||||||||||||||||||||
| Net investment income including divested businesses (4) | 5.24 | % | 5,684 | 4.40 | % | 4,696 | 4.97 | % | 16,131 | 3.95 | % | 12,497 | |||||||||||||||||||||||||||||||||||
| Less: net investment income from divested businesses (4) | 16 | 8 | 52 | 44 | |||||||||||||||||||||||||||||||||||||||||||
| Adjusted net investment income | $ | 5,668 | $ | 4,688 | $ | 16,079 | $ | 12,453 |
(1)We calculate yields using adjusted net investment income as a percent of average quarterly asset carrying values. Adjusted net investment income excludes recognized gains (losses) and includes the impact of changes in foreign currency exchange rates. Average quarterly asset carrying values exclude unrealized gains (losses), collateral received in connection with our securities lending program, annuities funding structured settlement claims, freestanding derivative assets, collateral received from derivative counterparties, the effects of consolidating under GAAP certain variable interest entities that are treated as consolidated securitization entities (“CSEs”) and contractholder-directed equity securities. In addition, average quarterly asset carrying values include invested assets reclassified to held-for-sale. A yield is not presented for other invested assets, as it is not considered a meaningful measure of performance for this asset class.
(2)Investment income from fixed maturity securities includes amounts from FVO Securities of $6 million and $92 million for the three months and nine months ended September 30, 2021, respectively, and $36 million and $72 million for the three months and nine months ended September 30, 2020, respectively.
(3)Investment income from fixed maturity securities AFS and mortgage loans includes prepayment fees.
(4)See “Financial Measures and Segment Accounting Policies” in Note 2 of the Notes to the Interim Condensed Consolidated Financial Statements for discussion of divested businesses.
See “— Results of Operations — Consolidated Results — Adjusted Earnings” for an analysis of the period over period changes in investment portfolio results.
Fixed Maturity Securities AFS and Equity Securities
The following table presents fixed maturity securities AFS and equity securities by type (public or private) and information about perpetual and redeemable securities held at:
| September 30, 2021 | December 31, 2020 | |||||||||||||||||||||||||
| Estimated Fair Value | % of Total | Estimated Fair Value | % of Total | |||||||||||||||||||||||
| (Dollars in millions) | ||||||||||||||||||||||||||
| Fixed maturity securities AFS: | ||||||||||||||||||||||||||
| Publicly-traded | $ | 269,275 | 79.0 | % | $ | 284,083 | 80.1 | % | ||||||||||||||||||
| Privately-placed | 71,763 | 21.0 | 70,726 | 19.9 | ||||||||||||||||||||||
| Total fixed maturity securities AFS | $ | 341,038 | 100.0 | % | $ | 354,809 | 100.0 | % | ||||||||||||||||||
| Percentage of cash and invested assets | 66.3 | % | 67.2 | % | ||||||||||||||||||||||
| Equity securities: | ||||||||||||||||||||||||||
| Publicly-traded | $ | 781 | 83.1 | % | $ | 851 | 78.9 | % | ||||||||||||||||||
| Privately-held | 160 | 16.9 | 228 | 21.1 | ||||||||||||||||||||||
| Total equity securities | $ | 941 | 100.0 | % | $ | 1,079 | 100.0 | % | ||||||||||||||||||
| Percentage of cash and invested assets | 0.2 | % | 0.2 | % | ||||||||||||||||||||||
| Perpetual and redeemable securities: | ||||||||||||||||||||||||||
| Perpetual securities included within fixed maturity securities AFS and equity securities | $ | 322 | $ | 344 | ||||||||||||||||||||||
| Redeemable preferred stock with a stated maturity included within fixed maturity securities AFS | $ | 479 | $ | 912 |
See Note 6 of the Notes to the Interim Condensed Consolidated Financial Statements for information about fixed maturity securities AFS by sector, contractual maturities and continuous gross unrealized losses.
Included within fixed maturity securities AFS are structured securities, including residential mortgage-backed securities (“RMBS”), asset-backed securities (“ABS”) and commercial mortgage-backed securities (“CMBS”) (collectively, “Structured Products”).
Perpetual securities are included within fixed maturity securities AFS and equity securities. Upon acquisition, we classify perpetual securities that have attributes of both debt and equity as fixed maturity securities AFS if the securities have an interest rate step-up feature which, when combined with other qualitative factors, indicates that the securities have more debt-like characteristics; while those with more equity-like characteristics are classified as equity securities. Many of such securities, commonly referred to as “perpetual hybrid securities,” have been issued by non-U.S. financial institutions that are accorded the highest two capital treatment categories by their respective regulatory bodies (i.e. core capital, or “Tier 1 capital” and perpetual deferrable securities, or “Upper Tier 2 capital”).
Redeemable preferred stock with a stated maturity is included within fixed maturity securities AFS. These securities, which are commonly referred to as “capital securities,” primarily have cumulative interest deferral features and are primarily issued by U.S. financial institutions.
See “Management’s Discussion and Analysis of Financial Condition and Results of Operations — Investments — Fixed Maturity Securities AFS and Equity Securities — Valuation of Securities” included in the 2020 Annual Report for further information on the processes used to value securities and the related controls.
Fair Value of Fixed Maturity Securities AFS and Equity Securities
Fixed maturity securities AFS and equity securities measured at estimated fair value on a recurring basis and their corresponding fair value pricing sources were as follows:
| September 30, 2021 | |||||||||||||||||||||||||||||
| Fixed Maturity Securities AFS | Equity Securities | ||||||||||||||||||||||||||||
| (Dollars in millions) | |||||||||||||||||||||||||||||
| Level 1 | |||||||||||||||||||||||||||||
| Quoted prices in active markets for identical assets | $ | 27,500 | 8.1 | % | $ | 594 | 63.1 | % | |||||||||||||||||||||
| Level 2 | |||||||||||||||||||||||||||||
| Independent pricing sources | 282,375 | 82.8 | 184 | 19.6 | |||||||||||||||||||||||||
| Internal matrix pricing or discounted cash flow techniques | 707 | 0.2 | 12 | 1.3 | |||||||||||||||||||||||||
| Significant other observable inputs | 283,082 | 83.0 | 196 | 20.9 | |||||||||||||||||||||||||
| Level 3 | |||||||||||||||||||||||||||||
| Independent pricing sources | 24,065 | 7.1 | 5 | 0.5 | |||||||||||||||||||||||||
| Internal matrix pricing or discounted cash flow techniques | 5,940 | 1.7 | 146 | 15.5 | |||||||||||||||||||||||||
| Independent broker quotations | 451 | 0.1 | — | — | |||||||||||||||||||||||||
| Significant unobservable inputs | 30,456 | 8.9 | 151 | 16.0 | |||||||||||||||||||||||||
| Total estimated fair value | $ | 341,038 | 100.0 | % | $ | 941 | 100.0 | % |
See Note 8 of the Notes to the Interim Condensed Consolidated Financial Statements for the fixed maturity securities AFS and equity securities fair value hierarchy.
The majority of the Level 3 fixed maturity securities AFS and equity securities were concentrated in three sectors at September 30, 2021: foreign corporate securities, U.S. corporate securities and RMBS. During the three months ended September 30, 2021, Level 3 fixed maturity securities AFS increased by $535 million, or 2%. The increase was driven by purchases in excess of sales, partially offset by a decrease in estimated fair value recognized in other comprehensive income (loss) (“OCI”) and by transfers out of Level 3 in excess of transfers into Level 3. During the nine months ended September 30, 2021, Level 3 fixed maturity securities AFS increased by $949 million, or 3%. The increase was driven by purchases in excess of sales, partially offset by a decrease in estimated fair value recognized in OCI and by transfers out of Level 3 in excess of transfers into Level 3.
See Note 8 of the Notes to the Interim Condensed Consolidated Financial Statements for a rollforward of the fair value measurements for securities measured at estimated fair value on a recurring basis using significant unobservable (Level 3) inputs, transfers into and/or out of Level 3, and further information about the valuation approaches and inputs by level by major classes of invested assets that affect the amounts reported above. See also “Management’s Discussion and Analysis of Financial Condition and Results of Operations — Investments — Fixed Maturity Securities AFS and Equity Securities — Valuation of Securities” included in the 2020 Annual Report for further information on the estimates and assumptions that affect the amounts reported above.
Fixed Maturity Securities AFS
See Notes 1 and 6 of the Notes to the Interim Condensed Consolidated Financial Statements for information about fixed maturity securities AFS by sector, contractual maturities and continuous gross unrealized losses.
Fixed Maturity Securities AFS Credit Quality — Ratings
See “Management’s Discussion and Analysis of Financial Condition and Results of Operations — Investments — Fixed Maturity Securities AFS and Equity Securities — Fixed Maturity Securities AFS Credit Quality — Ratings” included in the 2020 Annual Report for a discussion of the credit quality ratings assigned by Nationally Recognized Statistical Rating Organizations (“NRSRO”), credit quality designations assigned by and methodologies used by the Securities Valuation Office of the NAIC for fixed maturity securities AFS and revised methodologies adopted by the NAIC for certain Structured Products.
The following table presents total fixed maturity securities AFS by NRSRO rating and the applicable NAIC designation from the NAIC published comparison of NRSRO ratings to NAIC designations, except for non-agency RMBS and CMBS, held by MetLife, Inc.'s insurance subsidiaries that maintain the NAIC statutory basis of accounting, which are presented using revised NAIC methodologies. NRSRO ratings are as of the dates shown below. Over time, credit ratings can migrate, up or down, through the NRSRO continuous monitoring process. See Notes 1 and 6 of the Notes to the Interim Condensed Consolidated Financial Statements for further information.
| September 30, 2021 | December 31, 2020 | |||||||||||||||||||||||||||||||||||||||||||||||||||||||||||||
| NAIC Designation | NRSRO Rating | Amortized Cost net of ACL | Unrealized Gains (Losses) (1) | Estimated Fair Value | % of Total | Amortized Cost net of ACL | Unrealized Gains (Losses) (1) | Estimated Fair Value | % of Total | |||||||||||||||||||||||||||||||||||||||||||||||||||||
| (Dollars in millions) | ||||||||||||||||||||||||||||||||||||||||||||||||||||||||||||||
| 1 | Aaa/Aa/A | $ | 217,164 | $ | 21,994 | $ | 239,158 | 70.1 | % | $ | 218,252 | $ | 31,761 | $ | 250,013 | 70.5 | % | |||||||||||||||||||||||||||||||||||||||||||||
| 2 | Baa | 76,573 | 8,258 | 84,831 | 24.9 | 76,342 | 11,360 | 87,702 | 24.7 | |||||||||||||||||||||||||||||||||||||||||||||||||||||
| Subtotal investment grade | 293,737 | 30,252 | 323,989 | 95.0 | 294,594 | 43,121 | 337,715 | 95.2 | ||||||||||||||||||||||||||||||||||||||||||||||||||||||
| 3 | Ba | 12,032 | 844 | 12,876 | 3.8 | 11,840 | 972 | 12,812 | 3.6 | |||||||||||||||||||||||||||||||||||||||||||||||||||||
| 4 | B | 3,557 | 27 | 3,584 | 1.0 | 3,688 | 14 | 3,702 | 1.1 | |||||||||||||||||||||||||||||||||||||||||||||||||||||
| 5 | Caa and lower | 596 | (31) | 565 | 0.2 | 536 | (33) | 503 | 0.1 | |||||||||||||||||||||||||||||||||||||||||||||||||||||
| 6 | In or near default | 14 | 10 | 24 | — | 72 | 5 | 77 | — | |||||||||||||||||||||||||||||||||||||||||||||||||||||
| Subtotal below investment grade | 16,199 | 850 | 17,049 | 5.0 | 16,136 | 958 | 17,094 | 4.8 | ||||||||||||||||||||||||||||||||||||||||||||||||||||||
| Total fixed maturity securities AFS | $ | 309,936 | $ | 31,102 | $ | 341,038 | 100.0 | % | $ | 310,730 | $ | 44,079 | $ | 354,809 | 100.0 | % | ||||||||||||||||||||||||||||||||||||||||||||||
(1) Excludes gross unrealized gains (losses) related to assets held-for-sale. See Note 3 of the Notes to the Interim Condensed Consolidated Financial Statements for information on the Company’s business dispositions.
The following tables present total fixed maturity securities AFS, based on estimated fair value, by sector and by NRSRO rating and the applicable NAIC designations from the NAIC published comparison of NRSRO ratings to NAIC designations, except for non-agency RMBS and CMBS, which are presented using the revised NAIC methodologies:
| Fixed Maturity Securities AFS — by Sector & Credit Quality Rating | |||||||||||||||||||||||||||||||||||||||||
| NAIC Designation | 1 | 2 | 3 | 4 | 5 | 6 | Total Estimated Fair Value | ||||||||||||||||||||||||||||||||||
| NRSRO Rating | Aaa/Aa/A | Baa | Ba | B | Caa and Lower | In or Near Default | |||||||||||||||||||||||||||||||||||
| (Dollars in millions) | |||||||||||||||||||||||||||||||||||||||||
| September 30, 2021 | |||||||||||||||||||||||||||||||||||||||||
| U.S. corporate | $ | 46,131 | $ | 39,084 | $ | 4,612 | $ | 1,868 | $ | 317 | $ | — | $ | 92,012 | |||||||||||||||||||||||||||
| Foreign government | 53,723 | 5,846 | 3,273 | 517 | 17 | 4 | 63,380 | ||||||||||||||||||||||||||||||||||
| Foreign corporate | 23,531 | 35,774 | 3,827 | 574 | 215 | 1 | 63,922 | ||||||||||||||||||||||||||||||||||
| U.S. government and agency | 47,562 | 538 | — | — | — | — | 48,100 | ||||||||||||||||||||||||||||||||||
| RMBS | 28,979 | 853 | 222 | 179 | 15 | 19 | 30,267 | ||||||||||||||||||||||||||||||||||
| ABS | 15,165 | 1,889 | 262 | 86 | 1 | — | 17,403 | ||||||||||||||||||||||||||||||||||
| Municipals | 13,529 | 493 | 18 | — | — | — | 14,040 | ||||||||||||||||||||||||||||||||||
| CMBS | 10,538 | 354 | 662 | 360 | — | — | 11,914 | ||||||||||||||||||||||||||||||||||
| Total fixed maturity securities AFS | $ | 239,158 | $ | 84,831 | $ | 12,876 | $ | 3,584 | $ | 565 | $ | 24 | $ | 341,038 | |||||||||||||||||||||||||||
| Percentage of total | 70.1 | % | 24.9 | % | 3.8 | % | 1.0 | % | 0.2 | % | — | % | 100.0 | % | |||||||||||||||||||||||||||
| December 31, 2020 | |||||||||||||||||||||||||||||||||||||||||
| U.S. corporate | $ | 46,847 | $ | 39,552 | $ | 4,649 | $ | 2,018 | $ | 326 | $ | 24 | $ | 93,416 | |||||||||||||||||||||||||||
| Foreign government | 61,322 | 6,678 | 3,161 | 456 | 77 | 5 | 71,699 | ||||||||||||||||||||||||||||||||||
| Foreign corporate | 26,812 | 37,884 | 3,984 | 648 | 74 | 6 | 69,408 | ||||||||||||||||||||||||||||||||||
| U.S. government and agency | 46,543 | 557 | — | — | — | — | 47,100 | ||||||||||||||||||||||||||||||||||
| RMBS | 29,347 | 706 | 197 | 153 | 14 | 18 | 30,435 | ||||||||||||||||||||||||||||||||||
| ABS | 15,328 | 1,496 | 197 | 96 | 1 | 1 | 17,119 | ||||||||||||||||||||||||||||||||||
| Municipals | 13,240 | 460 | 22 | — | — | — | 13,722 | ||||||||||||||||||||||||||||||||||
| CMBS | 10,574 | 369 | 602 | 331 | 11 | 23 | 11,910 | ||||||||||||||||||||||||||||||||||
| Total fixed maturity securities AFS | $ | 250,013 | $ | 87,702 | $ | 12,812 | $ | 3,702 | $ | 503 | $ | 77 | $ | 354,809 | |||||||||||||||||||||||||||
| Percentage of total | 70.5 | % | 24.7 | % | 3.6 | % | 1.1 | % | 0.1 | % | — | % | 100.0 | % |
U.S. and Foreign Corporate Fixed Maturity Securities AFS
We maintain a diversified portfolio of corporate fixed maturity securities AFS across industries and issuers. This portfolio did not have any exposure to any single issuer in excess of 1% of total investments at September 30, 2021. The top 10 holdings comprised 2% of total investments at both September 30, 2021 and December 31, 2020. The table below presents our U.S. and foreign corporate securities holdings by industry at:
| September 30, 2021 | December 31, 2020 | ||||||||||||||||||||||
| Industry | Estimated Fair Value | % of Total | Estimated Fair Value | % of Total | |||||||||||||||||||
| (Dollars in millions) | |||||||||||||||||||||||
| Industrial | $ | 45,688 | 29.3 | % | $ | 47,472 | 29.2 | % | |||||||||||||||
| Finance | 35,623 | 22.9 | 37,645 | 23.1 | |||||||||||||||||||
| Consumer | 30,924 | 19.8 | 33,384 | 20.5 | |||||||||||||||||||
| Utility | 28,889 | 18.5 | 29,984 | 18.4 | |||||||||||||||||||
| Communications | 12,107 | 7.8 | 12,107 | 7.4 | |||||||||||||||||||
| Other | 2,703 | 1.7 | 2,232 | 1.4 | |||||||||||||||||||
| Total | $ | 155,934 | 100.0 | % | $ | 162,824 | 100.0 | % |
As a result of current economic conditions, including the effects of the COVID-19 Pandemic, we have experienced stress within certain sub-sectors of our industrial and consumer corporate securities portfolios, principally in Airports, Cruise Lines / Leisure, Airlines, Restaurants and Lodging. See “— Current Environment — Selected Country and Sector Investments.”
Structured Products
We held $59.6 billion and $59.5 billion of Structured Products, at estimated fair value, at September 30, 2021 and December 31, 2020, respectively, as presented in the RMBS, ABS and CMBS sections below.
RMBS
Our RMBS portfolio is diversified by security type and risk profile. The following table presents our RMBS portfolio by security type, risk profile and ratings profile at:
| September 30, 2021 | December 31, 2020 | ||||||||||||||||||||||||||||||||||
| Estimated Fair Value | % of Total | Net Unrealized Gains (Losses) (1) | Estimated Fair Value | % of Total | Net Unrealized Gains (Losses) (1) | ||||||||||||||||||||||||||||||
| (Dollars in millions) | |||||||||||||||||||||||||||||||||||
| Security type | |||||||||||||||||||||||||||||||||||
| Collateralized mortgage obligations | $ | 17,206 | 56.8 | % | $ | 1,237 | $ | 17,342 | 57.0 | % | $ | 1,468 | |||||||||||||||||||||||
| Pass-through mortgage-backed securities | 13,061 | 43.2 | 314 | 13,093 | 43.0 | 552 | |||||||||||||||||||||||||||||
| Total RMBS | $ | 30,267 | 100.0 | % | $ | 1,551 | $ | 30,435 | 100.0 | % | $ | 2,020 | |||||||||||||||||||||||
| Risk profile | |||||||||||||||||||||||||||||||||||
| Agency | $ | 19,902 | 65.8 | % | $ | 884 | $ | 20,408 | 67.1 | % | $ | 1,314 | |||||||||||||||||||||||
| Prime | 2,730 | 9.0 | 24 | 1,637 | 5.4 | 38 | |||||||||||||||||||||||||||||
| Alt-A | 3,531 | 11.7 | 305 | 3,809 | 12.5 | 306 | |||||||||||||||||||||||||||||
| Sub-prime | 4,104 | 13.5 | 338 | 4,581 | 15.0 | 362 | |||||||||||||||||||||||||||||
| Total RMBS | $ | 30,267 | 100.0 | % | $ | 1,551 | $ | 30,435 | 100.0 | % | $ | 2,020 | |||||||||||||||||||||||
| Ratings profile | |||||||||||||||||||||||||||||||||||
| Rated Aaa/AAA | $ | 21,987 | 72.6 | % | $ | 22,555 | 74.1 | % | |||||||||||||||||||||||||||
| Designated NAIC 1 | $ | 28,979 | 95.7 | % | $ | 29,347 | 96.4 | % |
(1) Excludes gross unrealized gains (losses) related to assets held-for-sale. See Note 3 of the Notes to the Interim Condensed Consolidated Financial Statements for information on the Company’s business dispositions.
See “Management’s Discussion and Analysis of Financial Condition and Results of Operations — Investments — Fixed Maturity Securities AFS and Equity Securities — Structured Products — RMBS” included in the 2020 Annual Report for further information about collateralized mortgage obligations and pass-through mortgage-backed securities, as well as agency, prime, alternative residential mortgage loans (“Alt-A”) and sub-prime RMBS.
Historically, we have managed our exposure to sub-prime RMBS holdings by focusing primarily on senior tranche securities, stress testing the portfolio with severe loss assumptions and closely monitoring the performance of the portfolio. Our sub-prime RMBS portfolio consists predominantly of securities that were purchased after 2012 at significant discounts to par value and discounts to the expected principal recovery value of these securities. The vast majority of these securities are investment grade under the NAIC designations (e.g., NAIC 1 and NAIC 2).
ABS
Our ABS portfolio is diversified by collateral type and issuer. The following table presents our ABS portfolio by collateral type and ratings profile at:
| September 30, 2021 | December 31, 2020 | ||||||||||||||||||||||||||||||||||
| Estimated Fair Value | % of Total | Net Unrealized Gains (Losses) (1) | Estimated Fair Value | % of Total | Net Unrealized Gains (Losses) (1) | ||||||||||||||||||||||||||||||
| (Dollars in millions) | |||||||||||||||||||||||||||||||||||
| Collateral type | |||||||||||||||||||||||||||||||||||
| Collateralized obligations (2) | $ | 8,383 | 48.2 | % | $ | 18 | $ | 8,946 | 52.2 | % | $ | (16) | |||||||||||||||||||||||
| Consumer loans | 1,701 | 9.8 | 61 | 1,535 | 9.0 | 46 | |||||||||||||||||||||||||||||
| Student loans | 1,098 | 6.3 | 15 | 1,174 | 6.9 | 7 | |||||||||||||||||||||||||||||
| Credit card loans | 785 | 4.5 | 11 | 1,006 | 5.9 | 13 | |||||||||||||||||||||||||||||
| Automobile loans | 1,420 | 8.2 | 17 | 976 | 5.7 | 20 | |||||||||||||||||||||||||||||
| Foreign residential loans | 910 | 5.2 | 4 | 956 | 5.5 | 15 | |||||||||||||||||||||||||||||
| Other loans | 3,106 | 17.8 | 74 | 2,526 | 14.8 | 71 | |||||||||||||||||||||||||||||
| Total | $ | 17,403 | 100.0 | % | $ | 200 | $ | 17,119 | 100.0 | % | $ | 156 | |||||||||||||||||||||||
| Ratings profile | |||||||||||||||||||||||||||||||||||
| Rated Aaa/AAA | $ | 8,242 | 47.4 | % | $ | 9,164 | 53.5 | % | |||||||||||||||||||||||||||
| Designated NAIC 1 | $ | 15,165 | 87.1 | % | $ | 15,328 | 89.5 | % |
(1) Excludes gross unrealized gains (losses) related to assets held-for-sale. See Note 3 of the Notes to the Interim Condensed Consolidated Financial Statements for information on the Company’s business dispositions.
(2) Includes primarily collateralized loan obligations.
CMBS
Our CMBS portfolio is comprised primarily of securities collateralized by multiple commercial mortgage loans and is diversified by property type, borrower, geography and vintage year. The following tables present our CMBS portfolio by NRSRO rating and vintage year.
| September 30, 2021 | |||||||||||||||||||||||||||||||||||||||||||||||||||||||||||||||||||||||
| Aaa | Aa | A | Baa | Below Investment Grade | Total | ||||||||||||||||||||||||||||||||||||||||||||||||||||||||||||||||||
| Vintage Year | Amortized Cost net of ACL | Estimated Fair Value | Amortized Cost net of ACL | Estimated Fair Value | Amortized Cost net of ACL | Estimated Fair Value | Amortized Cost net of ACL | Estimated Fair Value | Amortized Cost net of ACL | Estimated Fair Value | Amortized Cost net of ACL | Estimated Fair Value | |||||||||||||||||||||||||||||||||||||||||||||||||||||||||||
| (Dollars in millions) | |||||||||||||||||||||||||||||||||||||||||||||||||||||||||||||||||||||||
| 2003-2014 | $ | 1,249 | $ | 1,322 | $ | 1,013 | $ | 1,059 | $ | 576 | $ | 588 | $ | 183 | $ | 175 | $ | 151 | $ | 133 | $ | 3,172 | $ | 3,277 | |||||||||||||||||||||||||||||||||||||||||||||||
| 2015 | 456 | 487 | 56 | 59 | 54 | 56 | 7 | 7 | — | — | 573 | 609 | |||||||||||||||||||||||||||||||||||||||||||||||||||||||||||
| 2016 | 270 | 291 | 65 | 70 | 53 | 55 | — | — | — | — | 388 | 416 | |||||||||||||||||||||||||||||||||||||||||||||||||||||||||||
| 2017 | 774 | 816 | 346 | 367 | 193 | 199 | — | — | — | — | 1,313 | 1,382 | |||||||||||||||||||||||||||||||||||||||||||||||||||||||||||
| 2018 | 1,823 | 2,005 | 301 | 318 | 179 | 191 | 10 | 10 | — | — | 2,313 | 2,524 | |||||||||||||||||||||||||||||||||||||||||||||||||||||||||||
| 2019 | 958 | 997 | 142 | 145 | 655 | 672 | — | — | — | — | 1,755 | 1,814 | |||||||||||||||||||||||||||||||||||||||||||||||||||||||||||
| 2020 | 534 | 543 | 232 | 238 | 216 | 224 | 27 | 27 | — | — | 1,009 | 1,032 | |||||||||||||||||||||||||||||||||||||||||||||||||||||||||||
| 2021 | 391 | 392 | 223 | 224 | 210 | 214 | 29 | 30 | — | — | 853 | 860 | |||||||||||||||||||||||||||||||||||||||||||||||||||||||||||
| Total | $ | 6,455 | $ | 6,853 | $ | 2,378 | $ | 2,480 | $ | 2,136 | $ | 2,199 | $ | 256 | $ | 249 | $ | 151 | $ | 133 | $ | 11,376 | $ | 11,914 | |||||||||||||||||||||||||||||||||||||||||||||||
| Ratings Distribution | 57.5 | % | 20.8 | % | 18.5 | % | 2.1 | % | 1.1 | % | 100.0 | % | |||||||||||||||||||||||||||||||||||||||||||||||||||||||||||
| December 31, 2020 | |||||||||||||||||||||||||||||||||||||||||||||||||||||||||||||||||||||||
| Aaa | Aa | A | Baa | Below Investment Grade | Total | ||||||||||||||||||||||||||||||||||||||||||||||||||||||||||||||||||
| Vintage Year | Amortized Cost net of ACL | Estimated Fair Value | Amortized Cost net of ACL | Estimated Fair Value | Amortized Cost net of ACL | Estimated Fair Value | Amortized Cost net of ACL | Estimated Fair Value | Amortized Cost net of ACL | Estimated Fair Value | Amortized Cost net of ACL | Estimated Fair Value | |||||||||||||||||||||||||||||||||||||||||||||||||||||||||||
| (Dollars in millions) | |||||||||||||||||||||||||||||||||||||||||||||||||||||||||||||||||||||||
| 2003 - 2013 | $ | 958 | $ | 1,011 | $ | 898 | $ | 917 | $ | 373 | $ | 355 | $ | 105 | $ | 96 | $ | 114 | $ | 98 | $ | 2,448 | $ | 2,477 | |||||||||||||||||||||||||||||||||||||||||||||||
| 2014 | 451 | 480 | 429 | 449 | 169 | 171 | 10 | 9 | — | — | 1,059 | 1,109 | |||||||||||||||||||||||||||||||||||||||||||||||||||||||||||
| 2015 | 462 | 492 | 65 | 69 | 38 | 40 | 7 | 6 | — | — | 572 | 607 | |||||||||||||||||||||||||||||||||||||||||||||||||||||||||||
| 2016 | 282 | 310 | 56 | 60 | 54 | 53 | — | — | — | — | 392 | 423 | |||||||||||||||||||||||||||||||||||||||||||||||||||||||||||
| 2017 | 757 | 807 | 432 | 463 | 150 | 150 | — | — | — | — | 1,339 | 1,420 | |||||||||||||||||||||||||||||||||||||||||||||||||||||||||||
| 2018 | 1,704 | 1,891 | 592 | 647 | 205 | 214 | 9 | 9 | — | — | 2,510 | 2,761 | |||||||||||||||||||||||||||||||||||||||||||||||||||||||||||
| 2019 | 1,048 | 1,100 | 138 | 141 | 596 | 610 | — | — | — | — | 1,782 | 1,851 | |||||||||||||||||||||||||||||||||||||||||||||||||||||||||||
| 2020 | 734 | 748 | 280 | 293 | 186 | 191 | 29 | 30 | — | — | 1,229 | 1,262 | |||||||||||||||||||||||||||||||||||||||||||||||||||||||||||
| Total | $ | 6,396 | $ | 6,839 | $ | 2,890 | $ | 3,039 | $ | 1,771 | $ | 1,784 | $ | 160 | $ | 150 | $ | 114 | $ | 98 | $ | 11,331 | $ | 11,910 | |||||||||||||||||||||||||||||||||||||||||||||||
| Ratings Distribution | 57.4 | % | 25.5 | % | 15.0 | % | 1.3 | % | 0.8 | % | 100.0 | % |
The tables above reflect NRSRO ratings including Moody’s Investors Service, S&P, Fitch Ratings and Morningstar, Inc. CMBS designated NAIC 1 were 88.5% and 88.8% of total CMBS at September 30, 2021 and December 31, 2020, respectively.
Evaluation of Fixed Maturity Securities AFS for Credit Loss, Rollforward of Allowance for Credit Loss and Credit Loss on Fixed Maturity Securities AFS Recognized in Earnings
See Note 6 of the Notes to the Interim Condensed Consolidated Financial Statements for information about the evaluation of fixed maturity securities AFS for credit loss, rollforward of the ACL, net provision (release) for credit loss, as well as gross gains and gross losses on fixed maturity securities AFS sold at and for the nine months ended September 30, 2021.
Contractholder-Directed Equity Securities and Fair Value Option Securities
The estimated fair value of these investments, which are primarily comprised of Unit-linked investments, was $12.1 billion and $13.3 billion, or 2.3% and 2.5% of cash and invested assets, at September 30, 2021 and December 31, 2020, respectively. See Notes 6 and 8 of the Notes to the Interim Condensed Consolidated Financial Statements for a description of this portfolio, its fair value hierarchy and a rollforward of the fair value measurements for these investments measured at estimated fair value on a recurring basis using significant unobservable (Level 3) inputs.
Securities Lending and Repurchase Agreements
We participate in a securities lending program whereby securities are loaned to third-parties, primarily brokerage firms and commercial banks. We also participate in short-term repurchase agreement transactions with unaffiliated financial institutions. See “— Liquidity and Capital Resources — The Company — Liquidity and Capital Uses — Securities Lending and Repurchase Agreements” and Note 6 of the Notes to the Interim Condensed Consolidated Financial Statements for further information.
Mortgage Loans
Our mortgage loans held-for-investment are principally collateralized by commercial, agricultural and residential properties. Mortgage loans held-for-investment are carried at amortized cost and the related ACL are summarized as follows at:
| September 30, 2021 | December 31, 2020 | |||||||||||||||||||||||||||||||||||||||||||||||||
| Portfolio Segment | Amortized Cost | % of Total | ACL | % of Amortized Cost | Amortized Cost | % of Total | ACL | % of Amortized Cost | ||||||||||||||||||||||||||||||||||||||||||
| (Dollars in millions) | ||||||||||||||||||||||||||||||||||||||||||||||||||
| Commercial | $ | 51,336 | 63.1 | % | $ | 274 | 0.5 | % | $ | 52,434 | 62.2 | % | $ | 252 | 0.5 | % | ||||||||||||||||||||||||||||||||||
| Agricultural | 18,353 | 22.5 | 93 | 0.5 | 18,128 | 21.5 | 106 | 0.6 | ||||||||||||||||||||||||||||||||||||||||||
| Residential | 11,704 | 14.4 | 196 | 1.7 | 13,782 | 16.3 | 232 | 1.7 | ||||||||||||||||||||||||||||||||||||||||||
| Total | $ | 81,393 | 100.0 | % | $ | 563 | 0.7 | % | $ | 84,344 | 100.0 | % | $ | 590 | 0.7 | % |
The carrying value of all mortgage loans, net of ACL, was 15.7% and 15.9% of cash and invested assets at September 30, 2021 and December 31, 2020, respectively.
Our commercial, agricultural and residential mortgage loan portfolios are subject to uncertain market conditions, including the effects of the COVID-19 Pandemic. As a result of the COVID-19 Pandemic, we granted concessions (e.g., payment deferrals and other loan modifications) to certain of our commercial mortgage loan borrowers (principally in the hotel and retail sectors) and residential mortgage loan borrowers and, to a much lesser extent, some of our agricultural mortgage loan borrowers. While we granted concessions in 2021, the pace has significantly decreased from 2020. See Note 6 of the Notes to the Interim Condensed Consolidated Financial Statements for further information regarding COVID-19 Pandemic-related mortgage loan concessions. See also “— Commercial Mortgage Loans by Geographic Region and Property Type.”
We diversify our mortgage loan portfolio by both geographic region and property type to reduce the risk of concentration. Of our commercial and agricultural mortgage loan held-for-investment portfolios, 84% are collateralized by properties located in the United States, with the remaining 16% collateralized by properties located outside the United States, which includes 4% of properties located in Mexico and 1% of properties located in Chile, at September 30, 2021. The carrying values of our commercial and agricultural mortgage loans held-for-investment located in California, New York and Texas were 17%, 9% and 7%, respectively, of total commercial and agricultural mortgage loans held for investment at September 30, 2021. Additionally, we manage risk when originating commercial and agricultural mortgage loans by generally lending up to 75% of the estimated fair value of the underlying real estate collateral.
We manage our residential mortgage loan held for investment portfolio in a similar manner to reduce risk of concentration, with 91% collateralized by properties located in the United States, and the remaining 9% collateralized by properties located outside the United States, principally in Chile, at September 30, 2021. The carrying values of our residential mortgage loans located in California, Florida, and New York were 30%, 9%, and 9%, respectively, of total residential mortgage loans at September 30, 2021.
Commercial Mortgage Loans by Geographic Region and Property Type. Commercial mortgage loans are the largest component of the mortgage loan invested asset class. The tables below present the diversification across geographic regions and property types of commercial mortgage loans held-for-investment at:
| September 30, 2021 | December 31, 2020 | ||||||||||||||||||||||||||||
| Amount | % of Total | Amount | % of Total | ||||||||||||||||||||||||||
| (Dollars in millions) | |||||||||||||||||||||||||||||
| Region | |||||||||||||||||||||||||||||
| Non-U.S. | $ | 9,501 | 18.5 | % | $ | 10,581 | 20.2 | % | |||||||||||||||||||||
| Pacific | 10,249 | 20.0 | 10,235 | 19.5 | |||||||||||||||||||||||||
| Middle Atlantic | 7,877 | 15.3 | 8,233 | 15.7 | |||||||||||||||||||||||||
| South Atlantic | 7,047 | 13.7 | 7,217 | 13.8 | |||||||||||||||||||||||||
| West South Central | 3,434 | 6.7 | 3,887 | 7.4 | |||||||||||||||||||||||||
| East North Central | 2,229 | 4.3 | 2,494 | 4.8 | |||||||||||||||||||||||||
| New England | 2,623 | 5.1 | 2,126 | 4.0 | |||||||||||||||||||||||||
| Mountain | 1,996 | 3.9 | 1,777 | 3.4 | |||||||||||||||||||||||||
| East South Central | 824 | 1.6 | 700 | 1.3 | |||||||||||||||||||||||||
| West North Central | 649 | 1.3 | 609 | 1.2 | |||||||||||||||||||||||||
| Multi-Region and Other | 4,907 | 9.6 | 4,575 | 8.7 | |||||||||||||||||||||||||
| Total amortized cost | 51,336 | 100.0 | % | 52,434 | 100.0 | % | |||||||||||||||||||||||
| Less: ACL | 274 | 252 | |||||||||||||||||||||||||||
| Carrying value, net of ACL | $ | 51,062 | $ | 52,182 | |||||||||||||||||||||||||
| Property Type | |||||||||||||||||||||||||||||
| Office | $ | 22,573 | 44.0 | % | $ | 23,928 | 45.6 | % | |||||||||||||||||||||
| Retail | 8,684 | 16.9 | 8,911 | 17.0 | |||||||||||||||||||||||||
| Apartment | 8,910 | 17.4 | 8,764 | 16.7 | |||||||||||||||||||||||||
| Industrial | 5,562 | 10.8 | 5,365 | 10.2 | |||||||||||||||||||||||||
| Hotel | 3,175 | 6.2 | 3,377 | 6.5 | |||||||||||||||||||||||||
| Other | 2,432 | 4.7 | 2,089 | 4.0 | |||||||||||||||||||||||||
| Total amortized cost | 51,336 | 100.0 | % | 52,434 | 100.0 | % | |||||||||||||||||||||||
| Less: ACL | 274 | 252 | |||||||||||||||||||||||||||
| Carrying value, net of ACL | $ | 51,062 | $ | 52,182 |
Our commercial mortgage loan portfolio is well positioned with exposures concentrated in high quality underlying properties located in primary markets typically with institutional investors who are better positioned to manage their assets during periods of market volatility. Our portfolio is comprised primarily of lower risk loans with higher debt service coverage ratios (“DSCR”) and lower loan-to-value (“LTV”) ratios. See “— Mortgage Loan Credit Quality - Monitoring Process” for further information and Note 6 of the Notes to the Interim Condensed Consolidated Financial Statements for a distribution of our commercial mortgage loans by DSCR and LTV ratios. Excluding loans with a COVID-19 Pandemic-related payment deferral, over 99% of our commercial mortgage loan portfolio was current at September 30, 2021, including all of our hotel and retail commercial mortgage loans. See Note 6 of the Notes to the Interim Condensed Consolidated Financial Statements for further information regarding COVID-19 Pandemic-related mortgage loan concessions.
Mortgage Loan Credit Quality - Monitoring Process. We monitor our mortgage loan investments on an ongoing basis, including a review of loans by credit quality indicator and loans that are current, past due, restructured and under foreclosure. See Note 6 of the Notes to the Interim Condensed Consolidated Financial Statements for further information regarding mortgage loans by credit quality indicator, past due and nonaccrual mortgage loans.
We review our commercial mortgage loans on an ongoing basis. These reviews may include an analysis of the property financial statements and rent roll, lease rollover analysis, property inspections, market analysis, estimated valuations of the underlying collateral, LTV ratios, DSCR and tenant creditworthiness. The monitoring process focuses on higher risk loans, which include those that are classified as restructured, delinquent or in foreclosure, as well as loans with higher LTV ratios and lower DSCR and loans with a COVID-19 Pandemic-related payment deferral. The monitoring process for agricultural mortgage loans is generally similar, with a focus on higher risk loans, such as loans with higher LTV ratios. Agricultural mortgage loans are reviewed on an ongoing basis which include, but are not limited to, property inspections, market analysis, estimated valuations of the underlying collateral, LTV ratios and borrower creditworthiness, including reviews on a geographic and property-type basis. We review our residential mortgage loans on an ongoing basis, with a focus on higher risk loans, such as nonperforming loans. See Notes 1 and 6 of the Notes to the Interim Condensed Consolidated Financial Statements for information on our evaluation of residential mortgage loans and related ACL methodology.
LTV ratios and DSCR are common measures in the assessment of the quality of commercial mortgage loans. LTV ratios are a common measure in the assessment of the quality of agricultural mortgage loans. LTV ratios compare the amount of the loan to the estimated fair value of the underlying collateral. An LTV ratio greater than 100% indicates that the loan amount is greater than the collateral value. An LTV ratio of less than 100% indicates an excess of collateral value over the loan amount. Generally, the higher the LTV ratio, the higher the risk of experiencing a credit loss. The DSCR compares a property’s net operating income to amounts needed to service the principal and interest due under the loan. Generally, the lower the DSCR, the higher the risk of experiencing a credit loss. For our commercial mortgage loans, our average LTV ratio was 57% and 58% at September 30, 2021 and December 31, 2020, respectively and our average DSCR was 2.6x and 2.5x at September 30, 2021 and December 31, 2020, respectively. The DSCR and the values utilized in calculating the ratio are updated routinely. In addition, the LTV ratio is routinely updated for all but the lowest risk loans as part of our ongoing review of our commercial mortgage loan portfolio. For our agricultural mortgage loans, our average LTV ratio was 48% at both September 30, 2021 and December 31, 2020. The values utilized in calculating our agricultural mortgage loan LTV ratio are developed in connection with the ongoing review of our agricultural loan portfolio and are routinely updated.
Mortgage Loan Allowance for Credit Loss. Our ACL is established for both pools of loans with similar risk characteristics and for mortgage loans with dissimilar risk characteristics, collateral dependent loans and reasonably expected troubled debt restructurings, individually on a loan specific basis. We record an allowance for expected lifetime credit loss in an amount that represents the portion of the amortized cost basis of mortgage loans that the Company does not expect to collect, resulting in mortgage loans being presented at the net amount expected to be collected.
In determining our ACL, management (i) pools mortgage loans that share similar risk characteristics, (ii) considers expected lifetime credit loss over the contractual term of our mortgage loans, as adjusted for expected prepayments and any extensions, and (iii) considers past events and current and forecasted economic conditions. Actual credit loss realized could be different from the amount of the ACL recorded. These evaluations and assessments are revised as conditions change and new information becomes available, which can cause the ACL to increase or decrease over time as such evaluations are revised. Negative credit migration, including an actual or expected increase in the level of problem loans, will result in an increase in the ACL. Positive credit migration, including an actual or expected decrease in the level of problem loans, will result in a decrease in the ACL. See Note 6 of the Notes to the Interim Condensed Consolidated Financial Statements for information on how the ACL is established and monitored, and activity in and balances of the ACL, as of and for the nine months ended September 30, 2021 and 2020.
Real Estate and Real Estate Joint Ventures
Real estate and real estate joint ventures is comprised of wholly-owned real estate and joint ventures with interests in single property income-producing real estate and, to a lesser extent, joint ventures with interests in multi-property projects with varying strategies ranging from the development of properties to the operation of income-producing properties, as well as a runoff portfolio. The carrying value of real estate and real estate joint ventures was $12.2 billion and $11.9 billion, or 2.4% and 2.3% of cash and invested assets, at September 30, 2021 and December 31, 2020, respectively.
Our real estate investments are typically stabilized properties that we intend to hold for the longer-term for portfolio diversification and long-term appreciation. Our real estate investment portfolio has significantly appreciated since acquisition to a $6.3 billion and $6.1 billion unrealized gain position at September 30, 2021 and September 30, 2020, respectively, that is available to absorb valuation declines from the current economic conditions. We continuously monitor expected future cash flows of each of our real estate investments and incorporate them into our periodic impairment analyses. As a result of the COVID-19 Pandemic, we performed impairment analyses during the nine months ended September 30, 2021 and September 30, 2020, which included updated estimates of expected future cash flows. As a result of our impairment analyses, we recorded one impairment during the nine months ended September 30, 2020 for $13 million. This impairment was recorded in net investment income as the investment is in a real estate fund. There were no impairments recognized in net investment gains (losses) on real estate and real estate joint ventures for either the nine months ended September 30, 2021 or 2020.
We diversify our real estate investments by both geographic region and property type to reduce risk of concentration. See Note 6 of the Notes to the Interim Condensed Consolidated Financial Statements for a summary of real estate investments, by income type, as well as income earned.
Other Limited Partnership Interests
Other limited partnership interests are comprised of investments in private funds, including private equity funds and hedge funds. At September 30, 2021 and December 31, 2020, the carrying value of other limited partnership interests was $13.5 billion and $9.5 billion, which included $669 million and $643 million of hedge funds, respectively. Other limited partnership interests were 2.62% and 1.79% of cash and invested assets at September 30, 2021 and December 31, 2020, respectively. Cash distributions on these investments are generated from realized investment gains, operating income from the underlying investments of the funds and liquidation of the underlying investments of the funds.
We use the equity method of accounting for most of our private equity funds. We generally recognize our share of a private equity fund’s earnings in net investment income on a three-month lag when the information is reported to us. Accordingly, changes in equity market levels, which can impact the underlying results of these private equity funds, are recorded in our net investment income on a three-month lag.
Other Invested Assets
The following table presents the carrying value of our other invested assets by type at:
| September 30, 2021 | December 31, 2020 | ||||||||||||||||||||||
| Asset Type | Carrying Value | % of Total | Carrying Value | % of Total | |||||||||||||||||||
| (Dollars in millions) | |||||||||||||||||||||||
| Freestanding derivatives with positive estimated fair values | $ | 10,519 | 56.3 | % | $ | 11,866 | 57.6 | % | |||||||||||||||
| Tax credit and renewable energy partnerships | 1,583 | 8.5 | 1,751 | 8.5 | |||||||||||||||||||
| Direct financing leases | 1,216 | 6.5 | 1,340 | 6.5 | |||||||||||||||||||
| Annuities funding structured settlement claims | 1,254 | 6.7 | 1,263 | 6.1 | |||||||||||||||||||
| Leveraged leases | 803 | 4.3 | 816 | 4.0 | |||||||||||||||||||
| FHLB common stock | 791 | 4.2 | 814 | 4.1 | |||||||||||||||||||
| Operating joint ventures | 828 | 4.4 | 733 | 3.6 | |||||||||||||||||||
| Funds withheld | 514 | 2.8 | 508 | 2.5 | |||||||||||||||||||
| Other | 1,175 | 6.3 | 1,502 | 7.2 | |||||||||||||||||||
| Total | $ | 18,683 | 100.0 | % | $ | 20,593 | 100.0 | % | |||||||||||||||
| Percentage of cash and invested assets | 3.6 | % | 3.9 | % |
Derivatives
Derivative Risks
We are exposed to various risks relating to our ongoing business operations, including interest rate, foreign currency exchange rate, credit and equity market. We use a variety of strategies to manage these risks, including the use of derivatives. See Note 7 of the Notes to the Interim Condensed Consolidated Financial Statements for:
-
A comprehensive description of the nature of our derivatives, including the strategies for which derivatives are used in managing various risks.
-
Information about the primary underlying risk exposure, gross notional amount, and estimated fair value of our derivatives by type of hedge designation, excluding embedded derivatives held at September 30, 2021 and December 31, 2020.
-
The statement of operations effects of derivatives in net investments in foreign operations, cash flow, fair value, or nonqualifying hedge relationships for the three months and nine months ended September 30, 2021 and 2020.
See “Quantitative and Qualitative Disclosures About Market Risk — Management of Market Risk Exposures — Hedging Activities” included in the 2020 Annual Report for more information about our use of derivatives by major hedge program.
Fair Value Hierarchy
See Note 8 of the Notes to the Interim Condensed Consolidated Financial Statements for derivatives measured at estimated fair value on a recurring basis and their corresponding fair value hierarchy.
The valuation of Level 3 derivatives involves the use of significant unobservable inputs and generally requires a higher degree of management judgment or estimation than the valuations of Level 1 and Level 2 derivatives. Although Level 3 inputs are unobservable, management believes they are consistent with what other market participants would use when pricing such instruments and are considered appropriate given the circumstances. The use of different inputs or methodologies could have a material effect on the estimated fair value of Level 3 derivatives and could materially affect net income.
Derivatives categorized as Level 3 at September 30, 2021 include: interest rate forwards with maturities which extend beyond the observable portion of the yield curve; interest rate total return swaps with unobservable repurchase rates; interest rate caps with unobservable volatility inputs; foreign currency swaps and forwards with certain unobservable inputs, including the unobservable portion of the yield curve; credit default swaps priced using unobservable credit spreads, or that are priced through independent broker quotations; and equity index options with unobservable correlation inputs. At September 30, 2021, less than 1% of the estimated fair value of our derivatives was priced through independent broker quotations.
See Note 8 of the Notes to the Interim Condensed Consolidated Financial Statements for a rollforward of the fair value measurements for derivatives measured at estimated fair value on a recurring basis using significant unobservable (Level 3) inputs.
The gain (loss) on Level 3 derivatives primarily relates to foreign currency derivatives that are valued using an unobservable portion of the swap yield curves and interest rate total return swaps with observable interest rates. Other significant inputs include the unobservable interest rate which extends beyond the observable portion of the yield curve. We validate the reasonableness of these inputs by valuing the positions using internal models and comparing the results to broker quotations.
The gain (loss) on Level 3 derivatives, percentage of gain (loss) attributable to observable and unobservable inputs, and the primary drivers of observable gain (loss) are summarized as follows:
| Three Months Ended September 30, 2021 | Nine Months Ended September 30, 2021 | |||||||||||||
| Gain (loss) recognized in net income (loss) (in millions) | ($279) | ($490) | ||||||||||||
| Approximate percentage of gain (loss) attributable to observable inputs | —% | 23% | ||||||||||||
| Primary drivers of observable gain (loss) | N/A | Increases in interest rates on interest rate total return swaps and increases in certain equity index levels on equity derivatives. | ||||||||||||
| Approximate percentage of gain (loss) attributable to unobservable inputs | 100% | 77% |
See “Management’s Discussion and Analysis of Financial Condition and Results of Operations — Summary of Critical Accounting Estimates — Derivatives” included in the 2020 Annual Report for further information on the estimates and assumptions that affect derivatives.
Credit Risk
See Note 7 of the Notes to the Interim Condensed Consolidated Financial Statements for information about how we manage credit risk related to derivatives and for the estimated fair value of our net derivative assets and net derivative liabilities after the application of master netting agreements and collateral.
Our policy is not to offset the fair value amounts recognized for derivatives executed with the same counterparty under the same master netting agreement. This policy applies to the recognition of derivatives on the consolidated balance sheets, and does not affect our legal right of offset.
Credit Derivatives
The following table presents the gross notional amount and estimated fair value of credit default swaps at:
| September 30, 2021 | December 31, 2020 | |||||||||||||||||||||||||
| Credit Default Swaps | Gross Notional Amount | Estimated Fair Value | Gross Notional Amount | Estimated Fair Value | ||||||||||||||||||||||
| (In millions) | ||||||||||||||||||||||||||
| Purchased | $ | 3,042 | $ | (96) | $ | 2,978 | $ | (112) | ||||||||||||||||||
| Written | 8,739 | 175 | 9,609 | 196 | ||||||||||||||||||||||
| Total | $ | 11,781 | $ | 79 | $ | 12,587 | $ | 84 |
The following table presents the gross gains, gross losses and net gains (losses) recognized in net derivative gains (losses) for credit default swaps as follows:
| Three Months Ended September 30, | Nine Months Ended September 30, | |||||||||||||||||||||||||||||||||||||||||||||||||||||||||||||||||||||||||
| 2021 | 2020 | 2021 | 2020 | |||||||||||||||||||||||||||||||||||||||||||||||||||||||||||||||||||||||
| Credit Default Swaps | Gross Gains | Gross Losses | Net Gains (Losses) | Gross Gains | Gross Losses | Net Gains (Losses) | Gross Gains | Gross Losses | Net Gains (Losses) | Gross Gains | Gross Losses | Net Gains (Losses) | ||||||||||||||||||||||||||||||||||||||||||||||||||||||||||||||
| (In millions) | ||||||||||||||||||||||||||||||||||||||||||||||||||||||||||||||||||||||||||
| Purchased (1) | $ | 5 | $ | (1) | $ | 4 | $ | — | $ | (8) | $ | (8) | $ | 21 | $ | (5) | $ | 16 | $ | 37 | $ | (33) | $ | 4 | ||||||||||||||||||||||||||||||||||||||||||||||||||
| Written (1) | 2 | (4) | (2) | 2 | (11) | (9) | 44 | (11) | 33 | 31 | (189) | (158) | ||||||||||||||||||||||||||||||||||||||||||||||||||||||||||||||
| Total | $ | 7 | $ | (5) | $ | 2 | $ | 2 | $ | (19) | $ | (17) | $ | 65 | $ | (16) | $ | 49 | $ | 68 | $ | (222) | $ | (154) |
(1)Gains (losses) do not include earned income (expense) on credit default swaps.
The favorable change in net gains (losses) on written credit default swaps of $191 million for the nine months ended September 30, 2021 compared to the nine months ended September 30, 2020 was due to certain credit spreads on certain credit default swaps used as replications narrowing in the current period as compared to widening in the prior period.
The maximum amount at risk related to our written credit default swaps is equal to the corresponding gross notional amount. In a replication transaction, we pair an asset on our balance sheet with a written credit default swap to synthetically replicate a corporate bond, a core asset holding of life insurance companies. Replications are entered into in accordance with the guidelines approved by state insurance regulators and the NAIC and are an important tool in managing the overall corporate credit risk within the Company. In order to match our long-dated insurance liabilities, we seek to buy long-dated corporate bonds. In some instances, these may not be readily available in the market, or they may be issued by corporations to which we already have significant corporate credit exposure. For example, by purchasing Treasury bonds (or other high-quality assets) and associating them with written credit default swaps on the desired corporate credit name, we can replicate the desired bond exposures and meet our ALM needs. In addition, given the shorter tenor of the credit default swaps (generally five-year tenors) versus a long dated corporate bond, we have more flexibility in managing our credit exposures.
Embedded Derivatives
See Note 8 of the Notes to the Interim Condensed Consolidated Financial Statements for information about embedded derivatives measured at estimated fair value on a recurring basis and their corresponding fair value hierarchy and a rollforward of the fair value measurements for embedded derivatives measured at estimated fair value on a recurring basis using significant unobservable (Level 3) inputs.
See Note 7 of the Notes to the Interim Condensed Consolidated Financial Statements for information about the nonperformance risk adjustment included in the valuation of guaranteed minimum benefits accounted for as embedded derivatives.
See “Management’s Discussion and Analysis of Financial Condition and Results of Operations — Summary of Critical Accounting Estimates — Derivatives” included in the 2020 Annual Report for further information on the estimates and assumptions that affect embedded derivatives.
Off-Balance Sheet Arrangements
Credit and Committed Facilities
We maintain an unsecured revolving credit facility, as well as certain committed facilities, with various financial institutions. See “— Liquidity and Capital Resources — The Company — Liquidity and Capital Sources — Global Funding Sources — Credit and Committed Facilities” for descriptions of such arrangements. For the classification of expenses on such credit and committed facilities and the nature of the associated liability for letters of credit issued and drawdowns on these credit and committed facilities, see Note 13 of the Notes to the Consolidated Financial Statements included in the 2020 Annual Report.
Collateral for Securities Lending, Repurchase Agreements, Third-Party Custodian Administered Repurchase Programs and Derivatives
We participate in securities lending transactions, repurchase agreements and third-party custodian administered repurchase programs in the normal course of business for the purpose of enhancing the total return on our investment portfolio. See Note 6 of the Notes to the Interim Condensed Consolidated Financial Statements, as well as “Summary of Significant Accounting Policies — Investments — Securities Lending, Repurchase Agreements and FHLB of Boston Advance Agreements” in Note 1 of the Notes to the Consolidated Financial Statements included in the 2020 Annual Report for further discussion of our securities lending transactions and repurchase agreements, the classification of revenues and expenses, and the nature of the secured financing arrangements and associated liabilities.
Third-party custodian administered repurchase programs: We loan certain of our fixed maturity securities AFS to unaffiliated financial institutions and, in exchange, non-cash collateral is put on deposit by the unaffiliated financial institutions on our behalf with third-party custodians. The estimated fair value of securities loaned in connection with these transactions was $59 million and $19 million at September 30, 2021 and December 31, 2020, respectively. Non-cash collateral on deposit with third-party custodians held on our behalf was $64 million and $20 million, at estimated fair value, at September 30, 2021 and December 31, 2020, respectively, which cannot be sold or re-pledged, and which is not reflected in our consolidated financial statements.
Derivatives: We enter into derivatives to manage various risks relating to our ongoing business operations. We receive non-cash collateral from counterparties for derivatives, which can be sold or re-pledged subject to certain constraints, and which is not reflected in our consolidated financial statements. The amount of this non-cash collateral was $1.3 billion and $1.7 billion, at estimated fair value, at September 30, 2021 and December 31, 2020, respectively. See “— Liquidity and Capital Resources — The Company — Liquidity and Capital Uses — Pledged Collateral” and Note 7 of the Notes to the Interim Condensed Consolidated Financial Statements for information regarding the earned income on and the gross notional amount, estimated fair value of assets and liabilities and primary underlying risk exposure of our derivatives.
Investment Commitments
We enter into the following commitments in the normal course of business for the purpose of enhancing the total return on our investment portfolio: mortgage loan commitments and commitments to fund partnerships, bank credit facilities, bridge loans and private corporate bond investments. See Note 15 of the Notes to the Interim Condensed Consolidated Financial Statements for further information about these investment commitments. See “Net Investment Income” and “Net Investment Gains (Losses)” in Note 6 of the Notes to the Interim Condensed Consolidated Financial Statements for information on the investment income, investment expense, gains and losses from such investments and the liability for credit loss for unfunded mortgage loan commitments. See also “— Investments — Fixed Maturity Securities AFS and Equity Securities,” “— Investments — Mortgage Loans,” “— Investments — Real Estate and Real Estate Joint Ventures” and “— Investments — Other Limited Partnership Interests.”
Lease Commitments
As lessee, we have entered into various lease and sublease agreements for office space and equipment. Our commitments under such lease agreements are included within the contractual obligations table in “Management’s Discussion and Analysis of Financial Condition and Results of Operations — Liquidity and Capital Resources — The Company — Contractual Obligations” in the 2020 Annual Report. See also Note 11 of the Notes to the Consolidated Financial Statements included in the 2020 Annual Report.
Guarantees
See “Guarantees” in Note 15 of the Notes to the Interim Condensed Consolidated Financial Statements.
Policyholder Liabilities
We establish, and carry as liabilities, actuarially determined amounts that are calculated to meet policy obligations or to provide for future annuity payments. Amounts for actuarial liabilities are computed and reported on the interim condensed consolidated financial statements in conformity with GAAP. For more details on Policyholder Liabilities, see “Management’s Discussion and Analysis of Financial Condition and Results of Operations — Summary of Critical Accounting Estimates” included in the 2020 Annual Report.
We periodically review our estimates of actuarial liabilities for future benefits and compare them with our actual experience. We revise estimates, to the extent permitted or required under GAAP, if we determine that future expected experience differs from assumptions used in the development of actuarial liabilities. We charge or credit changes in our liabilities to expenses in the period the liabilities are established or re-estimated. If the liabilities originally established for future benefit payments prove inadequate, we must increase them. Such an increase could adversely affect our earnings and have a material adverse effect on our business, results of operations and financial condition.
See “Business — Regulation — Insurance Regulation — Policy and Contract Reserve Adequacy Analysis” and “Risk Factors — Business Risks” included in the 2020 Annual Report for further information regarding required analyses of the adequacy of statutory reserves of our insurance operations.
The following discussion on future policy benefits and policyholder account balances should be read in conjunction with “Management’s Discussion and Analysis of Financial Condition and Results of Operations — Industry Trends — Impact of a Sustained Low Interest Rate Environment” included in the 2020 Annual Report, as amended or supplemented in our subsequently filed Quarterly Reports on Form 10-Q under similarly captioned sections, and “— Variable Annuity Guarantees.” See also Notes 1 and 4 of the Notes to the Consolidated Financial Statements included in the 2020 Annual Report for additional information.
Future Policy Benefits
We establish liabilities for amounts payable under insurance policies. A discussion of future policy benefits by segment (as well as Corporate & Other) follows.
U.S.
Amounts payable under insurance policies for this segment are comprised of group insurance and annuities. For group insurance, future policyholder benefits are comprised mainly of liabilities for disabled lives under disability waiver of premium policy provisions, liabilities for survivor income benefit insurance, active life policies and premium stabilization and other contingency liabilities held under life insurance contracts. For group annuity contracts, future policyholder benefits are primarily related to payout annuities, including pension risk transfers, structured settlement annuities and institutional income annuities. There is no interest rate crediting flexibility on these liabilities.
Asia
Future policy benefits for this segment are held primarily for traditional life, endowment, annuity and accident & health contracts. They are also held for total return pass-through provisions included in certain universal life and savings products. They include certain liabilities for variable annuity and variable life guarantees of minimum death benefits, and longevity guarantees. Factors impacting these liabilities include sustained periods of lower than expected yields, lower than expected asset reinvestment rates, market volatility, actual lapses resulting in lower than expected income, and actual mortality or morbidity resulting in higher than expected benefit payments.
Latin America
Future policy benefit liabilities for this segment are held primarily for immediate annuities, traditional life contracts and total return pass-through provisions included in certain universal life and savings products. There is no interest rate crediting flexibility on the immediate annuity and traditional life liabilities. Other factors impacting these liabilities are actual mortality resulting in higher than expected benefit payments and actual lapses resulting in lower than expected income.
EMEA
Future policy benefits for this segment include unearned premium reserves for group life and medical and credit insurance contracts. Future policy benefits are also held for traditional life, endowment and annuity contracts with significant mortality risk and accident & health contracts. Factors impacting these liabilities include lower than expected asset reinvestment rates, market volatility, actual lapses resulting in lower than expected income, and actual mortality or morbidity resulting in higher than expected benefit payments.
MetLife Holdings
Future policy benefits for the life insurance business are comprised mainly of liabilities for traditional life insurance contracts. For the annuities business, future policy benefits are comprised mainly of liabilities for life-contingent income annuities and liabilities for the variable annuity guaranteed minimum benefits that are accounted for as insurance. For the long-term care business, future policyholder benefits are comprised mainly of liabilities for disabled lives under disability waiver of premium policy provisions, and active life policies. In addition, for our other products, future policyholder benefits related to the reinsurance of our former Japan joint venture are comprised of liabilities for the variable annuity guaranteed minimum benefits that are accounted for as insurance.
Corporate & Other
Future policy benefits primarily include liabilities for other reinsurance business.
Policyholder Account Balances
Policyholder account balances are generally equal to the account value, which includes accrued interest credited, but excludes the impact of any applicable charge that may be incurred upon surrender. A discussion of policyholder account balances by segment follows.
U.S.
Policyholder account balances in this segment are comprised of funding agreements, retained asset accounts, universal life policies, the fixed account of variable life insurance policies and specialized life insurance products for benefit programs.
Group Benefits
Policyholder account balances in this business are held for retained asset accounts, universal life policies, the fixed account of variable life insurance policies and specialized life insurance products for benefit programs. Policyholder account balances are credited interest at a rate we determine, which is influenced by current market rates. Most of these policyholder account balances have minimum credited rate guarantees.
The table below presents the breakdown of account value subject to minimum guaranteed crediting rates for Group Benefits:
| September 30, 2021 | |||||||||||
| Guaranteed Minimum Crediting Rate | Account Value | Account Value at Guarantee | |||||||||
| (In millions) | |||||||||||
| Greater than 0% but less than 2% | $ | 5,259 | $ | 5,128 | |||||||
| Equal to or greater than 2% but less than 4% | $ | 1,583 | $ | 1,544 | |||||||
| Equal to or greater than 4% | $ | 799 | $ | 771 |
Retirement and Income Solutions
Policyholder account balances in this business are held largely for investment-type products, mainly funding agreements, as well as postretirement benefits and corporate-owned life insurance to fund non-qualified benefit programs for executives. Interest crediting rates vary by type of contract and can be fixed or variable. Variable interest crediting rates are generally tied to an external index, most commonly (1-month or 3-month) LIBOR or Secured Overnight Financing Rate. We guarantee payment of interest and return of principal at the contractual maturity date.
The table below presents the breakdown of account value subject to minimum guaranteed crediting rates for RIS:
| September 30, 2021 | |||||||||||
| Guaranteed Minimum Crediting Rate | Account Value | Account Value at Guarantee | |||||||||
| (In millions) | |||||||||||
| Greater than 0% but less than 2% | $ | 148 | $ | — | |||||||
| Equal to or greater than 2% but less than 4% | $ | 827 | $ | 184 | |||||||
| Equal to or greater than 4% | $ | 4,585 | $ | 4,345 |
Asia
Policyholder account balances in this segment are held largely for fixed income retirement and savings plans, fixed deferred annuities, interest sensitive whole life products, universal life and, to a lesser degree, liability amounts for Unit-linked investments that do not meet the GAAP definition of separate accounts. Also included are certain liabilities for retirement and savings products sold in certain countries in Asia that generally are sold with minimum credited rate guarantees. Liabilities for guarantees on certain variable annuities in Asia are accounted for as embedded derivatives and recorded at estimated fair value and are also included within policyholder account balances. Most of these policyholder account balances have minimum credited rate guarantees. Liabilities for Unit-linked investments are impacted by changes in the fair value of the associated underlying investments, as the return on assets is generally passed directly to the policyholder.
The table below presents the breakdown of account value subject to minimum guaranteed crediting rates for Asia:
| September 30, 2021 | |||||||||||
| Guaranteed Minimum Crediting Rate | Account Value | Account Value at Guarantee | |||||||||
| (In millions) | |||||||||||
| Annuities: | |||||||||||
| Greater than 0% but less than 2% | $ | 31,106 | $ | 1,750 | |||||||
| Equal to or greater than 2% but less than 4% | $ | 989 | $ | 422 | |||||||
| Equal to or greater than 4% | $ | 1 | $ | 1 | |||||||
| Life & Other: | |||||||||||
| Greater than 0% but less than 2% | $ | 12,938 | $ | 12,397 | |||||||
| Equal to or greater than 2% but less than 4% | $ | 33,448 | $ | 21,410 | |||||||
| Equal to or greater than 4% | $ | 281 | $ | 281 |
Latin America
Policyholder account balances in this segment are held largely for investment-type products, universal life products, deferred annuities and Unit-linked investments that do not meet the GAAP definition of separate accounts. Liabilities for Unit-linked investments are impacted by changes in the fair value of the associated investments, as the return on assets is generally passed directly to the policyholder. Many of the other liabilities have minimum credited rate guarantees.
EMEA
Policyholder account balances in this segment are held mostly for universal life, deferred annuities, pension products, and Unit-linked investments that do not meet the GAAP definition of separate accounts. They are also held for endowment products without significant mortality risk. Most of these policyholder account balances have minimum credited rate guarantees. Liabilities for Unit-linked investments are impacted by changes in the fair value of the associated investments, as the return on assets is generally passed directly to the policyholder.
MetLife Holdings
Life policyholder account balances in this segment are held for retained asset accounts, universal life policies, the fixed account of variable life insurance policies, and funding agreements. For annuities, policyholder account balances are held for fixed deferred annuities, the fixed account portion of variable annuities, non-life contingent income annuities, and embedded derivatives related to variable annuity guarantees. Interest is credited to the policyholder’s account at interest rates we determine which are influenced by current market rates, subject to specified minimums. Most of these policyholder account balances have minimum credited rate guarantees. Additionally, for our other products, policyholder account balances are held for variable annuity guarantees assumed from a former operating joint venture in Japan that are accounted for as embedded derivatives.
The table below presents the breakdown of account value subject to minimum guaranteed crediting rates for the MetLife Holdings segment:
| September 30, 2021 | |||||||||||
| Guaranteed Minimum Crediting Rate | Account Value | Account Value at Guarantee | |||||||||
| (In millions) | |||||||||||
| Greater than 0% but less than 2% | $ | 1,169 | $ | 1,137 | |||||||
| Equal to or greater than 2% but less than 4% | $ | 17,499 | $ | 15,936 | |||||||
| Equal to or greater than 4% | $ | 7,440 | $ | 6,828 |
Variable Annuity Guarantees
We issue, directly and through assumed business, certain variable annuity products with guaranteed minimum benefits that provide the policyholder a minimum return based on their initial deposit (i.e., the benefit base) less withdrawals. In some cases, the benefit base may be increased by additional deposits, bonus amounts, accruals or optional market value resets. See Note 4 of the Notes to the Interim Condensed Consolidated Financial Statements, as well as Notes 1 and 4 of the Notes to the Consolidated Financial Statements included in the 2020 Annual Report for additional information.
Certain guarantees, including portions thereof, have insurance liabilities established that are included in future policy benefits. Guarantees accounted for in this manner include guaranteed minimum death benefits (“GMDBs”), the life-contingent portion of guaranteed minimum withdrawal benefits (“GMWBs”), elective guaranteed minimum income benefit (“GMIB”) annuitizations, and the life contingent portion of GMIBs that require annuitization when the account balance goes to zero. These liabilities are accrued over the life of the contract in proportion to actual and future expected policy assessments based on the level of guaranteed minimum benefits generated using multiple scenarios of separate account returns. The scenarios are based on best estimate assumptions consistent with those used to amortize DAC. When current estimates of future benefits exceed those previously projected or when current estimates of future assessments are lower than those previously projected, liabilities will increase, resulting in a current period charge to net income. The opposite result occurs when the current estimates of future benefits are lower than those previously projected or when current estimates of future assessments exceed those previously projected. At the end of each reporting period, we update the actual amount of business remaining in-force, which impacts expected future assessments and the projection of estimated future benefits resulting in a current period charge or increase to earnings.
Certain guarantees, including portions thereof, accounted for as embedded derivatives, are recorded at estimated fair value and included in policyholder account balances. Guarantees accounted for as embedded derivatives include guaranteed minimum accumulation benefits (“GMABs”), the non-life contingent portion of GMWBs and certain non-life contingent portions of GMIBs. The estimated fair values of guarantees accounted for as embedded derivatives are determined based on the present value of projected future benefits minus the present value of projected future fees. The projections of future benefits and future fees require capital market and actuarial assumptions including expectations concerning policyholder behavior. A risk-neutral valuation methodology is used to project the cash flows from the guarantees under multiple capital market scenarios to determine an economic liability. The reported estimated fair value is then determined by taking the present value of these risk-free generated cash flows using a discount rate that incorporates a spread over the risk-free rate to reflect our nonperformance risk and adding a risk margin. For more information on the determination of estimated fair value, see Note 8 of the Notes to the Interim Condensed Consolidated Financial Statements.
The table below presents the carrying value for guarantees at:
| Future Policy Benefits | Policyholder Account Balances | ||||||||||||||||||||||
| September 30, 2021 | December 31, 2020 | September 30, 2021 | December 31, 2020 | ||||||||||||||||||||
| (In millions) | |||||||||||||||||||||||
| Asia | |||||||||||||||||||||||
| GMDB | $ | 4 | $ | 6 | $ | — | $ | — | |||||||||||||||
| GMAB | — | — | 12 | 26 | |||||||||||||||||||
| GMWB | 33 | 35 | 110 | 134 | |||||||||||||||||||
| EMEA | |||||||||||||||||||||||
| GMDB | 3 | 6 | — | — | |||||||||||||||||||
| GMAB | — | — | 11 | 31 | |||||||||||||||||||
| GMWB | 18 | 31 | (66) | (23) | |||||||||||||||||||
| MetLife Holdings | |||||||||||||||||||||||
| GMDB | 553 | 450 | — | — | |||||||||||||||||||
| GMIB | 1,039 | 954 | 157 | 323 | |||||||||||||||||||
| GMAB | — | — | (1) | — | |||||||||||||||||||
| GMWB | 175 | 179 | 204 | 443 | |||||||||||||||||||
| Total | $ | 1,825 | $ | 1,661 | $ | 427 | $ | 934 |
The carrying amounts for guarantees included in policyholder account balances above include nonperformance risk adjustments of $89 million and $137 million at September 30, 2021 and December 31, 2020, respectively. These nonperformance risk adjustments represent the impact of including a credit spread when discounting the underlying risk-neutral cash flows to determine the estimated fair values. The nonperformance risk adjustment does not have an economic impact on us as it cannot be monetized given the nature of these policyholder liabilities. The change in valuation arising from the nonperformance risk adjustment is not hedged.
The carrying values of these guarantees can change significantly during periods of sizable and sustained shifts in equity market performance, equity volatility, interest rates or foreign currency exchange rates. Carrying values are also impacted by our assumptions around mortality, separate account returns and policyholder behavior, including lapse rates.
As discussed below, we use a combination of product design, hedging strategies, reinsurance, and other risk management actions to mitigate the risks related to these benefits. Within each type of guarantee, there is a range of product offerings reflecting the changing nature of these products over time. Changes in product features and terms are in part driven by customer demand but, more importantly, reflect our risk management practices of continuously evaluating the guaranteed benefits and their associated asset-liability matching. We continue to diversify the concentration of income benefits in our portfolio by focusing on withdrawal benefits, variable annuities without living benefits and index-linked annuities.
The sections below provide further detail by total account value for certain of our most popular guarantees. Total account values include amounts not reported on the consolidated balance sheets from assumed business, Unit-linked investments that do not qualify for presentation as separate account assets, and amounts included in our general account. The total account values and the net amounts at risk include direct and assumed business, but exclude offsets from hedging or ceded reinsurance, if any.
GMDBs
We offer a range of GMDBs to our contractholders. The table below presents GMDBs, by benefit type, at September 30, 2021:
| Total Account Value (1) | |||||||||||
| Asia & EMEA | MetLife Holdings | ||||||||||
| (In millions) | |||||||||||
| Return of premium or five to seven year step-up | $ | 7,591 | $ | 46,305 | |||||||
| Annual step-up | — | 3,112 | |||||||||
| Roll-up and step-up combination | — | 5,364 | |||||||||
| Total | $ | 7,591 | $ | 54,781 |
(1)Total account value excludes $592 million for contracts with no GMDBs. The Company’s annuity contracts with guarantees may offer more than one type of guarantee in each contract. Therefore, the amounts listed for GMDBs and for living benefit guarantees are not mutually exclusive.
Based on total account value, less than 18% of our GMDBs included enhanced death benefits such as the annual step-up or roll-up and step-up combination products at September 30, 2021.
Living Benefit Guarantees
The table below presents our living benefit guarantees based on total account values at September 30, 2021:
| Total Account Value (1) | |||||||||||
| Asia & EMEA | MetLife Holdings | ||||||||||
| (In millions) | |||||||||||
| GMIB | $ | — | $ | 20,143 | |||||||
| GMWB - non-life contingent (2) | 1,003 | 2,130 | |||||||||
| GMWB - life-contingent | 3,228 | 8,546 | |||||||||
| GMAB | 1,647 | 157 | |||||||||
| Total | $ | 5,878 | $ | 30,976 |
(1)Total account value excludes $26.1 billion for contracts with no living benefit guarantees. The Company’s annuity contracts with guarantees may offer more than one type of guarantee in each contract. Therefore, the amounts listed for GMDBs and for living benefit guarantee amounts are not mutually exclusive.
(2)The Asia and EMEA segments include the non-life contingent portion of the GMWB total account value of $1.0 billion with a guarantee at annuitization.
In terms of total account value, GMIBs are our most significant living benefit guarantee. Our primary risk management strategy for our GMIB products is our derivatives hedging program as discussed below. Additionally, we have engaged in certain reinsurance agreements covering some of our GMIB business. As part of our overall risk management approach for living benefit guarantees, we continually monitor the reinsurance markets for the right opportunity to purchase additional coverage for our GMIB business. We stopped selling GMIBs in February 2016.
The table below presents our GMIB associated total account values, by their guaranteed payout basis, at September 30, 2021:
| Total Account Value | |||||
| (In millions) | |||||
| 7-year setback, 2.5% interest rate | $ | 5,946 | |||
| 7-year setback, 1.5% interest rate | 1,193 | ||||
| 10-year setback, 1.5% interest rate | 4,022 | ||||
| 10-year mortality projection, 10-year setback, 1.0% interest rate | 7,627 | ||||
| 10-year mortality projection, 10-year setback, 0.5% interest rate | 1,355 | ||||
| $ | 20,143 |
The annuitization interest rates on GMIBs have been decreased from 2.5% to 0.5% over time, partially in response to the low interest rate environment, accompanied by an increase in the setback period from seven years to 10 years and the introduction of a 10-year mortality projection.
Additionally, 39% of the $20.1 billion of GMIB total account value has been invested in managed volatility funds as of September 30, 2021. These funds seek to manage volatility by adjusting the fund holdings within certain guidelines based on capital market movements. Such activity reduces the overall risk of the underlying funds while maintaining their growth opportunities. These risk mitigation techniques reduce or eliminate the need for us to manage the funds’ volatility through hedging or reinsurance.
Our GMIB products typically have a waiting period of 10 years to be eligible for annuitization. As of September 30, 2021, only 35% of our contracts with GMIBs were eligible for annuitization. The remaining contracts are not eligible for annuitization for an average of three years.
Once eligible for annuitization, contractholders would be expected to annuitize only if their contracts were in-the-money. We calculate in-the-moneyness with respect to GMIBs consistent with net amount at risk as discussed in Note 4 of the Notes to the Interim Condensed Consolidated Financial Statements, by comparing the contractholders’ income benefits based on total account values and current annuity rates versus the guaranteed income benefits. The net amount at risk was $519 million at September 30, 2021, of which $477 million was related to GMIBs. For those contracts with GMIB, the table below presents details of contracts that are in-the-money and out-of-the-money at September 30, 2021:
| In-the- Moneyness | Total Account Value | % of Total | |||||||||||||||
| (In millions) | |||||||||||||||||
| In-the-money | 30% or greater | $ | 476 | 2 | % | ||||||||||||
| 20% to less than 30% | 259 | 1 | % | ||||||||||||||
| 10% to less than 20% | 434 | 2 | % | ||||||||||||||
| 0% to less than 10% | 813 | 4 | % | ||||||||||||||
| 1,982 | |||||||||||||||||
| Out-of-the-money | -10% to 0% | 2,527 | 13 | % | |||||||||||||
| -20% to less than -10% | 4,312 | 22 | % | ||||||||||||||
| Greater than -20% | 11,322 | 56 | % | ||||||||||||||
| 18,161 | |||||||||||||||||
| Total GMIBs | $ | 20,143 |
Derivatives Hedging Variable Annuity Guarantees
Our risk mitigating hedging strategy uses various over-the-counter and exchange traded derivatives. The table below presents the gross notional amount, estimated fair value and primary underlying risk exposure of the derivatives hedging our variable annuity guarantees:
| Instrument Type | September 30, 2021 | December 31, 2020 | ||||||||||||||||||||||||||||||||||||||||||
| Primary Underlying Risk Exposure | Gross Notional Amount | Estimated Fair Value | Gross Notional Amount | Estimated Fair Value | ||||||||||||||||||||||||||||||||||||||||
| Assets | Liabilities | Assets | Liabilities | |||||||||||||||||||||||||||||||||||||||||
| (In millions) | ||||||||||||||||||||||||||||||||||||||||||||
| Interest rate | Interest rate swaps | $ | 10,984 | $ | 50 | $ | 79 | $ | 14,188 | $ | 85 | $ | 21 | |||||||||||||||||||||||||||||||
| Interest rate futures | 1,419 | 3 | — | 1,442 | — | 2 | ||||||||||||||||||||||||||||||||||||||
| Interest rate options | 151 | 1 | — | 637 | 134 | — | ||||||||||||||||||||||||||||||||||||||
| Foreign currency exchange rate | Foreign currency forwards | 1,206 | 4 | 9 | 1,834 | 27 | 13 | |||||||||||||||||||||||||||||||||||||
| Equity market | Equity futures | 3,838 | 47 | 10 | 4,891 | 12 | 38 | |||||||||||||||||||||||||||||||||||||
| Equity index options | 4,571 | 402 | 374 | 5,360 | 558 | 408 | ||||||||||||||||||||||||||||||||||||||
| Equity variance swaps | 733 | 17 | 15 | 716 | 15 | 12 | ||||||||||||||||||||||||||||||||||||||
| Equity total return swaps | 3,220 | 15 | 11 | 1,533 | 3 | 124 | ||||||||||||||||||||||||||||||||||||||
| Total | $ | 26,122 | $ | 539 | $ | 498 | $ | 30,601 | $ | 834 | $ | 618 |
The change in estimated fair values of our derivatives is recorded in policyholder benefits and claims if such derivatives are hedging guarantees included in future policy benefits, and in net derivative gains (losses) if such derivatives are hedging guarantees included in policyholder account balances.
Our hedging strategy involves the significant use of static longer-term derivative instruments to avoid the need to execute transactions during periods of market disruption or higher volatility. We continually monitor the capital markets for opportunities to adjust our liability coverage, as appropriate. Futures are also used to dynamically adjust the daily coverage levels as markets and liability exposures fluctuate.
We remain liable for the guaranteed benefits in the event that reinsurers or derivative counterparties are unable or unwilling to pay. Certain of our reinsurance agreements and all derivative positions are collateralized and derivatives positions are subject to master netting agreements, both of which significantly reduce the exposure to counterparty risk. In addition, we are subject to the risk that hedging and other risk management actions prove ineffective or that unanticipated policyholder behavior or mortality, combined with adverse market events, produces economic losses beyond the scope of the risk management techniques employed.
Liquidity and Capital Resources
Overview
Our business and results of operations are materially affected by conditions in the global capital markets and the economy generally. Stressed conditions, volatility and disruptions in global capital markets, particular markets, or financial asset classes can have an adverse effect on us, in part because we have a large investment portfolio and our insurance liabilities and derivatives are sensitive to changing market factors. Changing conditions in the global capital markets and the economy may affect our financing costs and market interest for our debt or equity securities. For further information regarding market factors that could affect our ability to meet liquidity and capital needs, see “— Industry Trends” and “— Investments — Current Environment.”
Liquidity Management
Based upon the strength of our franchise, diversification of our businesses, strong financial fundamentals and the substantial funding sources available to us as described herein, we continue to believe we have access to ample liquidity to meet business requirements under current market conditions and reasonably possible stress scenarios. We continuously monitor and adjust our liquidity and capital plans for MetLife, Inc. and its subsidiaries in light of market conditions, as well as changing needs and opportunities.
Short-term Liquidity
We maintain a substantial short-term liquidity position, which was $11.3 billion and $9.4 billion at September 30, 2021 and December 31, 2020, respectively. Short-term liquidity includes cash and cash equivalents and short-term investments, excluding assets that are pledged or otherwise committed, including amounts received in connection with securities lending, repurchase agreements, derivatives, and secured borrowings, as well as amounts held in the closed block.
Liquid Assets
An integral part of our liquidity management includes managing our level of liquid assets, which was $222.6 billion and $235.1 billion at September 30, 2021 and December 31, 2020, respectively. Liquid assets include cash and cash equivalents, short-term investments and publicly-traded securities, excluding assets that are pledged or otherwise committed. Assets pledged or otherwise committed include amounts received in connection with securities lending, repurchase agreements, derivatives, regulatory deposits, the collateral financing arrangement, funding agreements and secured borrowings, as well as amounts held in the closed block.
Capital Management
We have established several senior management committees as part of our capital management process. These committees, including the Capital Management Committee and the Enterprise Risk Committee (“ERC”), regularly review actual and projected capital levels (under a variety of scenarios including stress scenarios) and our annual capital plan in accordance with our capital policy. The Capital Management Committee is comprised of members of senior management, including MetLife, Inc.’s Chief Financial Officer (“CFO”), Treasurer, and Chief Risk Officer (“CRO”). The ERC is also comprised of members of senior management, including MetLife, Inc.’s CFO, CRO and Chief Investment Officer.
MetLife, Inc.’s Board of Directors (“Board of Directors”) and senior management are directly involved in the development and maintenance of our capital policy. The capital policy sets forth, among other things, minimum and target capital levels and the governance of the capital management process. All capital actions, including proposed changes to the annual capital plan, capital targets or capital policy, are reviewed by the Finance and Risk Committee of the Board of Directors prior to obtaining full Board of Directors approval. The Board of Directors approves the capital policy and the annual capital plan and authorizes capital actions, as required.
See “Risk Factors — Capital Risks — We May not be Able to Pay Dividends or Repurchase Our Stock Due to Legal and Regulatory Restrictions or Cash Buffer Needs” and Note 16 of the Notes to the Consolidated Financial Statements included in the 2020 Annual Report for information regarding restrictions on payment of dividends and stock repurchases. See also “— The Company — Liquidity and Capital Uses — Common Stock Repurchases” for information regarding MetLife, Inc.’s common stock repurchase authorizations.
The Company
Liquidity
Liquidity refers to the ability to generate adequate amounts of cash to meet our needs. In the event of significant cash requirements beyond anticipated liquidity needs, we have various alternatives available depending on market conditions and the amount and timing of the liquidity need. These available alternatives include cash flows from operations, sales of liquid assets, global funding sources including commercial paper and various credit and committed facilities. See “Management’s Discussion and Analysis of Financial Condition — Liquidity and Capital Resources — The Company — Liquidity” included in the 2020 Annual Report.
Capital
We manage our capital position to maintain our financial strength and credit ratings. Our capital position is supported by our ability to generate strong cash flows within our operating companies and borrow funds at competitive rates, as well as by our demonstrated ability to raise additional capital to meet operating and growth needs despite adverse market and economic conditions.
Summary of the Company’s Primary Sources and Uses of Liquidity and Capital
Our primary sources and uses of liquidity and capital are summarized as follows:
| Nine Months Ended September 30, | |||||||||||
| 2021 | 2020 | ||||||||||
| (In millions) | |||||||||||
| Sources: | |||||||||||
| Operating activities, net | $ | 7,256 | $ | 6,486 | |||||||
| Net change in policyholder account balances | 4,041 | 8,770 | |||||||||
| Net change in payables for collateral under securities loaned and other transactions | 1,279 | 8,025 | |||||||||
| Cash received for other transactions with tenors greater than three months | — | 150 | |||||||||
| Long-term debt issued | 29 | 1,124 | |||||||||
| Financing element on certain derivative instruments and other derivative related transactions, net | 305 | — | |||||||||
| Preferred stock issued, net of issuance costs | — | 1,961 | |||||||||
| Other, net | 20 | 129 | |||||||||
| Effect of change in foreign currency exchange rates on cash and cash equivalents | — | 6 | |||||||||
| Total sources | 12,930 | 26,651 | |||||||||
| Uses: | |||||||||||
| Investing activities, net | 8,325 | 16,407 | |||||||||
| Cash paid for other transactions with tenors greater than three months | 100 | 175 | |||||||||
| Long-term debt repaid | 540 | 95 | |||||||||
| Collateral financing arrangement repaid | 39 | 69 | |||||||||
| Financing element on certain derivative instruments and other derivative related transactions, net | — | 108 | |||||||||
| Treasury stock acquired in connection with share repurchases | 3,127 | 580 | |||||||||
| Redemption of preferred stock | 494 | — | |||||||||
| Preferred stock redemption premium | 6 | — | |||||||||
| Dividends on preferred stock | 166 | 168 | |||||||||
| Dividends on common stock | 1,242 | 1,242 | |||||||||
| Effect of change in foreign currency exchange rates on cash and cash equivalents | 392 | — | |||||||||
| Total uses | 14,431 | 18,844 | |||||||||
| Net increase (decrease) in cash and cash equivalents | $ | (1,501) | $ | 7,807 |
Cash Flows from Operations
The principal cash inflows from our insurance activities come from insurance premiums, net investment income, annuity considerations and deposit funds. The principal cash outflows are the result of various life insurance, property and casualty, annuity and pension products, operating expenses and income tax, as well as interest expense.
Cash Flows from Investments
The principal cash inflows from our investment activities come from repayments of principal, proceeds from maturities and sales of investments and settlements of freestanding derivatives. The principal cash outflows relate to purchases of investments, issuances of policy loans and settlements of freestanding derivatives. Additional cash outflows relate to purchases of businesses. We typically have a net cash outflow from investing activities because cash inflows from insurance operations are reinvested in accordance with our ALM discipline to fund insurance liabilities. We closely monitor and manage these risks through our comprehensive investment risk management process.
Cash Flows from Financing
The principal cash inflows from our financing activities come from issuances of debt and other securities, deposits of funds associated with policyholder account balances and lending of securities. The principal cash outflows come from repayments of debt and the collateral financing arrangement, payments of dividends on and repurchases of MetLife, Inc.’s securities, withdrawals associated with policyholder account balances and the return of securities on loan.
Liquidity and Capital Sources
In addition to the general description of liquidity and capital sources in “— Summary of the Company’s Primary Sources and Uses of Liquidity and Capital,” the Company’s primary sources of liquidity and capital are set forth below.
Global Funding Sources
Liquidity is provided by a variety of global funding sources, including funding agreements, credit and committed facilities and commercial paper. Capital is provided by a variety of global funding sources, including short-term and long-term debt, the collateral financing arrangement, junior subordinated debt securities, preferred securities, equity securities and equity-linked securities. MetLife, Inc. maintains a shelf registration statement with the SEC that permits the issuance of public debt, equity and hybrid securities. As a “Well-Known Seasoned Issuer” under SEC rules, MetLife, Inc.’s shelf registration statement provides for automatic effectiveness upon filing and has no stated issuance capacity. The diversity of our global funding sources enhances our funding flexibility, limits dependence on any one market or source of funds and generally lowers the cost of funds. Our primary global funding sources include:
Preferred Stock
See Note 10 of the Notes to the Interim Condensed Consolidated Financial Statements and Note 16 of the Notes to the Consolidated Financial Statements included in the 2020 Annual Report.
Common Stock
For the nine months ended September 30, 2021 and 2020, MetLife, Inc. issued 4,478,479 and 3,040,195 new shares of its common stock, respectively, for $180 million and $118 million, respectively, to satisfy various stock option exercises and other stock-based awards.
Commercial Paper, Reported in Short-term Debt
MetLife, Inc. and MetLife Funding, Inc. (“MetLife Funding”), a subsidiary of MLIC, each have a commercial paper program that is supported by our unsecured revolving credit facility (see “— Credit and Committed Facilities”). MetLife Funding raises cash from its commercial paper program and uses the proceeds to extend loans through MetLife Credit Corp., another subsidiary of MLIC, to affiliates in order to enhance the financial flexibility and liquidity of these companies.
Federal Home Loan Bank Funding Agreements, Reported in Policyholder Account Balances
Certain of our U.S. insurance subsidiaries are members of a regional Federal Home Loan Bank (“FHLB”). For the nine months ended September 30, 2021 and 2020, we issued $27.4 billion and $27.8 billion, respectively, and repaid $27.4 billion and $26.9 billion, respectively, of funding agreements with certain regional FHLBs. At both September 30, 2021 and December 31, 2020, total obligations outstanding under these funding agreements were $16.3 billion. See Note 4 of the Notes to the Consolidated Financial Statements included in the 2020 Annual Report.
Federal Home Loan Bank Advance Agreements, Reported in Liabilities Held-for-Sale
For the nine months ended September 30, 2021 and 2020, we borrowed $0 and $2.2 billion, respectively, and repaid $700 million and $2.2 billion, respectively, under advance agreements with the FHLB of Boston. At September 30, 2021 and December 31, 2020, total obligations outstanding under these advance agreements were $0 and $700 million, respectively.
Special Purpose Entity Funding Agreements, Reported in Policyholder Account Balances
We issue fixed and floating rate funding agreements, which are denominated in either U.S. dollars or foreign currencies, to certain unconsolidated special purpose entities that have issued either debt securities or commercial paper for which payment of interest and principal is secured by such funding agreements. For the nine months ended September 30, 2021 and 2020, we issued $32.1 billion and $31.7 billion, respectively, and repaid $31.1 billion and $27.5 billion, respectively, under such funding agreements. At September 30, 2021 and December 31, 2020, total obligations outstanding under these funding agreements were $41.0 billion and $39.9 billion, respectively. See Note 4 of the Notes to the Consolidated Financial Statements included in the 2020 Annual Report.
Federal Agricultural Mortgage Corporation Funding Agreements, Reported in Policyholder Account Balances
We have issued funding agreements to a subsidiary of the Federal Agricultural Mortgage Corporation. The obligations under all such funding agreements are secured by a pledge of certain eligible agricultural mortgage loans. For the nine months ended September 30, 2021 and 2020, we issued $425 million and $250 million, respectively, and repaid $750 million and $425 million, respectively, under such funding agreements. At September 30, 2021 and December 31, 2020, total obligations outstanding under these funding agreements were $2.1 billion and $2.4 billion, respectively. See Note 4 of the Notes to the Consolidated Financial Statements included in the 2020 Annual Report.
Credit and Committed Facilities
At September 30, 2021, we maintained a $3.0 billion unsecured revolving credit facility and certain committed facilities aggregating $3.3 billion, of which MetLife, Inc. is a party and/or guarantor. When drawn upon, these facilities bear interest at varying rates in accordance with the respective agreements.
The unsecured revolving credit facility is used for general corporate purposes, to support the borrowers’ commercial paper programs and for the issuance of letters of credit. At September 30, 2021, we had outstanding $461 million in letters of credit and no drawdowns against this facility. Remaining availability was $2.5 billion at September 30, 2021.
The committed facilities are used as collateral for certain of our affiliated reinsurance liabilities. At September 30, 2021, we had outstanding $2.9 billion in letters of credit and no drawdowns against these facilities. Remaining availability was $410 million at September 30, 2021.
See Note 13 of the Notes to the Consolidated Financial Statements included in the 2020 Annual Report for further information on credit and committed facilities.
We have no reason to believe that our lending counterparties will be unable to fulfill their respective contractual obligations under these facilities. As commitments under our credit and committed facilities may expire unused, these amounts do not necessarily reflect our actual future cash funding requirements.
Outstanding Debt Under Global Funding Sources
The following table summarizes our outstanding debt, excluding long-term debt relating to CSEs, at:
| September 30, 2021 | December 31, 2020 | ||||||||||
| (In millions) | |||||||||||
| Short-term debt (1) | $ | 346 | $ | 393 | |||||||
| Long-term debt (2) | $ | 14,010 | $ | 14,598 | |||||||
| Collateral financing arrangement | $ | 806 | $ | 845 | |||||||
| Junior subordinated debt securities | $ | 3,155 | $ | 3,153 |
(1)Includes $246 million and $293 million of debt that is non-recourse to MetLife, Inc. and MLIC, subject to customary exceptions, at September 30, 2021 and December 31, 2020, respectively. Certain subsidiaries have pledged assets to secure this debt.
(2)Includes $516 million and $474 million of debt that is non-recourse to MetLife, Inc. and MLIC, subject to customary exceptions, at September 30, 2021 and December 31, 2020, respectively. Certain investment subsidiaries have pledged assets to secure this debt.
Debt and Facility Covenants
Certain of our debt instruments and committed facilities, as well as our unsecured revolving credit facility, contain various administrative, reporting, legal and financial covenants. We believe we were in compliance with all applicable financial covenants at September 30, 2021.
Dispositions
For information regarding pending and other dispositions, see Note 3 of the Notes to the Interim Condensed Consolidated Financial Statements.
Liquidity and Capital Uses
In addition to the general description of liquidity and capital uses in “— Summary of the Company’s Primary Sources and Uses of Liquidity and Capital,” the Company’s primary uses of liquidity and capital are set forth below.
Preferred Stock Redemption
See Note 10 of the Notes to the Interim Condensed Consolidated Financial Statements for information about the redemption of Fixed-to-Floating Rate Non-Cumulative Preferred Stock, Series C.
Common Stock Repurchases
See Note 10 of the Notes to the Interim Condensed Consolidated Financial Statements for information relating to authorizations by the Board of Directors to repurchase MetLife, Inc. common stock, amounts of common stock repurchased pursuant to such authorizations for the nine months ended September 30, 2021 and 2020, and the amount remaining under such authorizations at September 30, 2021.
Common stock repurchases are subject to the discretion of our Board of Directors and will depend upon our capital position, liquidity, financial strength and credit ratings, general market conditions, the market price of MetLife, Inc.’s common stock compared to management’s assessment of the stock’s underlying value, applicable regulatory approvals, and other legal and accounting factors. Restrictions on the payment of dividends that may arise under so-called “Dividend Stopper” provisions would also restrict MetLife, Inc.’s ability to repurchase common stock. See “Business — Regulation,” “Risk Factors — Capital Risks — We May not be Able to Pay Dividends or Repurchase Our Stock Due to Legal and Regulatory Restrictions or Cash Buffer Needs” and Note 16 of the Notes to the Consolidated Financial Statements included in the 2020 Annual Report.
Dividends
For the nine months ended September 30, 2021 and 2020, MetLife, Inc. paid dividends on its preferred stock of $166 million and $168 million, respectively. In each of the nine months ended September 30, 2021 and 2020, MetLife, Inc. paid $1.2 billion of dividends on its common stock. See Note 10 of the Notes to the Interim Condensed Consolidated Financial Statements and Note 16 of the Notes to the Consolidated Financial Statements included in the 2020 Annual Report for information regarding the calculation and timing of these dividend payments.
The declaration and payment of common stock dividends are subject to the discretion of our Board of Directors, and will depend on MetLife, Inc.’s financial condition, results of operations, cash requirements, future prospects, regulatory restrictions on the payment of dividends by MetLife, Inc.’s insurance subsidiaries and other factors deemed relevant by the Board of Directors. See Note 16 of the Notes to the Consolidated Financial Statements included in the 2020 Annual Report for additional information.
Dividend Restrictions
The payment of dividends is also subject to restrictions under the terms of our preferred stock and junior subordinated debentures in situations where we may be experiencing financial stress. See “Management’s Discussion and Analysis of Financial Condition and Results of Operations — Liquidity and Capital Resources — The Company — Liquidity and Capital Uses — Dividends — “Dividend Stopper” Provisions in MetLife’s Preferred Stock and Junior Subordinated Debentures,” “Risk Factors — Capital Risks — We May not be Able to Pay Dividends or Repurchase Our Stock Due to Legal and Regulatory Restrictions or Cash Buffer Needs” and Note 16 of the Notes to the Consolidated Financial Statements included in the 2020 Annual Report.
Debt Repayments
For the nine months ended September 30, 2021 and 2020, following regulatory approval, MetLife Reinsurance Company of Charleston, a wholly-owned subsidiary of MetLife, Inc., repurchased and canceled $39 million and $69 million, respectively, in aggregate principal amount of its surplus notes, which were reported in collateral financing arrangement on the consolidated balance sheets.
Debt Repurchases, Redemptions and Exchanges
We may from time to time seek to retire or purchase our outstanding debt through cash purchases, redemptions and/or exchanges for other securities, in open market purchases, privately negotiated transactions or otherwise. Any such repurchases, redemptions, or exchanges will be dependent upon several factors, including our liquidity requirements, contractual restrictions, general market conditions, and applicable regulatory, legal and accounting factors. Whether or not to repurchase or redeem any debt and the size and timing of any such repurchases or redemptions will be determined at our discretion.
See Note 9 of the Notes to the Interim Condensed Consolidated Financial Statements for information about the redemption and cancellation of senior notes.
Support Agreements
MetLife, Inc. and several of its subsidiaries (each, an “Obligor”) are parties to various capital support commitments and guarantees with subsidiaries. Under these arrangements, each Obligor has agreed to cause the applicable entity to meet specified capital and surplus levels or has guaranteed certain contractual obligations. We anticipate that in the event these arrangements place demands upon us, there will be sufficient liquidity and capital to enable us to meet such demands. See Note 5 of the Notes to the MetLife, Inc. (Parent Company Only) Condensed Financial Information included in the 2020 Annual Report.
Insurance Liabilities
Liabilities arising from our insurance activities primarily relate to benefit payments under various life insurance, annuity and group pension products, as well as payments for policy surrenders, withdrawals and loans. For annuity or deposit type products, surrender or lapse behavior differs somewhat by segment. In the MetLife Holdings segment, which includes individual annuities, lapses and surrenders tend to occur in the normal course of business. For the nine months ended September 30, 2021 and 2020, general account surrenders and withdrawals from annuity products were $971 million and $953 million, respectively. In the RIS business within the U.S. segment, which includes pension risk transfers, bank-owned life insurance and other fixed annuity contracts, as well as funding agreements and other capital market products, most of the products offered have fixed maturities or fairly predictable surrenders or withdrawals. With regard to the RIS business products that provide customers with limited rights to accelerate payments, at September 30, 2021 there were funding agreements totaling $122 million that could be put back to the Company.
Pledged Collateral
We pledge collateral to, and have collateral pledged to us by, counterparties in connection with our derivatives. At September 30, 2021 and December 31, 2020, we had received pledged cash collateral from counterparties of $6.9 billion and $7.6 billion, respectively. At September 30, 2021 and December 31, 2020, we had pledged cash collateral to counterparties of $183 million and $266 million, respectively. See Note 7 of the Notes to the Interim Condensed Consolidated Financial Statements for additional information about collateral pledged to us, collateral we pledge and derivatives subject to credit contingent provisions.
We pledge collateral and have had collateral pledged to us, and may be required from time to time to pledge additional collateral or be entitled to have additional collateral pledged to us, in connection with the collateral financing arrangement related to the reinsurance of closed block liabilities.
We pledge collateral from time to time in connection with funding agreements and advance agreements. See Note 6 of the Notes to the Interim Condensed Consolidated Financial Statements, as well as Note 4 of the Notes to the Consolidated Financial Statements included in the 2020 Annual Report.
Securities Lending and Repurchase Agreements
We participate in a securities lending program and in short-term repurchase agreements whereby securities are loaned and sold, respectively, to unaffiliated financial institutions. We obtain collateral, usually cash, from such institutions, which must be returned to the institution when the loaned or sold securities are returned to us. Through these arrangements, we were liable for cash collateral under our control of $24.4 billion and $21.8 billion at September 30, 2021 and December 31, 2020, respectively, including a portion that may require the immediate return of cash collateral we hold. See Note 6 of the Notes to the Interim Condensed Consolidated Financial Statements.
Litigation
We establish liabilities for litigation and regulatory loss contingencies when it is probable that a loss has been incurred and the amount of the loss can be reasonably estimated. For material matters where a loss is believed to be reasonably possible but not probable, no accrual is made but we disclose the nature of the contingency and an aggregate estimate of the reasonably possible range of loss in excess of amounts accrued, when such an estimate can be made. It is not possible to predict the ultimate outcome of all pending investigations and legal proceedings. In some of the matters referred to herein, very large and/or indeterminate amounts, including punitive and treble damages, are sought. Given the large and/or indeterminate amounts sought in certain of these matters and the inherent unpredictability of litigation, it is possible that an adverse outcome in certain matters could, from time to time, have a material adverse effect on our consolidated net income or cash flows in particular quarterly or annual periods. See Note 15 of the Notes to the Interim Condensed Consolidated Financial Statements.
Contractual Obligations
See “Management’s Discussion and Analysis of Financial Condition and Results of Operations — Liquidity and Capital Resources — The Company — Contractual Obligations” included in the 2020 Annual Report for additional information regarding the Company’s contractual obligations.
MetLife, Inc.
Liquidity and Capital Management
Liquidity and capital are managed to preserve stable, reliable and cost-effective sources of cash to meet all current and future financial obligations and are provided by a variety of sources, including a portfolio of liquid assets, a diversified mix of short- and long-term funding sources from the wholesale financial markets and the ability to borrow through credit and committed facilities. Liquidity is monitored through the use of internal liquidity risk metrics, including the composition and level of the liquid asset portfolio, timing differences in short-term cash flow obligations, access to the financial markets for capital and debt transactions and exposure to contingent draws on MetLife, Inc.’s liquidity. MetLife, Inc. is an active participant in the global financial markets through which it obtains a significant amount of funding. These markets, which serve as cost-effective sources of funds, are critical components of MetLife, Inc.’s liquidity and capital management. Decisions to access these markets are based upon relative costs, prospective views of balance sheet growth and a targeted liquidity profile and capital structure. A disruption in the financial markets could limit MetLife, Inc.’s access to liquidity.
MetLife, Inc.’s ability to maintain regular access to competitively priced wholesale funds is fostered by its current credit ratings from the major credit rating agencies. We view our capital ratios, credit quality, stable and diverse earnings streams, diversity of liquidity sources and our liquidity monitoring procedures as critical to retaining such credit ratings. See “Management’s Discussion and Analysis of Financial Condition and Results of Operations — Liquidity and Capital Resources — The Company — Rating Agencies” included in the 2020 Annual Report.
Liquidity
For a summary of MetLife, Inc.’s liquidity, see “— The Company — Liquidity.”
Capital
For a summary of MetLife, Inc.’s capital, see “— The Company — Capital.” See also “— The Company — Liquidity and Capital Uses — Common Stock Repurchases” for information regarding MetLife, Inc.’s common stock repurchases.
Liquid Assets
At September 30, 2021 and December 31, 2020, MetLife, Inc., collectively with other MetLife holding companies, had $5.1 billion and $4.5 billion, respectively, in liquid assets. Of these amounts, $4.4 billion and $3.6 billion were held by MetLife, Inc. and $703 million and $873 million were held by other MetLife holding companies at September 30, 2021 and December 31, 2020, respectively. Liquid assets include cash and cash equivalents, short-term investments and publicly-traded securities, excluding assets that are pledged or otherwise committed. Assets pledged or otherwise committed include amounts received in connection with derivatives and a collateral financing arrangement.
See “Management’s Discussion and Analysis of Financial Condition and Results of Operations — Liquidity and Capital Resources — MetLife, Inc. — Liquid Assets” included in the 2020 Annual Report for additional information on the sources and uses of liquid assets, as well as sources and uses of liquid assets included in free cash flow for MetLife, Inc. and other MetLife holding companies.
Liquidity and Capital Sources
In addition to the description of liquidity and capital sources in “— The Company — Summary of the Company’s Primary Sources and Uses of Liquidity and Capital” and “— The Company — Liquidity and Capital Sources,” MetLife, Inc.’s primary sources of liquidity and capital are set forth below.
Dividends from Subsidiaries
MetLife, Inc. relies, in part, on dividends from its subsidiaries to meet its cash requirements. MetLife, Inc.’s insurance subsidiaries are subject to regulatory restrictions on the payment of dividends imposed by the regulators of their respective domiciles. The dividend limitation for U.S. insurance subsidiaries is generally based on the surplus to policyholders at the end of the immediately preceding calendar year and statutory net gain from operations for the immediately preceding calendar year. Statutory accounting practices, as prescribed by insurance regulators of various states in which we conduct business, differ in certain respects from accounting principles used in financial statements prepared in conformity with GAAP. The significant differences relate to the treatment of DAC, certain deferred income tax, required investment liabilities, statutory reserve calculation assumptions, goodwill and surplus notes.
The table below sets forth the dividends permitted to be paid in 2021 by MetLife, Inc.’s primary U.S. insurance subsidiaries without insurance regulatory approval and the actual dividends paid for the nine months ended September 30, 2021:
| Company | Paid (1) | Permitted Without Approval (2) | ||||||||||||
| (In millions) | ||||||||||||||
| Metropolitan Life Insurance Company | $ | 2,193 | $ | 3,392 | ||||||||||
| American Life Insurance Company | $ | 600 | $ | 800 | ||||||||||
| Metropolitan Property and Casualty Insurance Company (3) | $ | 35 | $ | 222 | ||||||||||
| Metropolitan Tower Life Insurance Company | $ | — | $ | 82 |
(1)Reflects all amounts paid, including those where regulatory approval was obtained as required.
(2)Reflects dividend amounts that may be paid during 2021 without prior regulatory approval. However, because dividend tests may be based on dividends previously paid over rolling 12-month periods, if paid before a specified date during 2021, some or all of such dividends may require regulatory approval.
(3)Metropolitan Property and Casualty Insurance Company paid a $35 million non-cash dividend consisting of the stock of a subsidiary. See Note 3 of the Notes to the Interim Condensed Consolidated Financial Statements for information on the disposition of MetLife P&C.
In addition to the amounts presented in the table above, for the nine months ended September 30, 2021, MetLife, Inc. also received from certain other subsidiaries cash dividends of $109 million, as well as cash returns of capital of $13 million.
The dividend capacity of our non-U.S. operations is subject to similar restrictions established by the local regulators. The non-U.S. regulatory regimes also commonly limit dividend payments to the parent company to a portion of the subsidiary’s prior year statutory income, as determined by the local accounting principles. The regulators of our non-U.S. operations, including Japan’s Financial Services Agency, may also limit or not permit profit repatriations or other transfers of funds to the U.S. if such transfers are deemed to be detrimental to the solvency or financial strength of the non-U.S. operations, or for other reasons. Most of our non-U.S. subsidiaries are second tier subsidiaries which are owned by various non-U.S. holding companies. The capital and rating considerations applicable to our first tier subsidiaries may also impact the dividend flow into MetLife, Inc.
We proactively manage target and excess capital levels and dividend flows and forecast local capital positions as part of the financial planning cycle. The dividend capacity of certain U.S. and non-U.S. subsidiaries is also subject to business targets in excess of the minimum capital necessary to maintain the desired rating or level of financial strength in the relevant market. See “Risk Factors — Capital Risks — Our Subsidiaries May be Unable to Pay Dividends, a Major Component of Holding Company Free Cash Flow” and Note 16 of the Notes to the Consolidated Financial Statements included in the 2020 Annual Report.
Credit and Committed Facilities
See “— The Company — Liquidity and Capital Sources — Global Funding Sources — Credit and Committed Facilities” for further information regarding the Company’s unsecured revolving credit facility and certain committed facilities.
Long-term Debt Outstanding
The following table summarizes the outstanding long-term debt of MetLife, Inc. at:
| September 30, 2021 | December 31, 2020 | ||||||||||
| (In millions) | |||||||||||
| Long-term debt — unaffiliated | $ | 12,852 | $ | 13,463 | |||||||
| Long-term debt — affiliated (1) | $ | 1,937 | $ | 2,073 | |||||||
| Junior subordinated debt securities | $ | 2,463 | $ | 2,461 |
(1)In July 2021, ¥53.7 billion 2.9725% senior unsecured notes issued to various subsidiaries matured and were refinanced with the following senior unsecured notes issued to various subsidiaries: (i) ¥13.7 billion 1.610% due July 2026, (ii) ¥14.3 billion 1.755% due July 2028 and (iii) ¥25.7 billion 1.852% due July 2031.
Debt and Facility Covenants
Certain of MetLife, Inc.’s debt instruments and committed facilities, as well as its unsecured revolving credit facility, contain various administrative, reporting, legal and financial covenants. MetLife, Inc. believes it was in compliance with all applicable financial covenants at September 30, 2021.
Dispositions
For information on the disposition of MetLife P&C, see Note 3 of the Notes to the Interim Condensed Consolidated Financial Statements.
Liquidity and Capital Uses
The primary uses of liquidity of MetLife, Inc. include debt service, cash dividends on common and preferred stock, capital contributions to subsidiaries, common stock, preferred stock and debt repurchases, payment of general operating expenses and acquisitions. Based on our analysis and comparison of our current and future cash inflows from the dividends we receive from subsidiaries that are permitted to be paid without prior insurance regulatory approval, our investment portfolio and other cash flows and anticipated access to the capital markets, we believe there will be sufficient liquidity and capital to enable MetLife, Inc. to make payments on debt, pay cash dividends on its common and preferred stock, contribute capital to its subsidiaries, repurchase its common stock and certain of its other securities, pay all general operating expenses and meet its cash needs under current market conditions and reasonably possible stress scenarios.
In addition to the description of liquidity and capital uses in “— The Company — Liquidity and Capital Uses,” MetLife, Inc.’s primary uses of liquidity and capital are set forth below.
Affiliated Capital and Debt Transactions
For the nine months ended September 30, 2021 and 2020, MetLife, Inc. invested a net amount of $118 million and $177 million, respectively, in various subsidiaries.
MetLife, Inc. lends funds, as necessary, through credit agreements or otherwise to its subsidiaries and affiliates, some of which are regulated, to meet their capital requirements or to provide liquidity. MetLife, Inc. had no outstanding loans to subsidiaries at both September 30, 2021 and December 31, 2020.
Support Agreements
MetLife, Inc. is party to various capital support commitments and guarantees with certain of its subsidiaries. Under these arrangements, MetLife, Inc. has agreed to cause each such entity to meet specified capital and surplus levels or has guaranteed certain contractual obligations. See “— The Company — Liquidity and Capital Uses — Support Agreements.”
Adoption of New Accounting Pronouncements
See Note 1 of the Notes to the Interim Condensed Consolidated Financial Statements.
Future Adoption of New Accounting Pronouncements
See Note 1 of the Notes to the Interim Condensed Consolidated Financial Statements.
Non-GAAP and Other Financial Disclosures
In this report, the Company presents certain measures of its performance on a consolidated and segment basis that are not calculated in accordance with GAAP. We believe that these non-GAAP financial measures enhance the understanding for the Company and our investors of our performance by highlighting the results of operations and the underlying profitability drivers of our business. Segment-specific financial measures are calculated using only the portion of consolidated results attributable to that specific segment.
The following non-GAAP financial measures should not be viewed as substitutes for the most directly comparable financial measures calculated in accordance with GAAP:
| Non-GAAP financial measures: | Comparable GAAP financial measures: | ||||||||||
| (i) | adjusted premiums, fees and other revenues | (i) | premiums, fees and other revenues | ||||||||
| (ii) | adjusted earnings | (ii) | net income (loss) | ||||||||
| (iii) | adjusted earnings available to common shareholders | (iii) | net income (loss) available to MetLife, Inc.’s common shareholders | ||||||||
| (iv) | adjusted net investment income | (iv) | net investment income |
Any of these financial measures shown on a constant currency basis reflect the impact of changes in foreign currency exchange rates and are calculated using the average foreign currency exchange rates for the most recent period and applied to the comparable prior period (“constant currency basis”).
Reconciliations of these non-GAAP financial measures to the most directly comparable historical GAAP financial measures are included in “— Results of Operations” and “— Investments.” Reconciliations of these non-GAAP measures to the most directly comparable GAAP measures are not accessible on a forward-looking basis because we believe it is not possible without unreasonable effort to provide other than a range of net investment gains and losses and net derivative gains and losses, which can fluctuate significantly within or outside the range and from period to period and may have a material impact on net income.
Our definitions of non-GAAP and other financial measures discussed in this report may differ from those used by other companies.
Adjusted earnings and related measures:
-
adjusted earnings;
-
adjusted earnings available to common shareholders; and
-
adjusted earnings available to common shareholders on a constant currency basis.
These measures are used by management to evaluate performance and allocate resources. Consistent with GAAP guidance for segment reporting, adjusted earnings and components of, or other financial measures based on, adjusted earnings are also our GAAP measures of segment performance. Adjusted earnings and other financial measures based on adjusted earnings are also the measures by which senior management’s and many other employees’ performance is evaluated for the purposes of determining their compensation under applicable compensation plans. Adjusted earnings and other financial measures based on adjusted earnings allow analysis of our performance relative to our business plan and facilitate comparisons to industry results.
Adjusted earnings is defined as adjusted revenues less adjusted expenses, net of income tax. Adjusted loss is defined as negative adjusted earnings. Adjusted earnings available to common shareholders is defined as adjusted earnings less preferred stock dividends. For information relating to adjusted revenues and adjusted expenses, see “Financial Measures and Segment Accounting Policies” in Note 2 of the Notes to the Interim Condensed Consolidated Financial Statements.
In addition, adjusted earnings available to common shareholders excludes the impact of preferred stock redemption premium, which is reported as a reduction to net income (loss) available to MetLife, Inc.’s common shareholders.
Return on equity, allocated equity and related measures:
-
Total MetLife, Inc.’s common stockholders’ equity, excluding accumulated other comprehensive income (“AOCI”) other than foreign currency translation adjustments (“FCTA”), is defined as total MetLife, Inc.’s common stockholders’ equity, excluding the net unrealized investment gains (losses) and defined benefit plans adjustment components of AOCI, net of income tax.
-
Adjusted return on MetLife, Inc.’s common stockholders’ equity is defined as adjusted earnings available to common shareholders divided by MetLife, Inc.’s average common stockholders’ equity.
-
Adjusted return on MetLife, Inc.’s common stockholders’ equity, excluding AOCI other than FCTA, is defined as adjusted earnings available to common shareholders divided by MetLife, Inc.’s average common stockholders’ equity, excluding AOCI other than FCTA.
-
Allocated equity is the portion of MetLife, Inc.’s common stockholders’ equity that management allocates to each of its segments and sub-segments based on local capital requirements and economic capital. See “— Economic Capital.” Allocated equity excludes the impact of AOCI other than FCTA.
The above measures represent a level of equity consistent with the view that, in the ordinary course of business, we do not plan to sell most investments for the sole purpose of realizing gains or losses.
Expense ratio and direct expense ratio:
-
Expense ratio: other expenses, net of capitalization of DAC, divided by premiums, fees and other revenues.
-
Direct expense ratio: adjusted direct expenses divided by adjusted premiums, fees and other revenues. Direct expenses are comprised of employee-related costs, third party staffing costs, and general and administrative expenses.
-
Direct expense ratio, excluding total notable items related to direct expenses and pension risk transfers: adjusted direct expenses excluding total notable items related to direct expenses, divided by adjusted premiums, fees and other revenues, excluding pension risk transfers.
The following additional information is relevant to an understanding of our performance results:
-
We sometimes refer to sales activity for various products. These sales statistics do not correspond to revenues under GAAP, but are used as relevant measures of business activity. Further, sales statistics for our Latin America, Asia and EMEA segments are on a constant currency basis.
-
Near-term represents one to three years.
-
Notable items reflect the unexpected impact of events that affect the Company’s results, but that were unknown and that the Company could not anticipate when it devised its business plan. Notable items also include certain items regardless of the extent anticipated in the business plan, to help investors have a better understanding of MetLife’s results and to evaluate and forecast those results. Notable items represent a positive (negative) impact to adjusted earnings available to common shareholders.
-
The Company uses a measure of free cash flow to facilitate an understanding of its ability to generate cash for reinvestment into its businesses or use in non-mandatory capital actions. The Company defines free cash flow as the sum of cash available at MetLife’s holding companies from dividends from operating subsidiaries, expenses and other net flows of the holding companies (including capital contributions to subsidiaries), and net contributions from debt to be at or below target leverage ratios. This measure of free cash flow is prior to capital actions, such as common stock dividends and repurchases, debt reduction and mergers and acquisitions. Free cash flow should not be viewed as a substitute for net cash provided by (used in) operating activities calculated in accordance with GAAP. The free cash flow ratio is typically expressed as a percentage of annual adjusted earnings available to common shareholders.
Previous: Item 1. Financial Statements · Next: Item 3. Quantitative and Qualitative Disclosures About Market Risk