 filings.tools
Item 2. Management's Discussion and Analysis of Financial Condition and Results of Operations
64K characters. Original on sec.gov · Markdown
Item 2. Management's Discussion and Analysis of Financial Condition and Results of Operations
You should read the following discussion of our financial condition and results of operations in conjunction with our condensed consolidated financial statements and the related notes included elsewhere in this Quarterly Report on Form 10-Q and with our audited consolidated financial statements included in our Annual Report on Form 10-K for the year ended December 31, 2024, as filed with the Securities and Exchange Commission. In addition to our historical condensed consolidated financial information, the following discussion contains forward-looking statements that reflect our plans, estimates, and beliefs. Our actual results could differ materially from those discussed in the forward-looking statements. Factors that could cause or contribute to these differences include those discussed below and elsewhere in this Quarterly Report on Form 10-Q, particularly in Part II, Item 1A, "Risk Factors." For a discussion of limitations in the measurement of our Family metrics, see the section entitled "Limitations of Key Metrics and Other Data" in this Quarterly Report on Form 10-Q.
To supplement our condensed consolidated financial statements, which are prepared and presented in accordance with generally accepted accounting principles in the United States (GAAP), we present revenue on a constant currency basis, which is a non-GAAP financial measure. Revenue on a constant currency basis is presented in the section entitled "—Revenue—Foreign Exchange Impact on Revenue." To calculate revenue on a constant currency basis, we translated revenue for the three months ended March 31, 2025 using the prior year's monthly exchange rates for our settlement or billing currencies other than the U.S. dollar.
This non-GAAP financial measure is not intended to be considered in isolation or as a substitute for, or superior to, financial information prepared and presented in accordance with GAAP. This measure may be different from non-GAAP financial measures used by other companies, limiting its usefulness for comparison purposes. Moreover, presentation of revenue on a constant currency basis is provided for year-over-year comparison purposes, and investors should be cautioned that the effect of changing foreign currency exchange rates has an actual effect on our operating results. We believe this non-GAAP financial measure provides investors with useful supplemental information about the financial performance of our business, enables comparison of financial results between periods where certain items may vary independent of business performance, and allows for greater transparency with respect to key metrics used by management in operating our business.
Executive Overview of First Quarter Results
Our mission is to build the future of human connection and the technology that makes it possible.
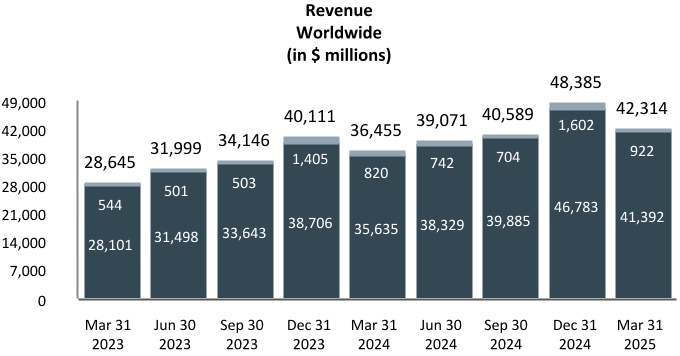
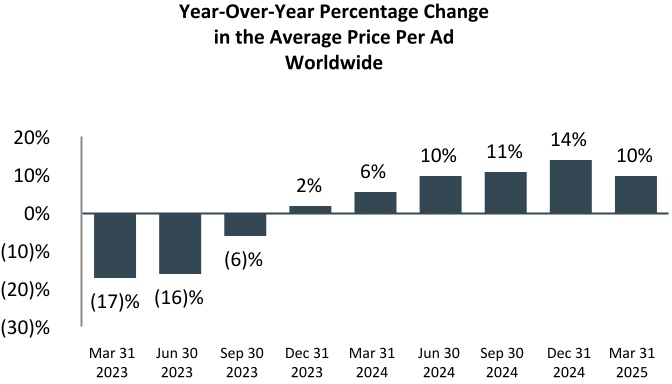
Our financial results and key Family metrics for the first quarter of 2025 are set forth below. Total revenue for the first quarter of 2025 was $42.31 billion, an increase of 16% compared to the first quarter of 2024, due to an increase in advertising revenue. Revenue on a constant currency basis would have increased 19% compared to the first quarter of 2024. Ad impressions delivered across our Family of Apps in the first quarter of 2025 increased 5% year-over-year, and our average price per ad in the first quarter of 2025 increased 10% year-over-year.
Income from operations for the first quarter of 2025 was $17.56 billion, an increase of $3.74 billion, or 27%, compared to the first quarter of 2024, driven by an increase in advertising revenue, partially offset by an increase in costs and expenses. The increase in costs and expenses was primarily due to increases in employee compensation and infrastructure costs, partially offset by lower legal-related costs.
Consolidated and Segment Results
We report our financial results for our two reportable segments: Family of Apps (FoA) and Reality Labs (RL). FoA includes Facebook, Instagram, Messenger, WhatsApp, and other services. RL includes our virtual, augmented, and mixed reality related consumer hardware, software, and content.
| Family of Apps | Reality Labs | Total | |||||||||||||||||||||||||||||||||||||||||||||||||||||||||||||||||||||
| Three Months Ended March 31, | % change | Three Months Ended March 31, | % change | Three Months Ended March 31, | % change | ||||||||||||||||||||||||||||||||||||||||||||||||||||||||||||||||||
| 2025 | 2024 | 2025 | 2024 | 2025 | 2024 | ||||||||||||||||||||||||||||||||||||||||||||||||||||||||||||||||||
| (in millions, except percentages) | |||||||||||||||||||||||||||||||||||||||||||||||||||||||||||||||||||||||
| Revenue | $ | 41,902 | $ | 36,015 | 16% | $ | 412 | $ | 440 | (6)% | $ | 42,314 | $ | 36,455 | 16% | ||||||||||||||||||||||||||||||||||||||||||||||||||||||||
| Costs and expenses | 20,137 | 18,351 | 10% | 4,622 | 4,286 | 8% | 24,759 | 22,637 | 9% | ||||||||||||||||||||||||||||||||||||||||||||||||||||||||||||||
| Income (loss) from operations | $ | 21,765 | $ | 17,664 | 23% | $ | (4,210) | $ | (3,846) | (9)% | $ | 17,555 | $ | 13,818 | 27% | ||||||||||||||||||||||||||||||||||||||||||||||||||||||||
| Operating margin | 52 | % | 49 | % | (1,022) | % | (874) | % | 41 | % | 38 | % |
*•*Net income was $16.64 billion, with diluted earnings per share (EPS) of $6.43 for the three months ended March 31, 2025.
*•*Capital expenditures, including principal payments on finance leases, were $13.69 billion for the three months ended March 31, 2025.
*•*Share repurchases of our Class A common stock were $13.40 billion and total dividend and dividend equivalent payments were $1.33 billion for the three months ended March 31, 2025.
*•*Cash, cash equivalents, and marketable securities were $70.23 billion as of March 31, 2025.
*•*Effective tax rate was 9% for the three months ended March 31, 2025.
- Headcount was 76,834 as of March 31, 2025, an increase of 11% year-over-year.
Family of Apps Metrics
-
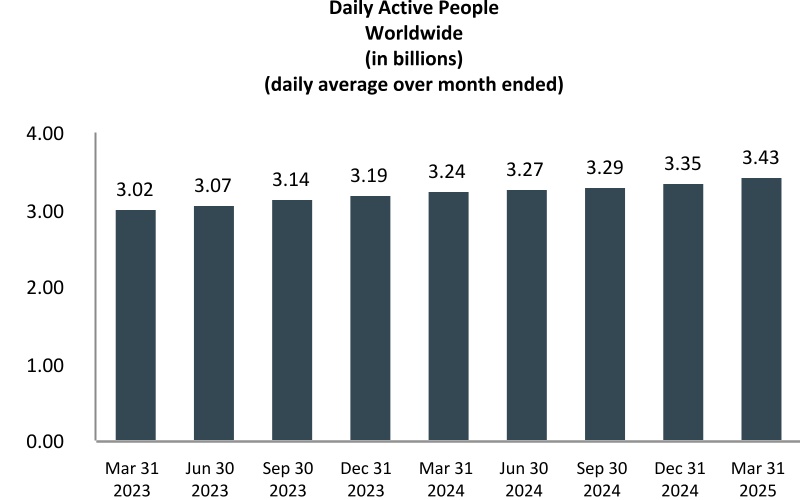
Family daily active people (DAP) was 3.43 billion on average for March 2025, an increase of 6% year-over-year.
-
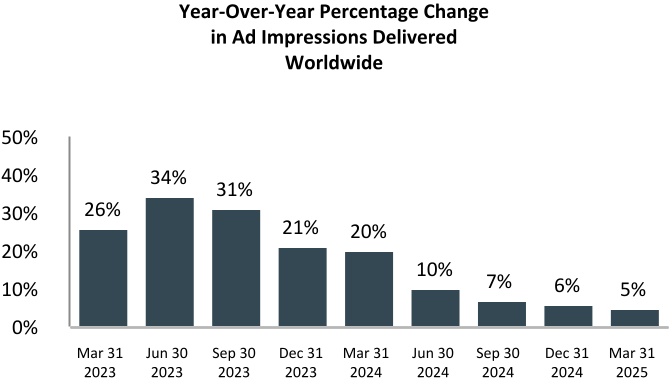
Ad impressions delivered across our Family of Apps in the first quarter of 2025 increased by 5% year-over-year.
-
Average price per ad in the first quarter of 2025 increased by 10% year-over-year.
Developments in Advertising
Substantially all of our revenue is currently generated from advertising on Facebook and Instagram. We rely on targeting and measurement tools that incorporate data signals from user activity on websites and services that we do not control, as well as signals generated within our products, in order to deliver relevant and effective ads to our users. Our advertising revenue has been, and we expect will continue to be, adversely affected by reduced marketer spending as a result of limitations on our ad targeting and measurement tools arising from changes to the regulatory environment and third-party mobile operating systems and browsers.
In particular, legislative and regulatory developments such as the General Data Protection Regulation, including its evolving interpretation through decisions of the Court of Justice of the European Union, ePrivacy Directive, European Digital Services Act, Digital Markets Act, and U.S. state privacy laws including the California Consumer Privacy Act, as amended by the California Privacy Rights Act, have impacted our ability to use data signals in our ad products, and an increasing number of laws have been introduced limiting or prohibiting the provision of our services to younger users. We expect these and other developments will have further impact in the future. As a result, we have implemented, and we will continue to implement, whether voluntarily or otherwise, changes to our products and user data practices, which reduce our ability to effectively target and measure ads and may negatively impact our advertising revenue and user engagement. For example, in response to regulatory developments in Europe, we announced our plans to change the legal basis for behavioral advertising on Facebook and Instagram in the European Union, European Economic Area, and Switzerland from "legitimate interests" to "consent," and began offering users in the region a "subscription for no ads" alternative. We subsequently began offering users in the region who elect to continue using our services free-of-charge, supported by ads, an option to see less personalized ads, which are less relevant and effective than our premium ad offerings. We are engaging with regulators on
our consent model. In addition, mobile operating system and browser providers, such as Apple and Google, have implemented product changes and/or announced future plans to limit the ability of websites and application developers to collect and use these signals to target and measure advertising. For example, in 2021, Apple made certain changes to its products and data use policies in connection with changes to its iOS operating system that reduce our and other iOS developers' ability to target and measure advertising, which has negatively impacted, and we expect will continue to negatively impact, the size of the budgets marketers are willing to commit to us and other advertising platforms.
To mitigate these developments, we are continually working to evolve our advertising systems to improve the performance of our ad products. We are developing privacy enhancing technologies to deliver relevant ads and measurement capabilities while reducing the amount of personal information we process, including by relying more on anonymized or aggregated third-party data. In addition, we are developing tools that enable marketers to share their data into our systems, as well as ad products that generate more valuable signals within our apps. More broadly, we also continue to innovate our advertising tools to help marketers prepare campaigns and connect with consumers, including developing growing formats such as Reels ads and our business messaging ad products. Across all of these efforts, we are making significant investments in artificial intelligence (AI), including generative AI, to improve our delivery, targeting, and measurement capabilities. Further, we are focused on driving onsite conversions in our business messaging ad products by developing new features and scaling existing features.
We are also engaging with others across our industry to explore the possibility of new open standards for the private and secure processing of data for advertising purposes. We believe our ongoing improvements to ad targeting and measurement are continuing to drive improved results for advertisers. However, we expect that some of these efforts will be long-term initiatives, and that the legislative, regulatory and platform developments described above will continue to adversely impact our advertising revenue for the foreseeable future.
In addition, we maintain advertising policies to protect the security and integrity of our platform and comply with global content, security, and integrity obligations. Our ongoing efforts to enhance enforcement against ads and marketers which violate our advertising policies adversely affect our revenue, and we expect that the continued enhancement of such efforts will have an impact on our revenue in the future, which may be material.
Other Business and Macroeconomic Conditions
Other global and regional business, macroeconomic, and geopolitical conditions also have had, and we believe will continue to have, an impact on our user growth and engagement and advertising revenue. In particular, we believe advertising budgets have been pressured from time to time by factors such as inflation, economic policies and international trade, high interest rates, and related market uncertainty, which has led to reduced marketer spending. We are currently subject to increased business, macroeconomic, and geopolitical uncertainty, including as a result of volatility around international trade, which could impact our financial results in future periods.
In addition, competitive products and services have reduced some users' engagement with our products and services. We are investing in Reels and in AI initiatives across our products, including our AI-powered discovery engine to recommend relevant content, which we have already seen results in improved user engagement and monetization of our products. However, we continue to face competition from other products and services within certain demographics, in particular younger users. In addition, while Reels is growing in usage, it monetizes at a lower rate than our Feed and Stories products and we expect it will continue to monetize at a lower rate for the foreseeable future. We also have seen fluctuations and declines in the size of our active user base in one or more regions from time to time due to geopolitical conditions, which have adversely affected our user growth and engagement. These trends have adversely affected our advertising revenue and we expect will continue to adversely affect our advertising revenue in the foreseeable future.
Although we regularly evaluate a variety of sources to understand trends in our advertising revenue, we do not have perfect visibility into the factors driving advertiser spending decisions and our assessments involve complex judgments about what is driving advertising decisions across a large and diversified advertiser base across the globe. Trends impacting advertising spend are also dynamic and interrelated. As a result, it is difficult to identify with precision which advertiser spending decisions are attributable to which trends, and we are unable to quantify the exact impact that each trend had on our advertising revenue during the periods presented.
Investment Philosophy
We remain focused on operating efficiently while investing in significant opportunities. In the three months ended March 31, 2025, 81% of our total costs and expenses were recognized in FoA and 19% were recognized in RL. Our FoA investments include expenses relating to headcount, data centers, and technical infrastructure as part of our efforts to develop our apps and our advertising services. These efforts include significant investments in AI initiatives, including to recommend relevant content across our products, enhance our advertising tools, develop new products, and develop new features for existing products using generative AI. In particular, we expect our AI initiatives will require increased investment in infrastructure and headcount.
We are also making significant investments in our metaverse and wearables efforts, including developing virtual, augmented, and mixed reality devices, software for social platforms, neural interfaces, and other foundational technologies. Our RL investments include expenses relating to technology development across these efforts. Many of our RL investments are directed toward long-term, cutting-edge research and development for products that may only be fully realized in the next decade. During the three months ended March 31, 2025, our RL segment reduced our overall operating profit by approximately $4.21 billion, and we continue to expect our full-year RL operating losses to increase in 2025. We expect this will be a complex, evolving, and long-term initiative, and our ability to support our RL efforts is dependent on generating sufficient profits from other areas of our business. We are investing now because we believe this will become the next computing platform and will unlock monetization opportunities for businesses, developers, and creators, including around advertising, hardware, and digital goods.
Trends in Our Revenue by User Geography
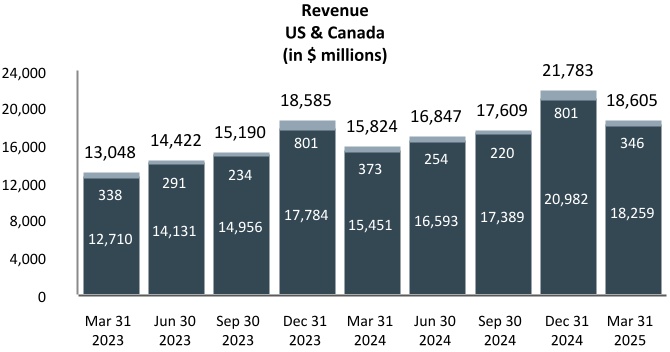
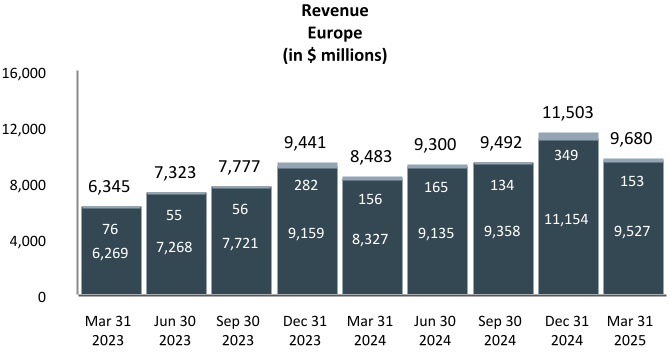
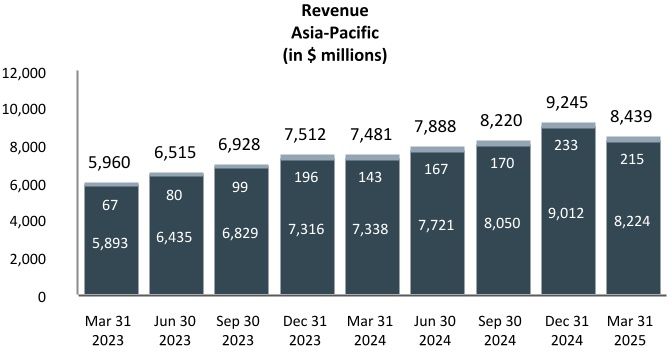
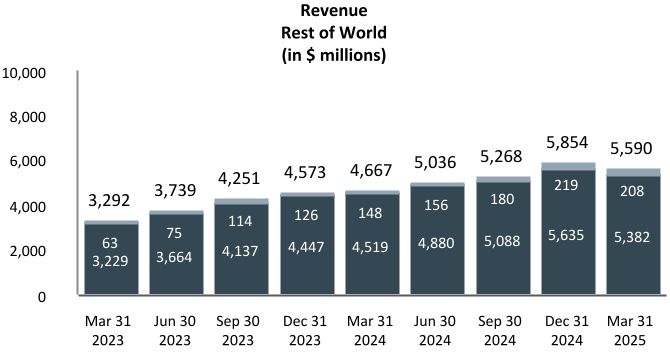
We calculate our revenue by user geography based on our estimate of the geography in which ad impressions are delivered, virtual and digital goods are purchased, or consumer hardware products are shipped. The geography of our users affects our revenue and financial results. Our revenue in regions such as United States & Canada and Europe is relatively higher primarily due to the size and maturity of those online and mobile advertising markets, and ad impression growth is mainly in geographies that monetize at lower rates, such as Asia-Pacific. In the first quarter of 2025, revenue increased by 18% in United States & Canada, 14% in Europe, 13% in Asia-Pacific, and 20% in Rest of World, in each case relative to the same period in 2024.
 -
-
 | Ad Revenue |  | Non-Ad Revenue |
Note: Non-advertising revenue includes RL revenue generated from the delivery of consumer hardware products and FoA Other revenue, which consists of revenue from WhatsApp Business Platform, Meta Verified subscriptions, net fees we receive from developers using our Payments infrastructure, and revenue from various other sources.
Our revenue by user geography in the charts above is geographically apportioned based on our estimation of the geographic location of our users when they perform a revenue-generating activity. This allocation differs from our revenue disaggregated by geography disclosure in Note 2 — Revenue in our condensed consolidated financial statements included in Part I, Item 1, "Financial Statements" where revenue is geographically apportioned based on the addresses of our customers.
Trends in Our Family Metrics
The numbers for our key Family metrics, our DAP and average revenue per person (ARPP), do not include users on our other products unless they would otherwise qualify as DAP based on their other activities on our Family products.
Trends in the number of people in our community affect our revenue and financial results by influencing the number of ads we are able to show, the value of our ads to marketers, as well as our expenses and capital expenditures. Substantially all of our daily active people (as defined below) access our Family products on mobile devices.
- Daily Active People (DAP). We define a daily active person as a registered and logged-in user of Facebook, Instagram, Messenger, and/or WhatsApp (collectively, our "Family" of products) who visited at least one of these Family products through a mobile device application or using a web or mobile browser on a given day. We do not require people to use a common identifier or link their accounts to use multiple products in our Family, and therefore must seek to attribute multiple user accounts within and across products to individual people. Our calculations of DAP rely upon complex techniques, algorithms, and machine learning models that seek to estimate the underlying number of unique people using one or more of these products, including by matching user accounts within an individual product and across multiple products when we believe they are attributable to a single person, and counting such group of accounts as one person. As these techniques and models require significant judgment, are developed based on internal reviews of limited samples of user accounts, and are calibrated against user survey data, there is necessarily some margin of error in our estimates. We view DAP as a measure of engagement across our products. For additional information, see the section entitled "Limitations of Key Metrics and Other Data" in this Quarterly Report on Form 10-Q.
--
Note: We report the numbers of DAP as specific amounts, but these numbers are estimates of the numbers of unique people using our products and are subject to statistical variances and errors. While we expect the error margin for these estimates to vary from period to period, we estimate that such margin generally will be approximately 3% of our worldwide DAP. At our scale, it is very difficult to attribute multiple user accounts within and across products to individual people, and it is possible that the actual numbers of unique people using our products may vary significantly from our estimates, potentially beyond our estimated error margins. For additional information, see the section entitled "Limitations of Key Metrics and Other Data" in this Quarterly Report on Form 10-Q. Beginning in the fourth quarter of 2023, our Family metrics no longer include Messenger Kids users.
Worldwide DAP increased 6% to 3.43 billion on average during March 2025 from 3.24 billion during March 2024.
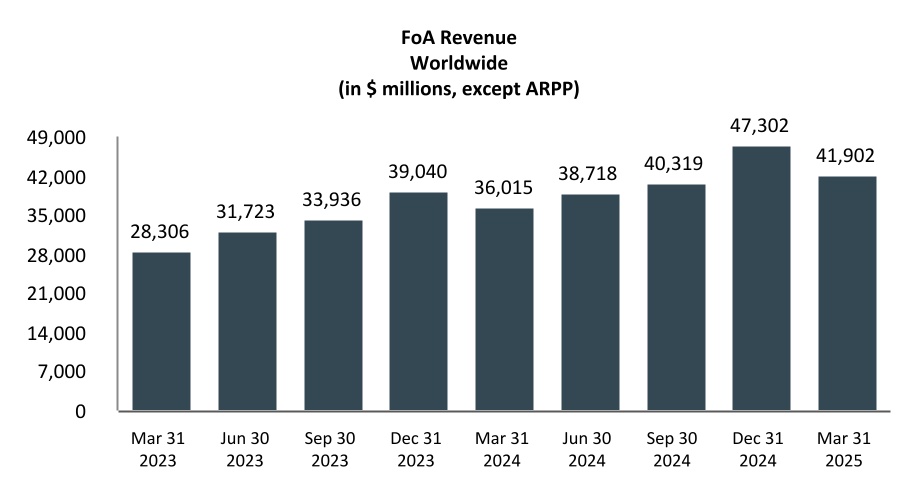
- Average Revenue Per Person (ARPP). Our Family of Apps (FoA) revenue represents the substantial majority of our total revenue. We define ARPP as our FoA revenue during a given quarter, divided by the average of the number of DAP at the beginning and end of the quarter.
| ARPP: | $9.47 | $10.42 | $10.93 | $12.33 | $11.20 | $11.89 | $12.29 | $14.25 | $12.36 |
Note: We updated our definition of ARPP beginning in the first quarter of 2024 and have recast ARPP in prior periods for comparative purposes.
During the first quarter of 2025, worldwide ARPP was $12.36, an increase of 10% from the first quarter of 2024.
Trends in Our Ad Impressions and Average Price Per Ad
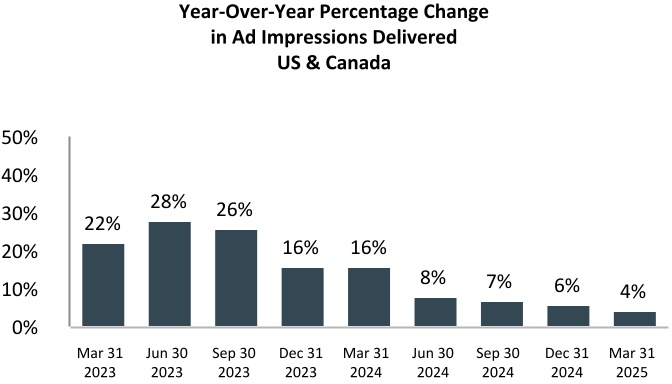
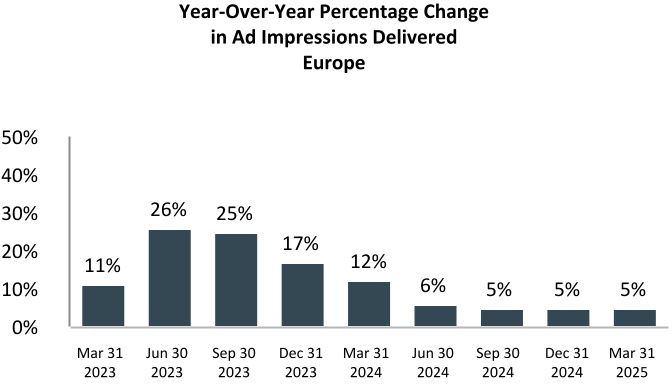
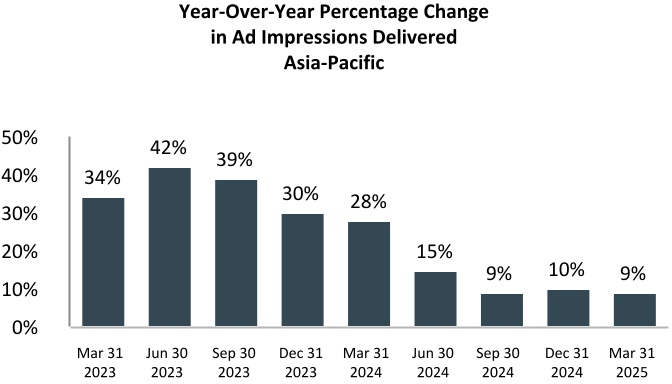
- Ad Impressions. Our advertising revenue is generated by displaying ad products on Facebook, Instagram, Messenger, and third-party mobile applications. Impressions are considered delivered when an ad is displayed to a user.
 _
_
 _
_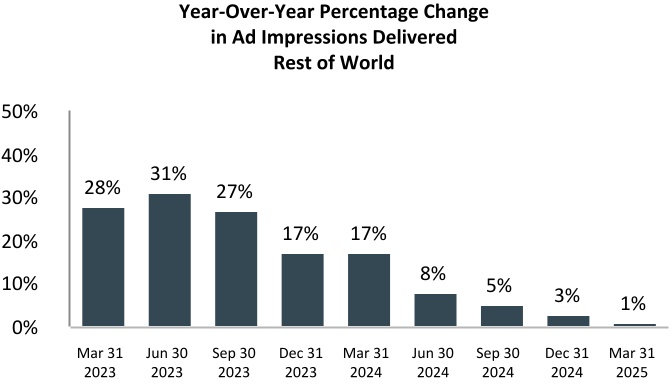
Note: Our ad impressions growth by user geography in the charts above is geographically apportioned based on our estimation of the geographic location of our users when an ad impression is delivered.
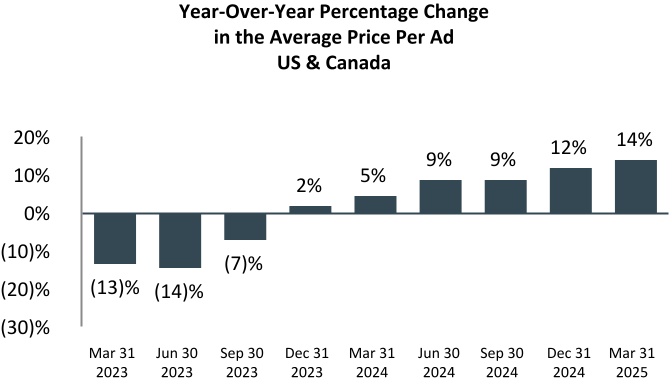
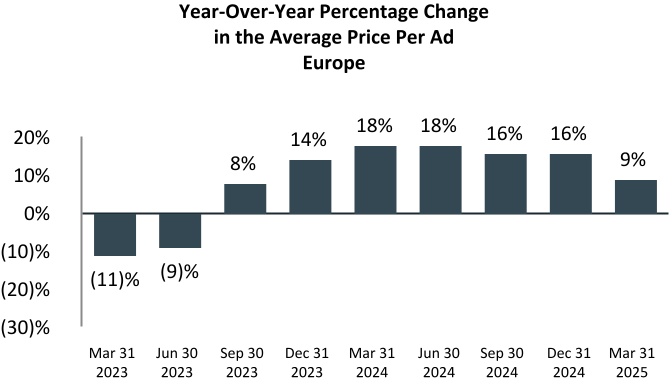
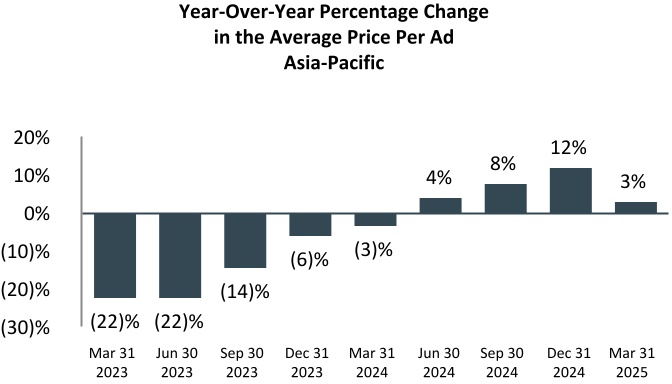
- Average Price Per Ad. We calculate average price per ad as total advertising revenue divided by the number of ads delivered.
 _
_
 _
_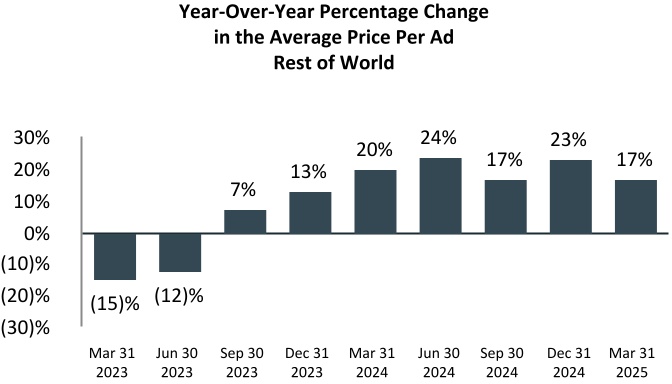
Note: Our average price per ad growth by user geography in the charts above is geographically apportioned based on our estimation of the geographic location of our users when an ad impression is delivered.
Components of Results of Operations
Revenue
Family of Apps (FoA)
Advertising**.** We generate substantially all of our revenue from advertising. Our advertising revenue is generated by displaying ad products on Facebook, Instagram, Messenger, and third-party mobile applications. Marketers pay for ad products either directly or through their relationships with advertising agencies or resellers, based on the number of impressions delivered or the number of actions, such as clicks, taken by users.
We recognize revenue from the display of impression-based ads in the contracted period in which the impressions are delivered. Impressions are considered delivered when an ad is displayed to a user. We recognize revenue from the delivery of action-based ads in the period in which a user takes the action the marketer contracted for. The number of ads we show is subject to methodological changes as we continue to evolve our ads business and the structure of our ads products. In particular, the ads we show may vary by product (for example, our video and Reels products are not currently monetized at the same rate as our Feed or Stories products), and from time to time we increase or decrease the number or frequency of ads we show as part of our product and monetization strategies. We calculate average price per ad as total advertising revenue divided by the number of ads delivered, representing the average price paid per ad by a marketer regardless of their desired objective such as impression or action. For advertising revenue arrangements where we are not the principal, we recognize revenue on a net basis.
Other revenue**.** Other revenue consists of revenue from WhatsApp Business Platform, Meta Verified subscriptions, net fees we receive from developers using our Payments infrastructure, and revenue from various other sources.
Reality Labs (RL)
RL revenue is generated from the delivery of consumer hardware products, such as Meta Quest and Ray-Ban Meta AI glasses, and related software and content.
Cost of Revenue and Operating Expenses
Cost of revenue. Our cost of revenue consists of expenses associated with the delivery and distribution of our products. These mainly include expenses related to the operation of our data centers and technical infrastructure, such as depreciation expense from servers, network infrastructure and buildings, employee compensation which includes payroll, share-based compensation and benefits for employees on our operations teams, and energy and bandwidth costs. Cost of revenue also consists of costs associated with partner arrangements, including traffic acquisition costs and credit card and other fees related to processing customer transactions; RL inventory costs, which consist of cost of products sold and estimated losses on non-cancelable contractual commitments; and content costs.
Research and development. Research and development expenses consist mostly of employee compensation which includes payroll, share-based compensation and benefits for our employees on our engineering and technical teams who are responsible for developing new technologies and products; RL technology development costs; infrastructure costs; and facilities-related costs.
Marketing and sales. Marketing and sales expenses consist primarily of employee compensation which includes payroll, share-based compensation and benefits for our employees engaged in sales, sales support, marketing, business development, and customer service functions; marketing and promotional expenses; and professional services to support our community and product operations.
General and administrative. General and administrative expenses consist primarily of employee compensation which includes payroll, share-based compensation and benefits for certain of our executives as well as our legal, finance, human resources, corporate communications and policy, and other administrative employees; legal-related costs, which include estimated fines, settlements, or other losses in connection with legal and related matters, as well as other legal fees; other taxes, such as digital services taxes and other non-income-based tax levies; and professional services.
Results of Operations
The following table sets forth our condensed consolidated statements of income data (in millions):
| Three Months Ended March 31, | |||||||||||||||||||||||
| 2025 | 2024 | ||||||||||||||||||||||
| Revenue | $ | 42,314 | $ | 36,455 | |||||||||||||||||||
| Costs and expenses: | |||||||||||||||||||||||
| Cost of revenue | 7,572 | 6,640 | |||||||||||||||||||||
| Research and development | 12,150 | 9,978 | |||||||||||||||||||||
| Marketing and sales | 2,757 | 2,564 | |||||||||||||||||||||
| General and administrative | 2,280 | 3,455 | |||||||||||||||||||||
| Total costs and expenses | 24,759 | 22,637 | |||||||||||||||||||||
| Income from operations | 17,555 | 13,818 | |||||||||||||||||||||
| Interest and other income, net | 827 | 365 | |||||||||||||||||||||
| Income before provision for income taxes | 18,382 | 14,183 | |||||||||||||||||||||
| Provision for income taxes | 1,738 | 1,814 | |||||||||||||||||||||
| Net income | $ | 16,644 | $ | 12,369 |
The following table sets forth our condensed consolidated statements of income data (as a percentage of revenue)(1):
| Three Months Ended March 31, | |||||||||||||||||||||||
| 2025 | 2024 | ||||||||||||||||||||||
| Revenue | 100 | % | 100 | % | |||||||||||||||||||
| Costs and expenses: | |||||||||||||||||||||||
| Cost of revenue | 18 | 18 | |||||||||||||||||||||
| Research and development | 29 | 27 | |||||||||||||||||||||
| Marketing and sales | 7 | 7 | |||||||||||||||||||||
| General and administrative | 5 | 9 | |||||||||||||||||||||
| Total costs and expenses | 59 | 62 | |||||||||||||||||||||
| Income from operations | 41 | 38 | |||||||||||||||||||||
| Interest and other income, net | 2 | 1 | |||||||||||||||||||||
| Income before provision for income taxes | 43 | 39 | |||||||||||||||||||||
| Provision for income taxes | 4 | 5 | |||||||||||||||||||||
| Net income | 39 | % | 34 | % |
(1)Percentages have been rounded for presentation purposes and may differ from unrounded results.
Revenue
The following table sets forth our revenue by source and by segment:
| Three Months Ended March 31, | |||||||||||||||||||||||||||||||||||
| 2025 | 2024 | % change | |||||||||||||||||||||||||||||||||
| (in millions, except percentages) | |||||||||||||||||||||||||||||||||||
| Advertising | $ | 41,392 | $ | 35,635 | 16 | % | |||||||||||||||||||||||||||||
| Other revenue | 510 | 380 | 34 | % | |||||||||||||||||||||||||||||||
| Family of Apps | 41,902 | 36,015 | 16 | % | |||||||||||||||||||||||||||||||
| Reality Labs | 412 | 440 | (6) | % | |||||||||||||||||||||||||||||||
| Total revenue | $ | 42,314 | $ | 36,455 | 16 | % |
Family of Apps
FoA revenue in the three months ended March 31, 2025 increased $5.89 billion, or 16%, compared to the same period in 2024. The increase was almost entirely driven by advertising revenue.
Advertising
Advertising revenue in the three months ended March 31, 2025 increased $5.76 billion, or 16%, compared to the same period in 2024, due to increases in ad impressions delivered and average price per ad. During the three months ended March 31, 2025, ad impressions delivered increased by 5%, year-over-year, as compared with a 20% increase in the same period in 2024. Ad impressions delivered during the three months ended March 31, 2025 grew in all regions, especially in Asia-Pacific, which was primarily driven by increases in users and their engagement on our products. During the three months ended March 31, 2025, the average price per ad increased by 10%, year-over-year, as compared with an increase of 6% in the same period in 2024. The increase in average price per ad during the three months ended March 31, 2025 was driven by an increase in advertising demand, which we believe is mostly due to ongoing improvements to our ad performance from our ad targeting and measurement tools. This increase was partially offset by a higher number of ad impressions delivered, especially in geographies and in products, such as Reels, that monetize at lower rates. Other factors are discussed in the section entitled "—Executive Overview of First Quarter Results." In addition, the online commerce vertical was the largest contributor to the increase in advertising revenue in the three months ended March 31, 2025 compared to the same period in 2024. We anticipate that future advertising revenue will be driven by a combination of price and ad impressions delivered.
Other revenue
FoA other revenue in the three months ended March 31, 2025 increased $130 million, or 34%, compared to the same period in 2024. The increase was mostly driven by revenue from WhatsApp Business Platform and Meta Verified subscriptions.
Reality Labs
RL revenue in the three months ended March 31, 2025 decreased $28 million, or 6%, compared to the same period in 2024. The decrease in RL revenue was driven by a net decrease in Meta Quest sales, partially offset by an increase in sales of Ray-Ban Meta AI glasses.
Foreign Exchange Impact on Revenue
Changes in foreign exchange rates had an unfavorable impact on our revenue in the three months ended March 31, 2025 compared to the same period in 2024. To calculate revenue on a constant currency basis, we translated revenue using the prior year's monthly exchange rates for our settlement or billing currencies other than the U.S. dollar. Using these constant rates for the three months ended March 31, 2025, our total revenue and advertising revenue would have been $43.55 billion and $42.62 billion, which were $1.24 billion and $1.22 billion higher than actual total revenue and advertising revenue, respectively.
Cost of revenue
| Three Months Ended March 31, | |||||||||||||||||||||||||||||||||||
| 2025 | 2024 | % change | |||||||||||||||||||||||||||||||||
| (in millions, except percentages) | |||||||||||||||||||||||||||||||||||
| Cost of revenue | $ | 7,572 | $ | 6,640 | 14 | % | |||||||||||||||||||||||||||||
| Percentage of revenue | 18 | % | 18 | % |
Cost of revenue in the three months ended March 31, 2025 increased $932 million, or 14%, compared to the same period in 2024. The increase was mainly due to higher operational expenses related to our data centers and technical infrastructure, which included a decrease in the depreciation growth rate due to an extension in the useful lives of servers and network assets, effective January 1, 2025. To a lesser extent, higher costs associated with partner arrangements also contributed to the increase in the three months ended March 31, 2025.
See Note 1 — Summary of Significant Accounting Policies in the notes to the condensed consolidated financial statements included in Part I, Item 1, of this Quarterly Report on Form 10-Q for additional information regarding changes in the estimated useful life of our servers and network assets.
Research and development
| Three Months Ended March 31, | |||||||||||||||||||||||||||||||||||
| 2025 | 2024 | % change | |||||||||||||||||||||||||||||||||
| (in millions, except percentages) | |||||||||||||||||||||||||||||||||||
| Research and development | $ | 12,150 | $ | 9,978 | 22 | % | |||||||||||||||||||||||||||||
| Percentage of revenue | 29 | % | 27 | % |
Research and development expenses in the three months ended March 31, 2025 increased $2.17 billion, or 22%, compared to the same period in 2024. The increase was mostly due to higher employee compensation and infrastructure costs for research and development.
The higher employee compensation was mainly from a 14% growth in employee headcount from March 31, 2024 to March 31, 2025 in engineering and other technical functions supporting our continued investment in our family of products and Reality Labs.
Marketing and sales
| Three Months Ended March 31, | |||||||||||||||||||||||||||||||||||
| 2025 | 2024 | % change | |||||||||||||||||||||||||||||||||
| (in millions, except percentages) | |||||||||||||||||||||||||||||||||||
| Marketing and sales | $ | 2,757 | $ | 2,564 | 8 | % | |||||||||||||||||||||||||||||
| Percentage of revenue | 7 | % | 7 | % |
Marketing and sales expenses in the three months ended March 31, 2025 increased $193 million, or 8%, compared to the same period in 2024. The increase was mainly due to an increase in professional services related to ongoing platform integrity efforts.
General and administrative
| Three Months Ended March 31, | |||||||||||||||||||||||||||||||||||
| 2025 | 2024 | % change | |||||||||||||||||||||||||||||||||
| (in millions, except percentages) | |||||||||||||||||||||||||||||||||||
| General and administrative | $ | 2,280 | $ | 3,455 | (34) | % | |||||||||||||||||||||||||||||
| Percentage of revenue | 5 | % | 9 | % |
General and administrative expenses in the three months ended March 31, 2025 decreased $1.18 billion, or 34%, compared to the same period in 2024. The decrease was primarily driven by lower legal-related costs.
See Note 8 — Commitments and Contingencies in the notes to the condensed consolidated financial statements included in Part I, Item 1, of this Quarterly Report on Form 10-Q for additional information regarding legal-related costs.
Segment profitability
The following table sets forth income (loss) from operations by segment:
| Three Months Ended March 31, | |||||||||||||||||||||||||||||||||||
| 2025 | 2024 | % change | |||||||||||||||||||||||||||||||||
| (in millions, except percentages) | |||||||||||||||||||||||||||||||||||
| Family of Apps | $ | 21,765 | $ | 17,664 | 23 | % | |||||||||||||||||||||||||||||
| Reality Labs | (4,210) | (3,846) | (9) | % | |||||||||||||||||||||||||||||||
| Total income from operations | $ | 17,555 | $ | 13,818 | 27 | % |
Family of Apps
FoA income from operations in the three months ended March 31, 2025 increased $4.10 billion, or 23%, compared to the same period in 2024. The increase in FoA income from operations was driven by higher advertising revenue which was partially offset by an increase in costs and expenses. The increase in costs and expenses was mainly due to increases in employee compensation and infrastructure costs, partially offset by a decrease in legal-related costs.
Reality Labs
RL loss from operations in the three months ended March 31, 2025 increased $364 million, or 9%, compared to the same period in 2024, driven by an increase in RL costs and expenses. RL costs and expenses increased primarily due to an increase in employee compensation.
See Note 8 — Commitments and Contingencies, and Note 11 — Segment Information in the notes to the condensed consolidated financial statements included in Part I, Item 1, of this Quarterly Report on Form 10-Q for additional information regarding legal-related costs and segment employee compensation, respectively.
Interest and other income, net
| Three Months Ended March 31, | |||||||||||||||||||||||||||||||||||
| 2025 | 2024 | % change | |||||||||||||||||||||||||||||||||
| (in millions, except percentages) | |||||||||||||||||||||||||||||||||||
| Interest income | $ | 658 | $ | 585 | 12 | % | |||||||||||||||||||||||||||||
| Interest expense | (240) | (127) | (89) | % | |||||||||||||||||||||||||||||||
| Foreign currency exchange gains (losses), net | 232 | (148) | 257 | % | |||||||||||||||||||||||||||||||
| Other income, net | 177 | 55 | 222 | % | |||||||||||||||||||||||||||||||
| Total interest and other income, net | $ | 827 | $ | 365 | 127 | % |
Interest expense increased in the three months ended March 31, 2025, compared to the same period in 2024, due to higher long-term debt balances. Foreign currency exchange gains (losses), net increased in the three months ended March 31, 2025, compared to the same period in 2024, as a result of foreign currency transactions and remeasurement. Other income, net recognized in the three months ended March 31, 2025, was primarily related to unrealized gains on our equity investments.
Provision for income taxes
| Three Months Ended March 31, | |||||||||||||||||||||||||||||||||||
| 2025 | 2024 | % change | |||||||||||||||||||||||||||||||||
| (in millions, except percentages) | |||||||||||||||||||||||||||||||||||
| Provision for income taxes | $ | 1,738 | $ | 1,814 | (4) | % | |||||||||||||||||||||||||||||
| Effective tax rate | 9 | % | 13 | % |
Our provision for income taxes in the three months ended March 31, 2025 decreased $76 million, or 4%, compared to the same period in 2024, due to a decrease in the effective tax rate, offset by an increase in income before provision for income taxes.
Our effective tax rate decreased in the three months ended March 31, 2025 compared to the same period in 2024, a majority of which was due to excess tax benefits recognized from share-based compensation.
Effective Tax Rate Items. Our effective tax rate in the future will depend upon the proportion between the following items and income before provision for income taxes: U.S. tax benefits from foreign-derived intangible income, tax effects from share-based compensation, research tax credit, tax effects from capital losses not expected to be utilized, settlement of tax contingency items, tax effects of changes in our business, and the effects of changes in tax law.
The accounting for share-based compensation may increase or decrease our effective tax rate based upon the difference between our share-based compensation expense and the deductions taken on our tax return, which depend upon the stock price at the time of employee award vesting. If our stock price remains constant to the April 25, 2025 price, and absent any changes to our tax landscape, we expect our effective tax rate for the full year 2025 to be in the range of 12-15%. This includes the effects of the mandatory capitalization and amortization of research and development expenses incurred in 2025, as required by the 2017 Tax Cuts and Jobs Act (Tax Act). The mandatory capitalization requirement increases our 2025 cash tax liabilities materially but also decreases our effective tax rate due to increasing the foreign-derived intangible income deduction. If the mandatory capitalization is deferred or repealed, our effective tax rate in 2025 could be higher when compared to current law and our cash tax liabilities could be lower.
The Tax Act included a reduction in the foreign-derived intangible income deduction for tax years beginning after December 31, 2025. Absent any changes to U.S. tax law, the decrease in our U.S. tax benefits from foreign-derived intangible income would increase our cash tax liabilities and effective tax rate in 2026.
A number of countries have enacted legislation to implement the Organization for Economic Cooperation and Development’s 15% global minimum tax regime. We do not expect these changes to have a material impact on our consolidated financial statements for 2025. We continue to evaluate the impacts of proposed and enacted legislation with respect to the global minimum tax regime in the jurisdictions we operate in. As additional jurisdictions enact legislation,
transitional relief expires, and other provisions of the minimum tax legislation become effective, our effective tax rate and cash tax payments could increase in future years.
See Note 10 — Income Taxes in the notes to the condensed consolidated financial statements included in Part I, Item 1, of this Quarterly Report on Form 10-Q for additional information regarding income tax contingencies.
Liquidity and Capital Resources
Our principal sources of liquidity are our cash, cash equivalents, marketable securities, and cash generated from operations. Cash, cash equivalents, and marketable securities are comprised of cash on deposit with banks, time deposits, money market funds, U.S. government and agency securities, investment grade corporate debt securities, and marketable equity securities. As part of our cash management strategy, we concentrate cash deposits with large financial institutions and our investment holdings are in diversified highly rated securities. Cash, cash equivalents, and marketable securities were $70.23 billion as of March 31, 2025, a decrease of $7.58 billion from December 31, 2024. The decrease was primarily due to our capital returns of $14.08 billion for repurchases of our Class A common stock and payments of dividends and dividend equivalents, $13.69 billion for capital expenditures, including principal payments on finance leases, and $4.88 billion of taxes paid related to net share settlement of employee restricted stock unit (RSU) awards. These decreases were partially offset by $24.03 billion of cash generated from operations.
The following table presents our cash flows (in millions):
| Three Months Ended March 31, | |||||||||||
| 2025 | 2024 | ||||||||||
| Net cash provided by operating activities | $ | 24,026 | $ | 19,246 | |||||||
| Net cash used in investing activities | $ | (20,010) | $ | (8,734) | |||||||
| Net cash used in financing activities | $ | (19,495) | $ | (19,767) |
Cash Provided by Operating Activities
Cash provided by operating activities during the three months ended March 31, 2025 mostly consisted of $16.64 billion net income adjusted for certain non-cash items, such as $4.15 billion of share-based compensation expense and $3.90 billion of depreciation and amortization expense. The increase in cash flows from operating activities during the three months ended March 31, 2025, compared to the same period in 2024, was due to an increase in cash collection from our customers driven by the increase in revenue, partially offset by higher operational spending.
Cash Used in Investing Activities
Cash used in investing activities during the three months ended March 31, 2025 mostly consisted of $12.94 billion of purchases of property and equipment as we continued to invest in servers, data centers, and network infrastructure, and $6.98 billion of net purchases of marketable securities. The increase in cash used in investing activities during the three months ended March 31, 2025, compared to the same period in 2024, was mostly due to increases in purchases of property and equipment and marketable securities.
We anticipate making capital expenditures of approximately $64 billion to $72 billion in 2025 to support our core business and generative AI efforts.
Cash Used in Financing Activities
Cash used in financing activities during the three months ended March 31, 2025 mostly consisted of $12.75 billion for repurchases of our Class A common stock, $1.33 billion of payments of dividends and dividend equivalents, and $4.88 billion of taxes paid related to net share settlement of RSUs. The slight decrease in cash used in financing activities during the three months ended March 31, 2025, compared to the same period in 2024, was due to a decrease in share repurchases, partially offset by an increase in taxes paid related to net share settlement of RSUs.
Material Cash Requirements
We currently anticipate that our available funds and cash flow from operations and financing activities will be sufficient to meet our operational cash needs and fund our investments in infrastructure and AI initiatives, share repurchases and dividend payments for at least the next 12 months and thereafter for the foreseeable future. We continuously evaluate our liquidity and capital resources, including our access to external capital, to ensure we can finance our future capital requirements.
Leases and Contractual Commitments
Our operating and finance leases include data centers, offices, certain network infrastructure and colocations. In addition to lease liabilities, we have leases that have not yet commenced of approximately $35.27 billion as of March 31, 2025, which will commence between the remainder of 2025 and 2034.
We also have $30.05 billion of contractual commitments as of March 31, 2025 primarily related to our investments in servers and network infrastructure, and content costs.
Long-term Debt
As of March 31, 2025, we had outstanding long-term debt in the form of senior unsecured notes for an aggregate principal amount of $29.0 billion, which mature from 2027 through 2064. Short-term and long-term future interest payments obligations as of March 31, 2025 were $1.38 billion and $27.63 billion, respectively.
Capital Return Program
Share Repurchase
Our board of directors has authorized a share repurchase program of our Class A common stock, which commenced in January 2017 and does not have an expiration date. During the three months ended March 31, 2025, we repurchased and subsequently retired 19 million shares of our Class A common stock for an aggregate amount of $13.40 billion. As of March 31, 2025, $37.95 billion remained available and authorized for repurchases.
Dividend
In February 2025, we increased our quarterly cash dividends from $0.50 to $0.525 per share of Class A and Class B common stock. During the three months ended March 31, 2025, we paid $1.33 billion of dividends and dividend equivalents. Subject to legally available funds and future declaration by our board of directors, we currently intend to continue to pay a quarterly cash dividend and dividend equivalents on our outstanding common stock.
Taxes
Cash paid for income taxes was $448 million during the three months ended March 31, 2025. Subsequently, we also made a $3.72 billion U.S. federal income tax payment in April 2025, which included the final installment payment of $718 million related to a one-time transition tax payable incurred as a result of the Tax Act.
Our long-term income taxes include $10.92 billion related to the uncertain tax positions as of March 31, 2025. Due to uncertainties in the timing of the completion of tax audits, the timing of the resolution of these positions is uncertain and we are unable to make a reasonably reliable estimate of the timing of payments.
Loss Contingencies
We are involved in legal proceedings, claims, and regulatory, tax or government inquiries and investigations. Significant judgment is required to determine both probability and the estimated amount of loss. Such matters are inherently unpredictable and subject to significant uncertainties, some of which are beyond our control. Should any of these estimates and assumptions change or prove to be incorrect, it could have a material impact on our results of operations, financial position, and cash flows.
See Note 7 — Long-term Debt, Note 8 — Commitments and Contingencies, Note 9 — Stockholders' Equity, and Note 10 — Income Taxes in the notes to the condensed consolidated financial statements included in Part I, Item 1, and "Legal Proceedings" contained in Part II, Item 1 of this Quarterly Report on Form 10-Q for additional information regarding debt, commitments and contingencies, capital return program, and taxes, respectively.
Critical Accounting Estimates
Our condensed consolidated financial statements are prepared in accordance with U.S. GAAP. The preparation of these condensed consolidated financial statements requires us to make estimates and assumptions that affect the reported amounts of assets, liabilities, revenue, costs and expenses, and related disclosures. On an ongoing basis, we evaluate our estimates and assumptions based on historical experience and on various other assumptions that we believe are reasonable under the circumstances. Our actual results could differ from these estimates under different assumptions or conditions. Refer to "Critical Accounting Estimates" contained in Part II, Item 7 of our Annual Report on Form 10-K for the year ended December 31, 2024 for a complete discussion of our critical accounting estimates. There have been no material changes to our critical accounting estimates since our Annual Report on Form 10-K for the year ended December 31, 2024.
Previous: Item 1. Financial Statements · Next: Item 3. Quantitative and Qualitative Disclosures About Market Risk