 filings.tools
Item 5. MARKET FOR REGISTRANT’S COMMON EQUITY, RELATED STOCKHOLDER MATTERS AND ISSUER PURCHASES OF EQUITY SECURITIES
3K characters. Original on sec.gov · Markdown
Item 5. MARKET FOR REGISTRANT’S COMMON EQUITY, RELATED STOCKHOLDER MATTERS AND ISSUER PURCHASES OF EQUITY SECURITIES
| --- | --- |
Common Stock Information
Our common stock is traded on the New York Stock Exchange (“NYSE”) under the symbol “MGM.”
There were approximately 3,446 record holders of our common stock as of February 23, 2021.
Dividend Policy
The Company implemented a dividend program in February 2017 pursuant to which it has paid regular quarterly dividends. To preserve liquidity in light of the impact of COVID-19 on its business operations, the Company temporarily reduced its dividend to an annual dividend of $0.01 per share starting with the dividend for the second quarter of 2020. The amount, declaration and payment of any future dividends will be subject to the discretion of our Board of Directors who will evaluate our dividend policy from time to time based on factors it deems relevant, and the contractual limitations described below. In addition, as a holding company with no independent operations, our ability to pay dividends will depend upon the receipt of cash from our operating subsidiaries to generate the funds from operations necessary to pay dividends on our common stock, which has been significantly impacted by the COVID-19 pandemic. Furthermore, our senior credit facility contains financial covenants and restrictive covenants that could restrict our ability to pay dividends, subject to certain exceptions. In addition, the Operating Partnership and MGM China credit facilities each contain limitations on the ability of the applicable subsidiary under each credit agreement to pay dividends to us. There can be no assurance that we will continue to pay dividends in the future.
PERFORMANCE GRAPH
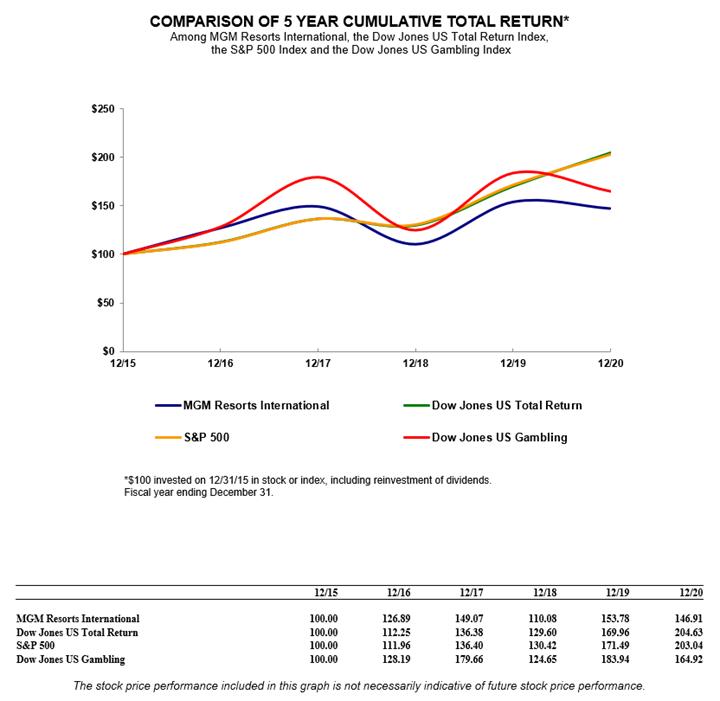
The graph below matches our cumulative Five-Year total shareholder return on common stock with the cumulative total returns of the Dow Jones US Total Return index, the S&P 500 index and the Dow Jones US Gambling index. The graph tracks the performance of a $100 investment in our common stock and in each index (with the reinvestment of all dividends as required by the SEC) from December 31, 2015 to December 31, 2020. The return shown on the graph is not necessarily indicative of future performance.
The following performance graph shall not be deemed to be "filed" for purposes of Section 18 of the Exchange Act, nor shall this information be incorporated by reference into any future filing under the Securities Act or the Exchange Act, except to the extent that we specifically incorporate it by reference into a filing.
Previous: Item 4. MINE SAFETY DISCLOSURES · Next: Item 6. REMOVED AND RESERVED