 filings.tools
Martin Marietta Materials 10-K 2019-12-31
Filed 2020-02-21. 22 sections, 563K characters. Original on sec.gov · Markdown · JSON
Cover and table of contents
UNITED STATES
SECURITIES AND EXCHANGE COMMISSION
WASHINGTON, D.C. 20549
FORM 10-K
(Mark One)
| ☒ | ANNUAL REPORT PURSUANT TO SECTION 13 OR 15(d) OF THE SECURITIES EXCHANGE ACT OF 1934 |
|---|
For the fiscal year ended December 31, 2019
OR
| ☐ | TRANSITION REPORT PURSUANT TO SECTION 13 OR 15(d) OF THE SECURITIES EXCHANGE ACT OF 1934 |
|---|
For the transition period from to
Commission file number 1-12744
MARTIN MARIETTA MATERIALS, INC.
(Exact name of registrant as specified in its charter)
| North Carolina | 56-1848578 | |
|---|---|---|
| (State or other jurisdiction of incorporation or organization) | (I.R.S. Employer Identification No.) | |
| 2710 Wycliff Road, Raleigh, North Carolina | 27607-3033 | |
| (Address of principal executive offices) | (Zip Code) |
(919) 781-4550
(Registrant’s telephone number, including area code)
Securities registered pursuant to Section 12(b) of the Act:
| Title of each class | Trading Symbol(s) | Name of each exchange on which registered | ||
|---|---|---|---|---|
| Common Stock (par value $.01 per share) | MLM | New York Stock Exchange |
Securities registered pursuant to Section 12(g) of the Act: None
Indicate by check mark if the registrant is a well-known seasoned issuer, as defined in Rule 405 of the Securities Act.
| Yes ☒ | No ☐ |
Indicate by check mark if the registrant is not required to file reports pursuant to Section 13 or Section 15(d) of the Exchange Act.
| Yes ☐ | No ☒ |
Indicate by check mark whether the registrant (1) has filed all reports required to be filed by Section 13 or 15(d) of the Securities Exchange Act of 1934 during the preceding 12 months (or for such shorter period that the registrant was required to file such reports), and (2) has been subject to such filing requirements for the past 90 days.
| Yes ☒ | No ☐ |
Indicate by check mark whether the registrant has submitted electronically every Interactive Data File required to be submitted pursuant to Rule 405 of Regulation S-T during the preceding 12 months (or for such shorter period that the registrant was required to submit such files).
| Yes ☒ | No ☐ |
Indicate by check mark whether the registrant is a large accelerated filer, an accelerated filer, a non-accelerated filer, a smaller reporting company, or emerging growth company. See the definitions of “large accelerated filer,” “accelerated filer,” “smaller reporting company,” and “emerging growth company” in Rule 12b-2 of the Exchange Act.
| Large accelerated filer | ☒ | Accelerated filer | ☐ | |
|---|---|---|---|---|
| Non-accelerated filer | ☐ | Smaller reporting company | ☐ | |
| Emerging growth company | ☐ |
If an emerging growth company, indicate by check mark if the registrant has elected not to use the extended transition period for complying with any new or revised financial accounting standards provided pursuant to Section 13(a) of the Exchange Act. ☐
Indicate by check mark whether the registrant is a shell company (as defined in Rule 12b-2 of the Exchange Act).
| Yes ☐ | No ☒ |
As of June 28, 2019, the last business day of the registrant’s most recently completed second fiscal quarter, the aggregate market value of the registrant’s common stock held by non-affiliates of the registrant was $12,807,658,433.72 based on the closing sale price as reported on the New York Stock Exchange.
Indicate the number of shares outstanding of each of the issuer’s classes of common stock on the latest practicable date.
| Class | Outstanding at February 14, 2020 | |
|---|---|---|
| Common Stock, $.01 par value per share | 62,198,867 shares |
DOCUMENTS INCORPORATED BY REFERENCE
| Document | Parts Into Which Incorporated | |
|---|---|---|
| Proxy Statement for the Annual Meeting of Shareholders to be held May 14, 2020 (Proxy Statement) | Part III |
TABLE OF CONTENTS
| PART IV | 121 | |
| ITEM 15. | EXHIBITS AND FINANCIAL STATEMENT SCHEDULES | 121 |
| ITEM 16. | FORM 10-K SUMMARY | 126 |
| SIGNATURES | 127 |
Part I ♦ Item 1 – Business
PART I
Item 1. BUSINESS
General
Martin Marietta Materials, Inc. (the “Company” or “Martin Marietta”) is a natural resource-based building materials company. The Company supplies aggregates (crushed stone, sand and gravel) through its network of more than 300 quarries, mines and distribution yards in 27 states, Canada, the Bahamas and the Caribbean Islands. In the western United States, Martin Marietta also provides cement and downstream products, namely, ready mixed concrete, asphalt and paving services in markets where the Company has a leading aggregates position. Specifically, the Company has two cement plants in Texas, and ready mixed concrete and asphalt operations in Texas, Colorado, Louisiana, Arkansas, and Wyoming. Paving services are exclusively in Colorado. The Company’s heavy-side building materials are used in infrastructure, nonresidential and residential construction projects. Aggregates are also used in agricultural, utility and environmental applications and as railroad ballast. The aggregates, cement, ready mixed concrete and asphalt and paving product lines are reported collectively as the “Building Materials” business. The Company also operates a Magnesia Specialties business with production facilities in Michigan and Ohio. The Magnesia Specialties business produces magnesia-based chemical products that are used in industrial, agricultural and environmental applications. It also produces dolomitic lime sold primarily to customers in the steel and mining industries. Magnesia Specialties’ products are shipped to customers worldwide.
The Company was formed in 1993 as a North Carolina corporation to serve as successor to the operations of the materials group of the organization that is now Lockheed Martin Corporation. An initial public offering of a portion of the Company’s common stock was completed in 1994, followed by a tax-free exchange transaction in 1996 that resulted in 100% of the Company’s common stock being publicly traded.
The Company completed over 90 smaller acquisitions from the time of its initial public offering until the present, which allowed the Company to enhance and expand its aggregates-led presence in the building materials marketplace. This included an exchange of certain assets in 2011 with Lafarge North America Inc. (“Lafarge”), pursuant to which it received aggregates quarry sites, ready mixed concrete and asphalt plants, and a road paving business in and around the metropolitan Denver, Colorado, and the I-25 corridor, in exchange for which Lafarge received properties consisting of quarries, an asphalt plant and distribution yards operated by the Company along the Mississippi River (called the Company’s “River District Operations”) and a cash payment.
The business has developed further through the following transactions over the past few years.
In 2014, the Company completed the acquisition of Texas Industries, Inc. (“TXI”), further augmenting its position as a leading supplier of aggregates and heavy building materials. TXI was a major supplier of natural aggregates in Texas, in northern Louisiana and, to a lesser extent, in Oklahoma and Arkansas. TXI was the then largest supplier of cement and ready mixed concrete products in Texas. TXI enhanced the Company’s position as an aggregates-led, low-cost operator in large and fast-growing geographies in the United States, adding 800 million tons of aggregates to the Company’s reserves, and provided high-quality assets in cement and ready mixed concrete.
In connection with the TXI acquisition, the Company acquired nine quarries and six aggregates distribution terminals located in Texas, Louisiana and Oklahoma. The Company also acquired two cement plants in Midlothian, Texas, south of Dallas, and Hunter, Texas, north of San Antonio, and approximately 120 ready mixed concrete plants, situated primarily in three areas of Texas (the Dallas/Fort Worth/Denton area of north Texas; the Austin area of central Texas; and from Beaumont to Texarkana in east Texas), in north and central Louisiana and in Southwestern Arkansas. As part of an agreement in conjunction with the United States Department of Justice’s review of the transaction, the Company divested its North Troy Quarry in Oklahoma and two related rail distribution yards in Dallas and Frisco, Texas.
TXI was also a cement producer in California. In 2015, the Company divested its California cement operations acquired from TXI. These operations were not in close proximity to aggregates and other core assets of the Company and, unlike other marketplace competitors, were not vertically integrated with ready mixed concrete production. The divestiture primarily included a cement plant, two distribution terminals, mobile equipment, intangible assets and inventory. The Company also completed the integration of the TXI operations in 2015, and completed three smaller acquisitions the same year, which included three aggregates operations and related assets.
In 2016, the Company acquired aggregates, ready mixed concrete and asphalt and paving operations in southern Colorado that provided more than 500 million tons of mineral reserves and expanded the Company’s presence along the Front Range
| Celebrating 25 Years as a Public Company |  | Form 10-K ♦ Page 1 |
|---|
Part I ♦ Item 1 – Business
of the Rocky Mountains, home to 85% of Colorado’s population. The Company also acquired the remaining and controlling interest in a ready mixed concrete company that serves the I-35 corridor in central Texas between Dallas and Austin, which enhanced the Company’s position and provided additional vertical integration benefits with the Company’s cement product line.
In 2018, the Company completed the acquisition of Bluegrass Materials Company (“Bluegrass”), the then largest privately held, pure-play aggregates business in the United States. With a portfolio of 22 active sites acquired by the Company, the operations provided more than 2.2 billion tons, or approximately 125 years, of strategically-located, high-quality reserves, in Georgia, South Carolina, Tennessee, Maryland, Kentucky and Pennsylvania. These operations complemented the Company’s existing southeastern footprint in its Mid-America and Southeast Groups and provided a new growth platform within Maryland and Kentucky.
Between 2001 and 2019, the Company disposed of a number of underperforming operations, including aggregates, ready mixed concrete, trucking, and asphalt and road paving operations of its Building Materials business and the refractories business of its Magnesia Specialties business. In some of its divestitures, the Company concurrently entered into supply agreements to provide aggregates at market rates to certain of these divested businesses. During 2015, the Company disposed of certain non-core asphalt operations in San Antonio, Texas and divested its California cement operations. Divestitures in 2018 also included those required as part of the governmental approval associated with the acquisition of Bluegrass, consisting of one site owned by Bluegrass and one site operated by the Company. The Company will continue to evaluate opportunities to divest underperforming or non-strategic assets, if appropriate, during 2020 consistent with its strategic plan and in an effort to redeploy capital for other opportunities.
Business Segment Information
The Company conducts its Building Materials business through three reportable segments, organized by geography: Mid-America Group, Southeast Group and West Group. The Mid-America and Southeast Groups provide aggregates products only. The West Group provides aggregates, cement and downstream products. Our top ten states accounted for 86% of the Building Materials business total revenues in 2019: Texas, Colorado, North Carolina, Georgia, Iowa, Florida, South Carolina, Indiana, Maryland and Nebraska. The Company also has the Magnesia Spec
Showing the first 8K of 74K characters. Open the full section
Item 1A. RISK FACTORS
An investment in our common stock or debt securities involves risks and uncertainties. You should consider the following factors carefully, in addition to the other information contained in this Form 10-K, before deciding to purchase or otherwise trade our securities.
This Form 10-K and other written reports and oral statements made from time to time by the Company contain statements that, to the extent they are not recitations of historical fact, constitute forward-looking statements within the meaning of federal securities law. Investors are cautioned that all forward-looking statements involve risks and uncertainties, and are based on assumptions that the Company believes in good faith are reasonable, but which may be materially different from actual results. Investors can identify these statements by the fact that they do not relate only to historic or current facts. The words “may,” “will,” “could,” “should,” “anticipate,” “believe,” “estimate,” “expect,” “forecast,” “intend,” “outlook,” “plan,” “project,” “scheduled,” and similar expressions in connection with future events or future operating or financial performance are intended to identify forward-looking statements. Any or all of the Company’s forward-looking statements in this Form 10‑K and in other publications may turn out to be wrong.
Statements and assumptions on future revenues, income and cash flows, performance, economic trends, the outcome of litigation, regulatory compliance, and environmental remediation cost estimates are examples of forward-looking statements. Numerous factors, including potentially the risk factors described in this section, could affect our forward-looking statements and actual performance.
Investors are also cautioned that it is not possible to predict or identify all such factors. Consequently, the reader should not consider any such list to be a complete statement of all potential risks or uncertainties. Other factors besides those listed may also adversely affect the Company and may be material to the Company. The Company has listed the known material risks it considers relevant in evaluating the Company and its operations. The forward-looking statements in this document are intended to be subject to the safe harbor protection provided by Section 27A of the Securities Act of 1933 and Section 21E of the Exchange Act. These forward-looking statements are made as of the date hereof based on management’s current expectations, and the Company does not undertake an obligation to update such statements, whether as a result of new information, future events, or otherwise.
For a discussion identifying some important factors that could cause actual results to vary materially from those anticipated in the forward-looking statements, see the factors listed below, along with the discussion of “Competition” under Item 1 of this Form 10-K, “Management’s Discussion and Analysis of Financial Condition and Results of Operations” under Item 7 of this Form 10-K, and “Note A: Accounting Policies” and “Note O: Commitments and Contingencies” of the “Notes to Financial Statements” of the Company’s consolidated financial statements included under Item 8, “Financial Statements and Supplemental Data,” of this Form 10-K.
General Risk Factors
Our business is cyclical and depends on activity within the construction industry.
Economic and political uncertainty can impede growth in the markets in which we operate. Demand for our products, particularly in the private nonresidential and residential construction markets, could decline if companies and consumers are unable to obtain credit for construction projects or if an economic slowdown causes delays or cancellations of capital projects. State and federal budget issues may also hurt the funding available for infrastructure spending. The lack of available credit may limit the ability of states to issue bonds to finance construction projects. As a result of these issues, several of our top sales generating states, from time-to-time, stop bidding or slow bid projects in their transportation departments.
We sell most of our aggregates products, our primary business, and our cement products, to the construction industry, so our results depend on that industry’s strength. Since our businesses depend on construction spending, which can be cyclical, our profits are sensitive to national, regional, and local economic conditions and the intensity of the underlying spending on aggregates and cement products. Construction spending is affected by economic conditions, changes in interest rates, demographic and population shifts, and changes in construction spending by federal, state, and local governments. If economic conditions change, a recession in the construction industry may occur and affect the demand for our products. The Great Recession of the late 2000s and early 2010s (the “Great Recession”) was an example, and our shipment volumes were significantly reduced. Construction spending can also be disrupted by terrorist activity and armed conflicts.
While our business operations cover a wide geographic area, our earnings depend on the strength of the local economies in which we operate because of the high cost to transport our products relative to their price. If economic conditions and
| Form 10-K ♦ Page 14 | | Celebrating 25 Years as a Public Company |
|---|
Part I ♦ Item 1A – Risk Factors
construction spending decline significantly in one or more areas, particularly in our top five sales-generating states of our Building Materials business of Texas, Colorado, North Carolina, Georgia, and Iowa our profitability will decrease. We experienced this situation with the Great Recession.
The Great Recession resulted in large declines in shipments of aggregates products in our industry. Recent years, however, have shown a slow but steady turnaround in this trend. The current economic expansion in the United States, which began in 2009, has now become the longest economic recovery in United States history.
While historical spending on public infrastructure projects has been, comparatively, more stable as governmental appropriations and expenditures are typically less interest rate-sensitive than private sector spending, we experienced a slight retraction in aggregates product line shipments to the infrastructure market after uncertainty regarding the passage of the federal highway bill in 2014. Contractors were not able to get any certainty on the availability of federal infrastructure funding until late 2015 with the enactment of a new federal highway bill.
Our Building Materials business is seasonal and subject to the weather, which can significantly impact operations.
Since the heavy-side construction business is conducted outdoors, erratic weather patterns, seasonal changes and other weather-related conditions affect our business. Adverse weather conditions, including hurricanes and tropical storms, cold weather, snow, and heavy or sustained rainfall, reduce construction activity, restrict the demand for our products, and impede our ability to efficiently transport material. Adverse weather conditions also increase our costs and reduce our production output as a result of power loss, needed plant and equipment repairs, time required to remove water from flooded operations, and similar events. Severe drought conditions can restrict available water supplies and restrict production. The Building Materials product lines’ production and shipment levels follow activity in the construction industry, which typically are strongest in the spring, summer and fall. Because of the weather’s effect on the construction industry’s activity, the production and shipment levels for the Company’s Building Materials business, including all of its aggregates-related downstream operations, vary by quarter. The second and third quarters are generally subject to heavy precipitation, and thus are more profitable if precipitation is lighter, while the first and fourth quarters are subject to the impacts of winter weather, and thus are generally the least profitable. Weather-related hindrances were exacerbated over the last few years by record precipitation in many of our key markets, notably the eastern seaboard and Texas. Importantly, inclement weather was most significant during the second and third quarters, which represents the height of the construction season. These weather events reduced the Company’s overall profitability in the last few years, so our results for those years, or in comparison to other years, may not be indicative of our future operating results. The Company’s operations in the southeastern and Gulf Coast regions of the United States and the Bahamas are at risk for hurricane activity, most notably in August, September and October. In 2019, Hurricane Dorian and Tropical Storm Imelda temporarily disrupted the Company’s business.
Competition and Growth Risk Factors
Our Building Materials business depends on the availability of aggregate reserves or deposits and our ability to mine them economically.
Our challenge is to find aggregates deposits that we can mine economically, with appropriate permits, near either growing markets or long-haul transportation corridors that economically serve growing markets. As communities have grown, they have taken up attractive quarrying locations and have imposed restrictions on mining. We try to meet this challenge by identifying and permitting sites prior to economic expansion, buying more land around our existing quarries to increase our mineral reserves, developing underground mines, and developing a distribution network that transports aggregates products by various methods, including rail and water. While our distribution network allows us to transport our products longer distances than would normally be considered economical, we can give no assurances that we will be successful.
Our businesses face many competitors.
Our businesses have many competitors, some of whom are bigger and have more resources than we do. Some of our competitors operate on a worldwide basis. Our results are affected by the number of competitors in a market, the production capacity that a particular market can accommodate, the pricing practices of other competitors, and the entry of new competitors in a market. We also face competition for some of our products from alternative products. For example, our Magnesia Specialties business may compete with other chemical products that could be used instead of our magnesia-based
| Celebrating 25 Years as a Public Company | | Form 10-K ♦ Page 15 |
Part I ♦ Item 1A – Risk Factors
products. As other examples, our aggregates, ready mix concrete, and asphalt and paving product lines may compete with recycled asphalt and concrete products that could be used instead of new products and our cement product line may compete with international competitors who are importing products to the United States with lower production and regulatory costs.
Our future growth may depend in part on acquiring other businesses in our industry.
We expect to continue to grow, in part, by buying other businesses. We will continue to look for strategic businesses to acquire, like our acquisition of TXI in 2014 and our acquisition of Bluegrass in 2018. In the past, we have made acquisitions to strengthen our existing locations, expand our operations and enter new geographic markets. We will continue to pursue selective acquisitions, joint ventures or other business arrangements we believe will help our Company. However, the continued success of our acquisition program will depend on our ability to find and buy other attractive businesses at an appropriate price and our ability to integrate acquired businesses into our existing operations. We cannot assume there will continue to be attractive acquisition opportunities for sale at reasonable prices that we can successfully integrate into our operations.
We may decide to pay all or part of the purchase price of any future acquisition with shares of our common stock. We may also use our stock to make strategic investments in other companies to complement and expand our operations. If we use our common stock in this way, the ownership interests of our existing shareholders at that time will be diluted and the price of our stock could decline. We operate our businesses with the objective of maximizing long-term shareholder return.
Our integration of the acquisition of or business combination with other businesses may not be as successful as projected.
We have a successful history of business combinations and integration of these businesses into our heritage operations. Our largest business acquisition was TXI, which closed in July 2014. In 2015, we completed the integration of TXI’s operations into our own operations ahead of schedule, which allowed us to achieve and exceed the synergies, cost savings, and operating efficiencies we had forecasted at the time of the acquisition. In 2018, we completed the integration of the operations of Bluegrass into our own operations in a manner that surpassed the publicly stated synergy estimates provided at the closing of the transaction. However, in connection with the integration of any other business that we acquire, there is a risk that we will not be able to achieve such integration in a successful manner or on the time schedule we have projected or in a way that will achieve the level of synergies, cost savings, or operating efficiencies we forecast from the acquisition.
Any other significant business acquisition or combination we might choose to do, similar to the acquisition of TXI or Bluegrass, would require that we devote significant management attention and resources to preparing for and then integrating our business practices and operations. Based on our history, we believe we would be successful in this integration process. Nevertheless, we may fail to realize some of the anticipated benefits of any potential acquisition or other business combination that we pursue in the future, if the integration process takes longer than expected or is more costly than expected. Potential difficulties we may encounter in the integration process include:
| • | the inability to successfully combine operations in a manner that permits us to achieve the cost savings and revenue synergies anticipated to result from the proposed acquisition or business combination, which would result in the anticipated benefits of the acquisition or business combination not being realized partly or wholly in the time frame currently anticipated or at all; |
|---|
| • | lost sales and customers as a result of certain customers of either the Company or former customers of the acquired or combined company deciding not to do business with the Company; |
|---|
| • | complexities associated with managing the combined operations; |
|---|
| • | integrating personnel; |
|---|
| • | creation of uniform standards, internal controls, procedures, policies and information systems; |
|---|
| • | potential unknown liabilities and unforeseen increased expenses, delays or regulatory issues associated with integrating the remaining operations; and |
|---|
| • | performance shortfalls at business units as a result of the diversion of management attention caused by completing the remaining integration of the operations. |
|---|
| Form 10-K ♦ Page 16 | | Celebrating 25 Years as a Public Company |
|---|
Part I ♦ Item 1A – Risk Factors
Our acquisitions could harm our results of operations.
In pursuing our business strategy, we conduct discussions, evaluate opportunities and enter into acquisition agreements. Acquisitions involve significant challenges and risks, including risks that:
| • | we may not realize a satisfactory return on the investment we make; |
|---|
| • | we may not be able to retain key personnel of the acquired business; |
|---|
| • | we may experience difficulty in integrating new employees, business systems and technology; |
|---|
| • | our due diligence process may not identify compliance issues or other liabilities that are in existence at the time of our acquisition; |
|---|
| • | we may not be able to bring the acquired business up to our expected levels of safety standards as soon as anticipated; |
|---|
| • | we may have difficulty entering into new geographic markets in which we are not experienced; or |
|---|
| • | we may be unable to retain the customers and partners of acquired businesses following the acquisition. |
|---|
Our cement product line and Magnesia Specialties business may become capacity-constrained.
If our cement product line or Magnesia Specialties business becomes capacity-constrained, they may be unable to timely satisfy the demand for some of their products, and any resulting changes in customers would introduce volatility to the earnings of these segments. We can address capacity needs by enhancing our manufacturing productivity, increasing the operational availability of equipment, reducing machinery down time and extending machinery useful life. Future demand for our products may require us to expand further our manufacturing capacity, particularly through the purchase of additional manufacturing equipment. However, we may not be able to increase our capacity in time to satisfy increases in demand that may occur from time to time. Capacity constraints may prevent us from satisfying customer orders and result in a loss of sales to competitors that are not capacity-constrained. In addition, we may suffer excess capacity if we increase our capacity to meet actual or anticipated demand and that demand decreases or does not materialize. While we are permitted to expand production by up to 800,000 additional tons at our Midlothian plant, it could take us a significant period of time before such production expansion could come to fruition.
Our cement product line could suffer if cement imports from other countries significantly increase or are sold in the U.S. in violation of U.S. fair trade laws.
The cement industry has in the past obtained antidumping orders imposing duties on imports of cement and clinker from other countries that violated U.S. fair trade laws. Currently, an antidumping order against cement and clinker from Japan is set to expire but is under review for extension by the Federal Trade Commission. As has always been the case, cement operators with import facilities can purchase cement from other countries, such as those in Latin America and Asia, which could compete with domestic producers. In addition, if environmental regulations increase the costs of domestic producers compared to foreign producers that are not subject to similar regulations, imported cement could achieve a significant cost advantage over domestically produced cement. An influx of cement or clinker products from countries not subject to antidumping orders, or sales of imported cement or clinker in violation of U.S. fair trade laws, could adversely affect our cement product line.
Economic, Political and Legal Risk Factors
Changes in legal requirements and governmental policies concerning zoning, land use, the environment, health and safety and other areas of the law, as well as litigation relating to these matters, affect our businesses. Our operations expose us to the risk of material environmental liabilities.
Many federal, state and local laws and regulations relating to zoning, land use, air emissions (including GHGs) and water discharges, waste management, noise and dust control, reclamation and other environmental, health and safety matters govern our operations. Some of our operations require permits, which may impose additional operating standards, and are subject to modification renewal and revocation. Despite our extensive efforts to remain in strict compliance at all times with all applicable laws and regulations, the risk of liabilities, particularly environmental liabilities, is inherent in the operation of our businesses. These potential liabilities could result in material costs, including for fines or personal injury or damages claims, which could have an adverse impact on our operations and profitability.
| Celebrating 25 Years as a Public Company | | Form 10-K ♦ Page 17 |
Part I ♦ Item 1A – Risk Factors
Future events, including changes in existing laws or regulations or enforcement policies, or further investigation or evaluation of the potential health hazards of some of our products or business activities may result in additional or unanticipated compliance and other costs. We could be required to invest in preventive or remedial action, like pollution control facilities, which could be substantial or which could result in restrictions on our operations or delays in obtaining required permits or other approvals.
Our operations are subject to manufacturing, operating, and handling risks associated with the products we produce and the products we use in our operations, including the related storage and transportation of raw materials, products, hazardous substances, and wastes. We are exposed to hazards including storage tank leaks, explosions, discharges or releases of hazardous substances, exposure to dust, and the operation of mobile equipment and manufacturing machinery.
These risks can subject us to potentially significant liabilities relating to personal injury or death, or property damage, and may result in civil or criminal penalties, which could hurt our productivity or profitability. For example, from time to time we investigate and remediate environmental contamination relating to our prior or current operations, as well as operations we have acquired from others, and in some cases we have been or could be named as a defendant in litigation brought by governmental agencies or private parties.
We are involved from time to time in litigation and claims arising from our operations. While we do not believe the outcome of pending or threatened litigation will have a material adverse effect on our operations or our financial condition, an unexpected and material adverse outcome in a pending or future legal action could potentially have a negative effect on our Company.
Climate change and related legislation or regulations may adversely impact our business, including potential physical and financial impacts.
Amid concerns that GHG emissions are contributing to climate change, a number of governmental bodies, including the U.S. Congress and various U.S. states, have proposed, enacted or are contemplating legislative and regulatory changes to mitigate or address the potential impacts of climate change, including provisions for emissions reductions or the use of alternative fuels, carbon credits (such as a "cap and trade" system) and a carbon tax. For example, in the U.S., the USEPA promulgated a mandatory reporting rule covering GHG emissions from sources considered to be large emitters. The USEPA has also promulgated a GHG emissions permitting rule, referred to as the “Tailoring Rule,” which may require some industrial facilities to obtain operating permits for GHG emissions under the U.S. Clean Air Act. Although the U.S. Supreme Court subsequently ruled in June 2014 that the USEPA exceeded its statutory authority in issuing the Tailoring Rule, the Court upheld the so-called “Best Available Control Technology” requirements for GHGs emitted by sources that already require Title V operating permits or are subject to PSD requirements for other pollutants. Thus, if future modifications to our Magnesia Specialties or cement facilities require PSD review for other pollutants, GHG permitting requirements may also be triggered, which could require us to incur significant additional costs.
Although the operations of the Company’s aggregates, ready mixed concrete and asphalt and paving product lines are not major sources of GHG emissions, any additional regulatory restrictions on emissions of GHGs imposed by the USEPA will likely impact the Company’s magnesia-based chemicals operations in Woodville, Ohio and Manistee, Michigan, as well as its two cement plants in Texas, each of which file annual reports of GHG emissions as required by the USEPA reporting rule. It is not possible, however, to estimate the cost of any such future requirements at this time. In addition, the Company may not be able to recover any increased operating costs or taxes relating to GHG emission limitations at those plants from its customers in order to remain competitive in pricing in the relevant markets.
In addition to impacts from increased GHG and other climate-related regulation, climate change may result in physical and financial impacts that could have adverse effects on the Company’s operations or financial condition. Given the nature of our operations, physical impacts may include disruptions in production and/or regional supply or product distribution networks due to major storm events, shifts in regional rainfall and temperature patterns and intensities, as well as flooding from sea level changes. In addition, production and shipment levels for the Building Materials business and cement operations correlate with general construction activity, most of which occurs outdoors and, as a result, is affected by erratic weather patterns, seasonal changes and other unusual or unexpected weather-related conditions, which can significantly affect that business. Excessive rainfall and other severe weather events also jeopardize production, shipments and profitability in all markets served by the Company. In particular, the Company’s operations in the Southeastern and Gulf Coast regions of the United States and the Bahamas are at risk for hurricane activity, most notably in August, September and October. The last few years brought an unprecedented amount of precipitation to the United States and particularly to Texas and the southeastern United States. In addition, climate and inclement weather can reduce the useful life of an asset.
| Form 10-K ♦ Page 18 | | Celebrating 25 Years as a Public Company |
|---|
Part I ♦ Item 1A – Risk Factors
Our businesses also are dependent on reliable sources of electricity and fuels. We could incur increased costs or disruptions in our operations if climate change legislation and regulation or severe weather impacts the price or availability of purchased electricity or fuels or other materials used in our operations. These and other climate-related risks also could impact our customers, such as a downturn in the construction sector, which could lead to reduced demand for our products. The Company may not be able to pass on to its customers all the costs related to mitigating these risks.
The overall impacts of climate change on our operations and the Company are highly uncertain and difficult to estimate. However, climate change legislation and regulation concerning GHGs could have a material adverse effect on our future financial position, results of operations or cash flows.
Our business is dependent on funding from a combination of federal, state and local sources.
Our products are used in public infrastructure projects, which include the construction, maintenance, and improvement of highways, streets, roads, bridges, schools, and similar projects. Accordingly, our business is dependent on the level of federal, state, and local spending on these projects. The visibility into future federal infrastructure funding was clarified and stabilized to some extent in 2015 with the passage of the current federal highway bill, the FAST Act, which reauthorized federal highway and transportation funding programs. The FAST Act, however, only reauthorized federal infrastructure funding through 2020, so must be reauthorized this year. If not reauthorized this year, the Company anticipates some level of funding would be continued with continuing resolutions. The uncertainty of federal funding has led to the increase in state and alternative methods of infrastructure funding. We expect to see increased infrastructure spending at the state level in 2020. At the federal level, we expect to see some increased infrastructure spending in 2020 resulting from the FAST Act funding, but will be dependent on a successor FAST Act bill or continuing resolutions in the future for any greater federal impact on funding. Any enhanced federal infrastructure bill will require Congressional approval. We cannot be assured, however, of such approval or of the existence, amount, and timing of appropriations for spending on future projects.
Federal highway bills provide spending authorizations that represent maximum amounts. Each year, an appropriation act is passed establishing the amount that can actually be used for particular programs. The annual funding level is generally tied to receipts of highway user taxes placed in the Highway Trust Fund. Once the annual appropriation is passed, funds are distributed to each state based on formulas (“apportionments”) or other procedures (“allocations"). Apportioned and allocated funds generally must be spent on specific programs as outlined in the federal legislation. The Highway Trust Fund has experienced shortfalls in recent years, due to high gas prices, fewer miles driven and improved automobile fuel efficiency. These shortfalls created a significant decline in federal highway funding levels. In response to the projected shortfalls, money has been transferred from the General Fund into the Highway Trust Fund over the past several years. Timely Congressional action is needed to address the funding mechanism for the Highway Trust Fund. We cannot be assured of the existence, timing or amount of federal highway funding levels in the future. We also cannot be assured of the impact of the recent sharp reduction in gasoline prices on the levels of highway user taxes that might be collected in the future and the corresponding levels of funding to the Highway Trust Fund.
At the state level, each state funds its infrastructure spending from specially allocated amounts collected from various taxes, typically gasoline taxes and vehicle fees, along with voter-approved bond programs. Shortages in state tax revenues can reduce the amounts spent on state infrastructure projects, even below amounts awarded under legislative bills. Delays in state infrastructure spending can hurt our business. Many states after the Great Recession experienced state-level funding pressures caused by lower tax revenues or other inability to finance approved projects. For example, North Carolina was among the states that experienced these pressures, and this state disproportionately affects our revenues and profits. Most state budgets, including North Carolina’s, improved in 2014 and later years as increased tax revenues helped resolve budget constraints. North Carolina infrastructure spending recently has been restrained by spending required elsewhere for storm relief and litigation settlements. Despite these restraints, the North Carolina General Assembly has provided interim financial relief for North Carolina to continue to fund its infrastructure spending.
During the past several years, many states have taken on a significantly larger role in funding infrastructure investment, including initiating special-purpose taxes and raising gas taxes. We anticipate further growth in state-level funding initiatives, such as bond issues, toll roads, and special purpose taxes, as states address infrastructure needs, particularly in periods of federal funding uncertainty. Nevertheless, it is a continuing risk to our business that sufficient funding from federal, state, and local sources will not be available to address infrastructure needs.
| Celebrating 25 Years as a Public Company | | Form 10-K ♦ Page 19 |
Part I ♦ Item 1A – Risk Factors
Our businesses could be impacted by rising interest rates.
As discussed previously, our operations are highly dependent upon the interest rate-sensitive construction and steelmaking industries. Therefore, business in these industries and for us may decline if interest rates rise and costs increase.
For example, demand in the residential construction market in which we sell our aggregate products is affected by interest rates. In 2019, the Federal Reserve lowered the federal funds rate to a range of 1.5% to 1.75%, cutting the rate three times during the year. At its December, 2019, meeting the Federal Reserve held the federal funds rate steady and signaled its desire to maintain the rate at that level during 2020. This course of action continued at its January, 2020, meeting when the Federal Reserve again held rates steady and changed little in its economic outlook as the United States economy continued to extend its longest expansion on record. There can be no assurance, however, that interest rates will not increase in the future, affecting our business in an adverse manner. The residential construction market accounted for 22% of our aggregates product line shipments in 2019.
Aside from these inherent risks from within our operations, our earnings are also affected by changes in short-term interest rates. However, rising interest rates are not necessarily predictive of weaker operating results.
Rising interest rates could also result in disruptions in the credit markets, which could affect our business, as described in greater detail under “Disruptions in the credit markets could affect our business” below.
Increases in our effective income tax rate may harm our results of operations.
A number of factors may increase our future effective income tax rate, including:
| • | governmental authorities increasing taxes or eliminating deductions, particularly the depletion deduction; |
|---|
| • | the mix of earnings from depletable versus non-depletable businesses; |
|---|
| • | the jurisdictions in which earnings are taxed; |
|---|
| • | the resolution of issues arising from tax audits with various tax authorities; |
|---|
| • | changes in the valuation of our deferred tax assets and liabilities; |
|---|
| • | adjustments to estimated taxes upon finalization of various tax returns; |
|---|
| • | changes in available tax credits; |
|---|
| • | changes in stock-based compensation; |
|---|
| • | other changes in tax laws; and |
|---|
| • | the interpretation of tax laws and/or administrative practices. |
|---|
Any significant increase in our future effective income tax rate could reduce net earnings and free cash flow for future periods.
Personnel Risks
Labor disputes could disrupt operations of our businesses.
Labor unions represent approximately 10% of the hourly employees of our Building Materials business and 100% of the hourly employees of our Magnesia Specialties business. Our collective bargaining agreements for employees of our Magnesia Specialties business at the Manistee, Michigan magnesia chemicals plant and the Woodville, Ohio, lime plant expire in August 2023 and June 2022, respectively.
Disputes with our trade unions, or the inability to renew our labor agreements, could lead to strikes or other actions that could disrupt our businesses, raise costs, and reduce revenues and earnings from the affected locations.
We depend on the recruitment and retention of qualified personnel, and our failure to attract and retain such personnel could affect our business.
Our success depends to a significant degree upon the continued services of our key personnel and executive officers. Our prospects depend upon our ability to attract and retain qualified personnel for our operations. Competition for personnel is intense, and we may not be successful in attracting or retaining qualified personnel, which could negatively affect our business.
| Form 10-K ♦ Page 20 | | Celebrating 25 Years as a Public Company |
|---|
Part I ♦ Item 1A – Risk Factors
Financial, Accounting and Cost Management Risk Factors
Our business is a capital-intensive business.
The property and machinery needed to produce our products are very expensive. Therefore, we require large amounts of cash to operate our businesses. We believe that our cash on hand, along with our projected operating cash flows and our available financing resources, is adequate to support our anticipated operating and capital needs. Our ability to generate sufficient cash flow depends on future performance, which will be subject to general economic conditions, industry cycles and financial, business, and other factors affecting our operations, many of which are beyond our control. If we are unable to generate sufficient cash to operate our business, we may be required, among other things, to further reduce or delay planned capital or operating expenditures.
Our earnings are affected by the application of accounting standards and our critical accounting policies, which involve subjective judgments and estimates by our management. Our estimates and assumptions could be wrong.
The accounting standards we use in preparing our financial statements are often complex and require that we make significant estimates and assumptions in interpreting and applying those standards. We make critical estimates and assumptions involving accounting matters including our goodwill impairment testing, our expenses and cash requirements for our pension plans, our estimated income taxes, and how we account for our property, plant and equipment, and inventory. These estimates and assumptions involve matters that are inherently uncertain and require our subjective and complex judgments. If we used different estimates and assumptions or used different ways to determine these estimates, our financial results could differ.
While we believe our estimates and assumptions are appropriate, we could be wrong. Accordingly, our financial results could be different, either higher or lower. We urge you to read the Critical Accounting Policies and Estimates section included under Item 7, “Management’s Discussion and Analysis of Financial Condition and Results of Operations,” of the Form 10-K.
The adoption of new accounting standards may affect our financial results.
The accounting standards we apply in preparing our financial statements are reviewed by regulatory bodies and are changed from time to time. New or revised accounting standards could, either positively or negatively, affect results reported for periods after adoption of the standards as compared to the prior periods, or require retrospective application changing results reported for prior periods. We urge you to read about our accounting policies in Note A of our Consolidated financial statements included under Item 8, “Financial Statements and Supplementary Data,” of this Form 10-K.
Reports from the Public Company Accounting Oversight Board’s (“PCAOB”) inspections of public accounting firms continue to outline findings and recommendations which could require these firms to perform additional work as part of their financial statement audits. The Company’s costs to respond to these additional requirements may increase.
Disruptions in the credit markets could affect our business.
We have considered the current economic environment and its potential impact to the Company’s business. Demand for aggregates products, particularly in the infrastructure construction market, had been negatively affected by federal and state budget and deficit issues and the uncertainty over future highway funding levels. Further, delays or cancellations to capital projects in the nonresidential and residential construction markets could occur if companies and consumers are unable to obtain financing for construction projects or if consumer confidence continues to be eroded by economic uncertainty.
A recessionary construction economy can also increase the likelihood we will not be able to collect on all of our accounts receivable with our customers. We are protected in part, however, by payment bonds posted by many of our customers or end-users. Nevertheless, we experienced a delay in payment from some of our customers during the construction downturn, which can negatively affect operating cash flows. Historically, our bad debt write-offs have not been significant to our operating results, and we believe our allowance for doubtful accounts is adequate.
The credit environment could impact the Company’s ability to borrow money in the future. Additional financing or refinancing might not be available and, if available, may not be at economically favorable terms. Further, an increase in leverage could lead to deterioration in our credit ratings. A reduction in our credit ratings, regardless of the cause, could also limit our ability to obtain additional financing and/or increase our cost of obtaining financing. There is no guarantee we will be able to access the capital markets at financially economical interest rates, which could negatively affect our business.
| Celebrating 25 Years as a Public Company | | Form 10-K ♦ Page 21 |
Part I ♦ Item 1A – Risk Factors
We may be required to obtain financing in order to fund certain strategic acquisitions, if they arise, or to refinance our outstanding debt. It is possible a large strategic acquisition would require that we issue both newly issued equity and debt securities in order to maintain our investment grade credit rating and could result in a ratings downgrade notwithstanding our issuance of equity securities to fund the transaction. We are also exposed to risks from tightening credit markets, through the interest payable on our outstanding variable-rate debt and the interest cost on future borrowings under our credit facilities. While management believes our credit ratings will remain at a composite investment-grade level, we cannot be assured these ratings will remain at those levels. While management believes the Company will continue to have credit available to it adequate to meet its needs, there can be no assurance of that.
Our Magnesia Specialties business faces currency risks from its overseas operations.
Our Magnesia Specialties business sells some of its products outside the United States. Therefore, the operations of the Magnesia Specialties business are affected from time to time by the fluctuating values of the currency exchange rates of the countries in which it does business in relation to the value of the U.S. Dollar. The business tries to mitigate the short-term effects of currency exchange rates by primarily denominating sales in the U.S. Dollar. This still leaves the business subject to certain risks, depending on the strength of the U.S. Dollar. In 2019, the strength of the U.S. Dollar in foreign markets negatively affected the overall price of the products of the Magnesia Specialties business when compared to foreign-domiciled competitors.
Unexpected equipment failures, catastrophic events and scheduled maintenance may lead to production curtailments or shutdowns.
Our manufacturing processes are dependent upon critical pieces of equipment, such as our kilns and finishing mills. This equipment, on occasion, may be out of service as a result of failures or damage during accidents. In addition to equipment failures, our facilities are also subject to the risk of catastrophic loss due to unanticipated events such as fires, explosions or violent weather conditions. We have one- to two-week scheduled outages at least once a year to refurbish our cement and dolomitic lime production facilities. In 2019, the cement product line incurred shutdown costs of $26.3 million during the year. In 2019, the Magnesia Specialties business incurred shutdown costs of $4.4 million during the year. Any significant interruption in production capability may require us to make significant capital expenditures to remedy problems or damage as well as cause us to lose revenue due to lost production time.
Our paving operations present additional risks to our business.
Our paving operations face challenges when our contracts have penalties for late completion. In some instances, including many of our fixed-price contracts, we guarantee project completion by a certain date. If we subsequently fail to complete the project as scheduled, we may be held responsible for costs resulting from the delay, generally in the form of contractually agreed-upon liquidated damages. Under these circumstances, the total project cost could exceed our original estimate, and we could experience a loss of profit or a loss on the project. In our paving operations, we also have fixed-price and fixed-unit-price contracts where our profits can be adversely affected by a number of factors beyond our control, which can cause our actual costs to materially exceed the costs estimated at the time of our original bid. These same issues and risks can also impact some of our contacts in our asphalt and ready mixed concrete operations. These risks are somewhat mitigated by the fact that a majority of our road paving contracts are for short duration projects.
Our ready mixed concrete and asphalt and paving product lines have lower profit margins and operating results can be more volatile.
Our ready mixed concrete and asphalt and paving businesses typically generate lower profit margins than our aggregates and cement product lines due to potentially volatile input costs, highly competitive market dynamics, and lower barriers to entry. Therefore, if we expand these operations, our consolidated gross margin would likely be adversely affected. Our overall ready mixed concrete and asphalt and paving operations’ gross margin was 10.4% for 2019 and 10.3% for 2018. The overall gross margin of our Building Materials business will continue to be reduced by the lower gross margins for our ready mixed concrete and asphalt and paving product lines.
| Form 10-K ♦ Page 22 | | Celebrating 25 Years as a Public Company |
|---|
Part I ♦ Item 1A – Risk Factors
Suppliers, Raw Materials, and Energy Costs Risk Factors
Short supplies and high costs of fuel, energy and raw materials affect our businesses.
Our businesses require a continued supply of diesel fuel, natural gas, coal, petroleum coke and other energy. The financial results of these businesses have been affected by the short supply or high costs of these fuels and energy. Changes in energy costs also affect the prices that the Company pays for related supplies, including explosives, conveyor belting and tires. While we can contract for some fuels and sources of energy, such as fixed-price supply contracts for coal and petroleum coke, significant increases in costs or reduced availability of these items have and may in the future reduce our financial results. Moreover, fluctuations in the supply and costs of these fuels and energy can make planning for our businesses more difficult. Because of the fluctuating trends in diesel fuel prices, we may enter into fixed-price fuel agreements from time to time for a portion of our diesel fuel to reduce our diesel fuel price risk. Our last fixed-price commitment for a portion of our diesel fuel requirements expired at the end of 2016.
The average cost per gallon of diesel fuel was $2.08, $2.29, and $1.81 in 2019, 2018, and 2017, respectively. For 2019, the average cost per MCF (thousand cubic feet) for natural gas decreased 4.7% versus 2018, which had decreased approximately 4% from 2017 levels.
The Company’s Magnesia Specialties business has fixed-price agreements for 62% of its 2020 coal, natural gas, and petroleum coke needs. The cement operations have fixed-price agreements for a portion of their 2020 coal and natural gas needs.
Cement production requires large amounts of energy, including electricity and fossil fuels. Energy costs represented approximately 22% of the 2019 direct production costs of our cement product line. Therefore, the cost of energy is one of our largest expenses. Prices for energy are subject to market forces largely beyond our control and can be quite volatile. Price increases that we are unable to pass through in the form of price increases for our products, or disruption of the uninterrupted supply of fuel and electricity, could adversely affect us. Accordingly, volatility in energy costs can adversely affect the financial results of our cement product line. Profitability of the cement product line is also subject to kiln maintenance, which requires the plant to be shut down for a period of time as repairs are made. The cement product line incurred shutdown costs of $26.3 million and $17.3 million during 2019 and 2018, respectively.
Similarly, our ready mixed concrete and asphalt and paving operations also require a continued supply of liquid asphalt and cement, which serve as key raw materials in the production of hot mix asphalt and ready mixed concrete, respectively. Some of these raw materials we produce internally, but most are purchased from third parties. These purchased raw materials are subject to potential supply constraints and significant price fluctuations, which are beyond our control. The financial results of our ready mixed concrete and asphalt and paving operations have been affected by the short supply or high costs of these raw materials. We generally see frequent volatility in the costs for these raw materials. Liquid asphalt prices were higher in 2019 than in 2018. Liquid asphalt prices may not always follow other energy products (e.g., oil or diesel fuel) because of complexities in the refining process, which converts a barrel of oil into other fuels and petrochemical products.
Cement is sensitive to supply and price volatility.
Cement competition is often based primarily on price, which is highly sensitive to changes in supply and demand. Prices may fluctuate significantly in response to relatively minor changes in supply and demand, general economic conditions and other market conditions, which we cannot control. When cement producers increase production capacity or more cement is imported into the market, an oversupply of cement in the market may occur if supply exceeds demand. In that case cement prices generally decline. We cannot be assured that prices for our cement products sold will not decline in the future or that such decline will not have a material adverse effect on our cement product line.
Our Magnesia Specialties business depends in part on the steel industry and the supply of reasonably priced fuels.
Our Magnesia Specialties business sells some of its products to companies in the steel industry. While we have reduced this risk over the last few years, this business is still dependent, in part, on the strength of the cyclical steel industry. The Magnesia Specialties business also requires significant amounts of natural gas, coal, and petroleum coke, and financial results are negatively affected by increases in fuel prices or shortages.
| Celebrating 25 Years as a Public Company | | Form 10-K ♦ Page 23 |
Part I ♦ Item 1A – Risk Factors
Cyber and Information Security Risk Factors
We are dependent on information technology and our systems and infrastructure face certain risks, including cybersecurity risks and data leakage risks.
We are dependent on information technology systems and infrastructure, including reliance on third-party vendors and third-party software. Any significant breakdown, invasion, destruction or interruption of these systems by employees, others with authorized access to our systems, or unauthorized persons could negatively impact operations. There is also a risk that we could experience a business interruption, theft of information or reputational damage as a result of a cyber-attack, such as an infiltration of a data center, or data leakage of confidential information either internally or at our third-party providers. While we have invested in the protection of our data and information technology to reduce these risks and routinely test the security of our information systems network, we cannot assure you that our efforts will prevent breakdowns or breaches in our systems that could adversely affect our business.
Other Risk Factors
Delays or interruptions in shipping products of our businesses could affect our operations.
Transportation logistics play an important role in allowing us to supply products to our customers, whether by truck, rail or water. We also rely heavily on third-party truck and rail transportation to ship coal, natural gas and other fuels to our plants. Any significant delays, disruptions, or the non-availability of our transportation support system could negatively affect our operations. Transportation operations are subject to capacity constraints, high fuel costs and various hazards, including extreme weather conditions and slowdowns due to labor strikes and other work stoppages. In Texas, we compete for third-party trucking services with operations in the oil and gas fields, which can significantly constrain the availability of those services to us. If there are material changes in the availability or cost of transportation services, we may not be able to arrange alternative and timely means to ship our products or fuels at a reasonable cost, which could lead to interruptions or slowdowns in our businesses or increases in our costs.
The availability of rail cars can also affect our ability to transport our products. Rail cars can be used to transport many different types of products across all of our segments. If owners sell or lease rail cars for use in other industries, we may not have enough rail cars to transport our products.
We have long-term agreements with shipping companies to provide ships to transport our aggregates products from our Bahamas and Nova Scotia operations to various coastal ports. These contracts have varying expiration dates ranging from 2023 to 2027 and generally contain renewal options. Our inability to renew these agreements or enter into new ones with other shipping companies could affect our ability to transport our products.
Some of our product is distributed by barge along rivers in Ohio and West Virginia. We may continue to experience, to a lesser degree, risks associated with distributing our products by barges, including significant delays, disruptions or the non-availability of our barge transportation system that could negatively affect our operations, water levels that could affect our ability to transport our products by barge, and barges that may not be available in quantities that we might need from time to time to support our operations.
Our articles of incorporation and bylaws and North Carolina law may inhibit a change in control that you may favor.
Our restated articles of incorporation and restated bylaws and North Carolina law contain provisions that may delay, deter or inhibit a future acquisition of us not approved by our Board of Directors. This could occur even if our shareholders are offered an attractive value for their shares or if many or even a majority of our shareholders believe the takeover is in their best interest. These provisions are intended to encourage any person interested in acquiring us to negotiate with and obtain the approval of our Board of Directors in connection with the transaction. Provisions that could delay, deter, or inhibit a future acquisition include the following:
| • | the ability of the Board of Directors to establish the terms of, and issue, preferred stock without shareholder approval; |
|---|
| • | the requirement that our shareholders may only remove directors for cause; |
|---|
| Form 10-K ♦ Page 24 | | Celebrating 25 Years as a Public Company |
|---|
Part I ♦ Item 1A – Risk Factors
| • | the inability of shareholders to call special meetings of shareholders; and |
|---|
| • | super-majority shareholder approval requirements for business combination transactions with certain five percent shareholders. |
|---|
Additionally, the occurrence of certain change-of-control events could result in an event of default under certain of our existing or future debt instruments.
Item 1B. UNRESOLVED STAFF COMMENTS
There are no unresolved written comments that were received from the staff of the SEC one hundred and eighty (180) days or more before the end of our fiscal year relating to our periodic or current reports under the Exchange Act.
Item 2. PROPERTIES
Building Materials Business
As of December 31, 2019, the Company processed or shipped aggregates from more than 300 quarries, underground mines, and distribution yards in 27 states, Canada, and the Bahamas, of which 124 are located on land owned by the Company free of major encumbrances, 59 are on land owned in part and leased in part, 109 are on leased land, and 10 are on facilities neither owned nor leased, where raw materials are removed under an agreement. The Company’s aggregates reserves, on the average, represent 89 years at current production levels. However, certain locations may be subject to more limited reserves and may not be able to expand. In addition, as of December 31, 2019, the Company processed and shipped ready mixed concrete and/or asphalt products from 148 properties in five states, of which 124 are located on land owned by the Company free of major encumbrances, one is on land owned in part and leased in part, and 23 are on leased land.
The Company uses various drilling methods, depending on the type of aggregate, to estimate aggregates reserves that are economically mineable. The extent of drilling varies and depends on whether the location is a potential new site (“greensite”), an existing location, or a potential acquisition. More extensive drilling is performed for potential greensites and acquisitions, and in rare cases, the Company may rely on existing geological data or results of prior drilling by third parties. Subsequent to drilling, selected core samples are tested for soundness, abrasion resistance, and other physical properties relevant to the aggregates industry. If the reserves meet the Company’s standards and are economically mineable, then they are either leased or purchased.
The Company estimates proven and probable reserves based on the results of drilling. Proven reserves are reserves of deposits designated using closely spaced drill data, and based on that data the reserves are believed to be relatively homogenous. Proven reserves have a certainty of 85% to 90%. Probable reserves are reserves that are inferred utilizing fewer drill holes and/or assumptions about the economically mineable reserves based on local geology or drill results from adjacent properties. The degree of certainty for probable reserves is 70% to 75%. In determining the amount of reserves, the Company’s policy is to not include calculations that exceed certain depths, so for deposits, such as granite, that typically continue to depths well below the ground, there may be additional deposits that are not included in the reserve calculations. The Company also deducts reserves not available due to property boundaries, set-backs, and plant configurations, as deemed appropriate when estimating reserves. The Company uses the same methods of analysis to evaluate and estimate the amount of its aggregates reserves used in the cement manufacturing process for its cement product line as it does for its aggregates product line. For additional information on the Company’s assessment of reserves, see “Management’s Discussion and Analysis of Financial Condition and Results of Operations – Other Financial Information - Critical Accounting Policies and Estimates - Property, Plant and Equipment” included under Article 7, “Management’s Discussion and Analysis of Financial Condition and Results of Operations,” of this Form 10-K.
Set forth in the tables below are the Company’s estimates of reserves of recoverable aggregates (hard rock and sand and gravel) of suitable quality for economic extraction, shown on a state-by-state basis, and the Company’s total annual production for the last three years, along with the Company’s estimate of years of production available, shown on a segment-by-segment basis. The number of producing quarries shown on the table includes underground mines. The Company’s reserve estimates for the last two years are shown for comparison purposes on a state-by-state basis. The changes in reserve estimates at a particular state level from year to year reflect the tonnages of reserves on locations that have been opened or closed during the year, whether by acquisition, disposition, or otherwise; production and sales in the normal course of business; additional reserve estimates or refinements of the Company’s existing reserve estimates; opening of additional reserves at existing locations; the depletion of reserves at existing locations; and other factors. The Company evaluates its
| Celebrating 25 Years as a Public Company | | Form 10-K ♦ Page 25 |
Part I ♦ Item 2 – Properties
reserve estimates primarily on a Company-wide, or segment-by-segment basis, and does not believe comparisons of changes in reserve estimates on a state-by-state basis from year to year are particularly meaningful. The Company’s estimate of reserves shown in the tables below include reserves used in the Company’s cement product line and Magnesia Specialties business.
| State | Number of Producing Quarries | Tonnage of Reserves for each general type of aggregate at 12/31/18 (in thousands) | Tonnage of Reserves for each general type of aggregate at 12/31/19 (in thousands) | Change in Tonnage from 2018 (in thousands) | Percentage of aggregate reserves located at an existing quarry, and reserves not located at an existing quarry. | Percentage of aggregate reserves on land that has not been | Percent of reserves owned and percent leased | |||||||||||||||||||||||||||||||||||||||
|---|---|---|---|---|---|---|---|---|---|---|---|---|---|---|---|---|---|---|---|---|---|---|---|---|---|---|---|---|---|---|---|---|---|---|---|---|---|---|---|---|---|---|---|---|---|---|
| 2019 | Hard Rock | S & G | Hard Rock | S & G | Hard Rock | S & G | At Quarry | Not at Quarry | zoned for quarrying.* ** | Owned | Leased | |||||||||||||||||||||||||||||||||||
| Alabama | 4 | 174,754 | 11,623 | 171,371 | 11,623 | (3,382 | ) | 0 | 100 | % | 0% | 0% | 55% | 45% | ||||||||||||||||||||||||||||||||
| Arkansas | 3 | 230,811 | 0 | 242,504 | 0 | 11,692 | 0 | 100 | % | 0% | 0% | 48% | 52% | |||||||||||||||||||||||||||||||||
| Colorado | 10 | 754,812 | 117,204 | 750,309 | 182,829 | (4,503 | ) | 65,625 | 91 | % | 9% | 0% | 19% | 81% | ||||||||||||||||||||||||||||||||
| Florida | 1 | 122,724 | 0 | 122,022 | 0 | (702 | ) | 0 | 100 | % | 0% | 0% | 36% | 64% | ||||||||||||||||||||||||||||||||
| Georgia | 18 | 2,185,263 | 19,380 | 2,168,486 | 18,813 | (16,777 | ) | 568 | 97 | % | 3% | 0% | 83% | 17% | ||||||||||||||||||||||||||||||||
| Indiana | 10 | 481,120 | 60,392 | 476,879 | 73,678 | (4,240 | ) | 13,286 | 100 | % | 0% | 0% | 52% | 48% | ||||||||||||||||||||||||||||||||
| Iowa | 25 | 727,232 | 21,802 | 703,737 | 19,852 | (23,495 | ) | 1,951 | 100 | % | 0% | 0% | 30% | 70% | ||||||||||||||||||||||||||||||||
| Kansas | 3 | 75,210 | 0 | 68,928 | 0 | (6,283 | ) | 0 | 100 | % | 0% | 8% | 40% | 60% | ||||||||||||||||||||||||||||||||
| Kentucky | 6 | 179,959 | 24,206 | 177,666 | 21,641 | (2,293 | ) | 2,565 | 100 | % | 0% | 0% | 70% | 30% | ||||||||||||||||||||||||||||||||
| Louisiana | 2 | 0 | 7,830 | 0 | 7,545 | 0 | 285 | 100 | % | 0% | 0% | 0% | 100% | |||||||||||||||||||||||||||||||||
| Maryland | 8 | 883,671 | 6,902 | 876,493 | 6,636 | (7,178 | ) | 266 | 100 | % | 0% | 0% | 99% | 1% | ||||||||||||||||||||||||||||||||
| Minnesota | 2 | 320,612 | 0 | 295,629 | 0 | (24,983 | ) | 0 | 64 | % | 36% | 0% | 50% | 50% | ||||||||||||||||||||||||||||||||
| Mississippi | 0 | 0 | 67,238 | 0 | 67,238 | 0 | 0 | 100 | % | 0% | 0% | 100% | 0% | |||||||||||||||||||||||||||||||||
| Missouri | 3 | 347,721 | 0 | 340,588 | 0 | (7,133 | ) | 0 | 90 | % | 10% | 0% | 5% | 95% | ||||||||||||||||||||||||||||||||
| Nebraska | 6 | 158,074 | 23,851 | 157,475 | 30,476 | (600 | ) | 6,895 | 100 | % | 0% | 0% | 47% | 53% | ||||||||||||||||||||||||||||||||
| Nevada | 1 | 134,507 | 0 | 133,814 | 0 | (693 | ) | 0 | 99 | % | 1% | 0% | 92% | 8% | ||||||||||||||||||||||||||||||||
| North Carolina | 37 | 3,367,662 | 1,696 | 3,324,826 | 1,630 | (42,836 | ) | 67 | 74 | % | 26% | 0% | 74% | 26% | ||||||||||||||||||||||||||||||||
| Ohio*** | 11 | 571,805 | 115,656 | 566,887 | 102,932 | (4,918 | ) | 12,724 | 44 | % | 56% | 0% | 96% | 4% | ||||||||||||||||||||||||||||||||
| Oklahoma | 9 | 1,191,901 | 11,647 | 1,174,891 | 11,571 | (17,010 | ) | 76 | 100 | % | 0% | 0% | 86% | 14% | ||||||||||||||||||||||||||||||||
| Pennsylvania | 1 | 4,531 | 0 | 4,331 | 0 | (200 | ) | 0 | 100 | % | 0% | 0% | 100% | 0% | ||||||||||||||||||||||||||||||||
| South Carolina | 10 | 773,008 | 77,893 | 767,473 | 75,773 | (5,535 | ) | 2,120 | 97 | % | 3% | 0% | 82% | 18% | ||||||||||||||||||||||||||||||||
| Tennessee | 2 | 104,066 | 0 | 13,372 | 0 | (724 | ) | 0 | 100 | % | 0% | 0% | 36% | 64% | ||||||||||||||||||||||||||||||||
| Texas**** | 25 | 2,481,790 | 137,278 | 2,458,474 | 137,069 | (23,317 | ) | 209 | 100 | % | 0% | 0% | 61% | 39% | ||||||||||||||||||||||||||||||||
| Utah | 1 | 22,147 | 0 | 21,566 | 0 | (582 | ) | 0 | 100 | % | 0% | 0% | 0% | 100% | ||||||||||||||||||||||||||||||||
| Virginia | 5 | 333,860 | 0 | 328,653 | 0 | (5,207 | ) | 0 | 100 | % | 0% | 0% | 60% | 40% | ||||||||||||||||||||||||||||||||
| Washington | 2 | 6,274 | 17,097 | 1,014 | 16,853 | (5,260 | ) | 245 | 100 | % | 0% | 0% | 94% | 6% | ||||||||||||||||||||||||||||||||
| West Virginia | 1 | 23,243 | 0 | 16,425 | 0 | (6,818 | ) | 0 | 100 | % | 0% | 0% | 66% | 34% | ||||||||||||||||||||||||||||||||
| Wyoming | 2 | 153,092 | 0 | 150,418 | 0 | (2,674 | ) | 0 | 100 | % | 0% | 0% | 43% | 57% | ||||||||||||||||||||||||||||||||
| U. S. Total | 208 | 15,809,851 | 721,427 | 15,604,202 | 786,158 | (205,648 | ) | 64,732 | 91 | % | 9% | 0% | 67% | 33% | ||||||||||||||||||||||||||||||||
| Non-U. S. | 2 | 840,939 | 0 | 833,010 | 0 | (7,929 | ) | 0 | 100 | % | 0% | 0% | 97% | 3% | ||||||||||||||||||||||||||||||||
| Grand Total | 210 | 16,650,790 | 721,427 | 16,437,213 | 786,158 | (213,577 | ) | 64,732 |
| * | The Company calculates its aggregate reserves for purposes of this table based on land that has been zoned for quarrying and land for which the Company has determined zoning is not required. |
|---|
| ** | The Company may own additional land adjacent or near existing quarries on which reserves may be located but does not include such reserves in these calculations if zoning is required but has not been obtained. |
|---|
| *** | The Company's reserves presented in the State of Ohio include dolomitic limestone reserves used in the business of the Magnesia Specialties segment. |
|---|
| **** | The Company's reserves presented in the State of Texas include limestone reserves used in the business of the cement product line. |
|---|
| Form 10-K ♦ Page 26 | | Celebrating 25 Years as a Public Company |
|---|
Part I ♦ Item 2 – Properties
| Total Annual Production (in tons) (in thousands) For year ended December 31 | Number of years of production available at December 31, | |||||||||||||||
|---|---|---|---|---|---|---|---|---|---|---|---|---|---|---|---|---|
| Reportable Segment | 2019 | 2018 | 2017 | 2019 | ||||||||||||
| Mid-America Group | 91,108 | 78,137 | 70,340 | 89 | ||||||||||||
| Southeast Group | 28,465 | 25,328 | 22,274 | 123 | ||||||||||||
| West Group | 74,483 | 71,538 | 74,184 | 75 | ||||||||||||
| Total Aggregates Product Line | 194,056 | 175,003 | 166,798 | 89 |
Cement Product Line
As of December 31, 2019, the Company, through its subsidiaries, processed or shipped cement from seven properties in two states, of which five are located on land owned by the Company free of major encumbrances and two are on leased land. The Company’s cement product line has production facilities located at two sites in Texas: Midlothian, Texas, south of Dallas/Fort Worth; and Hunter, Texas, north of San Antonio. The following table summarizes certain information about the Company’s cement manufacturing facilities at December 31, 2019:
| Plant | Rated Annual Productive Capacity-Tons of Clinker | Manufacturing Process | Service Date | Internally Estimated Minimum Reserves—Years | ||||||||
|---|---|---|---|---|---|---|---|---|---|---|---|---|
| Midlothian, TX | 2,400,000 | Dry | 2001 | 65 | ||||||||
| Hunter, TX | 2,100,000 | Dry | 2013, 1981 | 140 | ||||||||
| Total | 4,500,000 |
Reserves identified with the facilities shown above are contained on approximately 2,844 acres of land owned by the Company. As of December 31, 2019, the Company estimated its total proven and probable limestone reserves on such land to be approximately 687 million tons.
The Company’s cement manufacturing facilities include kilns, crushers, pre-heaters/calciners, coolers, finish mills and other equipment used to process limestone and other raw materials into cement, as well as equipment used to extract and transport the limestone from the adjacent quarries. These cement manufacturing facilities are served by rail and truck.
As of December 31, 2019, the Company, through its subsidiaries, also operated, directly or through third parties, four cement distribution terminals and owned the real estate at the California cement grinding and packaging facility it sold on September 30, 2015, which it expects to sell for non-cement use.
Magnesia Specialties Business
The Magnesia Specialties business currently operates major manufacturing facilities in Manistee, Michigan, and Woodville, Ohio. Both of these facilities are owned.
Other Properties
The Company’s principal corporate office, which it owns, is located in Raleigh, North Carolina. The Company owns and leases various administrative offices for its five reportable business segments.
Condition and Utilization
The Company’s principal properties, which are of varying ages and are of different construction types, are believed to be generally in good condition, are generally well maintained, and are generally suitable and adequate for the purposes for which they are used.
| Celebrating 25 Years as a Public Company | | Form 10-K ♦ Page 27 |
|---|---|---|
Part I ♦ Item 2 – Properties
During 2019, the principal properties of the aggregates product line were believed to be utilized at average productive capacities of approximately 75% to 80% and were capable of supporting a higher level of market demand. The Company adjusts its production schedules to meet volume demand for its products. For example, during the Great Recession the Company reduced operating hours at a number of its facilities, closed some of its facilities, and temporarily idled some of its facilities. When business improved, the Company was able to gradually resume production at its normalized levels and increase production again as demand for its products increased.
During 2019, the Texas cement plants operated on average at 80% to 85% utilization. The Portland Cement Association (“PCA”) has projected that cement consumption will slow modestly in 2020 from 2019, with the rate of change decreasing in 2020 to 1.7% from 2.4% in 2019. The cement product line’s leadership, in collaboration with the aggregates and ready mixed concrete teams, have developed strategic plans regarding interplant efficiencies, as well as tactical plans addressing plant utilization and efficiency. Due to the “24/7/365” nature of cement operations, significant gains in plant utilization and efficiency are typically achieved only during plant shutdowns.
The Company expects future organic earnings growth to result from increased pricing, rationalization of the current assets and portfolio and/or further cost reductions. In the current operating environment, where steel utilization is at levels close to or below 70% and the strength of the United States dollar pressures product competitiveness in international markets, any unplanned change in costs or customers introduces volatility to the earnings of the Magnesia Specialties segment. The dolomitic lime business of the Magnesia Specialties segment operated at 80% utilization in 2019.
Item 3. LEGAL PROCEEDINGS
From time to time claims of various types are asserted against the Company arising out of its operations in the normal course of business, including claims relating to land use and permits, safety, health, and environmental matters (such as noise abatement, blasting, vibrations, air emissions, and water discharges). Such matters are subject to many uncertainties, and it is not possible to determine the probable outcome of, or the amount of liability, if any, from, these matters. In the opinion of management of the Company (which opinion is based in part upon consideration of the opinion of counsel), based upon currently-available facts, it is remote that the ultimate outcome of any litigation and other proceedings will have a material adverse effect on the overall results of the Company's operations, its cash flows, or its financial condition. However, we cannot assure you that an adverse outcome in any of such litigation would not have a material adverse effect on the Company or its operating segments.
The Company was not required to pay any penalties in 2019 for failure to disclose certain “reportable transactions” under Section 6707A of the Internal Revenue Code.
See also “Note O: Commitments and Contingencies” of the “Notes to Financial Statements” of the Company’s consolidated financial statements included under Item 8, “Financial Statements and Supplemental Data,” of this Form 10-K and the “Environmental Regulation and Litigation” section included under Item 7, “Management’s Discussion and Analysis of Financial Condition and Results of Operations,” of this Form 10-K.
Item 4. MINE SAFETY DISCLOSURES
The information concerning mine safety violations or other regulatory matters required by Section 1503(a) of the Dodd-Frank Wall Street Reform and Consumer Protection Act and Item 104 of Regulation S-K (17 CFR 229.104) is included in Exhibit 95 to this Form 10-K.
| Form 10-K ♦ Page 28 | | Celebrating 25 Years as a Public Company |
|---|
Part I ♦ Information About Our Executive Officers
In****formation about our Executive Officers
The following sets forth certain information regarding the executive officers of Martin Marietta as of February 21, 2020:
| Name | Age | Present Position | Year Assumed Present Position | Other Positions and Other Business Experience Within the Last Five Years |
|---|---|---|---|---|
| C. Howard Nye | 57 | Chairman of the Board; | 2014 | |
| Chief Executive Officer; | 2010 | |||
| President; | 2006 | |||
| President of Aggregates | 2010 | |||
| Business; | ||||
| Chairman of Magnesia | 2007 | |||
| Specialties Business | ||||
| James A. J. Nickolas | 49 | Senior Vice President, Chief Financial Officer | 2017 | Principal Accounting Officer (March 2019- May 2019); Head, Corporate Development and Caterpillar Ventures, Caterpillar Inc. (January-July 2017), Group Chief Financial Officer of Caterpillar’s Resources Industries segment (October 2014-December 2016) |
| Roselyn R. Bar | 61 | Executive Vice President; | 2015 | Senior Vice President (2005-2015) |
| General Counsel; | 2001 | |||
| Corporate Secretary | 1997 | |||
| Robert J. Cardin | 56 | Senior Vice President; Controller, and Chief Accounting Officer | 2019 | Vice President (March 2019-May 2019); Chief Accounting Officer, SWM International (2013-2019), Interim CFO, SWM International (April 2015-October 2015) |
| Daniel L. Grant | 65 | Senior Vice President, Strategy & Development | 2013 | |
| Craig M. LaTorre | 52 | Senior Vice President, Chief Human Resource Officer | 2019 | Vice President, Human Resources (July 2018-March 2019); Senior Vice President; and Chief Human Resources Officer (2013-2018), Andeavor (formerly known as Tesoro Corporation) |
| John P. Mohr | 55 | Senior Vice President, | 2017 | Vice President (2015-2017); |
| Chief Information Officer | 2015 | Vice President, Information Services, Liggett Vector Brands (2007-2015) |
| Celebrating 25 Years as a Public Company | | Form 10-K ♦ Page 29 |
Part II ♦ Item 5 – Market for Registrant’s Common Equity, Related Stockholder Matters and Issuer Purchases of Equity Securities
PART II
Item 5. MARKET FOR REGISTRANT’S COMMON EQUITY, RELATED STOCKHOLDER MATTERS AND ISSUER PURCHASES OF EQUITY SECURITIES
Market Information and Holders
The Company’s common stock, $.01 par value, is traded on the New York Stock Exchange (“NYSE”) (Symbol: MLM). There were 834 holders of record of the Company’s common stock as of February 14, 2020.
Common Stock Performance Graph
The following graph and accompanying table compare the seven-year cumulative total return from December 31, 2012 to December 31, 2019 for (a) the Company’s common stock, (b) the Standard & Poor’s 500 Composite Stock Index, and (c) the Standard & Poor’s 500 Materials Index.

| Form 10-K ♦ Page 30 | | Celebrating 25 Years as a Public Company |
|---|
Part II ♦ Item 5 – Market for Registrant’s Common Equity, Related Stockholder Matters and Issuer Purchases of Equity Securities
Recent Sales of Unregistered Securities
None.
Issuer Purchases of Equity Securities
| Period | Total Number of Shares Purchased | Average Price Paid per Share | Total Number of Shares Purchased as Part of Publicly Announced Plans or Programs1 | Maximum Number of Shares that May Yet be Purchased Under the Plans or Programs | ||||||||||||
|---|---|---|---|---|---|---|---|---|---|---|---|---|---|---|---|---|
| October 1, 2019 — October 31, 2019 | 20,290 | $ | 264.86 | 20,290 | 13,865,827 | |||||||||||
| November 1, 2019 — November 30, 2019 | 62,752 | $ | 258.09 | 62,752 | 13,803,075 | |||||||||||
| December 1, 2019 — December 31, 2019 | 71,507 | $ | 270.99 | 71,507 | 13,731,568 | |||||||||||
| Total | 154,549 | $ | 264.95 | 154,549 | 13,731,568 |
| 1 | The Company’s stock repurchase program, which currently authorizes the repurchase of 20 million shares of common stock, is approved by the Board of Directors from time to time, and updated as appropriate by the Board of Directors, and announced to the public by press release. The latest announcement on this topic was the Company’s press release dated February 10, 2015 that its Board of Directors had authorized the repurchase of up to 20 million shares of its outstanding common stock, which included 5 million shares authorized under the Company’s previous share repurchase program. Previous press releases announcing prior share repurchase programs and the related amounts of common stock included under the share repurchase authorizations were as follows: (i) press release dated August 15, 2007 (5 million shares); (ii) press release dated February 22, 2006 (5 million shares); and (iii) May 6, 1994 (2.5 million shares). |
|---|
| Celebrating 25 Years as a Public Company | | Form 10-K ♦ Page 31 |
Part II ♦ Item 6 – Selected Financial Data
Item 6. – SELECTED FINANCIAL DATA
The selected financial data below should be read in conjunction with Item 7 of this Form 10-K, “Management’s Discussion and Analysis of Financial Condition and Results of Operations,” as well as the Company’s consolidated financial statements and related notes included under Item 8, “Financial Statements and Supplemental Data,” of this Form 10-K.
Five Year Selected Financial Data
| (in millions, except per share data) | 2019 | 2018 | 2017 | 2016 | 2015 | |||||||||||||||
|---|---|---|---|---|---|---|---|---|---|---|---|---|---|---|---|---|---|---|---|---|
| Consolidated Operating Results | ||||||||||||||||||||
| Products and services revenues1 | $ | 4,422.3 | $ | 3,980.4 | $ | 3,723.5 | $ | 3,578.6 | $ | 3,269.2 | ||||||||||
| Freight revenues1 | 316.8 | 263.9 | 242.1 | 240.1 | 270.4 | |||||||||||||||
| Total revenues | 4,739.1 | 4,244.3 | 3,965.6 | 3,818.7 | 3,539.6 | |||||||||||||||
| Cost of revenues - products and services | 3,239.1 | 3,009.8 | 2,749.5 | 2,665.0 | 2,541.2 | |||||||||||||||
| Cost of revenues - freight | 321.0 | 267.9 | 244.2 | 242.0 | 271.5 | |||||||||||||||
| Total cost of revenues2 | 3,560.1 | 3,277.7 | 2,993.7 | 2,907.0 | 2,812.7 | |||||||||||||||
| Gross Profit2 | 1,179.0 | 966.6 | 971.9 | 911.7 | 726.9 | |||||||||||||||
| Selling, general and administrative expenses2 | 302.7 | 280.6 | 262.1 | 241.6 | 210.8 | |||||||||||||||
| Acquisition-related expenses, net | 0.5 | 13.5 | 8.6 | 0.9 | 6.3 | |||||||||||||||
| Other operating (income) and expenses, net | (9.1 | ) | (18.2 | ) | 0.8 | (8.1 | ) | 15.6 | ||||||||||||
| Earnings from Operations2 | 884.9 | 690.7 | 700.4 | 677.3 | 494.2 | |||||||||||||||
| Interest expense | 129.3 | 137.1 | 91.5 | 81.7 | 76.3 | |||||||||||||||
| Other nonoperating expenses and (income), net2 | 7.3 | (22.5 | ) | (10.0 | ) | (11.4 | ) | 4.1 | ||||||||||||
| Earnings before income tax expense (benefit) | 748.3 | 576.1 | 618.9 | 607.0 | 413.8 | |||||||||||||||
| Income tax expense (benefit) | 136.3 | 105.7 | (94.5 | ) | 181.6 | 124.9 | ||||||||||||||
| Consolidated net earnings | 612.0 | 470.4 | 713.4 | 425.4 | 288.9 | |||||||||||||||
| Less: Net earnings attributable to noncontrolling interests | 0.1 | 0.4 | 0.1 | — | 0.1 | |||||||||||||||
| Net Earnings Attributable to Martin Marietta | $ | 611.9 | $ | 470.0 | $ | 713.3 | $ | 425.4 | $ | 288.8 | ||||||||||
| Net Earnings Attributable to Martin Marietta Per Common Share (see Note A): | ||||||||||||||||||||
| Basic attributable to common shareholders | $ | 9.77 | $ | 7.46 | $ | 11.30 | $ | 6.66 | $ | 4.31 | ||||||||||
| Diluted attributable to common shareholders | $ | 9.74 | $ | 7.43 | $ | 11.25 | $ | 6.63 | $ | 4.29 | ||||||||||
| Cash Dividends Per Common Share | $ | 2.06 | $ | 1.84 | $ | 1.72 | $ | 1.64 | $ | 1.60 |
| (in millions) | 2019 | 20183 | 20173 | 2016 | 2015 | |||||||||||||||
| Condensed Consolidated Balance Sheet Data | ||||||||||||||||||||
| Total current assets4 | $ | 1,426.7 | $ | 1,365.8 | $ | 2,631.2 | $ | 1,086.4 | $ | 1,081.6 | ||||||||||
| Property, plant and equipment, net | 5,206.0 | 5,157.2 | 3,592.8 | 3,423.4 | 3,156.0 | |||||||||||||||
| Goodwill | 2,396.8 | 2,399.1 | 2,160.3 | 2,159.3 | 2,068.2 | |||||||||||||||
| Other intangibles, net | 486.8 | 501.3 | 506.3 | 511.3 | 510.6 | |||||||||||||||
| Other noncurrent assets4,5 | 615.3 | 128.0 | 101.9 | 120.5 | 141.2 | |||||||||||||||
| Total Assets | $ | 10,131.6 | $ | 9,551.4 | $ | 8,992.5 | $ | 7,300.9 | $ | 6,957.6 | ||||||||||
| Current liabilities – other5 | $ | 498.5 | $ | 396.7 | $ | 394.3 | $ | 366.6 | $ | 347.9 | ||||||||||
| Current maturities of long-term debt4 | 340.0 | 390.0 | 299.9 | 180.0 | 18.7 | |||||||||||||||
| Long-term debt4 | 2,433.6 | 2,730.4 | 2,727.3 | 1,506.1 | 1,550.1 | |||||||||||||||
| Deferred income taxes, net | 733.0 | 705.6 | 410.7 | 663.0 | 583.5 | |||||||||||||||
| Other noncurrent liabilities5 | 773.2 | 379.3 | 477.8 | 442.6 | 397.2 | |||||||||||||||
| Shareholders’ equity | 5,350.8 | 4,946.4 | 4,679.7 | 4,140.0 | 4,057.3 | |||||||||||||||
| Noncontrolling interests | 2.5 | 3.0 | 2.8 | 2.6 | 2.9 | |||||||||||||||
| Total Liabilities and Equity | $ | 10,131.6 | $ | 9,551.4 | $ | 8,992.5 | $ | 7,300.9 | $ | 6,957.6 |
| 1 | Amounts for 2015-2017 may not equal amounts reported in the Company’s prior years’ Forms 10-K as amounts have been reclassified to conform to current year revenue presentation. |
|---|
| Form 10-K ♦ Page 32 | | Celebrating 25 Years as a Public Company |
|---|
Part II ♦ Item 6 – Selected Financial Data
| 2 | Amounts for 2015-2016 may not equal amounts reported in the Company’s prior years’ Forms 10-K as amounts have been reclassified to reflect the adoption of the Accounting Standards Update 2017-07, Improving the Presentation of Net Periodic Pension Cost and Net Periodic Postretirement Benefit Cost. |
|---|
| 3 | The 2018 balance sheet reflects the acquisition of Bluegrass Materials Company (“Bluegrass”) completed on April 27, 2018. The 2017 balance sheet reflects $1.1 billion of cash and long-term debt issued in anticipation of closing the Bluegrass acquisition. |
|---|
| 4 | Balance sheets reflect the adoption of Accounting Standards Update 2015-03, Simplifying the Presentation of Debt Issuance Costs. |
|---|
| 5 | The 2019 balance sheet reflects the adoption of ASC 842. The operating lease right-of-use assets are included in other noncurrent assets, and operating lease liabilities are included in other current and noncurrent liabilities. |
|---|
| Celebrating 25 Years as a Public Company | | Form 10-K ♦ Page 33 |
|---|
Part II ♦ Item 7 – Management’s Discussion and Analysis of Financial Condition and Results of Operations
Item 7. MANAGEMENT’S DISCUSSION AND ANALYSIS OF FINANCIAL CONDITION AND RESULTS OF OPERATIONS
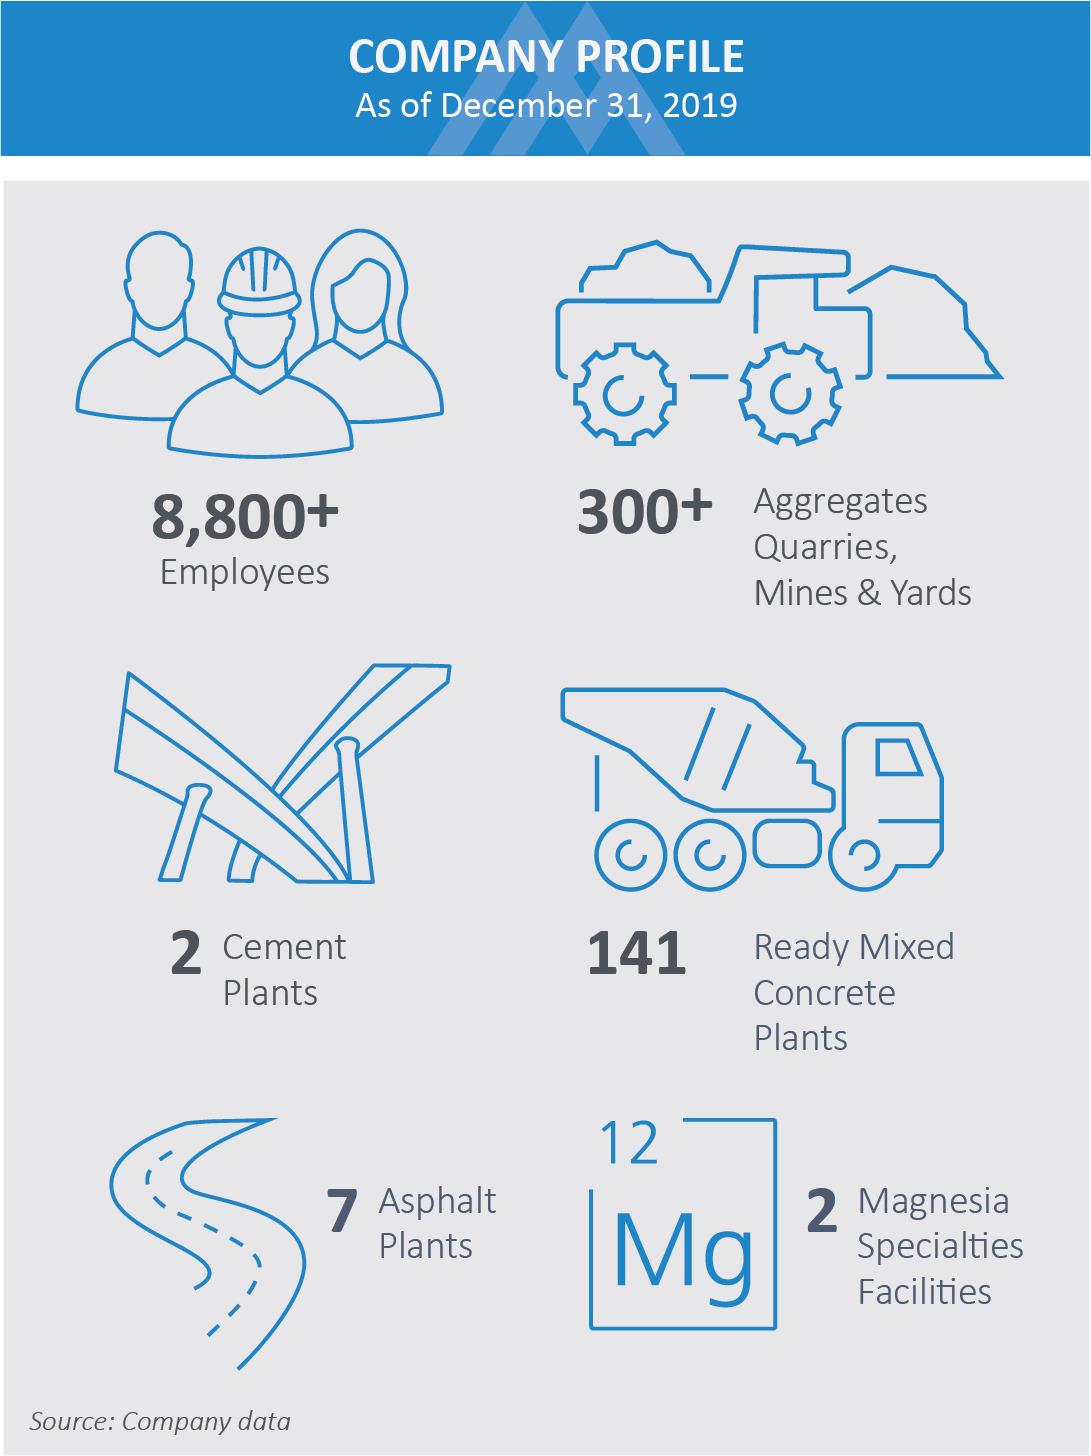 INTRODUCTORY OVERVIEW
Martin Marietta Materials, Inc. (the “Company” or “Martin Marietta”) is a natural resource-based building materials company. The Company supplies aggregates (crushed stone, sand and gravel) through its network of more than 300 quarries, mines and distribution yards in 27 states, Canada and the Bahamas. In the western United States, Martin Marietta also provides cement and downstream products, namely ready mixed concrete, asphalt and paving services, in markets where the Company has a leading aggregates position. Specifically, the Company has two cement plants in Texas and ready mixed concrete and asphalt operations in Texas, Colorado, Louisiana, Arkansas and Wyoming. Paving services are exclusively in Colorado. The Company’s heavy-side building materials are used in infrastructure, nonresidential and residential construction projects. Aggregates are also used in agricultural, utility and environmental applications and as railroad ballast. The aggregates, cement, ready mixed concrete, asphalt and paving product lines are reported collectively as the “Building Materials” business.
As more fully discussed in the Consolidated Strategic Objectives section, geography is critically important for the Building Materials business. The Company conducts its Building Materials business through three reportable segments, organized by geography: Mid-America Group, Southeast Group and West Group. The Mid-America and Southeast Groups provide aggregates products only. The West Group provides aggregates, cement and downstream products and services. Further, the following five states accounted for 72% of the Building Materials business 2019 total products and services revenues: Texas, Colorado, North Carolina, Georgia and Iowa.

| Form 10-K ♦ Page 34 | | Celebrating 25 Years as a Public Company |
|---|---|---|
Part II ♦ Item 7 – Management’s Discussion and Analysis of Financial Condition and Results of Operations
The Building Materials business is a mature, cyclical business, dependent on activity within the construction marketplace. As of December 31, 2019, the nation’s current economic expansion, which started in June 2009, has lasted 126 months and is the longest economic recovery in history. By comparison, the average trough-to-peak expansionary cycle since 1938 was 60 months. During the current economic expansion, however, governmental uncertainty, labor shortages and logistical challenges have tempered the recovery pace of growth of heavy construction activity, resulting in a slow, steady, extended construction cycle that is expected to continue over the next several years. The level of economic recovery varies within the Company’s geographic footprint.
Magnesia Specialties
The Company operates a Magnesia Specialties business with production facilities in Michigan and Ohio. The Magnesia Specialties business produces magnesia-based chemicals products used in industrial, agricultural and environmental applications. It also produces dolomitic lime sold primarily to customers in the steel and mining industries. Magnesia Specialties’ products are shipped to customers worldwide.
Consolidated Strategic Objectives
The Company’s strategic planning process, or Strategic Operating Analysis and Review (SOAR), provides the framework for 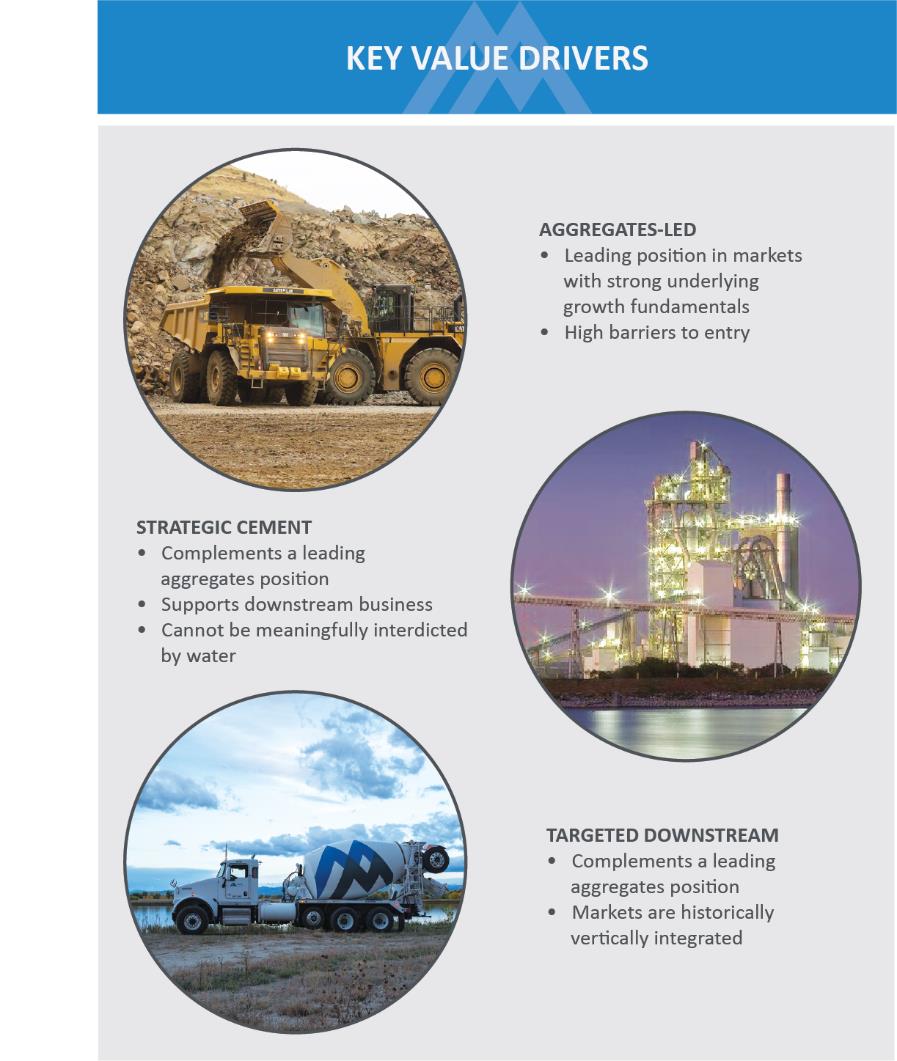 execution of Martin Marietta’s long-term strategic plan. Guided by this framework and considering the cyclicality of the Building Materials business, the Company determines capital allocation priorities to maximize long-term shareholder value. The Company’s strategy includes ongoing evaluation of aggregates-led opportunities of scale in new domestic markets (i.e., platform acquisitions), expansion through acquisitions that complement existing operations (i.e., bolt-on acquisitions), divestitures of assets that are not consistent with stated strategic goals, and arrangements with other companies engaged in similar or complementary businesses. The Company finances such opportunities with the goal of preserving its financial flexibility by having a leverage ratio (consolidated debt-to-consolidated earnings before interest, taxes, depreciation and amortization, or EBITDA) within a target range of 2.0 times to 2.5 times within a reasonable time following the completion of a debt-financed transaction.
The Company, by purposeful design, will continue to be an aggregates-led business (aggregates product revenues represented 62% of 2019 total consolidated products and services revenues) that focuses on markets with strong, underlying growth fundamentals where it can sustain or achieve a leading market position. Driven by this intentional approach, the Company has leading positions in 90% of its markets. As part of its long-term strategic plan, the Company may pursue strategic cement and targeted downstream opportunities. For Martin Marietta, strategic cement and targeted downstream operations are located in vertically-integrated markets where the Company has, or envisions a clear path toward, a leading aggregates position. Additionally, strategic cement operations are attractive where market supply cannot be meaningfully interdicted by water.
Generally, the Company’s building materials products are both sourced and sold locally. As a result, geography is critically important when assessing market attractiveness and growth opportunities. Attractive geographies exhibit (a) population growth and/or population density, both of which are drivers of heavy-side building materials consumption; (b) business and employment diversity, drivers of greater economic stability; and (c) a superior state financial position, a driver of public infrastructure growth and support.
| Celebrating 25 Years as a Public Company | | Form 10-K ♦ Page 35 |
|---|
Part II ♦ Item 7 – Management’s Discussion and Analysis of Financial Condition and Results of Operations
In order to assess population growth and density, the Company focuses on the megaregions of the United States. Megaregions are large networks of metropolitan population centers covering thousands of square miles. According to America 2050, a planning and policy program of the Regional Plan Association, a majority of the nation’s population and economic growth through 2050 will occur in 11 megaregions. The Company has a presence in most of the megaregions. As evidence of the successful execution of SOAR, the Company’s leading positions in the Texas Triangle and Colorado’s Front Range megaregions and its enhanced position in the Piedmont Atlantic, primarily in the Atlanta area, are the results of acquisitions since 2011. Additionally, the 2018 acquisition of Bluegrass Materials Company (Bluegrass) provided the Company with a new growth platform within the southern portion of the Northeast megaregion. The Company has a legacy presence in the southeastern portion of the Great Lakes megaregion, encompassing operations in Indiana and Ohio. The megaregions and the Company’s key states are more fully discussed in the Building Materials Business’ Key Considerations section.

In considering business and employment diversity, the Company focuses its geographic footprint along significant transportation corridors, particularly where land is readily available for the construction of fulfillment and/or data centers. The retail sector values transportation corridors, as logistics and distri
Showing the first 8K of 162K characters. Open the full section
Item 7A. QUANTITATIVE AND QUALITATIVE DISCLOSURES ABOUT MARKET RISK
As discussed earlier, the Company’s operations are highly dependent upon the interest rate-sensitive construction and steelmaking industries. Consequently, these marketplaces could experience lower levels of economic activity in an environment of rising interest rates or escalating costs (see Business Environment section included under Item 7 – MD&A of this Form 10-K).
Management has considered the current economic environment and its potential impact to the Company’s business. Demand for aggregates products, particularly in the infrastructure construction market, is affected by federal and state budget and deficit issues. Further, delays or cancellations of capital projects in the nonresidential and residential construction markets could occur if companies and consumers are unable to obtain financing for construction projects or if consumer confidence is eroded by economic uncertainty.
Demand in the residential construction market is affected by interest rates. During 2019, the Federal Reserve lowered the federal funds rate several times throughout the year. The rate at December 31, 2019 was 1.55%. The residential construction market accounted for approximately 22% of the Company’s aggregates product line shipments in 2019.
Aside from these inherent risks from within its operations, the Company’s earnings are also affected by changes in short-term interest rates.
Variable-Rate Borrowing Facilities
At December 31, 2019, the Company had a $700 million Revolving Facility and a $400 million Trade Receivable Facility. The Company also has $300 million of variable-rate senior notes outstanding. Borrowings under these facilities bear interest at a variable interest rate. A hypothetical 100-basis-point increase in interest rates on borrowings of $640 million, which was the collective outstanding balance at December 31, 2019, would increase interest expense by $6.4 million on an annual basis.
Pension Expense
The Company’s results of operations are affected by its pension expense. Assumptions that affect pension expense include the discount rate and, for the defined benefit pension plans only, the expected long-term rate of return on assets. Therefore, the Company has interest rate risk associated with these factors. The impact of hypothetical changes in these assumptions on the Company’s annual pension expense is discussed in the Critical Accounting Policies and Estimates – Pension Expense – Selection of Assumptions section included under Item 7 – MD&A of this Form 10-K.
Energy Costs
Energy costs, including diesel fuel, natural gas, coal, petroleum coke and liquid asphalt, represent significant production costs of the Company. The Company may be unable to pass along increases in the costs of energy to customers in the form of price increases for the Company’s products. The cement product line and Magnesia Specialties business each have varying fixed-price agreements for a portion of their energy requirements. A hypothetical 10% change in the Company’s energy prices in 2020 as compared with 2019, assuming constant volumes, would change 2020 energy expense by $27.9 million.
Commodity Risk
Cement is a commodity and competition is based principally on price, which is highly sensitive to changes in supply and demand. Prices are often subject to material changes in response to relatively minor fluctuations in supply and demand, general economic conditions and other market conditions beyond the Company’s control. Increases in the production capacity of industry participants or increases in cement imports tend to create an oversupply of such products leading to an imbalance between supply and demand, which can have a negative impact on product prices. There can be no assurance that product prices will not decline in the future or that such declines will not have a material adverse effect on the Company’s business, financial condition and results of operations. A hypothetical 10% change in sales price of the cement product line would impact cement product line revenues by $43.9 million, excluding the net impact of internal sales.
Cement is a key raw material in the production of ready mixed concrete. The Company may be unable to pass along increases in the costs of cement and raw materials to customers in the form of price increases for the Company’s products. A hypothetical 10% change in cement costs in 2020 compared with 2019, assuming constant volumes, would change the ready mixed concrete product line cost of sales by $24.5 million.
| Celebrating 25 Years as a Public Company | | Form 10-K ♦ Page 71 |
|---|
Part II ♦ Item 8 – Financial Statements and Supplementary Data
Item 8. FINANCIAL STATEMENTS AND SUPPLEMENTARY DATA
Additional information required in response to this Item 8 is included under the caption “Management’s Discussion and Analysis of Financial Condition and Results of Operations,” included as Item 7 of this Form 10-K.
Statement of Responsibility and Management’s Report on Internal Control over Financial Reporting
Management’s Statement of Responsibility
The management of Martin Marietta Materials, Inc. (the “Company” or “Martin Marietta”) is responsible for the consolidated financial statements, the related financial information contained in this Form 10-K and the establishment and maintenance of adequate internal control over financial reporting. The consolidated balance sheets for Martin Marietta, at December 31, 2019 and 2018, and the related consolidated statements of earnings, comprehensive earnings, total equity and cash flows for each of the three years in the period ended December 31, 2019, include amounts based on estimates and judgments and have been prepared in accordance with accounting principles generally accepted in the United States applied on a consistent basis.
A system of internal control over financial reporting is designed to provide reasonable assurance, in a cost-effective manner, that assets are safeguarded, transactions are executed and recorded in accordance with management’s authorization, accountability for assets is maintained and financial statements are prepared and presented fairly in accordance with accounting principles generally accepted in the United States. Internal control systems over financial reporting have inherent limitations and may not prevent or detect misstatements. Therefore, even those systems determined to be effective can provide only reasonable assurance with respect to financial statement preparation and presentation.
The Company operates in an environment that establishes an appropriate system of internal control over financial reporting and ensures that the system is maintained, assessed and monitored on a periodic basis. This internal control system includes examinations by internal audit staff and oversight by the Audit Committee of the Board of Directors.
The Company’s management recognizes its responsibility to foster a strong ethical climate. Management has issued written policy statements that document the Company’s business code of ethics. The importance of ethical behavior is regularly communicated to all employees through the distribution of the Code of Ethical Business Conduct and through ongoing education and review programs designed to create a strong commitment to ethical business practices.
| Form 10-K ♦ Page 72 | | Celebrating 25 Years as a Public Company |
|---|---|---|
Part II ♦ Item 8 – Financial Statements and Supplementary Data
The Audit Committee of the Board of Directors, which consists of three independent, nonemployee directors, meets periodically and separately with management, the independent auditors and the internal auditors to review the activities of each. The Audit Committee meets standards established by the Securities and Exchange Commission (SEC) and the New York Stock Exchange as they relate to the composition and practices of audit committees.
Management’s Report on Internal Control over Financial Reporting
The management of Martin Marietta is responsible for establishing and maintaining adequate internal control over financial reporting. Management assessed the effectiveness of the Company’s internal control over financial reporting as of December 31, 2019. In making this assessment, management used the criteria set forth in Internal Control—Integrated Framework issued by the Committee of Sponsoring Organizations of the Treadway Commission (2013 framework). Based on management’s assessment under the 2013 framework, management concluded that the Company’s internal control over financial reporting was effective as of December 31, 2019.
The consolidated financial statements of the Company as of December 31, 2019 and 2018, and for each of the three years in the period ended December 31, 2019, and the effectiveness of the Company’s internal control over financial reporting as of December 31, 2019, have been audited by PricewaterhouseCoopers LLP, an independent registered public accounting firm, whose report appears on the following page.
 |  |
| C. Howard Nye, Chairman, President and Chief Executive Officer | James A. J. Nickolas, Senior Vice President and Chief Financial Officer |
February 21, 2020
| Celebrating 25 Years as a Public Company | | Form 10-K ♦ Page 73 |
|---|
Part II ♦ Item 8 – Financial Statements and Supplementary Data
Report of Independent Registe****red Public Accounting Firm
To the Board of Directors and Shareholders of Martin Marietta Materials, Inc.
Opinions on the Financial Statements and Internal Control over Financial Reporting
We have audited the accompanying consolidated balance sheets of Martin Marietta Materials, Inc. and its subsidiaries (the “Company”) as of December 31, 2019 and 2018, and the related consolidated statements of earnings, comprehensive earnings, total equity and cash flows for each of the three years in the period ended December 31, 2019, including the related notes and schedule of valuation and qualifying accounts for each of the three years in the period ended December 31, 2019 appearing under Item 15(a)(2) (collectively referred to as the “consolidated financial statements”). We also have audited the Company’s internal control over financial reporting as of December 31, 2019, based on criteria established in Internal Control - Integrated Framework (2013) issued by the Committee of Sponsoring Organizations of the Treadway Commission (COSO).
In our opinion, the consolidated financial statements referred to above present fairly, in all material respects, the financial position of the Company as of December 31, 2019 and 2018, and the results of its operations and its cash flows for each of the three years in the period ended December 31, 2019 in conformity with accounting principles generally accepted in the United States of America. Also in our opinion, the Company maintained, in all material respects,
Showing the first 8K of 183K characters. Open the full section
Item 9. CHANGES IN AND DISAGREEMENTS WITH ACCOUNTANTS ON ACCOUNTING AND FINANCIAL DISCLOSURE
None.
Item 9A. CONTROLS AND PROCEDURES
Evaluation of Disclosure Controls and Procedures
As of December 31, 2019, an evaluation was performed under the supervision and with the participation of the Company’s management, including the Chief Executive Officer (“CEO”) and Chief Financial Officer (“CFO”), of the effectiveness of the design and operation of the Company’s disclosure controls and procedures. Based on that evaluation, the Company’s CEO and CFO concluded that the Company’s disclosure controls and procedures were effective at the reasonable assurance level.
The foregoing evaluation of the Company’s disclosure controls and procedures was based on the definition in Exchange Act Rule 13a-15(e), which requires that disclosure controls and procedures are effectively designed to provide reasonable assurance that information required to be disclosed by an issuer in the reports that it files or submits with the SEC under the Exchange Act is recorded, processed, summarized, and reported, within the time periods specified in the SEC’s rules and forms, and is accumulated and communicated to the issuer’s management, including its principal executive and principal financial officers, or persons performing similar functions, as appropriate to allow timely decisions regarding required disclosure.
Management’s Report on Internal Control over Financial Reporting
Our management’s report on internal control over financial reporting is included as the “Statement of Financial Responsibility and Management’s Report on Internal Controls over Financial Reporting” in Item 8, “Financial Statements and Supplemental Data,” of this Form 10-K. The Company’s management concluded that the Company’s internal control over financial reporting was effective in providing reasonable assurance regarding the reliability of financial reporting and the preparation of the Company’s financial statements for external purposes in accordance with generally accepted accounting principles as of December 31, 2019. PricewaterhouseCoopers LLP, the independent registered public accounting firm that audited the Company’s consolidated financial statements contained herein, also audited the Company’s internal control over financial reporting as of December 31, 2019. The audit report is included in Item 8, “Financial Statements and Supplementary Data,” of this Form 10-K.
Changes in Internal Control over Financial Reporting
There were no changes in the Company’s internal control over financial reporting during the most recently completed fiscal quarter ended December 31, 2019 that materially affected, or are reasonably likely to materially affect, the Company’s internal control over financial reporting.
Limitations on the Effectiveness of Controls
The Company's management, including the CEO and CFO, does not expect that the Company’s control system will prevent all error and all fraud. A control system, no matter how well conceived and operated, can provide only reasonable, not absolute, assurance that the objectives of the control system are met. Further, the design of a control system must reflect the fact that there are resource constraints, and the benefits of controls must be considered relative to their costs. Because of the inherent limitations in all control systems, no evaluation of controls can provide absolute assurance that all control issues and instances of fraud, if any, within the Company have been detected. These inherent limitations include the realities that judgments in decision making can be faulty and that breakdowns can occur because of simple error or mistake. Additionally, controls can be circumvented by the individual acts of some persons, by collusion of two or more people, or by management override of the control. The design of any system of controls also is based in part upon certain assumptions about the likelihood of future events, and there can be no assurance that any design will succeed in achieving its stated goals under all potential future conditions. Over time, controls may become inadequate because of changes in conditions, or the degree of compliance with the policies or procedures may deteriorate. Because of the inherent limitations in a cost-effective control system, misstatements due to error or fraud may occur and not be detected.
| Form 10-K ♦ 118 | | Celebrating 25 Years as a Public Company |
Part II ♦ Item 9A – Controls and Procedures
CEO and CFO Certifications
Included among the exhibits to this Form 10-K are forms of “Certifications” of the Company’s CEO and CFO as required in accordance with Section 302 of the Sarbanes-Oxley Act of 2002 (the “Section 302 Certification”). The Section 302 Certifications refer to this evaluation of the Company’s disclosure policies and procedures and internal control over financial reporting. The information in this section should be read in conjunction with the Section 302 Certifications for a more complete understanding of the topics presented.
Item 9B. OTHER INFORMATION
None.
| Celebrating 25 Years as a Public Company | | Form 10-K ♦ Page 119 |
Part III ♦ Item 10 – Directors, Executive Officers and Corporate Governance
PART III
Item 10. DIRECTORS, EXECUTIVE OFFICERS AND CORPORATE GOVERNANCE
The information concerning directors of the Company, the Audit Committee of the Board of Directors, and the Audit Committee financial expert serving on the Audit Committee, all as required in response to this Item 10, is included under the captions “Corporate Governance Matters” in the Company’s definitive proxy statement to be filed with the SEC pursuant to Regulation 14A within 120 days after the close of the Company’s fiscal year ended December 31, 2019 (the “2020 Proxy Statement”), and that information is hereby incorporated by reference in this Form 10-K. Information concerning Section 16(a) reporting compliance is incorporated by reference to the information appearing under the caption “Delinquent Section 16(a) Reports” in the 2020 Proxy Statement. Information concerning executive officers of the Company required in response to this Item 10 is included in Part I, under the heading “Information about our Executive Officers,” of this Form 10-K. The information concerning the Company’s code of ethics required in response to this Item 10 is included in Part I, under the heading “Available Information,” of this Form 10‑K.
Item 11. EXECUTIVE COMPENSATION
The information required in response to this Item 11 is included under the captions “Executive Compensation,” “Compensation Discussion and Analysis,” “Corporate Governance Matters,” “Management Development and Compensation Committee Report,” and “Compensation Committee Interlocks and Insider Participation” in the Company’s 2020 Proxy Statement, and that information is hereby incorporated by reference in this Form 10-K.
Item 12. SECURITY OWNERSHIP OF CERTAIN BENEFICIAL OWNERS AND MANAGEMENT AND RELATED STOCKHOLDER MATTERS
The information required in response to this Item 12 is included under the captions “General Information,” “Security Ownership of Certain Beneficial Owners and Management,” and “Securities Authorized for Issuance Under Equity Compensation Plans” in the Company’s 2020 Proxy Statement, and that information is hereby incorporated by reference in this Form 10-K.
Item 13. CERTAIN RELATIONSHIPS AND RELATED TRANSACTIONS, AND DIRECTOR INDEPENDENCE
The information required in response to this Item 13 is included under the captions “Compensation Committee Interlocks and Insider Participation in Compensation Decisions” and “Corporate Governance Matters” in the Company’s 2020 Proxy Statement, and that information is hereby incorporated by reference in this Form 10-K.
Item 14. PRINCIPAL ACCOUNTANT FEES AND SERVICES
The information required in response to this Item 14 is included under the caption “Independent Auditors” in the Company’s 2020 Proxy Statement, and that information is hereby incorporated by reference in this Form 10-K.
| Form 10-K ♦ 120 | | Celebrating 25 Years as a Public Company |
|---|
Part IV ♦ Item 15 – Exhibits and Financial Statement Schedules
PART IV
Item 15. EXHIBITS AND FINANCIAL STATEMENT SCHEDULES
(a) (1) List of financial statements filed as part of this Form 10-K
The consolidated financial statements of Martin Marietta and consolidated subsidiaries, and related notes, appear in Item 8, “Financial Statements and Supplemental Data,” of this Form 10-K.
(2) List of financial statement schedules filed as part of this Form 10-K
The following financial statement schedule of Martin Marietta and consolidated subsidiaries is included in Item 15(c) of this Form 10-K.
Schedule II - Valuation and Qualifying Accounts
All other schedules have been omitted because they are not applicable, not required, or the information has been otherwise supplied in the financial statements or notes to the financial statements.
The report of the Company’s independent registered public accounting firm with respect to the above-referenced financial statements is included in Item 8, “Financial Statements and Supplemental Data,” of this Form 10-K. The report on the financial statement schedule and the consent of the Company’s independent registered public accounting firm are attached as Exhibit 23.01 to this Form 10-K.
(3) Exhibits
The list of Exhibits on the accompanying Index of Exhibits included in Item 15(b) of this Form 10-K is hereby incorporated by reference. Each management contract or compensatory plan or arrangement required to be filed as an exhibit is indicated by asterisks.
(b) Index of Exhibits
| Celebrating 25 Years as a Public Company | | Form 10-K ♦ Page 121 |
|---|
Part IV ♦ Item 15 – Exhibits and Financial Statement Schedules
| Form 10-K ♦ 122 | | Celebrating 25 Years as a Public Company |
|---|
Part IV ♦ Item 15 – Exhibits and Financial Statement Schedules
| Celebrating 25 Years as a Public Company | | Form 10-K ♦ Page 123 |
|---|
Part IV ♦ Item 15 – Exhibits and Financial Statement Schedules
| Form 10-K ♦ 124 | | Celebrating 25 Years as a Public Company |
|---|
Part IV ♦ Item 15 – Exhibits and Financial Statement Schedules
| Exhibit No. | |
|---|---|
| *32.02 | --Certification dated February 21, 2020 of Chief Financial Officer required by 18 U.S.C. 1350, as adopted pursuant to Section 906 of the Sarbanes-Oxley Act of 2002 |
| *95 | --Mine Safety Disclosure Exhibit |
| *101 | --The following financial information formatted in Inline XBRL: |
| *101.INS | --XBRL Instance Document |
| *101.SCH | --XBRL Taxonomy Extension Schema Document |
| *101.CAL | --XBRL Taxonomy Extension Calculation Linkbase Document |
| *101.LAB | --XBRL Taxonomy Extension Label Linkbase Document |
| *101.PRE | --XBRL Taxonomy Extension Presentation Linkbase Document |
| *101. DEF | --XBRL Taxonomy Extension Definition Linkbase |
| *104 | --The cover page financial information formatted in Inline XBRL (included as Exhibit 101). |
Other material incorporated by reference:
Martin Marietta Materials, Inc.’s 2020 Proxy Statement to be filed pursuant to Regulation 14A, portions of which are incorporated by reference in this Form 10-K. Those portions of the 2020 Proxy Statement which are not incorporated by reference shall not be deemed to be “filed” as part of this report.
| * | Filed herewith |
|---|
| ** | Management contract or compensatory plan or arrangement required to be filed as an exhibit pursuant to Item 14(c) of Form 10-K |
|---|
| Celebrating 25 Years as a Public Company | | Form 10-K ♦ Page 125 |
|---|
Part IV ♦ Item 15 – Exhibits and Financial Statement Schedules
(c) Financial Statement Schedule
SCHEDULE II – VALUATION AND QUALIFYING ACCOUNTS
MARTIN MARIETTA MATERIALS, INC. AND CONSOLIDATED SUBSIDIARIES
| Col A | Col B | Col C | Col D | Col E | ||||||||||||||||||
|---|---|---|---|---|---|---|---|---|---|---|---|---|---|---|---|---|---|---|---|---|---|---|
| Additions | ||||||||||||||||||||||
| Description | Balance at beginning of period | (1) Charged to costs and expenses | (2) Charged to other accounts- describe | Deductions- describe | Balance at end of period | |||||||||||||||||
| (Amounts in Millions) | ||||||||||||||||||||||
| Year ended December 31, 2019 | ||||||||||||||||||||||
| Allowance for doubtful accounts | $ | 3.3 | $ | 1.4 | $ | — | $ | — | $ | 4.7 | ||||||||||||
| Allowance for uncollectible notes receivable | — | — | — | — | — | |||||||||||||||||
| Inventory valuation allowance | 159.2 | 38.8 | — | 29.4 | (a) | 168.6 | ||||||||||||||||
| Year ended December 31, 2018 | ||||||||||||||||||||||
| Allowance for doubtful accounts | $ | 2.4 | $ | 0.9 | $ | — | $ | — | $ | 3.3 | ||||||||||||
| Allowance for uncollectible notes receivable | 0.2 | — | — | 0.2 | (b) | — | ||||||||||||||||
| Inventory valuation allowance | 144.0 | 36.9 | 5.1 | (c) | 26.8 | (a) | 159.2 | |||||||||||||||
| Year ended December 31, 2017 | ||||||||||||||||||||||
| Allowance for doubtful accounts | $ | 6.3 | $ | — | $ | — | $ | 3.9 | (b) | $ | 2.4 | |||||||||||
| Allowance for uncollectible notes receivable | 0.4 | — | — | 0.2 | (b) | 0.2 | ||||||||||||||||
| Inventory valuation allowance | 134.9 | 38.5 | — | 29.4 | (a) | 144.0 |
| (a) | Sale of reserved inventory and divestitures |
|---|
| (b) | Write-off of uncollectible accounts and change in estimates |
|---|
| (c) | Application of reserve policy to acquired inventories |
|---|
Item 16. FORM 10-K SUMMARY
The Company has chosen not to include an optional summary of the information required by this Form 10-K. For a reference to the information in this Form 10-K, investors should refer to the Table of Contents to this Form 10-K.
| Form 10-K ♦ 126 | | Celebrating 25 Years as a Public Company |
|---|
♦ Signatures
SIGNATURES
Pursuant to the requirements of Section 13 or 15(d) of the Securities Exchange Act of 1934, the registrant has duly caused this report to be signed on its behalf by the undersigned, thereunto duly authorized.
| MARTIN MARIETTA MATERIALS, INC. | ||
|---|---|---|
| By: | /s/ Roselyn R. Bar | |
| Roselyn R. Bar | ||
| Executive Vice President, General Counsel and Corporate Secretary |
Dated: February 21, 2020
POWER OF ATTORNEY
KNOW ALL PERSONS BY THESE PRESENTS, that each person whose signature appears below appoints Roselyn R. Bar and M. Guy Brooks, III, jointly and severally, as his or her true and lawful attorney-in-fact, each with full power of substitution and resubstitution, for him or her and in his or her name, place and stead, in any and all capacities, to sign any and all amendments to this Annual Report on Form 10-K, and to file the same, with all exhibits thereto, and other documents in connection therewith, with the Securities and Exchange Commission, granting unto said attorneys-in-fact, jointly and severally, full power and authority to do and perform each in connection therewith, as fully to all intents and purposes as he or she might or could do in person, hereby ratifying and confirming all that said attorneys-in-fact, jointly and severally, or their or his or her substitute or substitutes, may lawfully do or cause to be done by virtue hereof.
| Celebrating 25 Years as a Public Company | | Form 10-K ♦ 127 |
♦ Signatures
Pursuant to the requirements of the Securities and Exchange Act of 1934, this report has been signed by the following persons on behalf of the registrant and in the capacities and on the dates indicated:
| Signature | Title | Date | ||
|---|---|---|---|---|
| /s/ C. Howard Nye | Chairman of the Board, | February 21, 2020 | ||
| C. Howard Nye | President and Chief Executive Officer | |||
| /s/ James A. J. Nickolas | Senior Vice President | February 21, 2020 | ||
| James A. J. Nickolas | and Chief Financial Officer | |||
| /s/ Robert J. Cardin | Senior Vice President, | February 21, 2020 | ||
| Robert J. Cardin | Controller and Chief Accounting Officer | |||
| /s/ Dorothy M. Ables | Director | February 21, 2020 | ||
| Dorothy M. Ables | ||||
| /s/ Sue W. Cole | Director | February 21, 2020 | ||
| Sue W. Cole | ||||
| /s/ Smith W. Davis | Director | February 21, 2020 | ||
| Smith W. Davis | ||||
| /s/ John J. Koraleski | Director | February 21, 2020 | ||
| John J. Koraleski | ||||
| /s/ Laree E. Perez | Director | February 21, 2020 | ||
| Laree E. Perez | ||||
| /s/ Thomas H. Pike | Director | February 21, 2020 | ||
| Thomas H. Pike | ||||
| /s/ Michael J. Quillen | Director | February 21, 2020 | ||
| Michael J. Quillen | ||||
| /s/ Donald W. Slager | Director | February 21, 2020 | ||
| Donald W. Slager | ||||
| /s/ Stephen P. Zelnak, Jr. | Director | February 21, 2020 | ||
| Stephen P. Zelnak, Jr. |
| Form 10-K ♦ 128 | | Celebrating 25 Years as a Public Company |
|---|