 filings.tools
Item 6. SELECTED FINANCIAL DATA
157K characters. Original on sec.gov · Markdown
Item 6. SELECTED FINANCIAL DATA
SEC Release No. 33-10890 eliminated the requirement of selected financial data previously required by Item 301 of Regulation S-K.
| Form 10-K ♦ Page 28 |  | A World-Class Organization Built for Success |
|---|
Part II ♦ Item 7 – Management’s Discussion and Analysis of Financial Condition and Results of Operations
 ITEM 7 – MANAGEMENT’S DISCUSSION AND ANALYSIS OF FINANCIAL CONDITION AND RESULTS OF OPERATIONS
INTRODUCTORY OVERVIEW
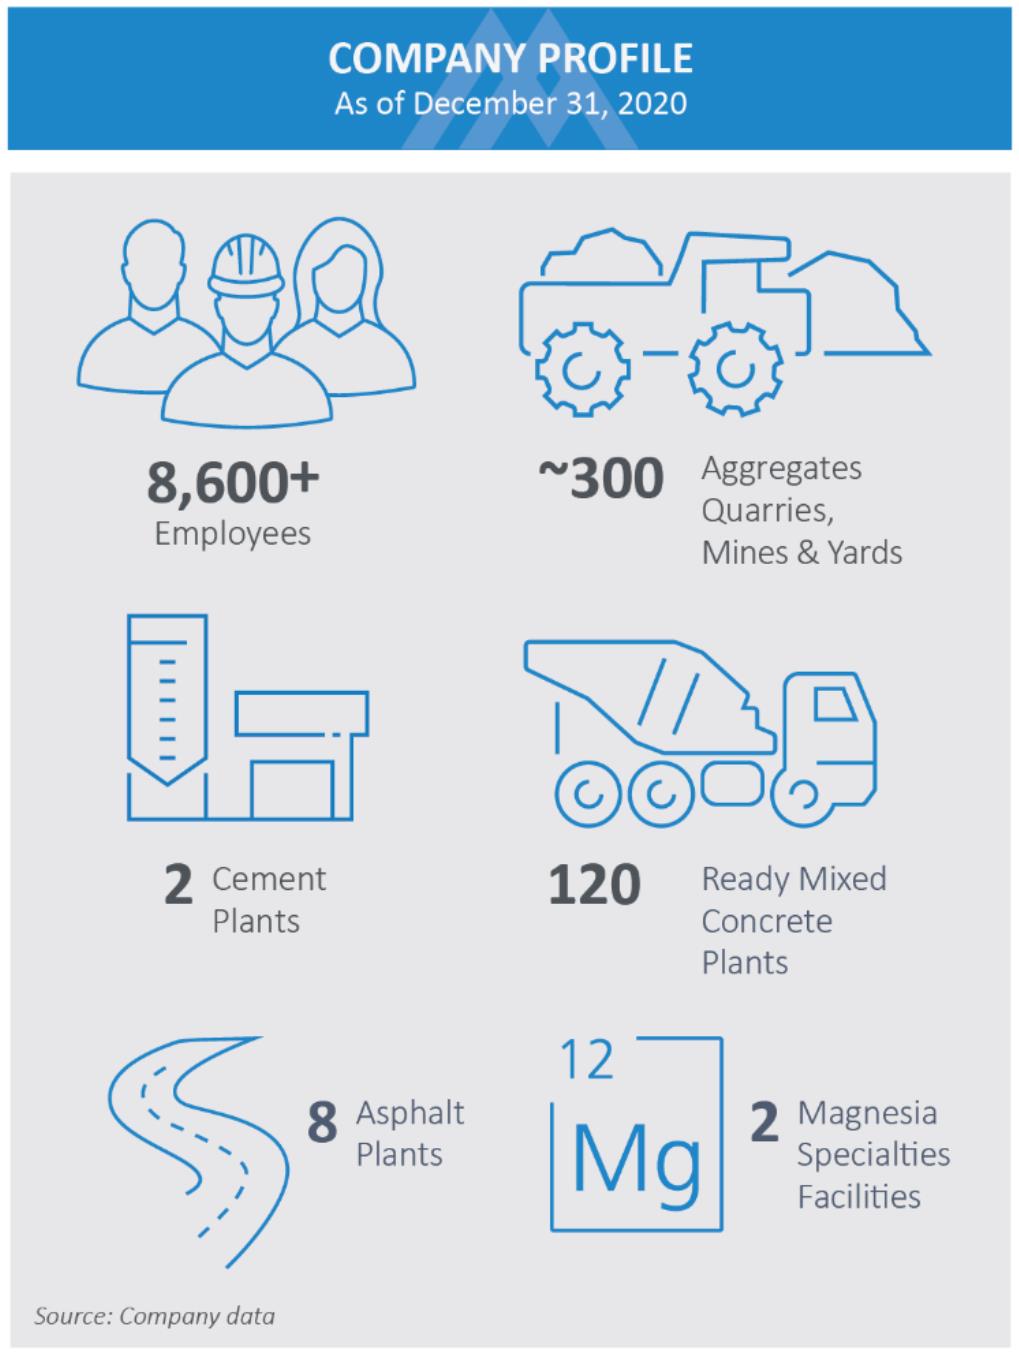
Martin Marietta Materials, Inc. (the Company or Martin Marietta) is a natural resource-based building materials company. The Company supplies aggregates (crushed stone, sand and gravel) through its network of approximately 300 quarries, mines and distribution yards in 27 states, Canada and The Bahamas. In the western United States, Martin Marietta also provides cement and downstream products, namely ready mixed concrete, asphalt and paving services, in markets where the Company has a leading aggregates position. Specifically, the Company has two cement plants in Texas and ready mixed concrete and asphalt operations in Texas, Colorado and Wyoming. Asphalt operations and paving services are exclusively in Colorado. The Company’s heavy-side building materials are used in infrastructure, nonresidential and residential construction projects. Aggregates are also used in agricultural, utility and environmental applications and as railroad ballast. The aggregates, cement, ready mixed concrete, asphalt and paving product lines are reported collectively as the “Building Materials” business.
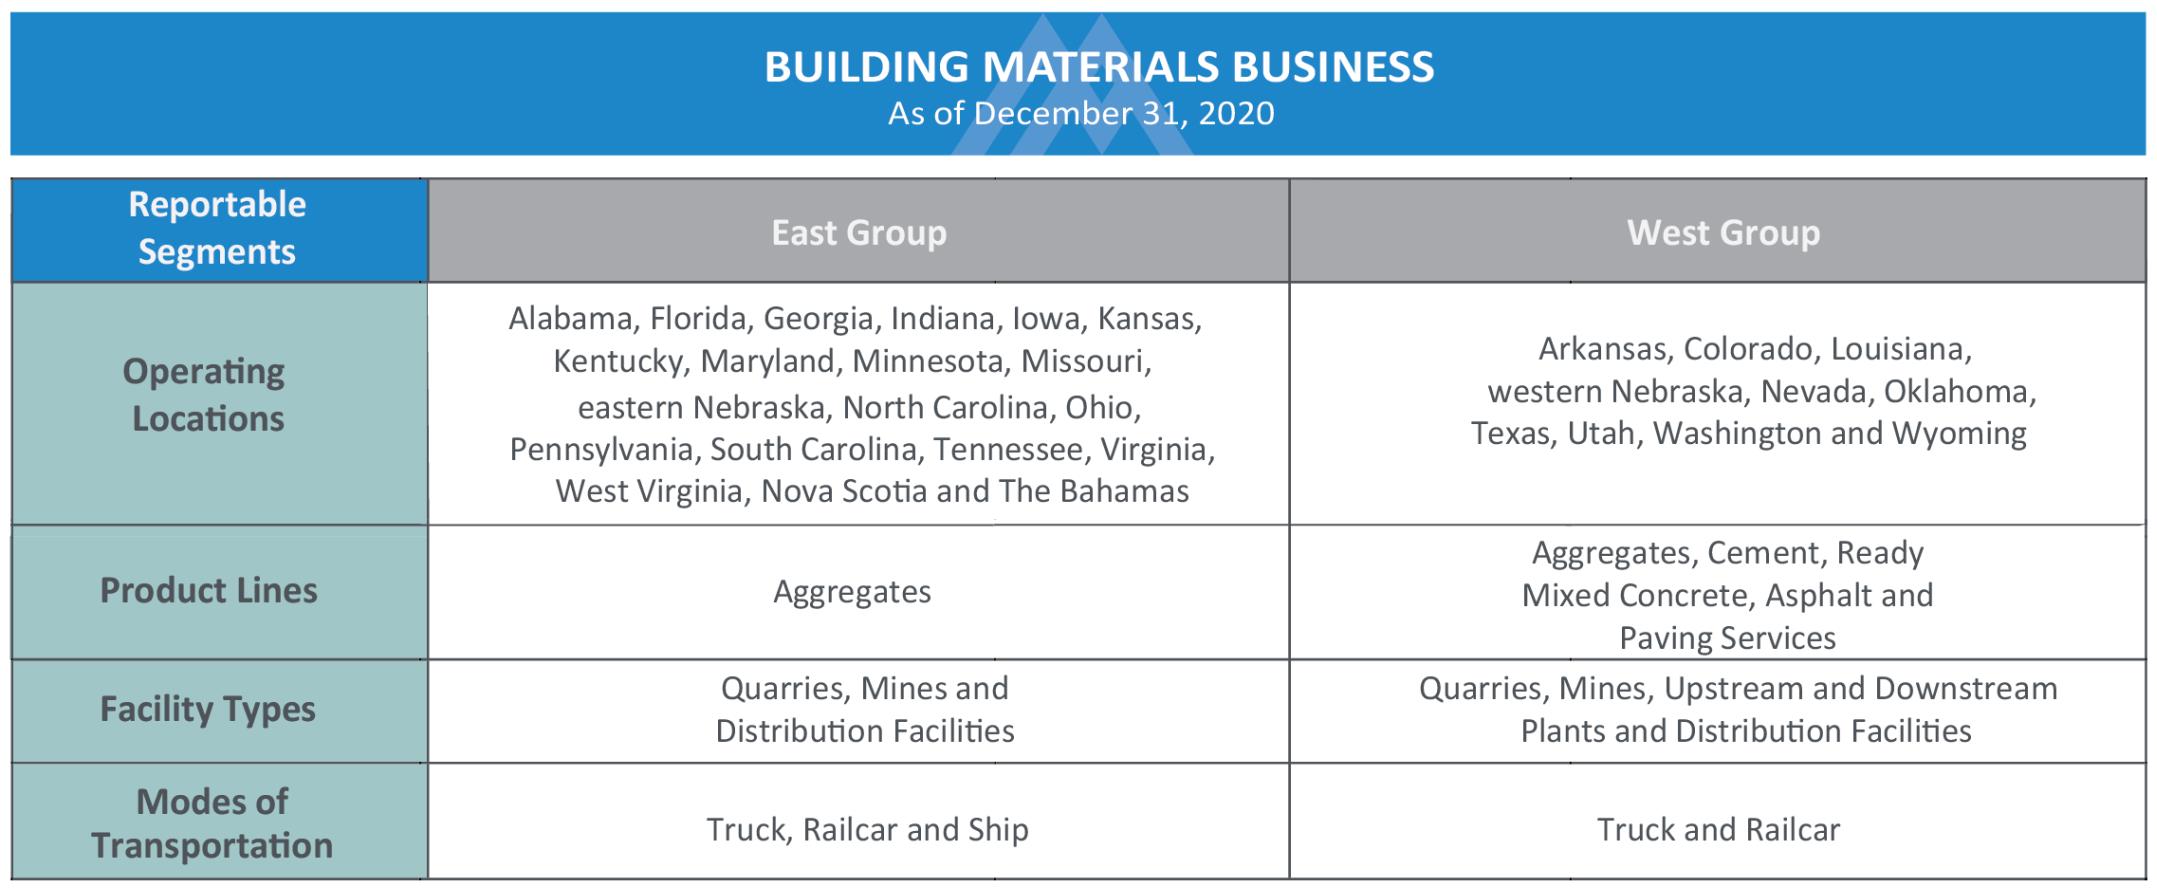
As more fully discussed in the Consolidated Strategic Objectives section, geography is critically important for the Building Materials business. The Company conducts its Building Materials business through two reportable segments, organized by geography: East Group and West Group. The East Group, whose operations were previously reported in the Mid-America and Southeast Groups, consists of the East and Central Divisions. The West Group is comprised of the Southwest and West Divisions.
The East Group provides aggregates products only. The West Group provides aggregates, cement and downstream products and services. Further, the following five states accounted for 71% of the Building Materials business 2020 total revenues: Texas, Colorado, North Carolina, Georgia and Iowa.
| A World-Class Organization Built for Success | | Form 10-K ♦ Page 29 |
|---|
Part II ♦ Item 7 – Management’s Discussion and Analysis of Financial Condition and Results of Operations
Magnesia Specialties
The Company operates a Magnesia Specialties business with production facilities in Michigan and Ohio. The Magnesia Specialties business produces magnesia-based chemicals products used in industrial, agricultural and environmental applications. It also produces dolomitic lime sold primarily to customers for steel production and land stabilization. Magnesia Specialties’ products are shipped to customers worldwide.
 Consolidated Strategic Objectives
The Company’s strategic planning process, or Strategic Operating Analysis and Review (SOAR), provides the framework for execution of Martin Marietta’s long-term strategic plan. Guided by this framework and considering the cyclicality of the Building Materials business, the Company determines capital allocation priorities to maximize long-term shareholder value creation. The Company’s strategy includes ongoing evaluation of aggregates-led opportunities of scale in new domestic markets (i.e., platform acquisitions), expansion through acquisitions that complement existing operations (i.e., bolt-on acquisitions) and divestitures of assets that are not consistent with stated strategic goals. The Company finances such opportunities with the goal of preserving its financial flexibility by having a leverage ratio (consolidated debt-to-consolidated earnings before interest, taxes, depreciation and amortization, or EBITDA) within a range of 2.0 times to 2.5 times within a reasonable time following the completion of a debt-financed transaction.
The Company, by purposeful design, will continue to be an aggregates-led business (aggregates product gross profit represented 68% of 2020 total consolidated gross profit) that focuses on markets with strong, underlying growth fundamentals where it can sustain or achieve a leading market position. Driven by this intentional approach, the Company has leading positions, defined as either #1 or #2, in approximately 90% of its markets. As part of its long-term strategic plan, the Company may also pursue strategic cement and targeted downstream opportunities. For Martin Marietta, strategic cement and targeted downstream operations are located in vertically-integrated markets where the Company has, or envisions, a clear path toward a leading aggregates position.
Generally, the Company’s building materials products are both sourced and sold locally. As a result, geography is critically important when assessing market attractiveness and growth opportunities. Attractive geographies exhibit (a) population growth and/or population density, both of which are drivers of heavy-side building materials consumption; (b) business and employment diversity, drivers of greater economic stability; and (c) a superior state financial position, a driver of public infrastructure growth and support.
In order to assess population growth and density, the Company focuses on the megaregions of the United States. Megaregions are large networks of metropolitan population centers covering thousands of square miles. According to America 2050, a planning and policy program of the Regional Plan Association, a majority of the nation’s population and economic growth through 2050 will occur in 11 megaregions. The Company has a presence in most of the megaregions. As evidence of the successful execution of SOAR, the Company’s leading positions in the Texas Triangle and Colorado’s Front Range megaregions, its growth platform in the southern portion of the Northeast megaregion and its enhanced position in the Piedmont Atlantic megaregion, primarily in the Atlanta area, are the results of acquisitions since 2011. The Company has a legacy presence in the southeastern portion of the Great Lakes megaregion, encompassing operations in Indiana and Ohio. The megaregions and the Company’s key states are more fully discussed in the Building Materials Business’ Key Considerations section.
| Form 10-K ♦ Page 30 | | A World-Class Organization Built for Success |
|---|---|---|
Part II ♦ Item 7 – Management’s Discussion and Analysis of Financial Condition and Results of Operations

In considering business and employment diversity, the Company focuses its geographic footprint along significant transportation corridors, particularly where land is readily available for the construction of fulfillment and/or data centers. The retail sector values transportation corridors, as logistics and distribution are critical considerations for construction supporting that industry. In addition, technology companies view these areas as attractive locations for data centers.
Additionally, the Company considers a state’s financial position in determining the opportunities and attractiveness of areas for expansion or development. In this assessment, the Company reviews a state’s financial health rating, issued by S&P Global Ratings and where AAA is the highest score. The Company’s top ten revenue-generating states have been evaluated and scored a financial health rating of AA or AAA. The Company also reviews the state’s ability to securing additional infrastructure funding and financing.
In line with the Company’s strategic objectives, management’s overall focus includes the following items:
| • | Upholding the Company’s commitment to its mission, vision and values |
|---|
| • | Navigating effectively through construction cycles to balance investment and cost decisions against expected shipment volumes |
|---|
| • | Tracking shifts in population trends, as well as local, state and national economic conditions, to ensure changing trends are reflected against the execution of the strategic plan |
|---|
| • | Integrating acquired businesses efficiently to maximize the return on the investment |
|---|
| • | Allocating capital in a manner consistent with the following long-standing priorities while maintaining financial flexibility |
|---|
| ─ | Acquisitions |
|---|
| ─ | Organic capital investment |
|---|
| ─ | Return of cash to shareholders through both meaningful and sustainable dividends as well as share repurchases |
|---|
| A World-Class Organization Built for Success | | Form 10-K ♦ Page 31 |
|---|
Part II ♦ Item 7 – Management’s Discussion and Analysis of Financial Condition and Results of Operations
2020 Performance Highlights
Achieved Industry-Leading Safety Performance:
| • | Record company-wide Lost-Time Incident Rate (LTIR) of 0.15, the fourth consecutive year of world-class or better LTIR thresholds |
|---|
| • | Total Injury Incident Rate (TIIR) of 0.93, compared with 1.18 in 2019 |
|---|
Achieved Record Financial Performance:
The Company achieved record products and services revenues, consolidated gross profit, earnings from operations, net earnings attributable to Martin Marietta, diluted earnings per share and Adjusted EBITDA (defined in Results of Operations section), driven by resilient customer demand and improved pricing and profitability across all product lines of the Building Materials business. The Company achieved its ninth consecutive year of growth for products and services revenues, gross profit, Adjusted EBITDA and earnings per diluted share (excluding the one-time impact of the Tax Cuts and Jobs Act of 2017 (2017 Tax Act) on 2017 financial amounts). The Company’s commitment to safety and operational excellence resulted in the following financial performance (comparisons with 2019):
-
Consolidated total revenues of $4.73 billion compared with $4.74 billion
-
Record consolidated gross profit of $1.25 billion compared with $1.18 billion, an increase of 6.3%
-
Consolidated selling, general and administrative (SG&A) expenses representing 6.5% of total revenues
-
Net earnings attributable to Martin Marietta of $721.0 million compared with $611.9 million, an increase of 17.8%
-
Earnings per diluted share of $11.54 compared with $9.74
-
Record consolidated Adjusted EBITDA of $1.39 billion
-
Record operating cash flow of $1.05 billion
Continued Disciplined Execution Against Capital Allocation Priorities:
-
Dividend increase of 4% in August 2020, resulting in total annual dividends paid of $140.3 million, or $2.24 per share
-
Repurchased 0.2 million shares of common stock for $50.0 million
-
Capital investments into operations of $367 million
-
Net long-term debt repayment of $149 million
BUSINESS ENVIRONMENT
 Building Materials Business
The Building Materials business serves customers in the construction marketplace. The business’ profitability is sensitive to national, regional and local economic conditions and cyclical swings in construction spending, which are affected by fluctuations in levels of public-sector infrastructure funding; interest rates; access to capital markets; and demographic, geographic, employment and population dynamics.
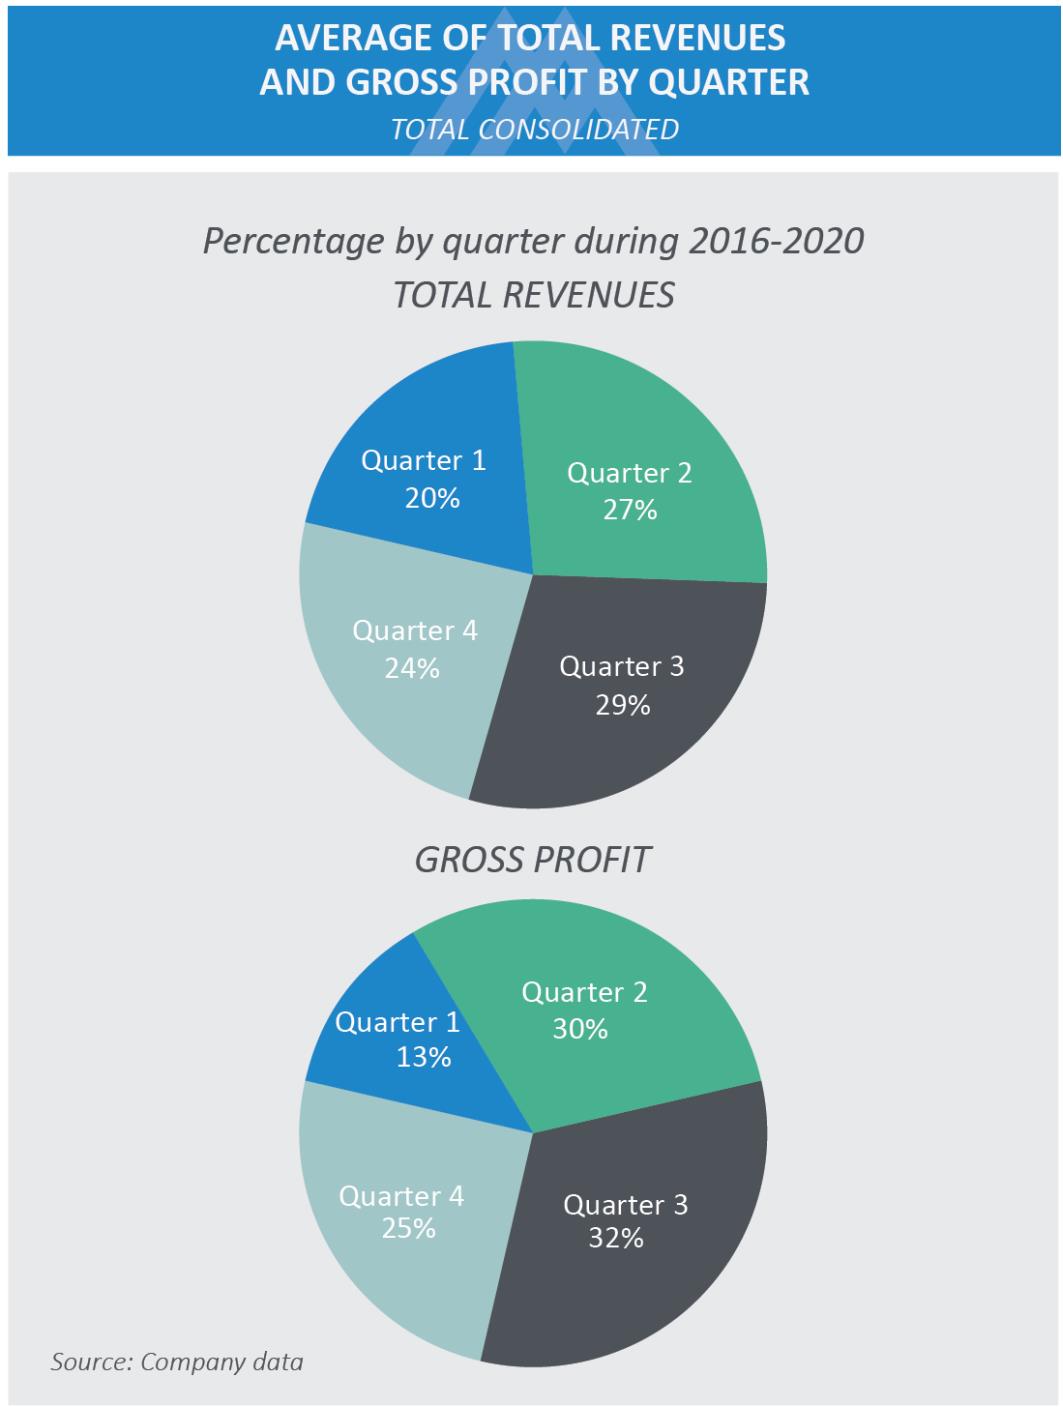
The heavy-side construction business, inclusive of much of the Company’s operations, is conducted outdoors. Therefore, erratic weather patterns, precipitation and other weather-related conditions, including flooding, hurricanes, snowstorms, cold temperatures and droughts, can significantly affect production schedules, shipments, costs, efficiencies and profitability. Generally, the financial results for the first and fourth quarters are subject to the impacts of
| Form 10-K ♦ Page 32 | | A World-Class Organization Built for Success |
|---|---|---|
Part II ♦ Item 7 – Management’s Discussion and Analysis of Financial Condition and Results of Operations
winter weather, while the second and third quarters can be subject to the impacts of heavy precipitation. The impacts of erratic weather patterns are more fully discussed in the Building Materials Business’ Key Considerations section.
Product Lines
Aggregates are an engineered, granular material consisting of crushed stone and sand and gravel, manufactured to specific sizes, grades and chemistry for use primarily in construction applications. The Company’s operations consist primarily of open pit quarries; however, the Company is also the largest operator of underground aggregates mines in the United States, with 14 active underground mines located in the East Group. The Company’s aggregates reserves average approximately 90 years at the 2020 annual production level.
Cement is the basic agent used to bind aggregates, sand and water in the production of ready mixed concrete. The Company has a strategic and leading cement position in the state of Texas, with production facilities in Midlothian, Texas, south of Dallas/Fort Worth, and Hunter, Texas, north of San Antonio. These two facilities produce Portland and specialty cements, have a combined annual capacity of approximately 4.5 million tons, and collectively operated at approximately 80% utilization in 2020. The Midlothian plant has a permit that allows for annual capacity expansion of 0.8 million tons. In addition to the two production facilities, the Company operates several cement distribution terminals. Calcium carbonate in the form of limestone is the principal raw material used in the production of cement. The Company owns more than 600 million tons of limestone reserves adjacent to its cement production plants.
Ready mixed concrete, a mixture primarily of cement, sand, aggregates and water, is measured in cubic yards and specifically batched or produced for customers’ construction projects and then transported and poured at the project site. The aggregates used for ready mixed concrete are a washed material with limited amounts of fines (i.e., dirt and clay). The Company operates 120 ready mix plants in Texas, Colorado and Wyoming. Asphalt is most commonly used in surfacing roads and parking lots and consists of liquid asphalt, or bitumen, the binding medium, and aggregates. Similar to ready mixed concrete, each asphalt batch is produced to customer specifications. The Company’s asphalt operations and paving services are located in Colorado. Market dynamics for these downstream product lines include a highly competitive environment and lower barriers to entry compared with the Company’s upstream product lines of aggregates and cement.
End-Use Trends
| • | According to the U.S. Geological Survey, for the nine months ended September 30, 2020, the latest available governmental data, estimated construction aggregates consumption decreased 3% compared with the nine months ended September 30, 2019, and for the ten months ended October 31, 2020, cement consumption was essentially flat versus the comparable prior-year period. |
|---|
| • | National construction spending statistics for the twelve months ended December 31, 2020 versus the twelve months ended December 31, 2019, according to U.S. Census Bureau: |
|---|
♦Total value of construction put in place increased 5%
♦Public construction spending increased 5%
♦Private nonresidential construction market spending decreased 3%
♦Private residential construction market spending increased 12%
The principal end-use markets of the Building Materials business are public infrastructure (i.e., highways; streets; roads; bridges; and schools); nonresidential construction (i.e., manufacturing and distribution facilities; industrial complexes; office buildings; large retailers and wholesalers; healthcare, hospitality and energy-related activity); and residential construction (i.e., subdivision development; and single- and multi-family housing). Aggregates are also used in agricultural, utility and environmental applications and as railroad ballast, collectively comprising the ChemRock/Rail market.
Public infrastructure projects can require several years to complete, while residential and nonresidential construction projects are usually completed within one year. Generally, customer purchase orders do not contain firm quantity commitments, regardless of end-use market. Therefore, management does not utilize a Company backlog in managing its business.
| A World-Class Organization Built for Success | | Form 10-K ♦ Page 33 |
|---|
Part II ♦ Item 7 – Management’s Discussion and Analysis of Financial Condition and Results of Operations
 The public infrastructure market accounted for 36% of the Company’s aggregates shipments in 2020. Anticipated lower shipments in portions of North Carolina, reduced energy-sector activity and COVID-19-driven project delays were primary factors for the 1% shipment decline to this end use. The Company’s shipments to this end-use market remain below the most recent five-year average of 38% and ten-year average of 43%.
While construction spending in the public and private market sectors is affected by economic cycles, the historic level of spending on public infrastructure projects has been comparatively more stable due to the predictability of funding from federal, state and local governments, with approximately half of the funding from federal government and half from state and local governments. The Fixing America’s Surface Transportation Act (FAST Act), signed into law on December 4, 2015, authorized $305 billion over fiscal years 2016 through 2020 and was subsequently extended for one year, providing an additional $13.6 billion to the Highway Trust Fund.
Public construction projects, once awarded, are typically seen through to completion. Thus, delays from weather or other factors can serve to extend the duration of the construction cycle. State and local initiatives that support infrastructure funding, including gas tax increases and other ballot initiatives, are increasing in size and number as these governments recognize the need to play an expanded role in public infrastructure funding. In November 2020, 303 state and local ballot initiatives, or 94% of all infrastructure funding measures up for vote, were approved. That set a 20-year approval rating record. The approved infrastructure initiatives are estimated to generate nearly $14 billion in one-time and recurring revenues, with initiatives in Texas accounting for over $11 billion of this total.
 The nonresidential construction market accounted for 34% of the Company’s aggregates shipments in 2020. Following strong activity in 2019, aggregates shipments to this end use decreased 9%, reflecting reduced energy-sector activity from low oil prices and the completion of certain windfarm and a pause in some liquefied natural gas projects. The Dodge Momentum Index, a twelve-month leading indicator of construction spending for nonresidential building compiled by McGraw-Hill Construction and where the year 2000 serves as an index basis of 100, was 134.6 in December 2020. While down 5% compared with December 2019, the index increased 9% from November 2020 to December 2020, suggesting positive momentum in the nonresidential construction sector at the onset of 2021.
 The residential construction market accounted for 24% of the Company’s aggregates shipments in 2020, and increased 6% compared with 2019. This end use is interest rate sensitive and typically moves in direct correlation with economic cycles. The Company’s exposure to residential construction is split between aggregates used in the construction of subdivisions (including roads, sidewalks, utilities and storm and sewage drainage), aggregates used in new single-family home construction and aggregates used in construction of multi-family units. Construction of both subdivisions and single-family homes is nearly three times more aggregates intensive than construction of multi-family units. Through an economic cycle, multi-family construction generally begins early in the cycle and then transitions to single-family construction. Therefore, the timing of new subdivision starts, as well as new single-family housing permits, are strong indicators of residential volumes. Residential housing starts of 1.4 million units for the year ended December 31, 2020 increased 7% compared with 2019, but remain below the 50-year historical annual average of 1.5 million units. For the year ended December 31, 2020, national housing permits increased 5% versus 2019. The Company expects continued growth in the residential market driven by undersupply, low interest rates, favorable demographics, job growth, deurbanization, land availability and efficient permitting.
| Form 10-K ♦ Page 34 | | A World-Class Organization Built for Success |
|---|---|---|
Part II ♦ Item 7 – Management’s Discussion and Analysis of Financial Condition and Results of Operations
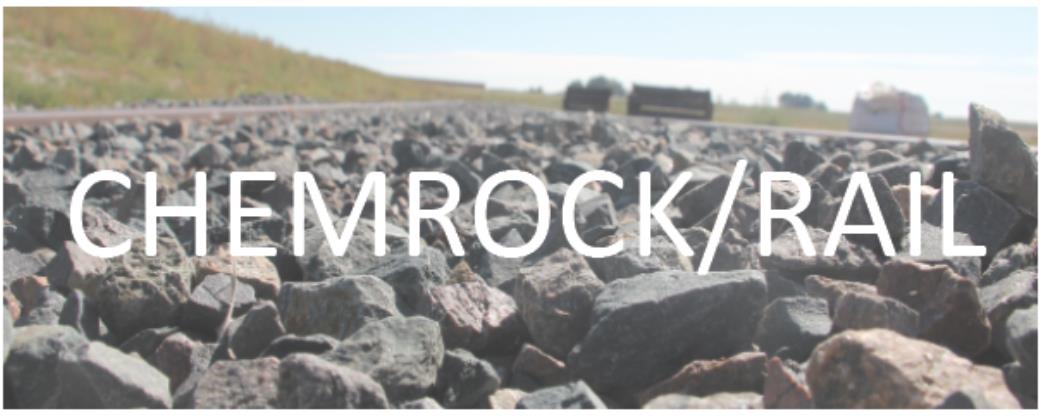 The remaining 6% of the Company’s 2020 aggregates shipments was to the ChemRock/Rail market, which includes ballast and agricultural limestone. Ballast is an aggregates product used to stabilize railroad track beds and, increasingly, concrete rail ties are being used as a substitute for wooden ties. Agricultural lime, a high-calcium carbonate material, is used as a supplement in animal feed, a soil acidity neutralizer and agricultural growth enhancer. Additionally, ChemRock/Rail includes rip rap, which is used as a stabilizing material to control erosion caused by water runoff at embankments, ocean beaches, inlets, rivers and streams, and high-calcium limestone, which is used as filler in glass, plastic, paint, rubber, adhesives, grease and paper. Chemical-grade, high-calcium limestone is used as a desulfurization material in utility plants.
Pricing Trends
Materials pricing for construction projects is generally based on terms committing to the availability of specified products of a stated quantity at an agreed-upon price during a definitive period. Since infrastructure projects span multiple years, announced price changes can have a lag time before taking effect while the Company sells products under existing price agreements. Pricing escalators included in multi-year infrastructure contracts serve to somewhat mitigate this effect. However, during periods of sharp or rapid increases in production costs, multi-year infrastructure contract pricing may provide only nominal pricing growth. Additionally, the Company may implement mid-year price increases, on a market-by-market basis, where appropriate. Pricing is determined locally and is affected by supply and demand characteristics of the local market.

On a mix-adjusted basis, which is discussed further in the Results of Operations section, 2020 aggregates pricing improved by 4.0% and 2020 cement pricing increased 3.2%.
Cost Structure
Direct production costs for the Building Materials business are components of cost of revenues incurred at the quarries, mines, cement plants, ready mixed concrete plants, asphalt plants and paving operations and distribution yards and facilities. Cost of revenues also includes the cost of resale materials, freight expenses to transport materials from a producing quarry or cement plant to a distribution yard or facility and production overhead costs.
Generally, the significant components of direct production costs for the Building Materials business are (1) labor and related benefits; (2) raw materials; (3) depreciation, depletion and amortization (DDA); (4) repairs and maintenance; (5) contract
| A World-Class Organization Built for Success | | Form 10-K ♦ Page 35 |
|---|
Part II ♦ Item 7 – Management’s Discussion and Analysis of Financial Condition and Results of Operations
services; (6) supplies; and (7) energy. In 2020, these categories represented 90% of the Building Materials business’ total direct production costs.
Production is the key driver in determining the levels of variable costs, as it affects the number of hourly employees and related labor hours. Further, components of energy, supplies and repairs and maintenance costs also increase in connection with higher production volumes. Variable costs are expenses that fluctuate with the level of production volume, while fixed costs are expenses that do not vary based on production or sales volume. Accordingly, the Company’s operating leverage can be substantial.
Generally, when the Company invests capital in facilities and equipment, increased capacity and productivity, along with reduced labor and repair costs, can offset increased fixed depreciation costs. However, the increased productivity and related efficiencies may not be fully realized in a lower-demand environment, resulting in under absorption of fixed costs.
Wage and benefit inflation and increases in labor costs may be somewhat mitigated by enhanced productivity in an expanding economy. Further, workforce reductions resulting from process automation and mobile fleet right-sizing, primarily in the aggregates operations, have mitigated rising labor costs. During economic downturns, the Company reviews its operations and, where practical, temporarily idles certain sites. The Company is able to serve these markets with other open facilities that are in close proximity. In certain markets, management can create production “super crews” that work on a rotating basis at various locations within a district. For example, within a market, a crew may work three days per week at one quarry and the other two workdays at another quarry. This has allowed the Company to responsibly manage headcount in periods of lower demand.
The production of ready mixed concrete and asphalt requires the use of cement and liquid asphalt raw materials, respectively. Therefore, fluctuations in prices for these raw materials directly affect the Company’s operating results.
Cement production is a capital-intensive operation with high fixed costs to run plants that operate continuously with the exception of maintenance shutdowns. Kiln and finishing mill maintenance typically requires a plant to be shut down for a period of time as repairs are made. In 2020 and 2019, the cement operations incurred outage costs of $19.7 million and $26.3 million, respectively. The decrease in outage costs in 2020 compared with 2019 is primarily attributable to improved kiln reliability resulting from prior-period investments and the timing of planned kiln outages. The Company adjusts production levels in anticipation of planned maintenance shutdowns.
Typically, diesel fuel represents the single largest component of energy costs for the Building Materials business. The average cost per gallon was $1.49 and $2.08 in 2020 and 2019, respectively. Changes in energy costs also affect the prices that the Company pays for related supplies, including explosives, conveyor belting and tires. Further, the Company’s contracts of affreightment for shipping products on its rail and waterborne distribution network typically include provisions for escalations or reductions in the amounts paid by the Company if the price of fuel moves outside a stated range.
The impact of inflation on the Company’s businesses has not been significant. Further, historically, the Company has achieved pricing growth in periods of inflation based on its ability to increase its selling prices in a normal economic environment.
| Form 10-K ♦ Page 36 | | A World-Class Organization Built for Success |
|---|---|---|
Part II ♦ Item 7 – Management’s Discussion and Analysis of Financial Condition and Results of Operations
Building Materials Business’ Key Considerations

Geography is critically important as products are sourced and sold locally
The Company’s geographic footprint is primarily in attractive markets with strong, underlying growth characteristics, including population growth and/or population density and business and economic diversity, both of which generate demand for construction and the Company’s Building Materials products. The Company has a presence in most of the megaregions of the United States, notably: Texas Triangle, Gulf Coast, Piedmont Atlantic, Front Range and Florida, each of which is discussed below. Additionally, Iowa is discussed below as a top five revenue-generating state and, while not part of a megaregion, is an attractive market with a diversified economy.
Texas Triangle and Gulf Coast
The Texas Triangle is primarily defined by the anchoring metropolises of Dallas/Fort Worth, San Antonio and Houston. Approximately two-thirds of Texans call the Texas Triangle home, and the three anchoring cities had an estimated population of nearly 18 million as of July 1, 2019 as reported by the U.S. Census Bureau. The megaregion’s population is expected to exceed 35 million by 2050. The Texas Triangle contains the headquarters of 48 Fortune 500 companies and represents a diverse economy, including the finance, technology, transportation and goods and services sectors.
Uniquely, Houston, which has represented over 25% of Texas’ gross domestic product (GDP) for the past nineteen years, is considered part of both the Gulf Coast and the Texas Triangle megaregions. In addition to Houston, cities in the Gulf Coast megaregion include New Orleans and Baton Rouge, Louisiana. The Gulf Coast megaregion’s population is expected to exceed 16 million in 2025 and 23 million in 2050. The economy is driven by the energy, chemical and transportation sectors.
The Texas market remains one of the strongest in the United States and, according to the Bureau of Economic Analysis, as of September 30, 2020, the state’s GDP comprised 9% of the nation’s $19.1 trillion GDP. In 2019, the latest ranking available, Forbes recognized Dallas, Fort Worth and Houston as the second, 20th and 34th best metros for business and careers, respectively. Texas continues to lead the nation in population growth, and its population is estimated to increase 35% from 2020 to 2040. Houston, San Antonio and Dallas are ranked as the fourth, seventh and ninth, respectively, most populous cities in the United States as of July 1, 2019, the latest available information from the U.S. Census Bureau. Over the ten-year period ended November 2020 and as reported by the U.S. Bureau of Labor Statistics*,* the metropolitan areas of Austin, Dallas,
| A World-Class Organization Built for Success | | Form 10-K ♦ Page 37 |
|---|
Part II ♦ Item 7 – Management’s Discussion and Analysis of Financial Condition and Results of Operations
San Antonio and Houston have experienced employment growth of 40%, 27%, 22% and 18%, respectively. Supported by population growth, Texas leads the country in total housing permits for the year ended December 31, 2020.
The state’s Department of Transportation (TxDOT) let $7.5 billion in construction projects in fiscal 2020 and has a letting budget of $9.5 billion for fiscal 2021 and $7.7 billion for fiscal 2022. In 2019, TxDOT announced the 2020 Unified Transportation Program, identifying planned investments totaling over $77 billion of infrastructure projects over the next ten years. Funding for highway construction comes from dedicated sources, including Propositions 1 and 7, as opposed to the use of general funds. Proposition 1, which passed in 2015, takes a portion of the oil and gas severance tax revenues and allocates them to the state highway fund. Proposition 7 is funded by state sales and use taxes and motor vehicle sales and rental taxes and is used for non-toll roads and certain transportation-related debt. For fiscal 2019 and 2020, these propositions provided $5.4 billion and $4.2 billion, respectively, to the state highway fund. Additionally, in November 2020, voters approved 100% of ballot measures that will provide an additional $11.6 billion of infrastructure funding. Though the COVID-19 pandemic slowed economic advancement temporarily, construction activity is recovering, as evidenced by developers and businesses planning expansion throughout Texas. Amazon, Hewlett Packard, Tesla and Dallas/Fort Worth International Airport have announced plans for significant new projects in Austin, Dallas/Fort Worth and Houston. Further, continued federal regulatory approvals should contribute to increased heavy building materials consumption for large energy-sector projects over for the next several years.
Piedmont Atlantic
The Piedmont Atlantic megaregion generally follows the Interstate 85/20 corridor, spanning across North Carolina, South Carolina, Georgia, Tennessee and Alabama, and includes four primary metropolitan areas: Raleigh-Durham, Charlotte, Atlanta and Birmingham. The Piedmont Atlantic is a fast-growing megaregion; however, it is facing challenges that accompany a growing population, including increased traffic congestion and inadequate infrastructure.
North Carolina continues to demonstrate strong population trends, ranking in the top ten states for population growth for the twelve months ended July 1, 2019, the last annual estimate by the U.S. Census Bureau. North Carolina’s population is estimated to grow to 14 million by 2050. Employment growth in North Carolina has been steady and consistent. Further, in 2019, Forbes ranked Raleigh and Charlotte as the third and seventh best cities, respectively, for business and careers. In 2020, UPS, Grifols Therapeutics and Centene announced plans to invest more than $1.7 billion in North Carolina. The state continues to make significant infrastructure investment, with a fiscal year 2021 overall spending schedule of $5.8 billion. Additionally, since 2010, all transportation referendums totaling $1.8 billion have been approved by voters. In October 2020, the state issued $700 million of Build NC Bonds to fund transportation initiatives. The state’s 2020-2029 Statewide Transportation Improvement Program, or STIP, reflects investment of approximately $23.7 billion for approximately 1,700 projects. In January 2021, the North Carolina Future Investment Resources for Sustainable Transportation, or NC FIRST, Commission issued an extensive report to the state’s transportation secretary, recommending an additional transportation investment need of $20 billion over the next decade.
South Carolina ranked sixth in the nation for population growth for the twelve months ended July 1, 2019. The state’s infrastructure program is supported by Senate Bill 1258, also known as Act No. 275 and enacted in 2016, allowing up to $4.2 billion to be devoted to highway spending over a ten-year period. South Carolina’s ten-year department of transportation (DOT) plan includes 1,000 miles of upgrades to rural roads and improvements to 140 miles of interstate highways. To fund infrastructure needs, the state passed House Bill 3516 in June 2017, which increased the state’s gas tax $0.02 per gallon per year for six years, the state’s first gas tax increase in 30 years. The bill is expected to generate an additional $625 million per year when fully implemented. Additionally, since 2010, voters approved 78% of ballot measures for transportation funding totaling $3.6 billion. The nonresidential market will benefit from recent announcements by businesses planning to expand their operations in South Carolina, including Continental Tire, Vigilent Labs, Nephron Pharmaceuticals Corporation and Carver Maritime, LLC. Additionally, the South Carolina Port Authority is investing $2.8 billion for improvements through 2022.
With nearly 3% of the nation’s GDP, Georgia continues to be a top-performing state. According to the Georgia Department of Economic Development, the state is headquarters for 18 Fortune 500 companies and has obtained $4.3 billion in expansions and new project investments since July 1, 2020, creating almost 12,000 jobs. Georgia has consistently ranked as one of the top states for employment and population growth. For all U.S. metropolitan areas with populations greater than one million, Atlanta ranked 18th in employment gains for the ten-year period ended November 2019. Georgia’s Major Mobility Investment Program, announced in 2017 and updated in 2019, will invest $11 billion over a ten-year period in 13 highway projects. Additionally, since 2010, Georgia voters approved more than two-thirds of ballot measures to collectively provide $7.3 billion for road and transit projects.
| Form 10-K ♦ Page 38 | | A World-Class Organization Built for Success |
|---|---|---|
Part II ♦ Item 7 – Management’s Discussion and Analysis of Financial Condition and Results of Operations
Front Range
Through strategic acquisitions since 2011, the Company has built a leading position to serve the Front Range of the Rocky Mountains. Extending from the southern portion of Wyoming near Cheyenne, following Interstate 25 through Colorado into New Mexico, incorporating Santa Fe and Albuquerque, the Front Range megaregion is one of the nation’s fastest-growing megaregions. Colorado has ranked in the top eleven states for population growth each year for the ten-year period ended 2020. The Front Range represents 85% of Colorado’s population and is estimated to exceed 10 million residents by 2050, nearly double the 2010 population.
The Colorado economy includes a diverse economic base, leading to strong employment and population growth. Denver was ranked fourth by Forbes for best cities for business and careers in 2019. Senate Bill 17-267, enacted in 2017, includes a component focused on new lease-purchase agreements of state facilities that allocates $1.9 billion of its proceeds to Colorado DOT (CDOT) with the remainder of its proceeds to transportation and capital construction projects over a four-year period. CDOT has a spending budget of $2.3 billion for fiscal year 2020-2021.
Florida
Spanning nearly the entire state, the Florida megaregion is rapidly expanding. Florida is the country’s third-most populous state according to the Census Bureau. Further, the state’s population is estimated to increase by more than seven million, or 32%, from 2020 to 2040. The state’s GDP represents 5% of the nation’s GDP.
Florida has a $9.2 billion DOT budget for fiscal year 2020-2021 and a five-year adopted work plan of $54.3 billion through 2025.
Iowa
Iowa has been a top-five Martin Marietta revenue-generating state for decades and has historically experienced a stable and steady economy. Iowa is the nation’s largest corn- and pork-producing state and provides approximately 9% of America’s food supply. The Company’s agricultural lime shipments are dependent on, among other things, weather, demand for agricultural commodities (including corn and soybeans), commodity prices and farm and land values. The Iowa economy has become consistently more diverse over the past several years, in part due to both its low cost and ease of doing business. The state is attractive for starting and expanding businesses due to enticing tax incentives. Facebook is in process of expanding its data center, estimated to be 3.5 million square feet when complete, and has a projected completion date in late 2022 or early 2023. In 2020, Microsoft Corporation announced plans to build two new data centers at an estimated cost of $1 billion each, with construction expected to begin in September 2021. Additionally, Apple plans to build a $1.3 billion data center near Des Moines, with an estimated project completion date of August 2027.
Growth markets with limited supply of indigenous stone must be served via a long-haul distribution network
The U.S. Department of the Interior’s geological map of the United States depicts the possible sources of indigenous rock and illustrates its limited supply in certain areas of the United States, including the coastal areas from Virginia to Texas. Further, certain interior United States markets may experience limited availability of locally sourced aggregates resulting from increasingly restrictive zoning, permitting and/or environmental laws and regulations. The Company’s long-haul distribution network is used to supplement, or in many cases wholly supply, the local crushed stone needs of these areas. 
The long-haul distribution network can diversify market risk for locations that engage in long-haul transportation of aggregates products. This is particularly true where a producing quarry serves a local market and transports products via rail, water and/or truck to be sold in other markets, the risk of a downturn in one market may be somewhat mitigated by other markets served by the location.
| A World-Class Organization Built for Success | | Form 10-K ♦ Page 39 |
|---|
Part II ♦ Item 7 – Management’s Discussion and Analysis of Financial Condition and Results of Operations
Product shipments are moved by rail, water and truck through the Company’s long-haul distribution network. The Company’s rail network primarily serves its Texas, Florida, Colorado and Gulf Coast markets, while the Company’s Bahamas and Nova Scotia locations transport materials via oceangoing ships. The Company’s strategic focus includes expanding inland and offshore capacity and acquiring distribution yards and port locations to offload transported material. At December 31, 2020, the distribution network available to the Company consisted of 84 terminals.
The Company’s increased rail shipments has made it more reliant on railroad performance issues, including track congestion, crew and availability, the effects of adverse weather conditions and the ability to negotiate favorable railroad shipping contracts. Further, changes in the operating strategy of rail transportation providers can create operational inefficiencies and increased costs from the Company’s rail network.
A portion of railcars and all ships of the Company’s long-haul distribution network are under short- and long-term leases, some with purchase options, and contracts of affreightment. The limited availability of water and rail transportation providers, coupled with limited distribution sites, can adversely affect lease rates for such services and ultimately the freight rates.
The Company has long-term agreements providing dedicated shipping capacity from its Bahamas and Nova Scotia operations to its coastal ports. These contracts of affreightment are take-or-pay contracts with minimum and maximum shipping requirements. The minimum requirements were met in 2020. The Company’s waterborne contracts of affreightment have varying expiration dates ranging from 2023 to 2027 and generally contain renewal options. However, there can be no assurance that such contracts can be renewed upon expiration or that terms will continue without significant increases.
The multiple transportation modes that have been developed with various rail carriers and deep-water ships provide the Company with the flexibility to effectively serve customers primarily in the Southwest and Southeast coastal markets.
Public Infrastructure, the Company’s largest end-use market, is funded through a combination of federal, state and local sources
Transportation investments generally boost the national economy by enhancing mobility and access and by creating jobs; priorities of many of the government’s economic plans. Public-sector construction related to transportation infrastructure can be aggregates intensive and is funded through a combination of federal, state and local sources. The federal highway bill, currently the FAST Act, provides annual funding for public-sector highway construction projects and includes spending authorizations, which represent the maximum financial obligation that will result from the immediate or future outlays of federal funds for highway and transit programs. The federal government’s surface transportation programs are funded mostly through the receipts of highway user taxes placed in the Highway Trust Fund, which is divided into the Highway Account and the Mass Transit Account. Revenues credited to the Highway Trust Fund are primarily derived from a federal gas tax, a federal tax on certain other motor fuels and interest on the accounts’ accumulated balances. Of the currently imposed federal gas tax of $0.184 per gallon, which has been static since 1993, $0.15 is allocated to the Highway Account of the Highway Trust Fund.
Since most states are required to balance their budgets, reductions in revenues generally require a reduction in states’ expenditures. However, the impact of state revenue reductions on highway investment will vary depending on whether the monies come from dedicated revenue sources, such as highway user fees, or whether portions are paid for with general funds.
In addition to federal appropriations, each state funds its infrastructure investment from specifically allocated amounts collected from various user fees, typically gasoline taxes and vehicle fees. Over the past several years, states have assumed a significantly larger role in funding infrastructure investment, including initiating special-purpose taxes and raising gas taxes. Management believes that financing at the state and local levels, such as bond issuances, toll roads and tax initiatives, will continue to grow and have a fundamental role in advancing infrastructure projects. State infrastructure investment generally leads to increased growth opportunities for the Company. The level of state public-works spending is varied across the nation and dependent upon individual state economies. The degree to which the Company could be affected by a reduction or slowdown in infrastructure spending varies by state. The state economies of the Building Materials business’ ten largest revenue-generating states may disproportionately affect the Company’s financial performance.
Governmental appropriations and expenditures are typically less interest rate-sensitive than private-sector spending. Obligations of federal funds are a leading indicator of highway construction activity in the United States. Before a state or local DOT can solicit bids on an eligible construction project, it enters into an agreement with the Federal Highway Administration to obligate the federal government to pay its portion of the project cost. Federal obligations are subject to annual funding appropriations by Congress.
| Form 10-K ♦ Page 40 | | A World-Class Organization Built for Success |
|---|---|---|
Part II ♦ Item 7 – Management’s Discussion and Analysis of Financial Condition and Results of Operations
The need for surface transportation improvements continues to significantly outpace the amount of available funding. A large number of roads, highways and bridges built following the establishment of the Interstate Highway System in 1956 are now in need of major repair or reconstruction. According to The Road Information Program (TRIP), a national transportation research group, vehicle travel on United States highways increased 25% from 2000 to 2018, while new lane road mileage increased only 9% over the same period. TRIP also reports that pavement on 11% of the nation’s major roads are in poor or mediocre condition and 27% of the nation’s interstate bridges are in need of repair or replacement, with 3% of bridges rated poor or structurally deficient. The 2020 TRIP report additionally stated an estimated backlog of $123 billion of improvements to the nation’s highway system exists and an increase of annual investment from $23 billion to $57 billion for the next 20 years is needed to address these improvements and meet mobility needs. Management believes infrastructure activity for 2021 and beyond should benefit from the FAST Act extension and its eventual successor bill, additional state and local infrastructure initiatives and the 2017 Tax Act.
In addition to highways and bridges, transportation infrastructure includes aviation, mass transit, and ports and waterways. Railroad construction continues to benefit from economic growth, which ultimately generates a need for additional maintenance and improvements.
Erratic weather can significantly impact operations
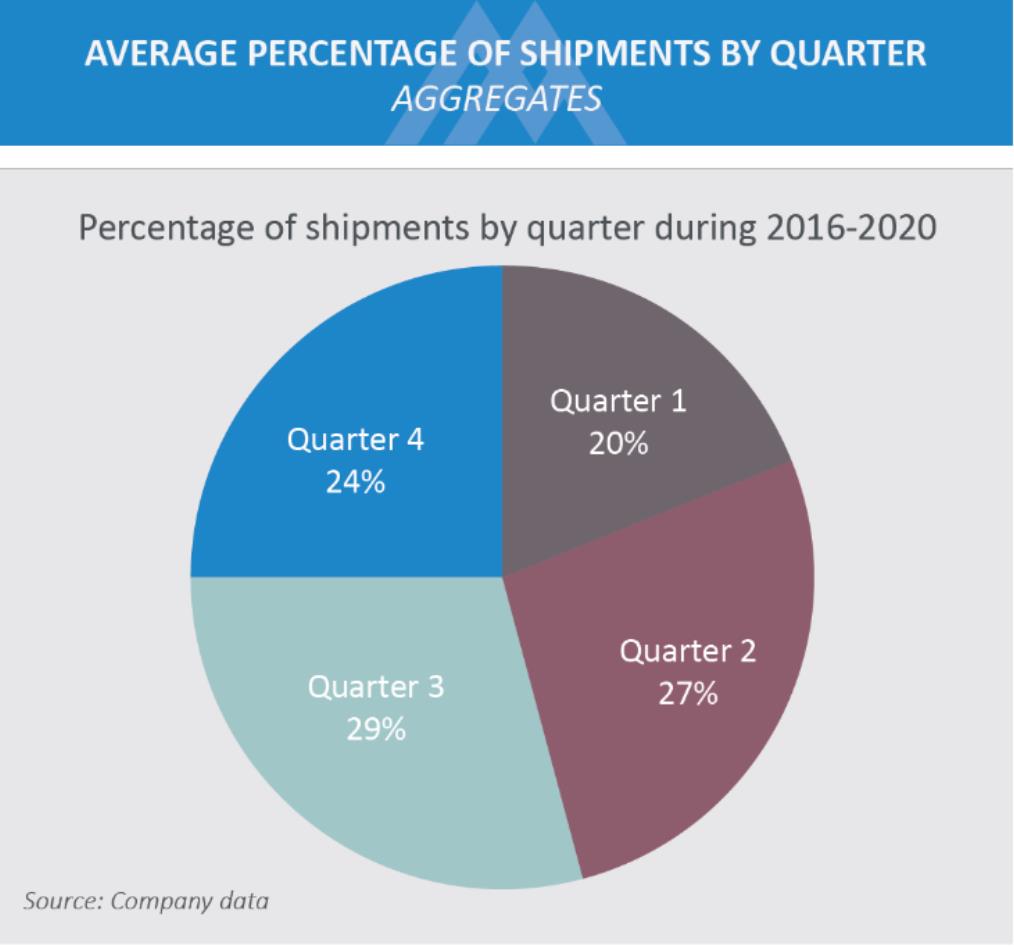 Production and shipment levels for the Building Materials business correlate with general construction activity, most of which occurs outdoors and, as a result, is affected by erratic weather, seasonal changes and other climate-related conditions which can significantly affect the business. Typically, due to a general slowdown in construction activity during winter months, the first and fourth quarters experience lower production and shipment activity. As such, temperature plays a significant role in the months of March and November, meaningfully affecting the Company’s first- and fourth-quarter results, respectively, where warm and/or moderate temperatures in March and November allow the construction season to start earlier and end later, respectively.
Excessive rainfall jeopardizes production efficiencies, shipments and profitability in all markets served by the Company. In particular, the Company’s operations in the southeastern and Gulf Coast regions of the United States and The Bahamas are at risk for hurricane activity, most notably in August, September and October, though the hurricane season formally starts and ends on June 1 and November 1, respectively. The 2020 Atlantic hurricane season set a record with 30 named storms, of which 13 were hurricanes. To put this in perspective, the average hurricane season has 12 named storms, of which six are hurricanes. The Gulf Coast, eastern seaboard, The Bahamas and Nova Scotia were all impacted by storms in 2020.
Capital investment decisions driven by capital intensity of the Building Materials business and focus on land
The Company’s organic capital program is designed to leverage construction market growth through investment in both permanent and portable facilities at the Company’s operations. Over an economic cycle, the Company typically invests organic capital at an annual level that approximates depreciation expense. At mid-cycle and through cyclical peaks, organic capital investment typically exceeds depreciation expense, as the Company supports current capacity needs and future growth. Conversely, at a cyclical trough, the Company may reduce levels of capital investment. Regardless of cycle, the Company sets a priority of investing capital to ensure safe, environmentally-sound and efficient operations, as well as to provide the highest quality of customer service and establish a foundation for future growth.
The Company is diligent in its focus on land opportunities, including potential new sites (greensites) and expanding locations. Land purchases are usually opportunistic and can include contiguous property around existing quarry locations. Such property can serve as buffer property or additional mineral reserve capacity, assuming regulatory hurdles can be cleared and the underlying geology supports economical aggregates mining. In either instance, the acquisition of additional property around an existing quarry typically allows the expansion of the quarry footprint and an extension of quarry life.
| A World-Class Organization Built for Success | | Form 10-K ♦ Page 41 |
|---|
Part II ♦ Item 7 – Management’s Discussion and Analysis of Financial Condition and Results of Operations
Magnesia Specialties Business
The Magnesia Specialties business manufactures magnesia-based chemicals products for industrial, agricultural and environmental applications at its Manistee, Michigan facility. The Magnesia Specialties business produces and sells dolomitic lime from its Woodville, Ohio facility. Of 2020 total revenues, 67% were attributable to chemicals products, 32% were attributable to lime and 1% was attributable to stone.
In 2020, 79% of the lime produced was sold to third-party customers, while the remaining 21% was used internally as a raw material for the business’ manufacturing of chemicals products. Dolomitic lime products sold to external customers are primarily used by the steel industry, and overall, 34% of Magnesia Specialties’ 2020 total revenues related to products used in the steel industry. Accordingly, a portion of the segment’s revenues and profits is affected by production and inventory trends within the steel industry, which are guided by the rate of consumer consumption, the flow of offshore imports and other economic factors. Steel production was adversely affected by COVID-19, notably when domestic auto manufacturers shutdown due to the pandemic. Steel capacity utilization decreased dramatically from a high of nearly 81% in January 2020 to just below 50% in April 2020; steel capacity utilization as of December 2020 was 74%. The dolomitic lime business runs most profitably at 70% or greater steel capacity utilization; domestic capacity utilization averaged 65% in 2020. The chemical products business focuses on higher-margin specialty chemicals that can be produced at volumes that support efficient operations. 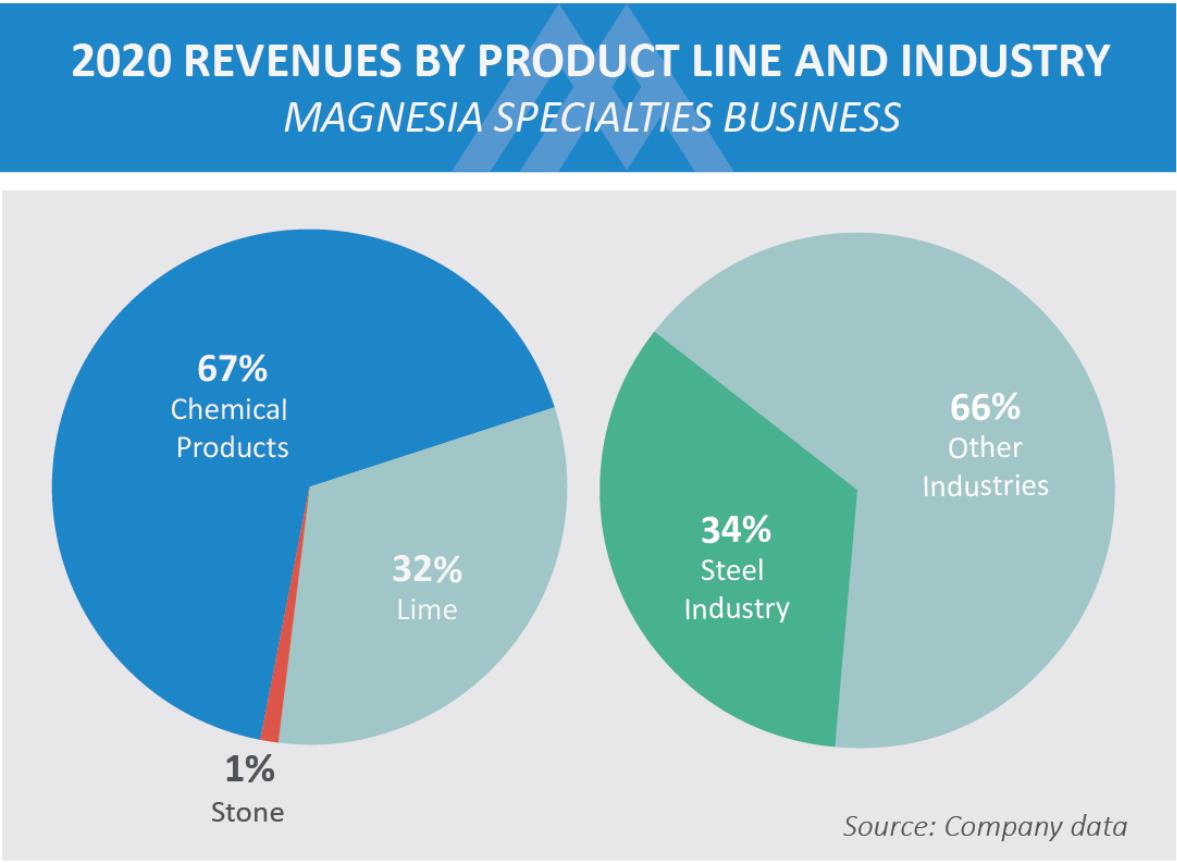
Total revenues of the Magnesia Specialties business in 2020 were predominantly derived from domestic customers, and no single foreign country accounted for 10% or more of the total revenues for the business. Financial results can be affected by foreign currency exchange rates, increasing transportation costs or weak economic conditions in foreign markets. To mitigate the short-term effect of currency exchange rates, foreign transactions are denominated in United States dollars.
A significant portion of the Magnesia Specialties business’ costs is of a fixed or semi-fixed nature. The production process requires the use of natural gas, coal and petroleum coke. Therefore, fluctuations in their pricing directly affect operating results. To help mitigate this risk, the Company has fixed-price agreements for approximately 63% of its 2021 energy needs for coal, natural gas, petroleum coke and electricity. For 2020, the segment’s average cost per MCF (thousand cubic feet) of natural gas decreased 9% versus 2019. Given high fixed costs, low capacity utilization can negatively affect the segment’s results of operations. Management expects future organic profitability growth to result from increased pricing, rationalization of the current product portfolio and/or further cost reductions. 
The Magnesia Specialties business is highly dependent on rail transportation, particularly for movement of dolomitic lime from Woodville to Manistee and direct customer shipments of dolomitic lime and magnesia chemicals products from both Woodville and Manistee. The segment can be affected by the risks mentioned in the long-haul distribution discussion in the Building Materials Business’ Key Considerations section.
| Form 10-K ♦ Page 42 | | A World-Class Organization Built for Success |
|---|---|---|
Part II ♦ Item 7 – Management’s Discussion and Analysis of Financial Condition and Results of Operations
Environmental Regulation and Litigation
The expansion and growth of the aggregates industry is subject to increasing challenges from environmental and political advocates aiming to control the pace and direction of future development. Certain environmental groups have published lists of targeted municipal areas, including areas within the Company’s marketplace, for environmental and suburban growth control. The effect of these initiatives on the Company’s growth is typically localized. Further challenges are expected as the momentum of these initiatives ebb and flow across the United States. Rail and other transportation alternatives are being heralded by these special-interest groups as solutions to mitigate road traffic congestion and overcrowding.
The Company’s operations are subject to and affected by federal, state and local laws and regulations relating to the environment, health and safety and other regulatory matters. Certain of the Company’s operations may occasionally use substances classified as toxic or hazardous. The Company regularly monitors and reviews its operations, procedures and policies for compliance with these laws and regulations. Despite these compliance efforts, risk of environmental liability is inherent in the operation of the Company’s businesses, as it is with other companies engaged in similar businesses.
Environmental operating permits are, or may be, required for certain of the Company’s operations; such permits are subject to modification, renewal and revocation. New permits are generally required for opening new sites or for expansion at existing operations and can take several years to obtain. In the area of land use, rezoning and special or conditional use permits are increasingly difficult to obtain. Once a permit is issued, the location is required to generally operate in accordance with the approved site plan.
The Clean Air Act, originally passed in 1963 and periodically updated by amendments, is the United States’ national air pollution control program that granted the Environmental Protection Agency (EPA) authority to set limits on the level of various air pollutants. To be in compliance with National Ambient Air Quality Standards, a defined geographic area must be below established limits for six pollutants. Environmental groups have been successful in lawsuits against the federal and certain state departments of transportation, delaying highway construction in municipal areas not in compliance with the Clean Air Act. The EPA designates geographic areas as nonattainment areas when the level of air pollutants exceeds the national standard. Nonattainment areas receive deadlines to reduce air pollutants by instituting various control strategies or otherwise face fines or control by the EPA. Included as nonattainment areas are several major metropolitan areas in the Company’s markets, such as Houston/Brazoria/Galveston, Texas; Dallas/Fort Worth, Texas; Bexar County in San Antonio-New Braunfels, Texas; Denver, Colorado; Boulder, Colorado; Fort Collins/Greeley/Loveland, Colorado; Atlanta, Georgia; and Baltimore, Maryland. Federal transportation funding has been directly tied to compliance with the Clean Air Act.
Large emitters (facilities that emit 25,000 metric tons or more per year) of greenhouse gases (GHG) must report GHG generation to comply with the EPA’s Mandatory Greenhouse Gases Reporting Rule (GHG Rule). The Company files annual reports in accordance with the GHG Rule relating to operations at its two cement plants in Texas, as well as its Magnesia Specialties facilities in Woodville, Ohio, and Manistee, Michigan, each of which emit certain GHG, including carbon dioxide, methane and nitrous oxide. If Congress passes legislation on GHG, these operations will likely be subject to the new program. The Company believes that any increased operating costs or taxes related to GHG emission limitations at its cement or Woodville operations would be passed on to its customers. The Manistee facility may have to absorb extra costs due to the regulation of GHG emissions in order to maintain competitive pricing in its markets. The Company cannot reasonably predict how much those increased costs may be.
The Company is engaged in certain legal and administrative proceedings incidental to its normal business activities. In the opinion of management, based upon currently available facts, the likelihood is remote that the ultimate outcome of any litigation or other proceedings, including those pertaining to environmental matters, relating to the Company and its subsidiaries, will have a material adverse effect on the overall results of the Company’s operations, cash flows or financial position.
| A World-Class Organization Built for Success | | Form 10-K ♦ Page 43 |
|---|
Part II ♦ Item 7 – Management’s Discussion and Analysis of Financial Condition and Results of Operations
FINANCIAL OVERVIEW
In 2020, the Company achieved record products and services revenues, consolidated gross profit, consolidated earnings from operations, net earnings attributable to Martin Marietta, diluted earnings per share and consolidated Adjusted EBITDA (defined below). The Building Materials business achieved gross margin expansion of 160 basis points, with growth across all product lines. The Magnesia Specialties business experienced a continued decline in chemicals products sales as both domestic and international customer experienced a downturn in economic activity related to COVID-19.
Results of Operations
The discussion and analysis that follow reflect management’s assessment of the financial condition and results of operations (MD&A) of the Company and should be read in conjunction with the audited consolidated financial statements. As discussed in more detail, the Company’s operating results are highly dependent upon activity within the construction marketplace, economic cycles within the public and private business sectors and seasonal and other weather-related conditions. Though the Company’s operations have been considered an essential business during stay-a-home orders in 2020, the continuation of the COVID-19 pandemic has impacted markets in which the Company operates. Accordingly, financial results for any year presented, or year-to-year comparisons of reported results, may not be indicative of future operating results. As permitted by the Securities and Exchange Commission (SEC) under the FAST Act Modernization and Simplification of Regulation S-K, the Company has elected to omit the discussion of the earliest period (2018) presented as it was included in its MD&A in its 2019 Form 10-K filed on February 21, 2020, incorporated by reference from Item 7, “Management’s Discussion and Analysis of Financial Condition and Results of Operations” thereto.
The Company’s Building Materials business generated the majority of consolidated total revenues and earnings from operations. The following comparative analysis and discussion should be read within this context. Further, sensitivity analysis and certain other data are provided to enhance the reader’s understanding of MD&A and are not intended to be indicative of management’s judgment of materiality.
The Company’s consolidated operating results and operating results as a percentage of total revenues are as follows:
| years ended December 31 (in millions, except for % of total revenues) | 2020 | % of Total revenues | 2019 | % of Total revenues | |||||||||||||
|---|---|---|---|---|---|---|---|---|---|---|---|---|---|---|---|---|---|
| Product and services revenues | $ | 4,432.1 | $ | 4,422.3 | |||||||||||||
| Freight revenues | 297.8 | 316.8 | |||||||||||||||
| Total Revenues | 4,729.9 | 100.0 | 4,739.1 | 100.0 | |||||||||||||
| Cost of revenues - products and services | 3,175.6 | 3,239.1 | |||||||||||||||
| Cost of revenues - freight | 301.5 | 321.0 | |||||||||||||||
| Total cost of revenues | 3,477.1 | 73.5 | 3,560.1 | 75.1 | |||||||||||||
| Gross Profit | 1,252.8 | 26.5 | 1,179.0 | 24.9 | |||||||||||||
| Selling, general and administrative expenses | 305.9 | 6.5 | 302.7 | 6.4 | |||||||||||||
| Acquisition-related expenses | 1.3 | 0.5 | |||||||||||||||
| Other operating income, net | (59.8 | ) | (9.1 | ) | |||||||||||||
| Earnings from Operations | 1,005.4 | 21.3 | 884.9 | 18.7 | |||||||||||||
| Interest expense | 118.1 | 129.3 | |||||||||||||||
| Other nonoperating (income) and expenses, net | (2.0 | ) | 7.3 | ||||||||||||||
| Earnings before income tax expense | 889.3 | 748.3 | |||||||||||||||
| Income tax expense | 168.2 | 136.3 | |||||||||||||||
| Consolidated net earnings | 721.1 | 15.2 | 612.0 | 12.9 | |||||||||||||
| Less: Net earnings attributable to noncontrolling interests | 0.1 | 0.1 | |||||||||||||||
| Net Earnings Attributable to Martin Marietta | $ | 721.0 | 15.2 | $ | 611.9 | 12.9 |
Consolidated Adjusted EBITDA
Earnings before interest; income taxes; depreciation, depletion and amortization; and the earnings/loss from nonconsolidated equity affiliates (Adjusted EBITDA) is an indicator used by the Company and investors to evaluate the Company’s operating performance from period to period. Adjusted EBITDA is not defined by generally accepted accounting
| Form 10-K ♦ Page 44 | | A World-Class Organization Built for Success |
|---|---|---|
Part II ♦ Item 7 – Management’s Discussion and Analysis of Financial Condition and Results of Operations
principles and, as such, should not be construed as an alternative to net earnings attributable to Martin Marietta, earnings from operations or operating cash flow. However, the Company’s management believes that Adjusted EBITDA may provide additional information with respect to the Company’s performance. Since Adjusted EBITDA excludes some, but not all, items that affect net earnings and may vary among companies, Adjusted EBITDA as presented by the Company may not be comparable to similarly titled measures of other companies.
The following table presents a reconciliation of net earnings attributable to Martin Marietta to consolidated Adjusted EBITDA:
| years ended December 31 | |||||||||||
|---|---|---|---|---|---|---|---|---|---|---|---|
| (in millions) | 2020 | 2019 | |||||||||
| Net earnings attributable to Martin Marietta | $ | 721.0 | $ | 611.9 | |||||||
| Add back: | |||||||||||
| Interest expense, net of interest income | 117.6 | 128.9 | |||||||||
| Income tax expense for controlling interests | 168.2 | 136.3 | |||||||||
| Depreciation, depletion and amortization expense and earnings/loss from nonconsolidated equity affiliates | 386.0 | 377.4 | |||||||||
| Consolidated Adjusted EBITDA | $ | 1,392.8 | $ | 1,254.5 |
Mixed-Adjusted Average Selling Price
Mix-adjusted average selling price (mix-adjusted ASP) is a non-GAAP measure that excludes the impacts of period-over-period product, geographic and other mix on the average selling price. Mix-adjusted ASP is calculated by comparing current-period shipments to like-for-like shipments in the comparable prior period. Management uses this metric to evaluate the realization of pricing increases and believes this information is useful to investors. The following reconciles reported average selling price to mix-adjusted ASP and corresponding variances.
| years ended December 31 | |||||
|---|---|---|---|---|---|
| (in millions) | 2020 | 2019 | |||
| West Group - aggregates: | |||||
| Reported average selling price | $13.82 | $13.59 | |||
| Adjustment for unfavorable impact of product, geographic and other mix | 0.30 | ||||
| Mix-adjusted ASP | $14.12 | ||||
| Reported average selling price variance | 1.7% | ||||
| Mix-adjusted ASP variance | 3.9% | ||||
| Total aggregates: | |||||
| Reported average selling price | $14.77 | $14.33 | |||
| Adjustment for unfavorable impact of product, geographic and other mix | 0.13 | ||||
| Mix-adjusted ASP | $14.90 | ||||
| Reported average selling price variance | 3.1% | ||||
| Mix-adjusted ASP variance | 4.0% | ||||
| Cement: | |||||
| Reported average selling price | $113.88 | $112.75 | |||
| Adjustment for unfavorable impact of product, geographic and other mix | 2.52 | ||||
| Mix-adjusted ASP | $116.40 | ||||
| Reported average selling price variance | 1.0% | ||||
| Mix-adjusted ASP variance | 3.2% |
| A World-Class Organization Built for Success | | Form 10-K ♦ Page 45 |
|---|
Part II ♦ Item 7 – Management’s Discussion and Analysis of Financial Condition and Results of Operations
Adjusted Ready Mixed Concrete Volume Variance
The following table presents ready mixed concrete shipment data and volume variances excluding four ready mixed concrete operations acquired in the third quarter of 2020 and excluding shipments from the Arkansas, Louisiana and eastern Texas ready mix business (ArkLaTex business) that was divested in January 2020 during the period of Martin Marietta's ownership to provide a more comparable analysis of ready mixed concrete volume variance:
| years ended December 31 | |||||||||||
|---|---|---|---|---|---|---|---|---|---|---|---|
| (in millions) | 2020 | 2019 | |||||||||
| Shipments (cubic yards) | |||||||||||
| Reported ready mixed concrete shipments | 8.4 | 8.5 | |||||||||
| Less: ready mixed concrete shipments of acquired operations | (0.2 | ) | — | ||||||||
| Less: ready mixed concrete shipments for the ArkLaTex business during the period of Martin Marietta ownership | — | (0.6 | ) | ||||||||
| Adjusted ready mixed concrete shipments | 8.2 | 7.9 | |||||||||
| Reported ready mixed concrete volume variance | (1.6 | %) | |||||||||
| Adjusted ready mixed concrete volume variance | 3.2 | % |
Total Revenues
The following table presents revenues data for the Company and its reportable segments by product line for the year ended December 31, 2020 and 2019. Prior-year segment information has been reclassified to conform to changes to the reportable segments effective January 1, 2020 and July 1, 2020 (see Note A to the audited consolidated financial statements).
| years ended December 31 | |||||||||
|---|---|---|---|---|---|---|---|---|---|
| (in millions) | 2020 | 2019 | |||||||
| Building Materials business: | |||||||||
| Products and services | |||||||||
| East Group: | |||||||||
| Aggregates | $ | 1,826.6 | $ | 1,814.6 | |||||
| West Group: | |||||||||
| Aggregates | 942.7 | 942.1 | |||||||
| Cement | 452.5 | 439.1 | |||||||
| Ready mixed concrete | 952.1 | 948.1 | |||||||
| Asphalt and paving services | 331.7 | 294.0 | |||||||
| Less: interproduct revenues | (294.4 | ) | (265.5 | ) | |||||
| Products and services | 4,211.2 | 4,172.4 | |||||||
| Freight | 276.0 | 295.4 | |||||||
| Total Building Materials business | 4,487.2 | 4,467.8 | |||||||
| Magnesia Specialties: | |||||||||
| Products | 220.9 | 249.9 | |||||||
| Freight | 21.8 | 21.4 | |||||||
| Total Magnesia Specialties | 242.7 | 271.3 | |||||||
| Total consolidated revenues | $ | 4,729.9 | $ | 4,739.1 |
| Form 10-K ♦ Page 46 | | A World-Class Organization Built for Success |
|---|---|---|
Part II ♦ Item 7 – Management’s Discussion and Analysis of Financial Condition and Results of Operations
Gross Profit
The following table presents gross profit and gross margin data for the Company and its reportable segments by product line for the year ended December 31, 2020 and 2019. Prior-year segment information has been reclassified to conform to changes to the reportable segments effective January 1, 2020 and July 1, 2020 (see Note A to the audited consolidated financial statements).
| 2020 | 2019 | ||||||||||||||
|---|---|---|---|---|---|---|---|---|---|---|---|---|---|---|---|
| years ended December 31 (dollars in millions) | Amount | % of Revenues | Amount | % of Revenues | |||||||||||
| Building Materials business: | |||||||||||||||
| East Group: | |||||||||||||||
| Aggregates | $ | 620.0 | 33.9 | % | $ | 606.2 | 33.4 | % | |||||||
| West Group: | |||||||||||||||
| Aggregates | 228.5 | 24.2 | % | 201.7 | 21.4 | % | |||||||||
| Cement | 170.9 | 37.8 | % | 143.4 | 32.7 | % | |||||||||
| Ready mixed concrete | 79.6 | 8.4 | % | 78.8 | 8.3 | % | |||||||||
| Asphalt and paving services | 60.4 | 18.2 | % | 50.7 | 17.2 | % | |||||||||
| Products and services | 1,159.4 | 27.5 | % | 1,080.8 | 25.9 | % | |||||||||
| Freight | 0.4 | (0.2 | ) | ||||||||||||
| Total Building Materials business | 1,159.8 | 25.8 | % | 1,080.6 | 24.2 | % | |||||||||
| Magnesia Specialties: | |||||||||||||||
| Products and services | 89.6 | 40.6 | % | 99.4 | 39.8 | % | |||||||||
| Freight | (4.1 | ) | (4.0 | ) | |||||||||||
| Total Magnesia Specialties | 85.5 | 35.2 | % | 95.4 | 35.2 | % | |||||||||
| Corporate | 7.5 | 3.0 | |||||||||||||
| Total consolidated gross profit | $ | 1,252.8 | 26.5 | % | $ | 1,179.0 | 24.9 | % |
The following presents a rollforward of the Company’s consolidated gross profit:
| years ended December 31 (in millions) | 2020 | 2019 | |||||||
|---|---|---|---|---|---|---|---|---|---|
| Consolidated gross profit, prior year | $ | 1,179.0 | $ | 966.6 | |||||
| Aggregates: | |||||||||
| Pricing | 81.8 | 111.5 | |||||||
| Volume | (36.8 | ) | 139.3 | ||||||
| Operational performance1 | (4.4 | ) | (51.3 | ) | |||||
| Change in aggregates gross profit | 40.6 | 199.5 | |||||||
| Cement and downstream operations products and services | 38.0 | 21.1 | |||||||
| Magnesia Specialties products | (9.8 | ) | (3.4 | ) | |||||
| Corporate | 4.5 | (4.6 | ) | ||||||
| Freight | 0.5 | (0.2 | ) | ||||||
| Change in consolidated gross profit | 73.8 | 212.4 | |||||||
| Consolidated gross profit, current year | $ | 1,252.8 | $ | 1,179.0 |
| 1 | Inclusive of cost increases/decreases, product and geographic mix and other operating impacts |
|---|
The increase in Building Materials business gross profit in 2020 compared with 2019 is primarily attributable to increased pricing, effective cost management, and lower energy and cement maintenance costs. The decline in gross profit in Magnesia Specialties is driven by lower sales due to the impact of COVID-19 on the U.S. steel industry and inventory rationalization by international customers during the first portion of 2020, partially offset by cost reduction actions.
Corporate gross profit includes intercompany royalty and rental revenue and expenses, depreciation and unallocated operational expenses excluded from the Company’s evaluation of business segment performance.
| A World-Class Organization Built for Success | | Form 10-K ♦ Page 47 |
|---|
Part II ♦ Item 7 – Management’s Discussion and Analysis of Financial Condition and Results of Operations
Aggregates. The average selling price per ton for aggregates was $14.77 and $14.33 for 2020 and 2019, respectively.
Aggregates average selling price increases compared to the prior year are as follows:
| years ended December 31 | 2020 | 2019 | |||||
|---|---|---|---|---|---|---|---|
| East Group | 3.8% | 2.5% | |||||
| West Group | 1.7% | 7.1% | |||||
| Total aggregates operations1 | 3.1% | 4.2% |
| 1 | Total aggregates operations include acquisitions from the date of acquisition and divestitures through the date of disposal. |
|---|
The following presents aggregates shipments for each reportable segment of the Building Materials business:
| years ended December 31 | |||||||||
|---|---|---|---|---|---|---|---|---|---|
| Tons (in millions) | 2020 | 2019 | |||||||
| East Group | 118.7 | 122.3 | |||||||
| West Group | 67.8 | 68.8 | |||||||
| Total aggregates operations1 | 186.5 | 191.1 |
| 1 | Total aggregates operations include acquisitions from the date of acquisition and divestitures through the date of disposal. |
|---|
Aggregates shipments sold to external customers and internal tons used in other product lines are as follows:
.
| years ended December 31 | |||||||||
|---|---|---|---|---|---|---|---|---|---|
| Tons (in millions) | 2020 | 2019 | |||||||
| Tons to external customers | 173.9 | 181.1 | |||||||
| Internal tons used in other product lines | 12.6 | 10.0 | |||||||
| Aggregates tons | 186.5 | 191.1 |
Aggregates volume variance compared to the prior year by reportable segment is as follows:
| years ended December 31 | 2020 | 2019 | |||||
|---|---|---|---|---|---|---|---|
| East Group | (3.0%) | 14.9% | |||||
| West Group | (1.4%) | 6.4% | |||||
| Total aggregates operations1 | (2.4%) | 11.7% |
1Total aggregates operations include acquisitions from the date of acquisition and divestitures through the date of disposal.
Aggregates pricing improved 3.1% compared with 2019, with the West Group reporting a modest increase of 1.7%, reflecting lower percentage of higher-priced commercial rail-shipped volumes in Texas that offset robust underlying pricing gains. On a mix-adjusted basis, the West Group pricing increase was 3.9%. Aggregates volume declined in 2020, reflecting the broad economic impact from COVID-19, lower anticipated infrastructure shipments in North Carolina and reduced energy-sector shipments resulting from completed projects that were not immediately replaced.
Cement, Ready Mixed Concrete, Asphalt and Paving Services. The Company’s cement and downstream operations, namely ready mixed concrete, asphalt and paving services, are located in the West Group.
Average selling prices for cement, ready mixed concrete and asphalt are as follows:
| years ended December 31 | 2020 | 2019 | |||||||
|---|---|---|---|---|---|---|---|---|---|
| Cement – per ton | $ | 113.88 | $ | 112.75 | |||||
| Ready mixed concrete – per cubic yard | $ | 113.57 | $ | 111.32 | |||||
| Asphalt – per ton | $ | 48.00 | $ | 46.75 |
| Form 10-K ♦ Page 48 | | A World-Class Organization Built for Success |
|---|---|---|
Part II ♦ Item 7 – Management’s Discussion and Analysis of Financial Condition and Results of Operations
Unit shipments for cement, ready mixed concrete and asphalt are as follows:
| years ended December 31 (in millions) | 2020 | 2019 | |||||||
|---|---|---|---|---|---|---|---|---|---|
| Cement: | |||||||||
| Tons to external customers | 2.7 | 2.7 | |||||||
| Internal tons used in ready mixed concrete | 1.3 | 1.2 | |||||||
| Total cement tons | 4.0 | 3.9 | |||||||
| Ready mixed concrete – cubic yards1 | 8.4 | 8.5 | |||||||
| Asphalt: | |||||||||
| Tons to external customers | 0.8 | 0.9 | |||||||
| Internal tons used in paving operations | 2.5 | 2.0 | |||||||
| Total asphalt tons | 3.3 | 2.9 |
| 1 | Ready mixed concrete operations include acquisitions from the date of acquisition and divestitures through the date of disposal. |
|---|
Cement shipments increased 2.4% in 2020 versus prior year, reflective of strong demand in North and South Texas, partially offset by reduced energy-sector demand. Cement pricing improved 1.0% compared with the prior year, with strength in North Texas, Houston and portions of Central Texas offset by lower sales of higher-priced oil-well specialty cement products into West Texas. On a mix-adjusted basis, cement pricing increased 3.2%. Cement product gross margin expanded 510 basis points driven by improved kiln reliability resulting from prior-period investments, lower fuel costs and the timing of planned kiln outages.
Ready mixed concrete pricing improved 2.0% and adjusted shipment volume increased 3.2% in 2020, after excluding shipments from ready mixed concrete operations acquired in the third quarter of 2020 and also excluding 2019 shipments from the Southwest Division’s ArkLaTex business that was divested in January 2020. In 2020, asphalt pricing increased 2.7% and volumes improved 15.3%, attributable to strong customer demand and favorable weather compared with the prior year.
Magnesia Specialties. In 2020, Magnesia Specialties reported total revenues of $242.7 million, gross profit of $85.5 million and earnings from operations of $70.7 million, representing decreases of 11%, 10% and 15%, respectively, compared with 2019. The declines in 2020 compared with prior year are primarily attributable to lower lime and periclase shipments to the steel industry in response to COVID-19-induced shutdown of domestic auto manufacturers. Additionally, the business experienced a continued decline in chemicals products sales as both domestic and international customers experienced a downturn in economic activity related to COVID-19. Effective cost control contributed to product gross margin expansion of 80 basis points to 40.6%.
Selling, General and Administrative Expenses
SG&A expenses for 2020 and 2019 were 6.5% and 6.4% of total revenues, respectively. The $3.2 million increase in total expense reflected higher personnel costs and $6.0 million in COVID-19 related expenses primarily for cleaning and sanitizing protocols across the Company’s operations, and were partially offset by reductions in other discretionary costs.
Other Operating Income, Net
Other operating income, net, is comprised generally of gains and losses on the sale of assets; recoveries and losses related to certain customer accounts receivable; rental, royalty and services income; accretion expense, depreciation expense and gains and losses related to asset retirement obligations. These net amounts represented income of $59.8 million in 2020 and $9.1 million in 2019. The 2020 amount included $69.9 million of nonrecurring gains on the sales of investment land and divested assets in Austin, Texas; Riverside, California; and Augusta, Kansas. These asset sales collectively generated net cash proceeds of $122.8 million. These gains were recorded in the West Group. The 2019 amount included the reversal of $6.9 million of accruals for sales tax and unclaimed property contingencies.
Earnings from Operations
Consolidated earnings from operations were $1.0 billion and $884.9 million in 2020 and 2019, respectively.
| A World-Class Organization Built for Success | | Form 10-K ♦ Page 49 |
|---|
Part II ♦ Item 7 – Management’s Discussion and Analysis of Financial Condition and Results of Operations
Interest Expense
Interest expense was $118.1 million in 2020 and $129.3 million in 2019. The decrease reflects lower average outstanding debt during 2020 compared with 2019 and lower interest rates on variable-rate debt.
Other Nonoperating (Income) and Expenses, Net
Other nonoperating income and expenses, net, is comprised generally of interest income; foreign currency transaction gains and losses; pension and postretirement benefit cost (excluding service cost); net equity earnings from nonconsolidated investments and other miscellaneous income and expenses. Consolidated other nonoperating income and expenses, net, was income of $2.0 million in 2020, and an expense of $7.3 million in 2019. The 2020 amount reflected lower pension expense of $8.1 million compared with the prior year and an expense of $11.4 million to finance third-party railroad track maintenance. 2019 expense included the correction of a prior-period error that overstated equity earnings from a nonconsolidated affiliate. The error was deemed immaterial to any previously-reported period and was corrected as an out-of-period expense of $15.7 million ($12.0 million, net of tax). The pretax noncash adjustment was recorded in other nonoperating expenses, net, consistent with the recurring classification of equity earnings from the affiliate.
Income Tax Expense
Variances in the estimated effective income tax rates, when compared with the statutory corporate income tax rate, are due primarily to the statutory depletion deduction for mineral reserves, the effect of state income taxes, stock compensation deductions, and the impact of foreign income or losses for which no tax expense or benefit is recognized. Additionally, certain acquisition-related expenses have limited deductibility for income tax purposes.
The permanent benefit associated with the statutory depletion deduction for mineral reserves is typically the significant driver of the estimated effective income tax rate. The statutory depletion deduction is calculated as a percentage of revenues subject to certain limitations. Due to these limitations, changes in sales volumes and pretax earnings may not proportionately affect the statutory depletion deduction and the corresponding impact on the effective income tax rate. However, the impact of the depletion deduction on the estimated effective tax rate is inversely affected by increases or decreases in pretax earnings.
The Company’s estimated effective income tax rate for the years ended December 31, 2020 and 2019 was 18.9% and 18.2%, respectively.
The effective income tax rate for 2020 included a $14.2 million discrete benefit from financing third-party railroad track maintenance. In exchange, the Company received a federal income tax credit and deduction. The 2019 income tax rate reflected a discrete income tax benefit of $15.2 million related to a change in tax status of a subsidiary.
Net Earnings Attributable to Martin Marietta and Earnings Per Diluted Share
Net earnings attributable to Martin Marietta were $721.0 million, or $11.54 per diluted share, for 2020 and $611.9 million, or $9.74 per diluted share, for 2019.
Liquidity and Cash Flows
Operating Activities
Generally, the Company’s primary source of liquidity is cash generated from operating activities. Operating cash flow is substantially derived from consolidated net earnings, before deducting depreciation, depletion and amortization, and offset by working capital requirements. Cash provided by operations was $1.05 billion in 2020 and $966.1 million in 2019. The primary driver of the increase in cash provided by operations in 2020 is higher earnings.
| Form 10-K ♦ Page 50 | | A World-Class Organization Built for Success |
|---|---|---|
Part II ♦ Item 7 – Management’s Discussion and Analysis of Financial Condition and Results of Operations

Depreciation, depletion and amortization expense were as follows:
| years ended December 31 (in millions) | 2020 | 2019 | |||||||||
|---|---|---|---|---|---|---|---|---|---|---|---|
| Depreciation | $ | 336.8 | $ | 313.6 | |||||||
| Depletion | 35.9 | 37.5 | |||||||||
| Amortization | 17.0 | 16.4 | |||||||||
| Total | $ | 389.7 | $ | 367.5 |
Investing Activities
Net cash used for investing activities was $409.7 million in 2020 and $385.9 million in 2019.
Cash paid for property, plant and equipment additions was $359.7 million in 2020 and $393.5 million in 2019, the reduction reflecting the Company’s decision to reduce capital expenditures in light of COVID-19.
The Company paid cash of $65.1 million for acquisitions in 2020. There were no acquisitions in 2019.
Pretax proceeds from divestitures and sales of nonoperating land and equipment were $142.3 million in 2020 and $8.4 million in 2019. In 2020, the amount included the divestitures of investment land and assets in Austin, Texas; Riverside, California; and Augusta, Kansas.
During 2020, the Company repaid $112.3 million of loans against company-owned life insurance policies.
Financing Activities
The Company used $357.0 million and $604.1 million of cash for financing activities during 2020 and 2019, respectively.
Net repayments of long-term debt were $149.0 million in 2020 and $350.1 million in 2019.
The Company repurchased 0.2 million shares of its common stock for a total cost of $50.0 million, or $237.40 per share, in 2020 and 0.4 million shares of its common stock for a total cost of $98.2 million, or $236.04 per share, in 2019.
For the years ended December 31, 2020 and 2019, the Board of Directors approved total cash dividends on the Company’s common stock of $2.24 per share and $2.06 per share, respectively. Total cash dividends paid were $140.3 million in 2020 and $129.8 million in 2019.
Cash provided by issuances of common stock, which represents the exercises of stock options, excluding the impact of shares withheld for taxes, was $2.3 million and $13.7 million in 2020 and 2019, respectively.
| A World-Class Organization Built for Success | | Form 10-K ♦ Page 51 |
|---|
Part II ♦ Item 7 – Management’s Discussion and Analysis of Financial Condition and Results of Operations
Capital Structure and Resources
Long-term debt, including current maturities, was $2.63 billion at December 31, 2020, and was principally in the form of publicly-issued long-term notes and debentures.
On March 5, 2020, the Company issued $500.0 million aggregate principal amount of 2.500% Senior Notes due 2030 (the 2.500% Senior Notes). The 2.500% Senior Notes are carried net of original issue discount, which is being amortized by the effective interest method over the life of the issue. The 2.500% Senior Notes are redeemable prior to December 15, 2029 at their make-whole redemption price at a discount rate of the U.S. Treasury Rate plus 30 basis points, or on or after December 15, 2029 at a redemption price equal to 100% of the principal amount plus accrued and unpaid interest to the date of redemption. The Company used the net proceeds for general corporate purposes, including the repayment of $300.0 million of floating rate senior notes at maturity in May 2020.
The Company, through a wholly-owned special-purpose subsidiary, has a $400.0 million trade receivable securitization facility (the Trade Receivable Facility). In September 2020, the Company extended the maturity of the Trade Receivable Facility to September 22, 2021. The Trade Receivable Facility is backed by eligible trade receivables, as defined. Borrowings are limited to the lesser of the facility limit or the borrowing base, as defined. These receivables are originated by the Company and then sold to the wholly-owned special-purpose subsidiary. The Company continues to be responsible for the servicing and administration of the receivables purchased by the wholly-owned special-purpose subsidiary. The Trade Receivable Facility contains a cross-default provision to the Company’s other debt agreements.
The $700.0 million five-year senior unsecured revolving facility (the Revolving Facility), which matures in December 2024, requires the Company’s ratio of consolidated net debt-to-consolidated EBITDA, as defined, for the trailing-twelve month period (the Ratio) to not exceed 3.50x as of the end of any fiscal quarter, provided that the Company may exclude from the Ratio debt incurred in connection with certain acquisitions during the quarter or the three preceding quarters so long as the Ratio calculated without such exclusion does not exceed 3.75x. Additionally, if there are no amounts outstanding under the Revolving Facility and the Trade Receivable Facility, consolidated debt, including debt for which the Company is a co-borrower, shall be reduced by the Company’s unrestricted cash and cash equivalents in excess of $50.0 million, such reduction not to exceed $200.0 million, for purposes of the covenant calculation.
At December 31, 2020, the Company’s ratio of consolidated net debt-to-consolidated EBITDA, as defined in the agreement governing the Revolving Facility (the Credit Agreement), for the trailing twelve-month EBITDA was 1.75 times and was calculated as follows:
| Twelve-Month Period | |||||
|---|---|---|---|---|---|
| January 1, 2020 to | |||||
| (dollars in millions) | December 31, 2020 | ||||
| Net earnings attributable to Martin Marietta | $ | 721.0 | |||
| Add back: | |||||
| Interest expense | 118.1 | ||||
| Income tax expense | 168.2 | ||||
| Depreciation, depletion and amortization expense | 389.6 | ||||
| Stock-based compensation expense | 30.0 | ||||
| Deduct: | |||||
| Interest income | (0.5 | ) | |||
| Consolidated EBITDA, as defined by the Company's Credit Agreement | $ | 1,426.4 | |||
| Consolidated net debt, as defined and including debt for which the Company is a co-borrower, at December 31, 2020 | $ | 2,501.5 | |||
| Consolidated net debt-to-consolidated EBITDA, as defined by the Company's Credit Agreement, at December 31, 2020 for trailing twelve-month EBITDA | 1.75x |
Total equity was $5.89 billion at December 31, 2020. At that date, the Company had an accumulated other comprehensive loss of $158.4 million, primarily resulting from unrecognized actuarial losses related to pension benefits.
Pursuant to authority granted by its Board of Directors, the Company can repurchase up to 20 million shares of common stock. As of December 31, 2020, the Company had 13.5 million shares remaining under the repurchase authorization. Future
| Form 10-K ♦ Page 52 | | A World-Class Organization Built for Success |
|---|---|---|
Part II ♦ Item 7 – Management’s Discussion and Analysis of Financial Condition and Results of Operations
share repurchases are at the discretion of management and were temporarily paused in March 2020 in light of the COVID-19 pandemic. Management may resume share repurchases as circumstances dictate.
At December 31, 2020, the Company had $207.3 million in unrestricted cash and short-term investments that are considered cash equivalents. The Company manages its cash and cash equivalents to ensure short-term operating cash needs are met and excess funds are managed efficiently. The Company funds shortages in operating cash through credit facilities. The Company utilizes excess cash to either pay-down credit facility borrowings or invest in money market funds, money market demand deposit accounts or offshore time deposit accounts. Money market demand deposits and offshore time deposit accounts are exposed to bank solvency risk. Money market demand deposit accounts are FDIC insured up to $250,000. The Company’s investments in bank funds generally exceed the FDIC insurance limit.
As of December 31, 2020, the Company had restricted cash of $97.1 million for the purchase of like-kind exchange replacement assets under Section 1031 of the Internal Revenue Code (Section 1031). In January 2021, unused funds of $47.2 million were transferred to unrestricted cash and can subsequently be used for general corporate purposes. The Company has until March 9, 2021 to utilize additional funds for like-kind exchange replacement assets. Any remaining unused funds will be transferred to unrestricted cash at that time.
Cash on hand, along with the Company’s projected internal cash flows and availability of financing resources, including its access to debt and equity capital markets, is expected to continue to be sufficient to provide the capital resources necessary to support anticipated operating needs, cover debt service requirements, meet capital expenditures and discretionary investment needs, fund certain acquisition opportunities that may arise and allow for payment of dividends for the foreseeable future. Borrowings under the Revolving Facility are unsecured and may be used for general corporate purposes. The Company’s ability to borrow or issue securities is dependent upon, among other things, prevailing economic, financial and market conditions. At December 31, 2020, the Company had $1.1 billion of unused borrowing capacity under its Revolving Facility and Trade Receivable Facility.
The Company may be required to obtain additional financing in order to fund certain strategic acquisitions or to refinance outstanding debt. Any strategic acquisition of size would likely require an appropriate balance of newly-issued equity with debt in order to maintain a composite investment-grade credit rating. The Company is exposed to credit markets through the interest cost related to borrowings under its Revolving Facility and Trade Receivable Facility.
The Coronavirus Aid, Relief and Economic Security Act (CARES Act) was signed into law in March 2020 and provides liquidity support for businesses. The CARES Act allowed the Company to defer the payment of the 6.2% employer share of Social Security taxes for the period from March 27, 2020 through December 31, 2020. Half of the deferred obligation will be due December 31, 2021 and the remaining half will be due December 31, 2022. There will be no interest assessed on amounts deferred. The Company deferred payment of $27.6 million under this provision.
Contractual and Off Balance Sheet Obligations
Postretirement medical benefits will be paid from the Company’s assets. The obligation, if any, for retiree medical payments is subject to the terms of the plan. At December 31, 2020, the Company’s recorded benefit obligation related to these benefits totaled $12.6 million.
The Company has other retirement benefits related to pension plans. At December 31, 2020, the fair value of the qualified pension plans’ assets exceeded the projected benefit obligation by $41.8 million. The Company estimates that it will make contributions of $75.1 million to qualified pension plans in 2021. Any contributions beyond 2021 are currently undeterminable and will depend on the investment return on the related pension assets. However, management’s practice is to fund at least the service cost annually. At December 31, 2020, the Company had a total obligation of $115.8 million related to unfunded nonqualified pension plans and expects to make contributions of $7.5 million to these plans in 2021.
At December 31, 2020, the Company had $8.4 million accrued for uncertain tax positions, including interest and correlative effects of $0.2 million. Such liabilities may become payable if the tax positions are not sustained upon examination by a taxing authority.
In connection with normal, ongoing operations, the Company enters into market-rate leases for property, plant and equipment and royalty commitments principally associated with leased land and mineral reserves. Additionally, the Company enters into equipment rentals to meet shorter-term, nonrecurring and intermittent needs. At December 31, 2020, the Company had $459.0 million in operating lease obligations and $24.5 million in finance lease obligations, representing the present value of future payments. The imputed interest on operating and finance lease obligations was $174.3 million. Management anticipates that, in the ordinary course of business, the Company will enter into additional royalty agreements
| A World-Class Organization Built for Success | | Form 10-K ♦ Page 53 |
|---|
Part II ♦ Item 7 – Management’s Discussion and Analysis of Financial Condition and Results of Operations
for land and mineral reserves during 2021. As permitted, short-term leases are excluded from ASC 842 requirements and future noncancelable obligations for these leases as of December 31, 2020 are immaterial.
As of December 31, 2020, interest payable on the Company’s publicly traded debt through the various maturity dates was $1.35 billion. The Company has obligations related to contracts of affreightment not accounted for as a lease and royalty agreements totaling $120.2 million and $119.7 million, respectively, as of December 31, 2020. The Company has purchase commitments for property, plant and equipment of $102.8 million as of December 31, 2020. The Company also has other purchase obligations related to energy and service contracts which totaled $122.4 million as of December 31, 2020.
Contingent Liabilities and Commitments
The Company has entered into standby letter of credit agreements relating to certain insurance claims, contract performance and permit requirements. At December 31, 2020, the Company had contingent liabilities guaranteeing its own performance under these outstanding letters of credit of $32.0 million.
In the normal course of business, at December 31, 2020, the Company was contingently liable for $390.2 million in surety bonds, which guarantee its own performance and are required by certain states and municipalities and their related agencies. The Company has indemnified the underwriting insurance companies against any exposure under the surety bonds. In the Company’s past experience, no material claims have been made against these financial instruments.
The Company is a co-borrower with an unconsolidated affiliate for a $12.5 million revolving line of credit agreement with Truist Bank. The affiliate has agreed to reimburse and indemnify the Company for any payments and expenses the Company may incur from this agreement. The Company holds a lien on the affiliate’s membership interest in a joint venture as collateral for payment under the revolving line of credit.
Other Financial Information
Critical Accounting Policies and Estimates
The Company’s audited consolidated financial statements include certain critical estimates regarding the effect of matters that are inherently uncertain. These estimates require management’s subjective and complex judgments. Amounts reported in the Company’s consolidated financial statements could differ materially if management used different assumptions in making these estimates, resulting in actual results differing from those estimates. Methodologies used and assumptions selected by management in making these estimates, as well as the related disclosures, have been reviewed by and discussed with the Company’s Audit Committee. Management’s determination of the critical nature of accounting estimates and judgments may change from time to time depending on facts and circumstances that management cannot currently predict.
Impairment Review of Goodwill
Goodwill is required to be tested annually for impairment. An interim review is performed between annual tests if facts and circumstances indicate a potential impairment. The impairment review of goodwill is a critical accounting estimate because goodwill represented 23% of the Company’s total assets at December 31, 2020; the review requires management to apply judgment and make key assumptions; and an impairment charge could be material to the Company’s financial condition and results of operations. The Company performs its impairment evaluation as of October 1, which represents the annual evaluation date.
The Company’s reporting units, which represent the level at which goodwill is tested for impairment, are based on the operating segments of the Building Materials business. The Southwest Division is the most significant reporting unit and includes $1.7 billion of the Company’s goodwill. There is no goodwill related to the Magnesia Specialties business.
Certain of the aforementioned reporting units within the Building Materials business meet the aggregation criteria and are consolidated into reportable segments for financial reporting.
Goodwill is assigned to the respective reporting unit(s) based on the location of acquisitions at the time of consummation. If subsequent organizational changes result in operations being transferred to a different reporting unit, a proportionate amount of goodwill is transferred from the former to the new reporting unit. Goodwill is tested for impairment by comparing the reporting unit’s fair value to its carrying value, which represents a Step-1 analysis. However, prior to Step 1, the Company may perform an optional qualitative assessment, or Step 0. As part of the qualitative assessment, the Company considers, among other things, the following events and circumstances: macroeconomic conditions, industry and market conditions, cost factors, overall financial performance and other business or reporting unit-specific events. If the Company concludes it is
| Form 10-K ♦ Page 54 | | A World-Class Organization Built for Success |
|---|---|---|
Part II ♦ Item 7 – Management’s Discussion and Analysis of Financial Condition and Results of Operations
more-likely-than-not (i.e., a likelihood of more than 50%) that a reporting unit’s fair value is higher than its carrying value, the Company does not perform any further goodwill impairment testing for that reporting unit. Otherwise, it proceeds to Step 1 of its goodwill impairment analysis. The Company may bypass the qualitative assessment for any reporting unit in any period and proceed directly with the quantitative calculation in Step 1. When the Company validates its conclusion by measuring fair value, it may resume performing a qualitative assessment for a reporting unit in any subsequent period. If the reporting unit’s fair value exceeds its carrying value, no further calculation is necessary. A reporting unit with a carrying value in excess of its fair value constitutes a Step-1 failure and results in an impairment charge.
For the 2020 annual impairment evaluation, the Company performed a Step-0 analysis for all reporting units and concluded that it is more-likely-than-not that the reporting units’ fair values exceed their carrying values.
Any potential impairment charges from future evaluations represent a risk to the Company.
Pension Benefit Obligation and Pension Expense – Selection of Assumptions
The Company sponsors noncontributory defined benefit pension plans that cover substantially all employees and a Supplemental Excess Retirement Plan (SERP) for certain retirees (see Note K to the consolidated financial statements). Annually, as of December 31, management remeasures the defined benefit pension plans’ projected benefit obligation based on the present value of the projected future benefit payments to all participants for services rendered to date, reflecting expected future pay increases through the participants’ expected retirement dates. A discount rate assumption is selected annually based on corporate bond rates as of the measurement date to calculate the present value of the projected benefit obligation.
Annual pension expense, referred to as net periodic benefit cost within the consolidated financial statements, (inclusive of SERP expense) consists of several components:
| • | Service Cost, which represents the present value of benefits attributed to services rendered in the current year, measured by expected future salary levels to assumed retirement dates; |
|---|
| • | Interest Cost, which represents one year’s additional interest on the projected benefit obligation; |
|---|
| • | Expected Return on Assets, which represents the expected investment return on pension plan assets; and |
|---|
| • | Amortization of Prior Service Cost and Actuarial Gains and Losses, which represents components that are recognized over time rather than immediately. Prior service cost represents credit given to employees for years of service already accrued, of which there is an insignificant amount at December 31, 2020. Actuarial gains and losses arise from changes in assumptions regarding future events, a change in the benefit obligation resulting from experience different from assumed or when actual returns on pension assets differ from expected returns. At December 31, 2020, the unrecognized actuarial loss was $245.9 million. Pension accounting rules currently allow companies to amortize the portion of the unrecognized actuarial loss that represents more than 10% of the greater of the projected benefit obligation or pension plan assets, using the average remaining service life for the amortization period. Therefore, the $245.9 million unrecognized actuarial loss consists of $134.7 million currently subject to amortization in 2021 and $111.2 million not subject to amortization in 2021. |
|---|
These components are calculated annually to determine the annual pension expense.
Management believes the selection of assumptions related to the annual pension expense and related projected benefit obligation is a critical accounting estimate due to the high degree of volatility in the expense and obligation dependent on selected assumptions. The key assumptions are as follows:
| • | The discount rate is used to present value the projected benefit obligation and represents the current rate at which the projected benefit obligations could be effectively settled. |
|---|
| • | The expected long-term rate of return on pension plan assets is used to estimate future asset returns and should reflect the average rate of long-term earnings on assets invested to provide for the benefits included in the projected benefit obligation. |
|---|
| • | The mortality table and mortality improvement scale represent published statistics on the expected lives of people. |
|---|
| • | The rate of increase in future compensation levels is used to project the pay-related pension benefit formula and should estimate actual future compensation levels. |
|---|
Management’s selection of the discount rate is based on an analysis that estimates the current rate of return for high-quality, fixed-income investments with maturities matching the payment of pension benefits that could be purchased to settle the obligations. The Company selected a hypothetical portfolio of Moody’s Aa bonds, with maturities that match the benefit
| A World-Class Organization Built for Success | | Form 10-K ♦ Page 55 |
|---|
Part II ♦ Item 7 – Management’s Discussion and Analysis of Financial Condition and Results of Operations
obligations, to determine the discount rate. At December 31, 2020, the Company selected a discount rate assumption of 3.16%, a 53-basis-point decrease compared with the prior-year assumption. Of the four key assumptions, the discount rate is generally the most volatile and sensitive estimate. Accordingly, a change in this assumption has the most significant impact on the annual pension expense and the projected benefit obligation.
Management’s selection of the rate of increase in future compensation levels, which reflects cost of living adjustments and merit and promotion increases, is generally based on the Company’s historical increases in pensionable earnings, while giving consideration to any future expectations. A higher rate of increase results in higher pension expense and a higher projected benefit obligation. The assumed long-term rate of increase is 4.5%.
Management’s selection of the expected long-term rate of return on pension fund assets is based on a building-block approach, whereby the components are weighted based on the allocation of pension plan assets. Based on the currently projected returns on these assets and related expenses, the Company selected an expected return on assets of 6.75%, the same as the prior-year rate. The following table presents the expected return on pension assets as compared with the actual return on pension assets:
| (in millions) | Expected Return on Pension Assets | Actual Return on Pension Assets | ||
| 2020 | $58.4 | $127.7 | ||
| 2019 | $47.9 | $131.3 |
The difference between the expected return and the actual return on pension assets is included in actuarial gains and losses, which are amortized into annual pension expense as previously described.
At December 31, 2020 and 2019, the Company estimated the remaining lives of participants in the pension plans using the Society of Actuaries’ Pri-2012 Base Mortality Table. The no-collar table was used for salaried participants and the blue-collar table was used for hourly participants, both adjusted to reflect the historical experience of the Company’s participants. The Company selected the MP-2020 and the MP-2018 scales for mortality improvement at December 31, 2020 and 2019, respectively.
Assumptions are selected on December 31 to calculate the succeeding year’s expense. For the 2020 pension expense, assumptions selected at December 31, 2019 were as follows:
| Discount rate | 3.69% | ||
|---|---|---|---|
| Rate of increase in future compensation levels | 4.50% | ||
| Expected long-term rate of return on assets | 6.75% | ||
| Average remaining service period for participants | 10 years | ||
| Mortality Tables: | |||
| Base Table | Pri-2012 | ||
| Mortality Improvement Scale | MP-2018 |
Using these assumptions, the pension benefit obligation as of December 31, 2019 was $977.8 million and 2020 pension expense was $36.8 million. A change in the assumptions would have had the following impact on the December 31, 2019 pension benefit obligation and the 2020 expense:
| • | A 25-basis-point change in the discount rate would have changed the December 31, 2019 pension benefit obligation by approximately $36.3 million. |
|---|
| • | A 25-basis-point change in the discount rate would have changed the 2020 expense by approximately $4.7 million. |
|---|
| • | A 25-basis-point change in the expected long-term rate of return on assets would have changed the 2020 expense by approximately $2.2 million. |
|---|
| Form 10-K ♦ Page 56 | | A World-Class Organization Built for Success |
|---|---|---|
Part II ♦ Item 7 – Management’s Discussion and Analysis of Financial Condition and Results of Operations
The assumptions selected at December 31, 2020 were as follows:
| Discount rate | 3.16% | ||
|---|---|---|---|
| Rate of increase in future compensation levels | 4.50% | ||
| Expected long-term rate of return on assets | 6.75% | ||
| Average remaining service period for participants | 10 years | ||
| Mortality Tables: | |||
| Base Table | Pri-2012 | ||
| Mortality Improvement Scale | MP-2020 |
Using these assumptions, pension benefit obligation as of December 31, 2020 was $1.11 billion and 2021 pension expense is expected to be approximately $25.9 million based on current demographics and structure of the plans. Changes in the underlying assumptions would have the following estimated impact on the obligation and expected expense:
| • | A 25-basis-point change in the discount rate would have changed the December 31, 2020 pension benefit obligation by approximately $40.9 million. |
|---|
| • | A 25-basis-point change in the discount rate would change the 2021 expected expense by approximately $5.4 million. |
|---|
| • | A 25-basis-point change in the expected long-term rate of return on assets would change the 2021 expected expense by approximately $2.6 million. |
|---|
The Company made pension plan contributions of $88.4 million in 2020 and $385.3 million during the five-year period ended December 31, 2020. Despite these contributions, the Company’s pension plans are underfunded (projected benefit obligation exceeds the fair value of plan assets) by $74.0 million at December 31, 2020. The Company’s projected benefit obligation was $1.11 billion at December 31, 2020, an increase of $134.1 million versus the prior year, driven by the lower discount rate. The Company expects to make pension plan and SERP contributions of $82.6 million in 2021, of which $75.0 million are voluntary.
Estimated Effective Income Tax Rate
The Company uses the liability method to determine its provision for income taxes. Accordingly, the annual provision for income taxes reflects estimates of the current liability for income taxes, estimates of the tax effect of financial reporting versus tax basis differences using statutory income tax rates and management’s judgment with respect to any valuation allowances on deferred tax assets. The result is management’s estimate of the annual effective tax rate (the ETR).
Income for tax purposes is determined through the application of the rules and regulations under the United States Internal Revenue Code and the statutes of various foreign, state and local tax jurisdictions in which the Company conducts business. Changes in the statutory tax rates and/or tax laws in these jurisdictions can have a material effect on the ETR. The effect of these changes, if material, is recognized when the change is enacted.
As prescribed by these tax regulations, as well as generally accepted accounting principles, the manner in which revenues and expenses are recognized for financial reporting and income tax purposes is not always the same. Therefore, these differences between the Company’s pretax income for financial reporting purposes and the amount of taxable income for income tax purposes are treated as either temporary or permanent, depending on their nature.
Temporary differences reflect revenues or expenses that are recognized in financial reporting in one period and taxable income in a different period. An example of a temporary difference is the use of the straight-line method of depreciation of machinery and equipment for financial reporting purposes and the use of an accelerated method for income tax purposes. Temporary differences result from differences between the financial reporting basis and tax basis of assets or liabilities and give rise to deferred tax assets or liabilities (i.e., future tax deductions or future taxable income). Therefore, when temporary differences occur, they are offset by a corresponding change in a deferred tax account. As such, total income tax expense as reported in the Company’s consolidated statements of earnings is not changed by temporary differences.
The Company has deferred tax liabilities, primarily for right-of-use assets, property, plant and equipment, goodwill and other intangibles, employee pension and postretirement benefits and partnerships and joint ventures. The deferred tax liabilities attributable to property, plant and equipment relate to accelerated depreciation and depletion methods used for income tax purposes as compared with the straight-line and units-of-production methods used for financial reporting purposes. These temporary differences will reverse over the remaining useful lives of the related assets. The deferred tax liabilities attributable to goodwill arise as a result of amortizing goodwill for income tax purposes but not for financial reporting purposes. This temporary difference reverses when goodwill is written off for financial reporting purposes, either through divestitures or an impairment
| A World-Class Organization Built for Success | | Form 10-K ♦ Page 57 |
|---|
Part II ♦ Item 7 – Management’s Discussion and Analysis of Financial Condition and Results of Operations
charge. The timing of such events cannot be estimated. The deferred tax liabilities attributable to employee pension and postretirement benefits relate to deductions as plans are funded for income tax purposes compared with deductions for financial reporting purposes based on accounting standards. The reversal of these differences depends on the timing of the Company’s contributions to the related benefit plans as compared to the annual expense for financial reporting purposes. The deferred tax liabilities attributable to partnerships and joint ventures relate to the difference between the tax basis of the investments in partnerships and joint ventures when compared to the basis for financial reporting purposes. The temporary difference reverses through differences recognized over the life of the investment or through divestiture.
The Company has deferred tax assets, primarily for inventories, unvested stock-based compensation awards, unrecognized losses related to the funded status of the pension and postretirement benefit plans, lease liabilities, valuation reserves, net operating loss carryforwards and tax credit carryforwards. The deferred tax assets attributable to inventories and valuation reserves relate to the deduction of estimated cost reserves and various period expenses for financial reporting purposes that are deductible in a later period for income tax purposes. The reversal of these differences depends on facts and circumstances, including the timing of deduction for income tax purposes for reserves previously established and the establishment of additional reserves for financial reporting purposes. The deferred tax assets attributable to unvested stock-based compensation awards relate to differences in the timing of deductibility for financial reporting purposes versus income tax purposes. For financial reporting purposes, the fair value of the awards is deducted ratably over the requisite service period. For income tax purposes, no deduction is allowed until the award is vested or no longer subject to substantial risk of forfeiture. The Company reflects all excess tax benefits and tax deficiencies in income tax expense as a discrete event in the period in which the award vests or settles, increasing volatility in the income tax rate from period to period.
Business Combinations – Allocation of Purchase Price
The Company’s Board of Directors and management regularly review strategic long-term plans, including potential investments in value-added acquisitions of related or similar businesses, which would increase the Company’s market presence and/or are related to the Company’s existing markets. When an acquisition is completed, the Company’s consolidated statements of earnings include the operating results of the acquired business starting from the date of acquisition, which is the date control is obtained. The purchase price is determined based on the fair value of assets and equity interests given to the seller and any future obligations to the seller as of the date of acquisition. The Company allocates the purchase price to the fair values of the tangible and intangible assets acquired and liabilities assumed as valued at the date of acquisition. Goodwill is recorded for the excess of the purchase price over the net of the fair value of the identifiable assets acquired and liabilities assumed as of the acquisition date. The purchase price allocation is a critical accounting policy because the estimation of fair values of acquired assets and assumed liabilities is judgmental and requires various assumptions. Further, the amounts and useful lives assigned to depreciable and amortizable assets versus amounts assigned to goodwill and indefinite-lived intangible assets, which are not amortized, can significantly affect the results of operations in the period of and for periods subsequent to a business combination.
Fair value is the price that would be received to sell an asset or paid to transfer a liability in an orderly transaction, and, therefore, represents an exit price. Fair value measurement assumes the highest and best use of the asset by market participants, considering the use of the asset that is physically possible, legally permissible, and financially feasible at the measurement date. The Company assigns the highest level of fair value available to assets acquired and liabilities assumed based on the following options:
| • | Level 1 – Quoted prices in active markets for identical assets and liabilities |
|---|
| • | Level 2 – Observable inputs, other than quoted prices, for similar assets or liabilities in active markets |
|---|
| • | Level 3 – Unobservable inputs, used to value the asset or liability which includes the use of valuation models |
|---|
Level 1 fair values are used to value investments in publicly traded entities and assumed obligations for publicly traded long-term debt.
Level 2 fair values are typically used to value acquired receivables, inventories, machinery and equipment, land, buildings, deferred income tax assets and liabilities, and accruals for payables, asset retirement obligations, environmental remediation and compliance obligations, and contingencies. Additionally, Level 2 fair values are typically used to value assumed contracts at other-than-market rates.
Level 3 fair values are used to value acquired mineral reserves and mineral interests produced and sold as final products, and separately-identifiable intangible assets. The fair values of mineral reserves and mineral interests are determined using an excess earnings approach, which requires management to estimate future cash flows, net of capital investments in the
| Form 10-K ♦ Page 58 | | A World-Class Organization Built for Success |
|---|---|---|
Part II ♦ Item 7 – Management’s Discussion and Analysis of Financial Condition and Results of Operations
specific operation and contributory asset charges. The estimate of future cash flows is based on available historical information and future expectations and assumptions determined by management, but is inherently uncertain. Key assumptions in estimating future cash flows include changes in sales price, shipment volumes and production costs as well as capital needs. The present value of the projected net cash flows represents the fair value assigned to mineral reserves and mineral interests. The discount rate is a significant assumption used in the valuation model and is based on the required rate of return that a hypothetical market participant would require if purchasing the acquired business, with an adjustment for the risk of these assets not generating the projected cash flows.
The Company values separately-identifiable acquired intangible assets which may include, but are not limited to, permits, customer relationships, water rights and noncompetition agreements. The fair values of these assets are typically determined by an excess earnings method, a replacement cost method or, in the case of water rights, a market approach.
The useful lives of amortizable intangible assets and the remaining useful lives for acquired machinery and equipment have a significant impact on earnings. The selected lives are based on the expected periods that the assets will provide value to the Company subsequent to the business combination.
The Company may adjust the amounts recognized for a business combination during a measurement period after the acquisition date. Any such adjustments are based on the Company obtaining additional information that existed at the acquisition date regarding the assets acquired or the liabilities assumed. Measurement-period adjustments are generally recorded as increases or decreases to the goodwill recognized in the transaction. The measurement period ends once the Company has obtained all necessary information that existed as of the acquisition date, but does not extend beyond one year from the date of acquisition. Any adjustments to assets acquired or liabilities assumed beyond the measurement period are recorded through earnings.
Property, Plant and Equipment
Net property, plant and equipment represented 50% of total assets at December 31, 2020. Accordingly, accounting for these assets represents a critical accounting policy. Useful lives of the assets can vary depending on factors, including production levels, geographic location, portability and maintenance practices. Additionally, climate and inclement weather can reduce the useful life of an asset. Historically, the Company has not recognized significant losses on the disposal or retirement of fixed assets.
Aggregates mineral reserves and mineral interests are components within the plant, property and equipment balance on the consolidated balance sheets. The Company evaluates aggregates reserves, including those used in the cement manufacturing process, in several ways, depending on the geology at a particular location and whether the location is a greensite, an acquisition or an existing operation. Greensites require an extensive drilling program before any significant investment is made in terms of time, site development or efforts to obtain appropriate zoning and permitting (see Environmental Regulation and Litigation section). The depth of overburden and the quality and quantity of the aggregates reserves are significant factors in determining whether to pursue opening the site. Further, the estimated average selling price for products in a market is also a significant factor in concluding that reserves are economically mineable. If the Company’s analysis based on these factors is satisfactory, the total aggregates reserves available are calculated and a determination is made whether to open the location. Reserve evaluation at existing locations is typically performed to evaluate purchasing adjoining properties, for quality control, calculating overburden volumes and for mine planning. Reserve evaluation of acquisitions may require a higher degree of sampling to locate any problem areas that may exist and to verify the total reserves.
Well-ordered subsurface sampling of the underlying deposit is basic to determining reserves at any location. This subsurface sampling usually involves one or more types of drilling, determined by the nature of the material to be sampled and the particular objective of the sampling. The Company’s objectives are to ensure that the underlying deposit meets aggregates specifications and the total reserves on site are sufficient for mining and economically recoverable. Locations underlain with hard rock deposits, such as granite and limestone, are drilled using the diamond core method, which provides the most useful and accurate samples of the deposit. Selected core samples are tested for soundness, abrasion resistance and other physical properties relevant to the aggregates industry and depend on the aggregates use. The number and depth of the holes are determined by the size of the site and the complexity of the site-specific geology. Some geological factors that may affect the number and depth of holes include faults, folds, chemical irregularities, clay pockets, thickness of formations and weathering. A typical spacing of core holes on the area to be tested is one hole for every four acres, but wider spacing may be justified if the deposit is homogeneous.
Despite previous drilling and sampling, once accessed, the quality of reserves within a deposit can vary. Construction contracts, for the infrastructure market in particular, include specifications related to the aggregates material. If a flaw in the deposit is discovered, the aggregates material may not meet the required specifications. Although it is possible that the
| A World-Class Organization Built for Success | | Form 10-K ♦ Page 59 |
|---|
Part II ♦ Item 7 – Management’s Discussion and Analysis of Financial Condition and Results of Operations
aggregates material can still be used for non-specification uses, this can have an adverse effect on the Company’s ability to serve certain customers or on the Company’s profitability. In addition, other issues can arise that limit the Company’s ability to access reserves in a particular quarry, including geological occurrences, blasting practices and zoning issues.
Locations underlain with sand and gravel are typically drilled using the auger method, whereby a six-inch corkscrew brings up material from below the ground which is then sampled. Deposits in these locations are typically limited in thickness. Additionally, the quality and sand-to-gravel ratio of the deposit can vary both horizontally and vertically. Hole spacing at these locations is approximately one hole for every acre to ensure a representative sampling.
The geologist conducting the reserve evaluation makes the decision as to the number of holes and the spacing in accordance with standards and procedures established by the Company. Further, the anticipated heterogeneity of the deposit, based on U.S. geological maps, also dictates the number of holes drilled.
The generally accepted reserve categories for the aggregates industry and the designations the Company uses for reserve categories are summarized as follows:
Proven Reserves – These reserves are designated using closely spaced drill data as described above and a determination by a professional geologist that the deposit is relatively homogeneous based on the drilling results and exploration data provided in U.S. geologic maps, the U.S. Department of Agriculture soil maps, aerial photographs and/or electromagnetic, seismic or other surveys conducted by independent geotechnical engineering firms. The proven reserves that are recorded reflect reductions incurred through quarrying that result from leaving ramps, safety benches, pillars (underground) and the fines (small particles) that will be generated during processing. Proven reserves are further reduced by reserves that are under the plant and stockpile areas, as well as setbacks from neighboring property lines. The Company typically assumes a loss factor of 25%. However, the assumed loss factor at coastal operations is approximately 40% due to the nature of the material. The assumed loss factor for underground operations is 35% primarily due to pillars.
Probable Reserves – These reserves are inferred utilizing fewer drill holes and/or assumptions about the economically recoverable reserves based on local geology or drill results from adjacent properties.
The Company’s proven and probable reserves reflect reasonable economic and operating constraints as to maximum depth of overburden and stone excavation, and also include reserves at the Company’s inactive and undeveloped sites, including some sites where permitting and zoning applications will not be filed until warranted by expected future growth. The Company has historically been successful in obtaining and maintaining appropriate zoning and permitting (see Environmental Regulation and Litigation section).
Mineral reserves and mineral interests, when acquired in connection with a business combination, are valued using an excess earnings approach for the life of the proven and probable reserves.
The Company uses proven and probable reserves as the denominator in its units-of-production calculation to record depletion expense for its mineral reserves and mineral interests. For 2020, depletion expense was $35.9 million.
The Company begins capitalizing quarry development costs at a point when reserves are determined to be proven or probable, economically mineable and when demand supports investment in the market. Capitalization of these costs ceases when production commences. Capitalized quarry development costs are classified as land improvements.
New mining areas may be developed at existing quarries in order to access additional reserves. When this occurs, management reviews the facts and circumstances of each situation in making a determination as to the appropriateness of capitalizing or expensing the related pre-production development costs. If the additional mining location operates in a separate and distinct area of a quarry, the costs are capitalized as quarry development costs and depreciated over the life of the uncovered reserves. Further, a separate asset retirement obligation is created for additional mining areas when the liability is incurred. Once a new mining area enters the production phase, all post-production stripping costs are expensed as incurred as periodic inventory production costs.
| Form 10-K ♦ Page 60 | | A World-Class Organization Built for Success |
|---|---|---|
Part II ♦ Item 7 – Management’s Discussion and Analysis of Financial Condition and Results of Operations
Forward-Looking Statements – Safe Harbor Provisions Under the Private Securities Litigation Reform Act of 1995
If you are interested in Martin Marietta stock, management recommends that, at a minimum, you read the Company’s current annual report and Forms 10-K, 10-Q and 8-K reports to the Securities and Exchange Commission (SEC) over the past year. The Company’s recent proxy statement for the annual meeting of shareholders also contains important information. These and other materials that have been filed with the SEC are accessible through the Company’s website at www.martinmarietta.com and are also available at the SEC’s website at www.sec.gov. You may also write or call the Company’s Corporate Secretary, who will provide copies of such reports.
Investors are cautioned that all statements in this Annual Report that relate to the future involve risks and uncertainties, and are based on assumptions that the Company believes in good faith are reasonable but which may be materially different from actual results. These statements, which are forward-looking statements within the meaning of Section 21E of the Securities Exchange Act of 1934 and 27A of the Securities Act of 1933, and are made pursuant to the safe harbor provisions of the Private Securities Litigation Reform Act of 1995, provide the investor with the Company’s expectations or forecasts of future events. You can identify these statements by the fact that they do not relate only to historical or current facts. They may use words such as “anticipate,” “may,” “expect,” “should,” “believe,” “project,” “intend,” “will,” and other words of similar meaning in connection with future events or future operating or financial performance. In addition to the statements included in this report, we may from time to time make other oral or written forward-looking statements in other filings under the Securities Exchange Act of 1934 or in other public disclosures. Any or all of management’s forward-looking statements here and in other publications may turn out to be wrong.
These forward-looking statements are subject to risks and uncertainties, and are based on assumptions that may be materially different from actual results, and include, but are not limited to:
| • | the ability of the Company to face challenges, including those posed by the COVID-19 pandemic and implementation of any such related response plans; |
|---|
| • | the recent dramatic increases in COVID-19 cases in the United States and the extent that geography of outbreak primarily matches the regions in which the Company’s Building Materials business principally operates; |
|---|
| • | the resiliency and potential declines of the Company’s various construction end-use markets; the potential negative impact of the COVID-19 pandemic on the Company’s ability to continue supplying heavy-side building materials and related services at normal levels or at all in the Company’s key regions; |
|---|
| • | the duration, impact and severity of the impact of the COVID-19 pandemic on the Company, including the markets in which the Company does business, its suppliers, customers or other business partners as well as the Company’s employees; |
|---|
| • | the economic impact of government responses to the pandemic; the performance of the United States economy, including the impact on the economy of the COVID-19 pandemic and governmental orders restricting activities imposed to prevent further outbreak of COVID-19; |
|---|
| • | shipment declines resulting from economic events beyond the Company’s control; |
|---|
| • | a widespread decline in aggregates pricing, including a decline in aggregates shipment volume negatively affecting aggregates price; |
|---|
| • | the history of both cement and ready mixed concrete being subject to significant changes in supply, demand and price fluctuations; the termination, capping and/or reduction or suspension of the federal and/or state gasoline tax(es) or other revenue related to public construction; |
|---|
| • | the level and timing of federal, state or local transportation or infrastructure or public projects funding, most particularly in Texas, Colorado, North Carolina, Georgia, Iowa, Florida and Maryland; |
|---|
| • | the impact of governmental orders restricting activities imposed to prevent further outbreak of COVID-19 on travel, potentially reducing state fuel tax revenues used to fund highway projects; |
|---|
| • | the United States Congress’ inability to reach agreement among themselves or with the Administration on policy issues that impact the federal budget; |
|---|
| • | the ability of states and/or other entities to finance approved projects either with tax revenues or alternative financing structures; |
|---|
| • | levels of construction spending in the markets the Company serves; a reduction in defense spending and the subsequent impact on construction activity on or near military bases; |
|---|
| A World-Class Organization Built for Success | | Form 10-K ♦ Page 61 |
|---|
Part II ♦ Item 7 – Management’s Discussion and Analysis of Financial Condition and Results of Operations
| • | a decline in the commercial component of the nonresidential construction market, notably office and retail space, including a decline resulting from economic distress related to the COVID-19 pandemic; |
|---|
| • | a decline in energy-related construction activity resulting from a sustained period of low global oil prices or changes in oil production patterns or capital spending in response to this decline, particularly in Texas; |
|---|
| • | increasing residential mortgage rates and other factors that could result in a slowdown in residential construction; |
|---|
| • | unfavorable weather conditions, particularly Atlantic Ocean and Gulf of Mexico hurricane activity, the late start to spring or the early onset of winter and the impact of a drought or excessive rainfall in the markets served by the Company, any of which can significantly affect production schedules, volumes, product and/or geographic mix and profitability; |
|---|
| • | whether the Company’s operations will continue to be treated as “essential” operations under applicable government orders restricting business activities imposed to prevent further outbreak of COVID-19 or, even if so treated, whether site-specific health and safety concerns might otherwise require certain of the Company’s operations to be halted for some period of time; |
|---|
| • | the volatility of fuel costs, particularly diesel fuel, and the impact on the cost, or the availability generally, of other consumables, namely steel, explosives, tires and conveyor belts, and with respect to the Company’s Magnesia Specialties business, natural gas; |
|---|
| • | continued increases in the cost of other repair and supply parts; construction labor shortages and/or supply‐chain challenges; |
|---|
| • | unexpected equipment failures, unscheduled maintenance, industrial accident or other prolonged and/or significant disruption to production facilities; |
|---|
| • | increasing governmental regulation, including environmental laws; the failure of relevant government agencies to implement expected regulatory reductions; |
|---|
| • | transportation availability or a sustained reduction in capital investment by the railroads, notably the availability of railcars, locomotive power and the condition of rail infrastructure to move trains to supply the Company’s Texas, Colorado, Florida, Carolinas and the Gulf Coast markets, including the movement of essential dolomitic lime for magnesia chemicals to the Company’s plant in Manistee, Michigan and its customers; |
|---|
| • | increased transportation costs, including increases from higher or fluctuating passed-through energy costs or fuel surcharges, and other costs to comply with tightening regulations, as well as higher volumes of rail and water shipments (leading to reduced profit margins when compared with aggregates moved by truck); |
|---|
| • | availability of trucks and licensed drivers for transport of the Company’s materials; |
|---|
| • | availability and cost of construction equipment in the United States; |
|---|
| • | weakening in the steel industry markets served by the Company’s dolomitic lime products; |
|---|
| • | trade disputes with one or more nations impacting the U.S. economy, including the impact of tariffs on the steel industry; |
|---|
| • | unplanned changes in costs or realignment of customers that introduce volatility to earnings, including the Magnesia Specialties business; |
|---|
| • | proper functioning of information technology and automated operating systems to manage or support operations; |
|---|
| • | inflation and its effect on both production and interest costs; |
|---|
| • | the concentration of customers in construction markets and the increased risk of potential losses on customer receivables; |
|---|
| • | the impact of the level of demand in the Company’s end-use markets, production levels and management of production costs on the operating leverage and therefore profitability of the Company; |
|---|
| • | the possibility that the expected synergies from acquisitions will not be realized or will not be realized within the expected time period, including achieving anticipated profitability to maintain compliance with the Company’s leverage ratio debt covenant; |
|---|
| • | changes in tax laws, the interpretation of such laws and/or administrative practices that would increase the Company’s tax rate; |
|---|
| • | violation of the Company’s debt covenant if price and/or volumes return to previous levels of instability; |
|---|
| • | downward pressure on the Company’s common stock price and its impact on goodwill impairment evaluations; |
|---|
| • | the possibility of a reduction of the Company’s credit rating to non-investment grade; and |
|---|
| • | other risk factors listed from time to time found in the Company’s filings with the SEC. |
|---|
| Form 10-K ♦ Page 62 | | A World-Class Organization Built for Success |
|---|---|---|
Part II ♦ Item 7 – Management’s Discussion and Analysis of Financial Condition and Results of Operations
Further, increased highway construction funding pressures resulting from either federal or state issues can affect profitability. If these negatively affect transportation budgets more than in the past, construction spending could be reduced. Cement is subject to cyclical supply and demand and price fluctuations.
The Company’s principal business serves customers in construction markets. This concentration could increase the risk of potential losses on customer receivables; however, payment bonds normally posted on public projects, together with lien rights on private projects, mitigate the risk of uncollectible receivables. The level of demand in the Company’s end-use markets, production levels and the management of production costs will affect the operating leverage of the Building Materials business and, therefore, profitability. Production costs in the Building Materials business are also sensitive to energy and raw material prices, both directly and indirectly. Diesel fuel, coal and other consumables change production costs directly through consumption or indirectly by increased energy-related input costs, such as steel, explosives, tires and conveyor belts. Fluctuating diesel fuel pricing also affects transportation costs, primarily through fuel surcharges in the Company’s long-haul distribution network. The Magnesia Specialties business is sensitive to changes in domestic steel capacity utilization as well as the absolute price and fluctuation in the cost of natural gas.
Transportation in the Company’s long-haul network, particularly the supply of railcars and locomotive power and condition of rail infrastructure to move trains, affects the Company’s efficient transportation of aggregates products in certain markets, most notably Texas, Colorado, Florida, North Carolina and the Gulf Coast. In addition, availability of railcars and locomotives affects the Company’s movement of essential dolomitic lime for magnesia chemicals to both the Company’s plant in Manistee, Michigan, and its customers. The availability of trucks, drivers and railcars to transport the Company’s product, particularly in markets experiencing high growth and increased demand, is also a risk and pressures the associated costs.
All of the Company’s businesses are also subject to weather-related risks that can significantly affect production schedules and profitability. The first and fourth quarters are most adversely affected by winter weather. Hurricane activity in the Atlantic Ocean and Gulf Coast generally is most active during the third and fourth quarters.
Risks also include shipment declines resulting from economic events beyond the Company’s control.
In addition to the foregoing, other factors that could cause actual results to differ materially from the forward-looking statements in this Annual Report include but are not limited to those listed above in Item 1, “Business – Competition,” Item 1A, “Risk Factors,” and “Note A: Accounting Policies” and “Note O: Commitments and Contingencies” of the “Notes to Financial Statements” of the audited consolidated financial statements included in this Form 10-K.
You should consider these forward-looking statements in light of risk factors discussed in the Company’s Annual Report on Form 10-K for the year ended December 31, 2020 and other filings made with the SEC. All of the Company’s forward-looking statements should be considered in light of these factors. In addition, other risks and uncertainties not presently known to the Company or that the Company considers immaterial could affect the accuracy of its forward-looking statements, or adversely affect or be material to the Company. All forward-looking statements are made as of the date of filing or publication and we assume no obligation to update any such forward-looking statements.
| A World-Class Organization Built for Success | | Form 10-K ♦ Page 63 |
|---|
Part II ♦ Item 7A – Quantitative and Qualitative Disclosures About Market Risk
Previous: Item 5. MARKET FOR REGISTRANT’S COMMON EQUITY, RELATED STOCKHOLDER MATTERS AND ISSUER PURCHASES OF EQUITY SECURITIES · Next: Item 7A. QUANTITATIVE AND QUALITATIVE DISCLOSURES ABOUT MARKET RISK