 filings.tools
Item 5. MARKET FOR THE REGISTRANT’S COMMON EQUITY, RELATED STOCKHOLDER MATTERS AND ISSUER PURCHASES OF EQUITY SECURITIES
6K characters. Original on sec.gov · Markdown
Item 5. MARKET FOR THE REGISTRANT’S COMMON EQUITY, RELATED STOCKHOLDER MATTERS AND ISSUER PURCHASES OF EQUITY SECURITIES
Principal Market
The Company’s common stock began trading in the over-the-counter market on November 8, 1990 and was subsequently quoted on the Nasdaq Capital Market under the symbol “HANS”. On July 5, 2007, the Company’s common stock began trading on the Nasdaq Global Select Market under the same symbol, “HANS”. On January 5, 2012, stockholders of the Company approved the Company’s name change from Hansen Natural Corporation to Monster Beverage Corporation. In addition, on January 9, 2012, the Company’s common stock began trading under the symbol “MNST”. As of February 12, 2018, there were 566,402,748 shares of the Company’s common stock outstanding held by approximately 213 holders of record. The holders of record do not include those stockholders whose shares are held of record by banks, brokers and other financial institutions.
Stock Price and Dividend Information
The following table sets forth high and low per share sales price of our common stock for the periods indicated:
| Year Ended December 31, 2017 | High | Low | |||||
|---|---|---|---|---|---|---|---|
| First Quarter | $ | 48.94 | $ | 41.02 | |||
| Second Quarter | $ | 52.41 | $ | 44.35 | |||
| Third Quarter | $ | 57.25 | $ | 49.03 | |||
| Fourth Quarter | $ | 64.79 | $ | 54.80 | |||
| Year Ended December 31, 2016 | High | Low | |||||
| First Quarter | $ | 49.79 | $ | 37.69 | |||
| Second Quarter | $ | 53.62 | $ | 40.30 | |||
| Third Quarter | $ | 55.50 | $ | 47.44 | |||
| Fourth Quarter | $ | 50.63 | $ | 40.64 |
The per share sales prices of our common stock set forth above represent bid quotations between dealers, do not include retail markups, mark-downs or commissions and bid quotations may not necessarily represent actual transactions and “real time” sale prices. The source of the bid information is the NASDAQ Stock Market, Inc.
We have not paid cash dividends to our stockholders since our inception and do not anticipate paying cash dividends in the foreseeable future.
On February 28, 2017, the Company’s Board of Directors authorized a share repurchase program for the purchase of up to $500.0 million of the Company’s outstanding common stock (the “February 2017 Repurchase Plan”). During the year ended December 31, 2017, the Company purchased 4.6 million shares of common stock at an average purchase price of $54.91 per share, for a total amount of $249.9 million (excluding broker commissions), under the February 2017 Repurchase Plan. On February 27, 2018, our Board of Directors authorized a new share repurchase program for the purchase of up to $250.0 million of the Company’s outstanding common stock (the “February 2018 Repurchase Plan”). As $250.0 million remains available for grant under the February 2017 Repurchase Plan, the aggregate amount available to repurchase the Company’s common stock is currently $500.0 million.
During the year ended December 31, 2017, 1.8 million shares of common stock were purchased from employees in lieu of cash payments for options exercised or withholding taxes due for a total amount of $111.2 million. While such purchases are considered common stock repurchases, they are not counted as purchases against our authorized share repurchase programs. Such shares are included in common stock in treasury in the accompanying consolidated balance sheet at December 31, 2017.
The following tabular summary reflects the Company’s repurchase activity during the quarter ended December 31, 2017:
| Period | Total Number of Shares Purchased | Average Price per Share¹ | Total Number of Shares Purchased as Part of Publicly Announced Plans or Programs | Maximum Number (or Approximate Dollar Value) of Shares that May Yet Be Purchased Under the Plans or Programs (In thousands)² | ||||||
|---|---|---|---|---|---|---|---|---|---|---|
| Oct 1 – Oct 31, 2017 | 20,129 | $ 54.99 | 20,129 | $ | 250,000 | |||||
¹Excluding broker commissions paid.
²Net of broker commissions paid.
Equity Compensation Plan Information
The following table sets forth information as of December 31, 2017 with respect to shares of our common stock that may be issued under our equity compensation plans.
| Plan category | Number of securities to be issued upon exercise of outstanding options, warrants and rights (a) | Weighted-average exercise price of outstanding options, warrants and rights (b) | Number of securities remaining available for future issuance under equity compensation plans (excluding securities reflected in column (a)) (c) | ||||
|---|---|---|---|---|---|---|---|
| Equity compensation plans approved by stockholders | 18,348,024 | $29.62 | 20,877,908 | ||||
| Equity compensation plans not approved by stockholders | - | - | - | ||||
| Total | 18,348,024 | $29.62 | 20,877,908 |
Performance Graph
The following graph shows a five-year comparison of cumulative total returns:1
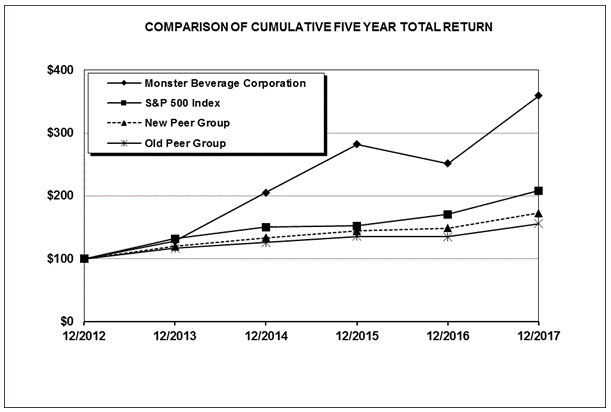
1Annual return assumes reinvestment of dividends. Cumulative total return assumes an initial investment of $100 on December 31, 2012. The Company’s current self-selected peer group is comprised of TCCC, DPS Group, National Beverage Corporation, Jones Soda Company and PepsiCo Inc. The Company’s former self-selected peer group is comprised of TCCC, DPS Group, National Beverage Corporation, Jones Soda Company and Cott Corporation (Cott Corporation’s carbonated soft drink and juice business was sold in 2018).
Previous: Item 4. MINE SAFETY DISCLOSURES · Next: Item 6. SELECTED FINANCIAL DATA