 filings.tools
Item 1. Business.
94K characters. Original on sec.gov · Markdown
Item 1. Business.
OVERVIEW
The Mosaic Company is the world’s leading producer and marketer of concentrated phosphate and potash crop nutrients. We are the largest integrated phosphate producer in the world and one of the largest producers and marketers of phosphate-based animal feed ingredients in North America. We are one of the four largest potash producers in the world. Through our broad product offering, we are a single source supplier of phosphate- and potash-based crop nutrients and animal feed ingredients. We serve customers in approximately 40 countries. We mine phosphate rock in Florida and process rock into finished phosphate products at facilities in Florida and Louisiana. We mine potash in Saskatchewan and New Mexico. We have other production, blending or distribution operations in Brazil, China, India and Paraguay, as well as strategic equity investments in a phosphate rock mine in the Bayovar region in Peru and a joint venture formed to develop a phosphate rock mine and chemical complexes in the Kingdom of Saudi Arabia. Our distribution operations serve the top four nutrient-consuming countries in the world: China, India, the United States and Brazil.
The Mosaic Company is a Delaware corporation that was incorporated in March 2004 and serves as the parent company of the business that was formed through the October 2004 combination of IMC Global Inc. and the fertilizer businesses of Cargill, Incorporated. We are publicly traded on the New York Stock Exchange under the ticker symbol “MOS” and are headquartered in Plymouth, Minnesota.
We conduct our business through wholly and majority-owned subsidiaries as well as businesses in which we own less than a majority or a non-controlling interest. We are organized into three reportable business segments: Phosphates, Potash and International Distribution. Intersegment eliminations, mark-to-market gains/losses on derivatives, debt expenses, Streamsong Resort® results of operations and our legacy Argentina and Chile results are included within Corporate, Eliminations and Other.
The following charts show the respective contributions to 2016 sales volumes, net sales and operating earnings for each of these business segments:
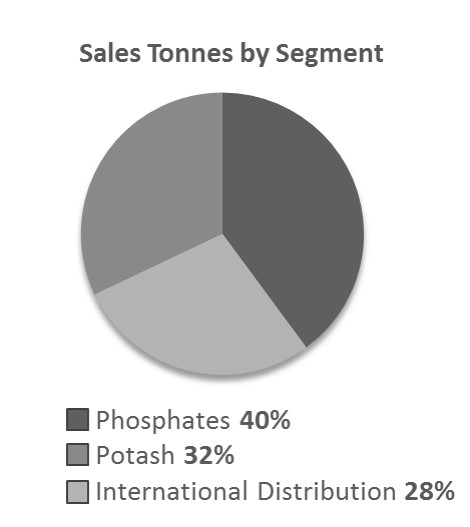
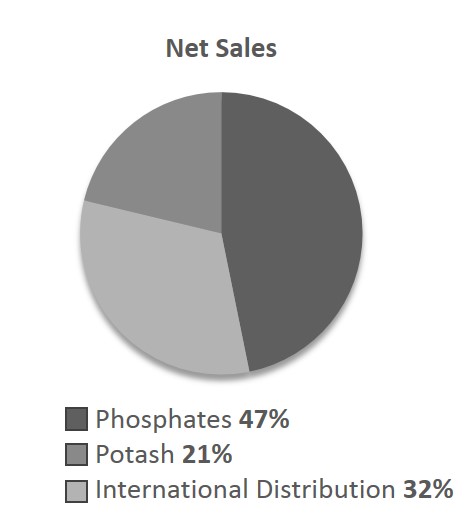
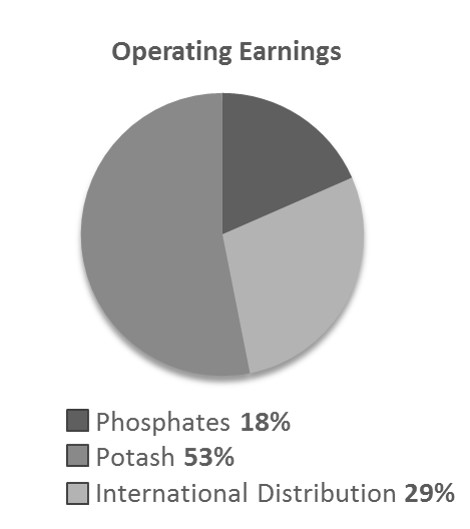
Phosphates Segment — We are the largest integrated phosphate producer in the world and one of the largest producers and marketers of phosphate-based animal feed ingredients in North America. We sell phosphate-based crop nutrients and animal feed ingredients throughout North America and internationally. We account for approximately 14% of estimated global annual production and 75% of estimated North American annual production of concentrated phosphate crop nutrients.
Potash Segment — We are one of the four largest potash producers in the world. We sell potash throughout North America and internationally, principally as fertilizer, but also for use in industrial applications and, to a lesser degree, as animal feed ingredients. We account for approximately 12% of estimated global annual potash production and 39% of estimated North American annual potash production.
International Distribution Segment — This segment consists of sales offices, crop nutrient blending and bagging facilities, port terminals and warehouses in Brazil, Paraguay, India and China. We also have a single superphosphate ("SSP") plant in Brazil that produces crop nutrients by mixing sulfuric acid with phosphate rock. Our International Distribution segment serves as a distribution outlet for our Phosphates and Potash segments, but also purchases and markets certain products from other suppliers, generally to complement sales of our own product.
As used in this report:
| • | “Mosaic” means The Mosaic Company; |
| • | “we”, “us”, and “our” refer to Mosaic and its direct and indirect subsidiaries, individually or in any combination; |
| • | “Cargill” means Cargill, Incorporated and its direct and indirect subsidiaries, individually or in any combination; |
| • | “Cargill Crop Nutrition” means the crop nutrient business we acquired from Cargill in the Combination; |
| • | “Combination” means the October 22, 2004 combination of IMC and Cargill Crop Nutrition; |
| • | “Cargill Transaction” means the transactions described below under “Cargill Transaction”; and |
| • | statements as to our industry position reflect information from the most recent period available. |
Cargill Transaction
In May 2011, Cargill divested its interest in us in a split-off (the “Split-off”) to its stockholders (the “Exchanging Cargill Stockholders”) and a debt exchange (“Debt Exchange”) with certain Cargill debt holders (the “Exchanging Cargill Debt Holders”). The agreements relating to the Cargill Transaction contemplated an orderly distribution of the approximately 64% (285.8 million) of our shares that Cargill formerly held. An aggregate of 157.0 million of these shares were sold by certain of the Exchanging Cargill Stockholders and the Exchanging Cargill Debt Holders in underwritten public secondary offerings or to us, and all other shares (approximately 128.8 million shares in the aggregate) of our Class A Common Stock (“Class A Shares”) received by the Exchanging Cargill Stockholders in the split-off were subsequently either repurchased by us in 2014 or converted to regular shares of our Common Stock as described in Note 18 of our Consolidated Financial Statements. No Class A Shares remain outstanding and none are authorized under our Restated Certificate of Incorporation.
We have included additional information about the Cargill Transaction in Note 18 of our Consolidated Financial Statements, which information is incorporated herein by reference, and certain of the principal transaction documents related to the Cargill Transaction are incorporated by reference as exhibits to this report.
Business Developments during 2016
We took the following steps toward achieving our strategic priorities:
| • | Growth: Grow our production of essential crop nutrients and operate with increasing efficiency |
| • | On December 19, 2016, we entered into an agreement to acquire Vale S.A.'s global phosphate and potash operations conducted through Vale Fertilizantes S.A. for a purchase price valued at $2.5 billion, consisting of $1.25 billion in cash and 42,286,874 shares of Mosaic common stock. When completed, this transaction will increase our finished phosphates capacity by approximately five million tonnes and our finished potash capacity by approximately 500,000 tonnes. The assets we will acquire upon closing include five Brazilian phosphate rock mines; four chemical plants; a potash mine in Brazil; an additional 40% economic interest in the Miski Mayo Mine, which will increase our aggregate interest to 75%; a Kronau, Saskatchewan potash project; and a 20% interest in the Tiplam port. We also have an option under the agreement to purchase a potash mine in Rio Colorado, Argentina. Upon closing, Mosaic expects to become the leading fertilizer production and distribution company in Brazil. On February 6, 2017 we received notice from the U.S. Federal Trade Commission that it had granted early termination of the applicable waiting period under the Hart-Scott-Rodino Antitrust Improvements Act of 1976, satisfying one of the conditions to closing. The transaction is expected to close in late 2017 and is subject to the satisfaction of other regulatory and closing conditions. |
| • | During 2016, we made equity contributions of $220 million to the Ma'aden Wa'ad Al Shamal Phosphate Company (“MWSPC”), our joint venture with Saudi Arabian Mining Company (“Ma’aden”) and Saudi Basic Industries Corporation (“SABIC”) to develop, own and operate integrated phosphate production facilities in the Kingdom of Saudi Arabia. Our cash investment at December 31, 2016 and as of the date of this report, is approximately $707 million. We currently estimate that our total cash investment in MWSPC, including the amount we have invested to date, will approximate $850 million. We expect our future cash contributions to be approximately $143 million. We estimate the total cost to develop and construct the integrated phosphate |
production facilities to be approximately $8.0 billion. We expect this amount to be funded through external debt facilities, and investments by the joint venture members.
| • | We continued the expansion of capacity in our Potash segment with the K3 shafts at our Esterhazy mine, which we expect to begin mining potash ore in 2017 and following ramp-up, to add an estimated 0.9 million tonnes to our potash operational capacity. Once completed, this will provide us the opportunity to mitigate future brine inflow management costs and risk. |
| • | On November 15, 2016 the U.S. Army Corps of Engineers issued the final permit that will allow us to extend our mining operations from our South Pasture, Florida phosphate mine onto the adjoining South Pasture Extension, which includes land parcels totaling approximately 7,500 acres. We believe this will enable us to extend our mining operations at South Pasture for an additional 14 years. |
| • | In 2016, we commenced a proving run at our Belle Plaine, Saskatchewan potash mine which was completed on February 7, 2017, and will be taken into account in determining our Canpotex allocation in the second half of 2017. |
| • | Market Access: Expand our reach and impact by continuously strengthening our distribution network |
| • | We had record sales volumes of 6.8 million tonnes in our International Distribution segment in 2016. |
| • | Innovation: Build on our industry-leading product, process and sustainability innovations |
| • | We completed our investments to expand our MicroEssentials® capacity, adding an incremental 1.2 million tonnes and bringing our total capacity to 3.5 million tonnes in 2017. Our sales volumes of MicroEssentials® products in 2016 were 2.2 million tonnes, including sales from our International Distribution segment, which represents an increase of 23% over 2015. |
| • | Total Shareholder Return: Deliver strong financial performance and provide meaningful returns to our shareholders |
| • | On November 18, 2016 we upsized and extended our prior $1.5 billion unsecured revolving credit facility, and refinanced our prior term loan facility, with a new unsecured five-year credit facility comprised of a revolving credit facility of up to $2.0 billion and a $720 million term loan facility. |
| • | We entered into, and in March 2016 settled, an accelerated share repurchase transaction under which we received a total of 2,766,588 shares of our Common Stock in exchange for a payment of $75 million. The transaction was conducted under the $1.5 billion repurchase program authorized by our Board of Directors in May 2015 (the "2015 Repurchase Program"). |
| • | We continued to execute against our cost saving initiatives in ways that are positively impacting financial results. |
| ◦ | We are on track to meet the goal we set to achieve $500 million in cost savings by the end of 2018. We are approximately 80% of the way toward meeting this goal. |
| ◦ | We are targeting an additional $75 million in savings in our support functions and expect to realize most of these savings by the end of 2017. Selling, general and administrative expenses in 2016 were the lowest amount in the last ten years, benefiting from our ongoing expense management initiatives. |
| ◦ | We are managing our capital through the reduction, deferral or elimination of certain capital spending. Capital expenditures in 2016 were the lowest in over five years. |
| ◦ | In July 2016, we temporarily idled our Colonsay, Saskatchewan potash mine for the remainder of 2016 in light of reduced customer demand while adapting to challenging potash market conditions. Our lower-cost Esterhazy and Belle Plaine mines, in combination with existing inventory, allowed us to meet our short-term potash supply needs for 2016. We resumed production at Colonsay in January 2017. |
| • | Subsequent to year-end, we announced that our Board of Directors has approved a reduction in our target annual dividend to $0.60 per share, effective with our next declaration, expected in May 2017. |
We have included additional information about these and other developments in our business during 2016 in our Management’s Discussion and Analysis of Financial Condition and Results of Operations (“Management’s Analysis”) and in the Notes to our Consolidated Financial Statements.
BUSINESS SEGMENT INFORMATION
The discussion below of our business segment operations should be read in conjunction with the following information that we have included in this report:
| • | The risk factors discussed in this report in Part I, Item 1A, “Risk Factors.” |
| • | Our Management’s Analysis. |
| • | The financial statements and supplementary financial information in our Consolidated Financial Statements (“Consolidated Financial Statements”). This information is incorporated by reference in this report in Part II, Item 8, “Financial Statements and Supplementary Data.” |
Phosphates Segment
Our Phosphates business segment owns and operates mines and production facilities in Florida which produce concentrated phosphate crop nutrients and phosphate-based animal feed ingredients, and processing plants in Louisiana which produce concentrated phosphate crop nutrients.
On March 17, 2014, we completed our acquisition (the "CF Phosphate Assets Acquisition") of the Florida phosphate assets and assumption of certain related liabilities of CF Industries, Inc. ("CF"), which included the 25,000-acre South Pasture phosphate mine and beneficiation plant in Hardee County, Florida, a phosphate manufacturing facility in Plant City, Florida, and ammonia terminal and finished product warehouse facilities in Tampa.
U.S. Phosphate Crop Nutrients and Animal Feed Ingredients
Our U.S. phosphates operations have capacity to produce approximately 5.3 million tonnes of phosphoric acid (“P2O5”) per year, or about 10% of world annual capacity and about 60% of North American annual capacity. Phosphoric acid is produced by reacting finely ground phosphate rock with sulfuric acid. Phosphoric acid is the key building block for the production of high analysis or concentrated phosphate crop nutrients and animal feed products, and is the most comprehensive measure of phosphate capacity and production and a commonly used benchmark in our industry. Our U.S. phosphoric acid production totaled approximately 4.5 million tonnes during 2016. We account for approximately 10% of estimated global annual production and 61% of estimated North American annual output.
Our phosphate crop nutrient products are marketed worldwide to crop nutrient manufacturers, distributors, retailers and farmers. Our principal phosphate crop nutrient products are:
| • | Diammonium Phosphate (18-46-0) Diammonium Phosphate (“DAP”) is the most widely used high-analysis phosphate crop nutrient worldwide. DAP is produced by first combining phosphoric acid with anhydrous ammonia in a reaction vessel. This initial reaction creates a slurry that is then pumped into a granulation plant where it is reacted with additional ammonia to produce DAP. DAP is a solid granular product that is applied directly or blended with other solid plant nutrient products such as urea and potash. |
| • | Monoammonium Phosphate (11-52-0) Monoammonium Phosphate (“MAP”) is the second most widely used high-analysis phosphate crop nutrient and the fastest growing phosphate product worldwide. MAP is also produced by first combining phosphoric acid with anhydrous ammonia in a reaction vessel. The resulting slurry is then pumped into the granulation plant where it is reacted with additional phosphoric acid to produce MAP. MAP is a solid granular product that is applied directly or blended with other solid plant nutrient products. |
| • | MicroEssentials® is a value-added ammoniated phosphate product that is enhanced through a patented process that creates very thin platelets of sulfur and other micronutrients, such as zinc, on the granulated product. The patented process incorporates both the sulfate and elemental forms of sulfur, providing season-long availability to crops. |
Production of our animal feed ingredients products is located at our New Wales, Florida facility. We market our feed phosphate primarily under the leading brand names of Biofos® and Nexfos®.
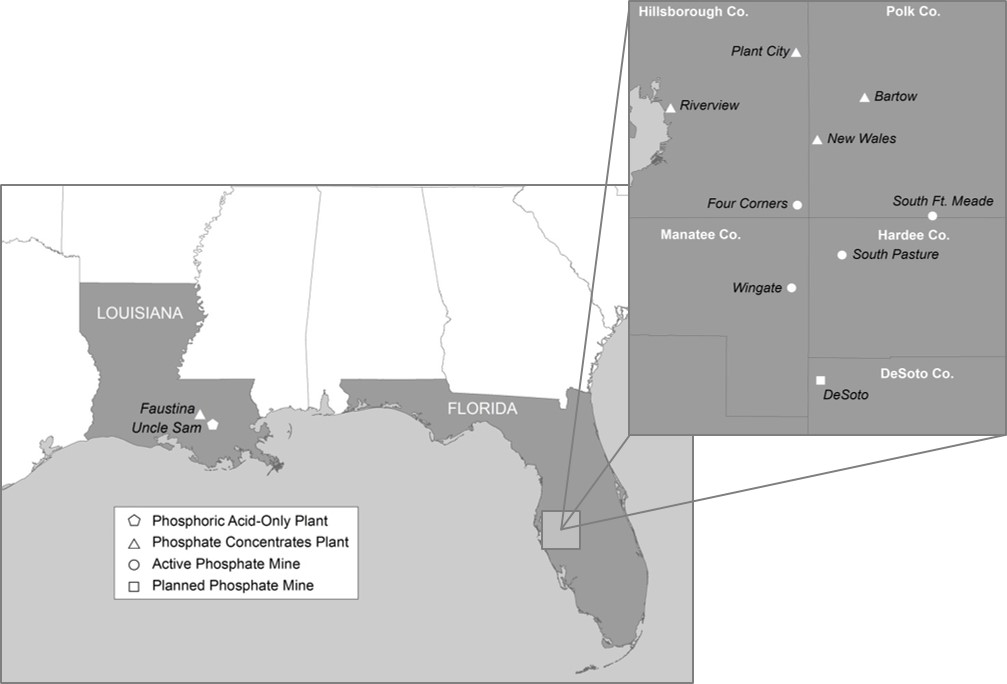
Our primary phosphate crop nutrient production facilities are located in central Florida and Louisiana. The following map shows the locations of each of our phosphate concentrates plants in the United States and the locations of each of our active and planned phosphate mines in Florida, other than Ona as its reserves have been allocated to other active mines:
Annual capacity by plant as of December 31, 2016 and production volumes by plant for 2016 are listed below:
| (tonnes in millions) | Phosphoric Acid | Processed Phosphate(a)/DAP/MAP/ MicroEssentials®/Feed Phosphate | ||||||||||
| Operational Capacity(b) | Operational Capacity(b) | |||||||||||
| Facility | Production(c) | Production(c) | ||||||||||
| Florida: | ||||||||||||
| Bartow | 0.9 | 1.0 | 2.2 | 2.2 | ||||||||
| New Wales | 1.7 | 1.4 | 4.1 | 2.9 | ||||||||
| Riverview | 0.9 | 0.8 | 1.8 | 1.6 | ||||||||
| Plant City | 1.0 | 0.7 | 2.0 | 1.4 | ||||||||
| 4.5 | 3.9 | 10.1 | 8.1 | |||||||||
| Louisiana: | ||||||||||||
| Faustina | — | — | 1.6 | 1.4 | ||||||||
| Uncle Sam | 0.8 | 0.6 | — | — | ||||||||
| 0.8 | 0.6 | 1.6 | 1.4 | |||||||||
| Total | 5.3 | 4.5 | 11.7 | 9.5 |
| (a) | Our ability to produce processed phosphates has been less than our annual operational capacity stated in the table above, except to the extent we purchase phosphoric acid. Factors affecting actual production are described in note (c) below. |
| (b) | Operational capacity is our estimated long-term capacity based on an average amount of scheduled down time, including maintenance and scheduled turnaround time, and product mix, and no significant modifications to operating conditions, equipment or facilities. |
| (c) | Actual production varies from annual operational capacity shown in the above table due to factors that include among others the level of demand for our products, maintenance and turnaround time, accidents, mechanical failure, product mix, and other operating conditions. |
The phosphoric acid produced at Uncle Sam is shipped to Faustina, where it is used to produce DAP, MAP and MicroEssentials®. Our Faustina plant also manufactures ammonia that is mostly consumed in our concentrate plants.
We produced approximately 8.9 million tonnes of concentrated phosphate crop nutrients during 2016 and accounted for approximately 14% of estimated world annual output and 75% of estimated North American annual production.
Phosphate Rock
Phosphate rock is the key mineral used to produce phosphate crop nutrients and feed phosphate. Our phosphate rock production totaled approximately 14.2 million tonnes in 2016 and accounted for approximately 7% of estimated world annual production and 54% of estimated North American annual production. We are the world’s second largest miner of phosphate rock and currently operate four mines with a combined annual capacity of approximately 17.2 million tonnes. Production of one tonne of DAP requires between 1.6 and 1.7 tonnes of phosphate rock.
All of our wholly owned phosphate mines and related mining operations are located in central Florida. During 2016, we operated four active mines: Four Corners, South Fort Meade, Wingate and South Pasture. The Hookers Prairie mine's reserves were exhausted during 2014. We plan to develop Ona and DeSoto reserves to replace reserves that will be depleted at various times during the next decade.
The phosphate deposits of Florida are of sedimentary origin and are part of a phosphate-bearing province that extends from southern Florida north along the Atlantic coast into southern Virginia. Our active phosphate mines are primarily located in what is known as the Bone Valley Member of the Peace River Formation in the Central Florida Phosphate District. The southern portions of the Four Corners and Wingate mines are in what is referred to as the Undifferentiated Peace River Formation, in which the Ona and DeSoto reserves we plan to develop are also located. Phosphate mining has been conducted in the Central Florida Phosphate District since the late 1800’s. The potentially mineable portion of the district encompasses an area approximately 80 miles in length in a north-south direction and approximately 40 miles in width.
We extract phosphate ore using large surface mining machines that we own called “draglines.” Prior to extracting the ore, the draglines must first remove a 10 to 50 foot layer of sandy overburden. At our Wingate mine, we also utilize dredges to remove the overburden and mine the ore. We then process the ore at beneficiation plants that we own at each active mine where the ore goes through washing, screening, sizing and flotation processes designed to separate the phosphate rock from sands, clays and other foreign materials. Prior to commencing operations at any of our planned future mines, we may need to acquire new draglines or move existing draglines to the mines and, unless the beneficiation plant at an existing mine were used, construct a beneficiation plant.
The following table shows, for each of our phosphate mines, annual capacity as of December 31, 2016 and rock production volume and grade for the years 2016, 2015, and 2014:
| (tonnes in millions) | Annual Operational Capacity(a)(b) | 2016 | 2015 | 2014 | |||||||||||||||||||||||||
| Facility | Production(b) | Average BPL(c) | % P2O5(d) | Production(b) | Average BPL(c) | % P2O5(d) | Production(b) | Average BPL(c) | % P2O5(d) | ||||||||||||||||||||
| Four Corners | 7.0 | 5.3 | 63.2 | 28.9 | 5.7 | 63.6 | 29.1 | 5.4 | 63.8 | 29.2 | |||||||||||||||||||
| South Fort Meade | 5.5 | 4.2 | 63.0 | 28.8 | 4.3 | 62.2 | 28.5 | 4.1 | 61.6 | 28.2 | |||||||||||||||||||
| Hookers Prairie(e) | — | — | — | — | — | — | — | 0.8 | 64.8 | 29.8 | |||||||||||||||||||
| South Pasture(f) | 3.2 | 3.4 | 62.5 | 28.6 | 3.3 | 61.4 | 28.1 | 2.6 | 60.9 | 27.9 | |||||||||||||||||||
| Wingate | 1.5 | 1.3 | 63.1 | 28.9 | 1.2 | 63.9 | 29.2 | 1.1 | 63.8 | 29.2 | |||||||||||||||||||
| Total | 17.2 | 14.2 | 63.0 | 28.8 | 14.5 | 62.7 | 28.7 | 14.0 | 62.7 | 28.7 |
| (a) | Annual operational capacity is the expected average long-term annual capacity considering constraints represented by the grade, quality and quantity of the reserves being mined as well as equipment performance and other operational factors. |
| (b) | Actual production varies from annual operational capacity shown in the above table due to factors that include among others the level of demand for our products, the quality of the reserves, the nature of the geologic formations we are |
mining at any particular time, maintenance and turnaround time, accidents, mechanical failure, weather conditions, and other operating conditions, as well as the effect of recent initiatives intended to improve operational excellence.
| (c) | Bone Phosphate of Lime (“BPL”) is a traditional reference to the amount (by weight percentage) of calcium phosphate contained in phosphate rock or a phosphate ore body. A higher BPL corresponds to a higher percentage of calcium phosphate. |
| (d) | The percent of P2O5 in the above table represents a measure of the phosphate content in phosphate rock or a phosphate ore body. A higher percentage corresponds to a higher percentage of phosphate content in phosphate rock or a phosphate ore body. |
| (e) | The Hookers Prairie mine’s reserves were exhausted during 2014. |
| (f) | Production at the South Pasture mine in 2014 reflects rock mined from March of 2014, when the mine was acquired. |
Reserves
We estimate our phosphate rock reserves based upon exploration core drilling as well as technical and economic analyses to determine that reserves can be economically mined. Proven (measured) reserves are those resources of sufficient concentration to meet minimum physical, chemical and economic criteria related to our current product standards and mining and production practices. Our estimates of probable (indicated) reserves are based on information similar to that used for proven reserves, but sites for drilling are farther apart or are otherwise less adequately spaced than for proven reserves, although the degree of assurance is high enough to assume continuity between such sites. Proven reserves are determined using a minimum drill hole spacing in two locations per 40 acre block. Probable reserves have less than two drill holes per 40 acre block, but geological data provides a high degree of assurance that continuity exists between sites.
The following table sets forth our proven and probable phosphate reserves as of December 31, 2016:
| (tonnes in millions) | Reserve Tonnes (a)(b)(c) | Average BPL(d) | % P2O5 | |||||
| Active Mines | ||||||||
| Four Corners | 91.2 | 64.3 | 29.4 | |||||
| South Fort Meade | 23.3 | 62.7 | 28.7 | |||||
| South Pasture | 148.0 | 63.2 | 28.9 | |||||
| Wingate | 30.0 | 63.0 | 28.8 | |||||
| Total Active Mines | 292.5 | 63.5 | 29.0 | |||||
| Planned Mining | ||||||||
| Ona(f) | 110.9 | 65.1 | 29.8 | |||||
| DeSoto | 151.1 | (e) | 63.9 | 29.2 | ||||
| Total Planned Mining | 262.0 | 64.4 | 29.5 | |||||
| Total Mining | 554.5 | 63.9 | 29.2 |
| (a) | Reserves are in areas that are fully accessible for mining; free of surface or subsurface encumbrance, legal setbacks, wetland preserves and other legal restrictions that preclude permittable access for mining; believed by us to be permittable; and meet specified minimum physical, economic and chemical criteria related to current mining and production practices. |
| (b) | Reserve estimates are generally established by our personnel without a third party review. There has been no third party review of reserve estimates within the last five years. The reserve estimates have been prepared in accordance with the standards set forth in Industry Guide 7 promulgated by the United States Securities and Exchange Commission (“SEC”). |
| (c) | Of the reserves shown, 523.7 million tonnes are proven reserves, while probable reserves totaled 30.8 million tonnes. |
| (d) | Average product BPL ranges from approximately 63% to 65%. |
| (e) | In connection with the purchase in 1996 of approximately 111.1 million tonnes of the reported DeSoto reserves, we agreed to (i) pay royalties of between $0.50 and $0.90 per ton of rock mined based on future levels of DAP margins, and (ii) pay to the seller lost income from the loss of surface use to the extent we use the property for mining related purposes before January 1, 2020. |
| (f) | The Ona reserves have been allocated to our Four Corners and South Pasture mines as they will be mined from those locations. |
We generally own the reserves shown for active mines in the table above, with the only significant exceptions being further described below:
| • | We own the above-ground assets of the South Fort Meade mine, including the beneficiation plant, rail track and the initial clay settling areas. A limited partnership, South Ft. Meade Partnership, L.P. (“SFMP”), owns the majority of the mineable acres shown in the table for the South Fort Meade mine. |
| • | We currently have a 95% economic interest in the profits and losses of SFMP. SFMP is included as a consolidated subsidiary in our financial statements. |
| • | We have a long-term mineral lease with SFMP. This lease expires on the earlier of December 31, 2025 or on the date that we have completed mining and reclamation obligations associated with the leased property. Lease provisions include royalty payments and a commitment to give mining priority to the South Fort Meade phosphate reserves. We pay the partnership a royalty on each BPL short ton mined and shipped from the areas that we lease from it. Royalty payments to SFMP normally average approximately $14 million annually. |
| • | Through its arrangements with us, SFMP also earns income from mineral lease payments, agricultural lease payments and interest income, and uses those proceeds primarily to pay dividends to its equity owners. |
| • | The surface rights to approximately 902 acres for the South Fort Meade Mine are owned by SFMP, while the U.S. government owns the mineral rights beneath. We control the rights to mine these reserves under a mining lease agreement and pay royalties on the tonnage extracted. Under the lease, we paid $1.1 million in royalties to the U.S. Government in 2016. |
In light of the long-term nature of our rights to our reserves, we expect to be able to mine all reported reserves that are not currently owned prior to termination or expiration of our rights. Additional information regarding permitting is included in Part I, Item 1A, “Risk Factors”, and under “Environmental, Health, Safety and Security Matters—Operating Requirements and Impacts—Permitting” in our Management’s Analysis.
Investments in Joint Ventures
We have a 35% economic interest in a joint venture which owns the Miski Mayo phosphate rock mine in the Bayovar region of Peru. Our investment in the Miski Mayo Mine and related commercial offtake supply agreement to purchase a share of the phosphate rock from the Miski Mayo Mine allows us to supplement our internally produced rock to meet our overall fertilizer production needs. The Miski Mayo Mine’s annual production capacity is 3.9 million tonnes. Upon the closing of our proposed acquisition of Vale Fertilizantes S.A. we will acquire an additional 40% economic interest in the Miski Mayo joint venture, which will bring our aggregate interest to 75%.
We own a 25% interest in MWSPC and in connection with our equity share, we will market approximately 25% of the MWSPC's production. MWSPC is developing a mine and two chemical complexes that are presently expected to produce phosphate fertilizers and other downstream phosphates products in the Kingdom of Saudi Arabia. We currently estimate that the cost to develop and construct the integrated phosphate production facilities (the "Project") will approximate $8.0 billion, which we expect to be funded primarily through investments by us, Ma'aden and SABIC, and through borrowing arrangements and other external project financing facilities ("Funding Facilities"). We currently estimate that our cash investment in the Project, including the amount we have invested to date, will approximate $850 million. Our cash investment in the Project at December 31, 2016 and as of the date of this report was $707 million. We expect our future cash contributions to be approximately $143 million. The greenfield project is being built in the northern region of Saudi Arabia at Wa’ad Al Shamal Minerals Industrial City, and includes further expansion of processing plants in Ras Al Khair Minerals Industrial City, which is located on the east coast of Saudi Arabia. The facilities are expected to have a production capacity of approximately 3.5 million tonnes of finished product per year. The Project is expected to benefit from the availability of key raw nutrients from sources within Saudi Arabia. Ammonia operations commenced in late 2016 and production of finished phosphate products is expected to begin in 2017.
On June 30, 2014, MWSPC entered into Funding Facilities with a consortium of 20 financial institutions for a total amount of approximately $5.0 billion. In January 2016, MWSPC announced that it had received the approval of the Saudi Industrial Development Fund ("SIDF") for future Funding Facilities in the total amount of approximately $1.1 billion, subject to the finalization of definitive agreements. We currently expect that MWSPC will work to finalize definitive agreements for loans from SIDF in the lower amount of approximately $560 million by April 30, 2017. The terms of the June 30, 2014 Funding Facilities and the proposed future Funding Facilities are further discussed in Note 8 of our Consolidated Financial Statements.
Sulfur
We use molten sulfur at our phosphates concentrates plants to produce sulfuric acid primarily for use in our production of phosphoric acid. We purchased approximately 4.2 million long tons of sulfur during 2016. We purchase the majority of this sulfur from North American oil and natural gas refiners who are required to remove or recover sulfur during the refining process. Production of one tonne of DAP requires approximately 0.40 long tons of sulfur. We procure our sulfur from multiple sources and receive it by truck, rail, barge and vessel, either direct to our phosphate plants or have it sent for gathering to terminals that are located on the U.S. gulf coast. The new sulfur melter at our New Wales facility became operational in the first quarter of 2016 and with the melter we are now able to purchase formed sulfur, which is more broadly available than molten sulfur. Formed sulfur for the melter is received through two Tampa ports, then delivered by truck to the New Wales facility. The sulfur melter has the capability to melt over one million long tons of sulfur annually, allowing us to leverage economic benefits within the global sulfur marketplace.
We own and operate sulfur terminals in Houston, Texas and Riverview, Florida. We also lease terminal space in Tampa, Florida and Galveston and Beaumont, Texas. We contract for the operation of three ocean-going barges and three tugs that transport molten sulfur from the Texas terminals to Tampa and then onward by truck to our Florida phosphate plants. In addition, we own a 50% equity interest in Gulf Sulphur Services Ltd., LLLP (“Gulf Sulphur Services”), which is operated by our joint venture partner. Gulf Sulphur Services has a sulfur transportation and terminaling business in the Gulf of Mexico, and handles these functions for a substantial portion of our Florida sulfur volume. Our sulfur logistic assets also include a large fleet of leased railcars that supplement our marine sulfur logistic system. Our Louisiana operations are served by truck and barge from nearby refineries.
Although sulfur is readily available from many different suppliers and can be transported to our phosphate facilities by a variety of means, sulfur is an important raw material used in our business that has in the past been and may in the future be the subject of volatile pricing and availability. Alternative transportation and terminaling facilities might not have sufficient capacity to fully serve all of our facilities in the event of a disruption to current transportation or terminaling facilities. Changes in the price of sulfur or disruptions to sulfur transportation or terminaling facilities could have a material impact on our business. We have included a discussion of sulfur prices in our Management’s Analysis.
Ammonia
We use ammonia together with phosphoric acid to produce DAP, MAP and MicroEssentials®. We consumed approximately 1.5 million tonnes of ammonia during 2016. Production of one tonne of DAP requires approximately 0.23 tonnes of ammonia.
Our Florida ammonia needs are currently supplied under multi-year contracts with both domestic and offshore producers. Ammonia for our New Wales and Riverview plants is terminaled through an owned ammonia facility at Port Sutton, Florida. Ammonia for our Bartow plant is terminaled through another ammonia facility owned and operated by a third party at Port Sutton, Florida pursuant to an agreement that provides for service through 2019 with automatic renewal for an additional two-year period unless either party terminates as provided in the agreement. Ammonia is transported by pipeline from the terminals to our production facilities. We have service agreements with the operators of the pipelines for Bartow, New Wales, and Riverview, which provide service through June 30, 2017; the service agreements may be extended in one year increments unless either party objects. Ammonia for our Plant City facility is terminaled through an owned facility in Tampa, Florida, that was acquired as part of the CF Phosphate Assets Acquisition. This ammonia is transported by rail via leased railcars. The leases for rail cars expire in 2017, 2018 and 2019.
In 2013, we entered into an ammonia supply agreement with CF (the "CF Ammonia Supply Agreement") that commenced in 2017, under which Mosaic agreed to purchase approximately 545,000 to 725,000 tonnes of ammonia per year during a term that may extend until December 31, 2032 at a price tied to the prevailing price of U.S. natural gas. For 2017, our remaining minimum purchase obligation is approximately 410,000 tonnes following our entry into a separate arrangement with CF under which we were deemed to have purchased approximately 135,000 tonnes in exchange for providing ammonia storage space and use of related terminal facilities to CF. A specialized tug and barge unit is currently under construction for use in transporting the ammonia and is expected to be operational in the second half of 2017. Additional information about the unit and its financing is provided in Note 16 of our Consolidated Financial Statements. Upon completion of the unit, we expect a majority of the ammonia purchased under the CF Ammonia Supply Agreement to be received by barge at the port of Tampa and delivered to our Florida facilities as described in the preceding paragraph. While the market prices of natural gas and
ammonia have changed since we executed this agreement in 2013, we continue to expect that the agreement will provide us a competitive advantage over its term, including by providing a reliable long-term ammonia supply.
We produce ammonia at Faustina, Louisiana primarily for our own consumption. Our annual capacity is approximately 500,000 tonnes. From time to time we sell surplus ammonia to unrelated parties. In addition, under certain circumstances we are permitted to receive ammonia at Faustina under the CF Ammonia Supply Agreement.
Although ammonia is readily available from many different suppliers and can be transported to our phosphates facilities by a variety of means, ammonia is an important raw material used in our business that has in the past been and may in the future be the subject of volatile pricing, and alternative transportation and terminaling facilities might not have sufficient capacity to fully serve all of our facilities in the event of a disruption to existing transportation or terminaling facilities. Changes in the price of ammonia or disruptions to ammonia transportation or terminaling could have a material impact on our business. We have included a discussion of ammonia prices in our Management’s Analysis.
Natural Gas for Phosphates
Natural gas is the primary raw material used to manufacture ammonia. At our Faustina facility, ammonia is manufactured on site. The majority of natural gas is purchased through firm delivery contracts based on published index-based prices and is sourced from Texas and Louisiana via pipelines interconnected to the Henry Hub. We use over-the-counter swap and/or option contracts to forward price portions of future gas purchases. We typically purchase approximately 18 million MMbtu of natural gas per year for use in ammonia production at Faustina.
Our ammonia requirements for our Florida operations are purchased rather than manufactured on site, so while we typically purchase approximately two million MMbtu of natural gas per year in Florida, it is only used as a thermal fuel for various phosphate production processes.
Florida Land Holdings
We are a significant landowner in the State of Florida, which has in the past been considered one of the fastest areas of population growth in the United States. We own land comprising over 290,000 acres held in fee simple title in central Florida, and have the right to mine additional properties which contain phosphate rock reserves. Some of our land holdings are needed to operate our Phosphates business, while a portion of our land assets, such as certain reclaimed properties, are no longer required for our ongoing operations. As a general matter, more of our reclaimed property becomes available for uses other than for phosphate operations each year. Our real property assets are generally comprised of concentrates plants, port facilities, phosphate mines and other property which we have acquired through our presence in Florida. Our long-term future land use strategy is to optimize the value of our land assets. For example, we developed Streamsong Resort® (the "Resort"), a destination resort and conference center, in an area of previously mined land as part of our long-term business strategy to maximize the value and utility of our extensive land holdings in Florida. In addition to the two golf courses and clubhouse that were opened in December 2012, the Resort and conference center opened in January 2014. In 2015, in response to market demand, we began construction of a third golf course and ancillary facilities, which are expected to be completed in 2017.
Potash Segment
We are one of the leading potash producers in the world. We mine and process potash in Canada and the United States and sell potash in North America and internationally. The term “potash” applies generally to the common salts of potassium. Muriate of potash (“MOP”) is the primary source of potassium for the crop nutrient industry. Red MOP has traces of iron oxide. The granular and standard grade Red MOP products are well suited for direct fertilizer application and bulk blending. White MOP has a higher percent potassium oxide (“K2O”). White MOP, besides being well suited for the agricultural market, is used in many industrial applications. We also produce a double sulfate of potash magnesia product, which we market under our brand name K-Mag®, at our Carlsbad, New Mexico facility.
Our potash products are marketed worldwide to crop nutrient manufacturers, distributors and retailers and are also used in the manufacturing of mixed crop nutrients and, to a lesser extent, in animal feed ingredients. We also sell potash to customers for industrial use. In addition, our potash products are used for de-icing and as a water softener regenerant.
In 2016, we operated three potash mines in Canada, including two shaft mines with a total of three production shafts and one solution mine, as well as one potash shaft mine in the United States. We also own related refineries at each of the mines.
We continue the expansion of capacity in our Potash segment with the K3 shafts at our Esterhazy mine, which are expected to begin mining potash ore in 2017 and following ramp-up to add an estimated 0.9 million tonnes to our annual potash
operational capacity. This will provide for an infrastructure to move ore from K3 to the K1 and K2 mills, giving us the flexibility to optimize production at K1, K2 and K3 in order to mitigate risk from current and future brine inflows.
It is possible that the costs of remedial efforts at Esterhazy may further increase in the future and that such an increase could be material, or, in the extreme scenario, that the brine inflows, risk to employees or remediation costs may increase to a level which would cause us to change our mining processes or abandon the mines. See “Key Factors that can Affect Results of Operations and Financial Condition” and “Potash Net Sales and Gross Margin” in our Management’s Analysis and “Our Esterhazy mine has had an inflow of salt saturated brine for more than 30 years” in Part I, Item 1A, “Risk Factors” in this report, which are incorporated herein by reference, for a discussion of costs, risks and other information relating to the brine inflows.
The map below shows the location of each of our potash mines.
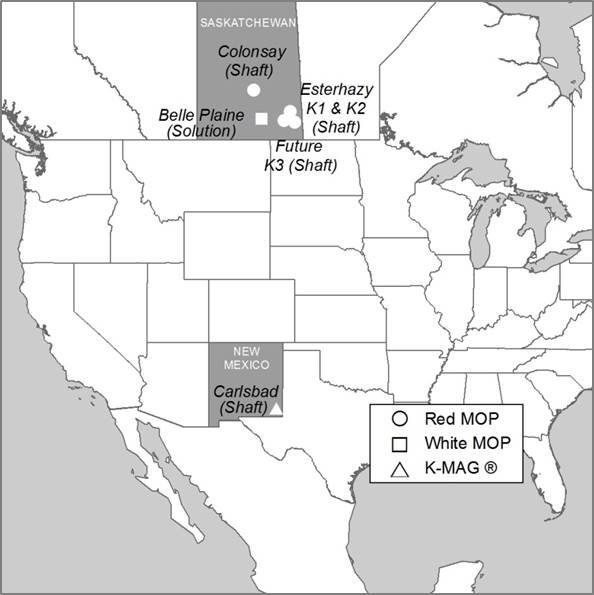
Our current potash annualized operational capacity totals 9.9 million tonnes of product per year and accounts for approximately 14% of world annual capacity and 43% of North American annual capacity. Production during 2016 totaled 7.6 million tonnes. We account for approximately 12% of estimated world annual production and 39% of estimated North American annual production.
The following table shows, for each of our potash mines, annual capacity as of December 31, 2016 and volume of mined ore, average grade and finished product output for years 2016, 2015 and 2014:
| (tonnes in millions) | 2016 | 2015 | 2014 | |||||||||||||||||||||||||||||
| Facility | Annualized Proven Peaking Capacity (a)(c)(d) | Annual Operational Capacity (a)(b)(d)(e) | Ore Mined | Grade % K2O(f) | Finished Product(b) | Ore Mined | Grade % K2O(f) | Finished Product(b) | Ore Mined | Grade % K2O(f) | Finished Product(b) | |||||||||||||||||||||
| Canada | ||||||||||||||||||||||||||||||||
| Belle Plaine—MOP | 2.8 | 2.4 | 9.0 | 18.0 | 2.4 | 8.0 | 18.0 | 2.1 | 8.4 | 18.0 | 2.2 | |||||||||||||||||||||
| Colonsay—MOP(h) (i) | 2.6 | 1.5 | 1.6 | 25.7 | 0.5 | 3.9 | 26.8 | 1.4 | 3.8 | 26.9 | 1.4 | |||||||||||||||||||||
| Esterhazy—MOP | 6.3 | 5.3 | 12.6 | 24.4 | 4.2 | 13.1 | 23.7 | 4.3 | 12.4 | 23.8 | 4.0 | |||||||||||||||||||||
| Canadian Total | 11.7 | 9.2 | 23.2 | 22.0 | 7.1 | 25.0 | 22.3 | 7.8 | 24.6 | 22.3 | 7.6 | |||||||||||||||||||||
| United States | ||||||||||||||||||||||||||||||||
| Carlsbad—MOP(g) | — | — | — | — | — | — | — | — | 2.5 | 9.5 | 0.2 | |||||||||||||||||||||
| Carlsbad—K-Mag®(j) | 0.9 | 0.7 | 2.7 | 5.4 | 0.5 | 2.2 | 5.8 | 0.6 | 1.7 | 5.5 | 0.4 | |||||||||||||||||||||
| United States Total | 0.9 | 0.7 | 2.7 | 5.4 | 0.5 | 2.2 | 5.8 | 0.6 | 4.2 | 7.8 | 0.6 | |||||||||||||||||||||
| Totals | 12.6 | 9.9 | 25.9 | 20.3 | 7.6 | 27.2 | 21.0 | 8.4 | 28.8 | 20.2 | 8.2 |
| (a) | Finished product. |
| (b) | Actual production varies from annual operational capacity shown in the above table due to factors that include among others the level of demand for our products, maintenance and turnaround time, the quality of the reserves and the nature of the geologic formations we are mining at any particular time, accidents, mechanical failure, product mix, and other operating conditions. |
| (c) | Represents full capacity assuming no turnaround or maintenance time. |
| (d) | The annualized proven peaking capacity shown above is the capacity currently used to determine our share of Canpotex, Limited ("Canpotex") sales. Canpotex members’ respective shares of Canpotex sales are based upon the members’ respective proven peaking capacities for producing potash. When a Canpotex member expands its production capacity, the new capacity is added to that member’s proven peaking capacity based on a proving run at the maximum production level. Alternatively, after January 2017, Canpotex members may elect to rely on an independent engineering firm and approved protocols to calculate their proven peaking capacity. The annual operational capacity reported in the table above can exceed the annualized proven peaking capacity until the proving run has been completed. Effective January 1, 2014, our share of Canpotex sales was 42.5%. Subsequently, one of Canpotex's other members demonstrated an increase in its capacity, which resulted in lowering our share of Canpotex sales to 38.8%, effective July 1, 2014. Effective January 1, 2015, our share of Canpotex sales increased to 40.6%, as a result of a proving run of our expansion of our Colonsay mine, which was successfully completed in 2014. Effective January 1, 2016, our share of Canpotex sales decreased to 38.1%, as Canpotex's other members demonstrated a change in capacity. |
| (e) | Annual operational capacity is our estimated long term potash capacity based on the quality of reserves and the nature of the geologic formations expected to be mined, milled and/or processed over the long term, average amount of scheduled down time, including maintenance and scheduled turnaround time, and product mix, and no significant modifications to operating conditions, equipment or facilities. Operational capacities will continue to be updated to the extent new production results impact ore grades assumptions. |
| (f) | Grade % K2O is a traditional reference to the percentage (by weight) of potassium oxide contained in the ore. A higher percentage corresponds to a higher percentage of potassium oxide in the ore. |
| (g) | Effective December 28, 2014, we permanently discontinued production of MOP at our Carlsbad facility. |
| (h) | In July 2016, we temporarily idled our Colonsay, Saskatchewan potash mine for the remainder of 2016 in light of reduced customer demand while adapting to challenging potash market conditions. We resumed production in January 2017. |
| (i) | We have the ability to reach an annual operating capacity of 2.1 million tonnes over time by increasing our staffing levels and investment in mine development activities. |
| (j) | K-Mag® is a specialty product that we produce at our Carlsbad facility. In 2014, we reduced our annual operational capacity of our K-Mag® due to lower ore grades. |
Canadian Mines
We operate three Canadian potash facilities all located in the southern half of the Province of Saskatchewan, including our solution mine at Belle Plaine, two interconnected mine shafts at our Esterhazy shaft mine and our shaft mine at Colonsay.
Extensive potash deposits are found in the southern half of the Province of Saskatchewan. The potash ore is contained in a predominantly rock salt formation known as the Prairie Evaporites. The Prairie Evaporites deposits are bounded by limestone formations and contain the potash beds. Three potash deposits of economic importance occur in Saskatchewan: the Esterhazy, Belle Plaine and Patience Lake members. The Patience Lake member is mined at Colonsay, and the Esterhazy member at Esterhazy. At Belle Plaine all three members are mined. Each of the major potash members contains several potash beds of different thicknesses and grades. The particular beds mined at Colonsay and Esterhazy have a mining height of 11 and 8 feet, respectively. At Belle Plaine several beds of different thicknesses are mined.
Our potash mines in Canada produce MOP exclusively. Esterhazy and Colonsay utilize shaft mining while Belle Plaine utilizes solution mining technology. Traditional potash shaft mining takes place underground at depths of over 1,000 meters where continuous mining machines cut out the ore face and load it onto conveyor belts. The ore is then crushed, moved to storage bins and hoisted to refineries above ground. In contrast, our solution mining process involves heated brine, which is pumped through a “cluster” to dissolve the potash in the ore beds at a depth of approximately 1,500 meters. A cluster consists of a series of boreholes drilled into the potash ore. A separate distribution center at each cluster controls the brine flow. The solution containing dissolved potash and salt is pumped to a refinery where sodium chloride, a co-product of this process, is separated from the potash through the use of evaporation and crystallization techniques. Concurrently, the solution is pumped into a cooling pond where additional crystallization occurs and the resulting product is recovered via a floating dredge. Refined potash is dewatered, dried and sized. Our Canadian operations produce 13 different MOP products, including industrial grades, many through proprietary processes.
Our potash mineral rights in the Province of Saskatchewan consist of the following:
| Belle Plaine | Colonsay | Esterhazy | Total | ||||||||
| Acres under control | |||||||||||
| Owned in fee | 15,236 | 10,845 | 113,514 | 139,595 | |||||||
| Leased from Province | 53,132 | 114,133 | 195,536 | 362,801 | |||||||
| Leased from others | — | 3,518 | 78,958 | 82,476 | |||||||
| Total under control | 68,368 | 128,496 | 388,008 | 584,872 |
We believe that our mineral rights in Saskatchewan are sufficient to support current operations for more than a century. Leases are generally renewable at our option for successive terms, generally 21 years each, except that certain of the acres shown above as “Leased from others” are leased under long-term leases with terms (including renewals at our option) that expire from 2023 to 2170.
We pay Canadian resource taxes consisting of the Potash Production Tax and resource surcharge. The Potash Production Tax is a Saskatchewan provincial tax on potash production and consists of a base payment and a profits tax. We also pay a percentage of the value of resource sales from our Saskatchewan mines. In addition to the Canadian resource taxes, royalties are payable to the mineral owners in respect of potash reserves or production of potash. We have included a further discussion of the Canadian resource taxes and royalties in our Management’s Analysis.
Since December 1985, we have effectively managed an inflow of salt saturated brine into our Esterhazy mine. At various times since then, we have experienced changing amounts and patterns of brine inflows at Esterhazy. To date, the brine inflow, including our remediation efforts to control it, has not had a material impact on our production processes or volumes. The volume of the net brine inflow (the rate of inflow less the amount we are pumping out of the mine) or net outflow (when we are pumping more brine out of the mine than the rate of inflow) fluctuates and is dependent on a number of variables, such as the location of the source of the inflow; the magnitude of the inflow; available pumping, surface and underground brine storage capacities; underground injection well capacities, and the effectiveness of calcium chloride and cementatious grout used to reduce or prevent the inflows, among other factors. As a result of these brine inflows, we incur expenditures, certain of which have been capitalized and others that have been charged to expense, in accordance with accounting principles generally accepted in the United States of America.
It is possible that the costs of remedial efforts at Esterhazy may further increase in the future and that such an increase could be material, or, in the extreme scenario, that the brine inflows, risk to employees or remediation costs may increase to a level which would cause us to change our mining processes or abandon the mine. See “Key Factors that can Affect Results of Operations and Financial Condition” and “Potash Net Sales and Gross Margin” in our Management’s Analysis and “Our Esterhazy mine has had an inflow of salt saturated brine for more than 30 years” in Part I, Item 1A, “Risk Factors” in this report, which are incorporated herein by reference, for a discussion of costs, risks and other information relating to the brine inflows. The K3 shafts at our Esterhazy mine are part of our potash expansion plan, which is also designed to mitigate risk from current and future inflows.
Due to the ongoing brine inflow at Esterhazy, subject to exceptions that are limited in scope and amount, we are unable to obtain insurance coverage for underground operations for water incursion problems. Like other potash producers’ shaft mines, our Colonsay, Saskatchewan, and Carlsbad, New Mexico, mines are also subject to the risks of inflow of water as a result of their shaft mining operations, but water inflow risks at these mines are included in our insurance coverage subject to deductibles, limited coverage terms and lower sub-limits negotiated with our insurers.
United States Mine
In the United States, we have a shaft mine located in Carlsbad, New Mexico. The ore reserves at our Carlsbad mine are made up of langbeinite, a double sulfate of potassium and magnesium. This type of potash reserve occurs in a predominantly rock salt formation known as the Salado Formation. The McNutt Member of this formation consists of eleven units of economic importance, of which we currently mine one. The McNutt Member’s evaporite deposits are interlayered with anhydrite, polyhalite, potassium salts, clay, and minor amounts of sandstone and siltstone.
Continuous underground mining methods are utilized to extract the ore. Drum type mining machines are used to cut the langbeinite ore from the face. Mined ore is then loaded onto conveyors, transported to storage areas, and then hoisted to the surface for further processing at our refinery.
Effective January 1, 2015, we only produce a double sulfate of potash magnesia product, which we market under our brand name K-Mag®, at our Carlsbad facility. Prior to 2015, we also produced MOP at this facility.
At the Carlsbad facility, we mine and refine potash from 77,141 acres of mineral rights. We control these reserves pursuant to either (i) leases from the U.S. government that, in general, continue in effect at our option (subject to readjustment by the U.S. government every 20 years) or (ii) leases from the State of New Mexico that continue as long as we continue to produce from them. These reserves contain an estimated total of 161 million tonnes of potash mineralization (calculated after estimated extraction losses) in one mining bed evaluated at thicknesses ranging from 5.5 feet to in excess of 11 feet. At average refinery rates, these ore reserves are estimated to be sufficient to yield 32 million tonnes of langbeinite concentrates with an average grade of approximately 21% K2O. At projected rates of production, we estimate that Carlsbad’s reserves of langbeinite are sufficient to support operations for approximately 48 years.
Royalties for the U.S. operations amounted to approximately $6.7 million in 2016. These royalties are established by the U.S. Department of the Interior, Bureau of Land Management, in the case of the Carlsbad leases from the U.S. government, and pursuant to provisions set forth in the leases, in the case of the Carlsbad state leases.
Reserves
Our estimates below of our potash reserves and non-reserve potash mineralization are based on exploration drill hole data, seismic data and actual mining results over more than 35 years. Proven reserves are estimated by identifying material in place that is delineated on at least two sides and material in place within a half-mile radius or distance from an existing sampled mine entry or exploration core hole. Probable reserves are estimated by identifying material in place within a one mile radius from an existing sampled mine entry or exploration core hole. Historical extraction ratios from the many years of mining results are then applied to both types of material to estimate the proven and probable reserves. We believe that all reserves and non-reserve potash mineralization reported below are potentially recoverable using existing production shaft and refinery locations.
Our estimated recoverable potash ore reserves and non-reserve potash mineralization as of December 31, 2016 for each of our mines are as follows:
| (tonnes of ore in millions) | Reserves(a)(b) | Potash Mineralization(a)(c) | |||||||
| Facility | Recoverable Tonnes | Average Grade (% K2O) | Potentially Recoverable Tonnes | ||||||
| Canada | |||||||||
| Belle Plaine | 783 | 18.0 | 2,432 | ||||||
| Colonsay | 235 | 26.4 | 476 | ||||||
| Esterhazy | 852 | 24.4 | 672 | ||||||
| sub-totals | 1,870 | 22.0 | 3,580 | ||||||
| United States | |||||||||
| Carlsbad | 161 | 5.0 | — | ||||||
| Totals | 2,031 | 20.6 | 3,580 |
| (a) | There has been no third party review of reserve estimates within the last five years. The reserve estimates have been prepared in accordance with the standards set forth in Industry Guide 7 promulgated by the SEC. |
| (b) | Includes 1.2 billion tonnes of proven reserves and 0.8 billion tonnes of probable reserves. |
| (c) | The non-reserve potash mineralization reported in the table in some cases extends to the boundaries of the mineral rights we own or lease. Such boundaries are up to 16 miles from the closest existing sampled mine entry or exploration core hole. Based on available geologic data, the non-reserve potash mineralization represents potash that we expect to mine in the future, but it may not meet all of the technical requirements for categorization as proven or probable reserves under Industry Guide 7. |
As discussed more fully above, we either own the reserves and mineralization shown above or lease them pursuant to mineral leases that generally remain in effect or are renewable at our option, or are long-term leases. Accordingly, we expect to be able to mine all reported reserves that are leased prior to termination or expiration of the existing leases.
Natural Gas
Natural gas is used at our Belle Plaine solution mine as a fuel to produce steam and to dry potash products. The steam is used to generate electricity and provide thermal energy to the evaporation, crystallization and solution mining processes. The Belle Plaine solution mine typically accounts for approximately 79% of our Potash segment’s total natural gas requirements for potash production. At our shaft mines, natural gas is used as a fuel to heat fresh air supplied to the shaft mines and for drying potash products. Combined natural gas usage for both the solution and shaft mines totaled 17 million MMbtu during 2016. We purchase our natural gas requirements on firm delivery index price-based physical contracts and on short term spot-priced physical contracts. Our Canadian operations purchase all of their physical gas in Saskatchewan using AECO price indices references and transport the gas to our plants via the TransGas pipeline system. The U.S. potash operation in New Mexico purchases physical gas in the southwest respective regional market using the TransWestern El Paso Permian Basin market pricing reference. We use financial derivative contracts to manage the pricing on portions of our natural gas requirements.
International Distribution Segment
Our International Distribution segment markets phosphate-, potash- and nitrogen-based crop nutrients and animal feed ingredients and provides other ancillary services to wholesalers, cooperatives, independent retailers, and farmers in South America and the Asia-Pacific regions. In 2016, our International Distribution segment purchased 2.2 million tonnes of phosphate-based products from our Phosphates segment and 2.0 million tonnes of potash products from our Potash segment and Canpotex. Our international distribution operations also purchase phosphates, potash and nitrogen products from unrelated third parties, which we either use to produce blended crop nutrients (“Blends”) or for resale. Our International Distribution segment provides our Phosphates and Potash segments access to key markets outside of North America.
Our International Distribution segment’s production facilities include blending plants and an SSP plant that produces crop nutrients by mixing sulfuric acid with phosphate rock. A blending plant combines several crop nutrient products to make a mixture tailored to specific crop requirements. We lease various warehouses depending on sales and production levels.
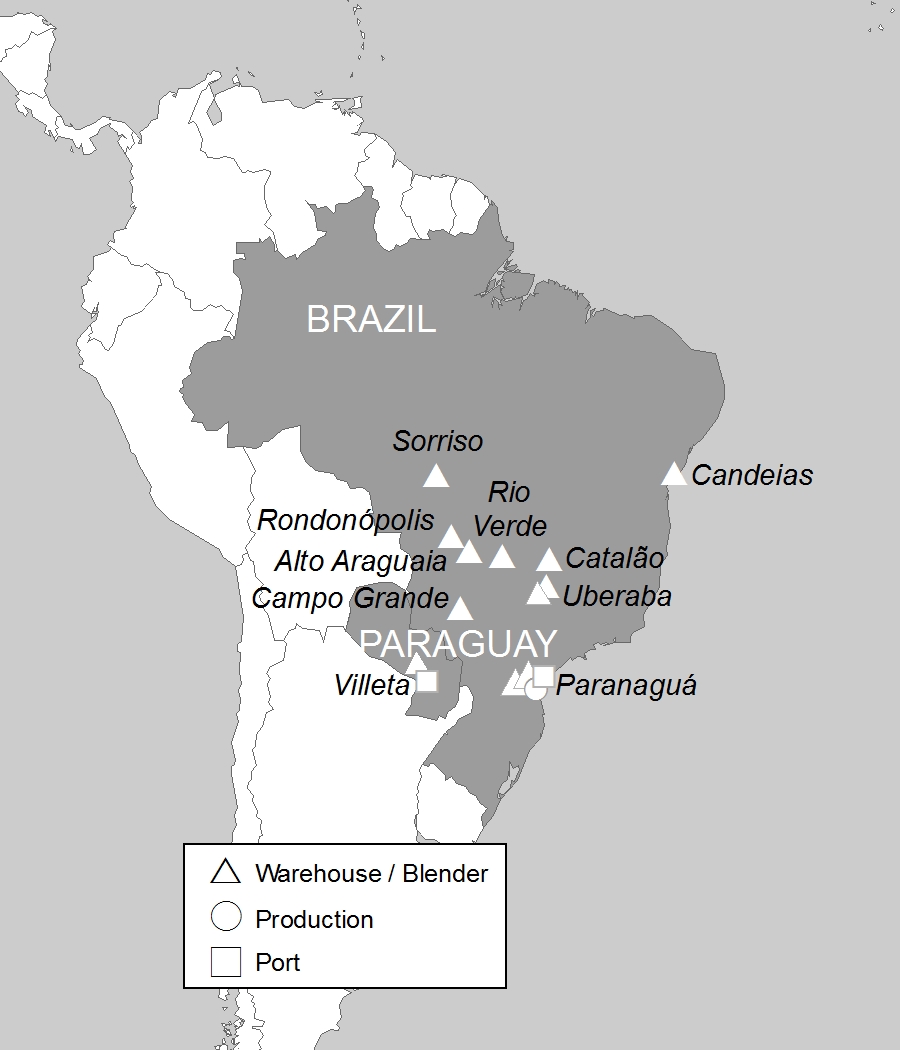
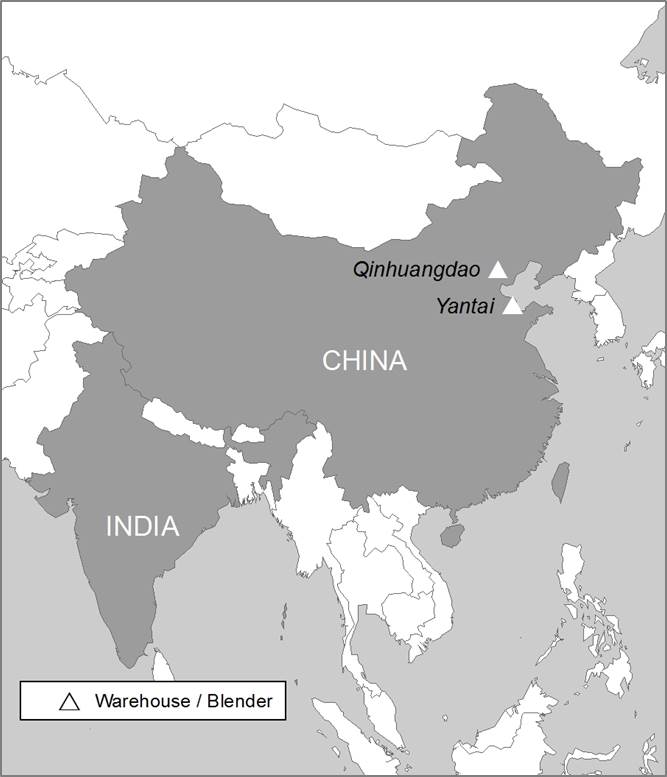
The following maps show the locations of our primary International Distribution segment operations in South America and Asia:
International Distribution - South America Operations
We are one of the largest producers and distributors of blended crop nutrients for agricultural use in Brazil. We own and operate twelve blending plants in Brazil and one blending plant and port in Paraguay. In addition, we lease several other warehouses and blending units depending on sales and production levels. We also have a 62% ownership interest in Fospar, S.A. (“Fospar”). Fospar owns and operates an SSP granulation plant and a deep-water crop nutrition port and throughput warehouse terminal facility in Paranagua, Brazil. Together these plants provide the capability to annually distribute approximately 6.0 million tonnes of crop nutrients in Brazil and Paraguay. The port facility at Paranagua handles approximately 2.6 million tonnes of imported crop nutrients. In 2016 we sold approximately 5.7 million tonnes of crop nutrient products in South America.
In 2015 we completed the integration of our December 2014 purchase of ADM's fertilizer distribution business in Brazil and Paraguay. In connection with the acquisition, we also negotiated the terms of five-year fertilizer supply agreements, whereby we supply ADM's fertilizer needs in Brazil and Paraguay.
On December 19, 2016, we entered into an agreement to acquire Vale S.A.'s global phosphate and potash operations conducted through Vale Fertilizantes S.A. for a purchase price valued at $2.5 billion, consisting of $1.25 billion in cash and 42,286,874 shares of Mosaic common stock. Upon closing the acquisition, Mosaic expects to become the leading fertilizer production and distribution company in Brazil. This transaction is expected to close in late 2017 and remains subject to the satisfaction of closing conditions. Additional information about the proposed transaction is provided in Note 24 to our Consolidated Financial Statements.
International Distribution - Asia-Pacific Operations
In China, we own two 300,000-tonne per year capacity blending plants. In 2016, we sold our 35% interest in a joint venture of a DAP production plant. In 2016, we sold approximately 230,000 tonnes of blends and distributed another 310,000 tonnes of phosphate and potash crop nutrients in China.
In India, we have distribution facilities to import and sell crop nutrients. In 2016, we distributed approximately 590,000 tonnes of phosphate and potash crop nutrient products in India. We also serve as a marketing agent for our Phosphates segment.
SALES AND DISTRIBUTION ACTIVITIES
United States and Canada
We have a United States and Canada sales and marketing team that serves our business segments. We sell to wholesale distributors, retail chains, cooperatives, independent retailers and national accounts.
Customer service and the ability to effectively minimize the overall supply chain costs are key competitive factors in the crop nutrient and animal feed ingredients businesses. In addition to our production facilities, to service the needs of our customers, we own, lease or have contractual throughput or other arrangements at strategically located distribution warehouses along or near the Mississippi and Ohio Rivers as well as in other key agricultural regions of the United States and Canada. From these facilities, we distribute Mosaic-produced phosphate and potash products for customers who in turn resell the product into the distribution channel or directly to farmers in the United States and Canada.
We own port facilities in Tampa, Florida and Houston, Texas, which have deep water berth capabilities providing access to the Gulf of Mexico. We will discontinue operations at the Houston, Texas facility in 2017 and then expect to sell the facility. We also own warehouse distribution facilities in Savage, Minnesota; Pekin, Illinois; and Henderson, Kentucky.
In addition to the geographically situated facilities that we own, our U.S. distribution operations also include leased distribution space or contractual throughput agreements in other key geographical areas such as California, Florida, Illinois, Indiana, Iowa, Kentucky, Louisiana, Minnesota, Missouri, Nebraska, North Dakota, Ohio, Oklahoma, Texas and Wisconsin.
Our Canadian customers include independent dealers and national accounts. We also lease and own warehouse facilities in Saskatchewan, Ontario, Quebec and Manitoba in Canada.
International
Outside of the United States and Canada, we market our Phosphates segment's products through our International Distribution segment as well as a salesforce focused on geographies outside of North America. The countries that account for the largest amount of our phosphates sales outside the United States, by volume, are Brazil, Canada, India, Australia and Mexico.
Our sales outside of the United States and Canada of Saskatchewan potash products are made through Canpotex. Canpotex sales are allocated among its members based on peaking capacity. Effective January 1, 2016, our share of Canpotex sales decreased to 38.1% from 40.6%, as Canpotex's other members demonstrated a change in capacity.
Our potash exports from Carlsbad are sold through our own sales force. We also market our Potash segment’s products through our International Distribution segment, which acquires potash primarily through Canpotex. The countries that account for the largest amount of international potash sales, by volume, are Brazil, China, Indonesia, India and Malaysia.
To service the needs of our customers, our International Distribution segment includes a network of strategically located sales offices, crop nutrient blending and bagging facilities, port terminals and warehouse distribution facilities that we own and operate in key geographic areas throughout several countries. The blending and bagging facilities primarily produce Blends from phosphate, potash and nitrogen. The average product mix in our Blends (by volume) contains approximately 50% phosphate, 35% potash and 15% nitrogen, although this mix differs based on seasonal and other factors. Our International Distribution segment's operations serve primarily as a sales outlet for our North American Phosphates production, both for resale and as an input for Blends. Our Potash segment also has historically furnished the majority of the raw materials needs for the production of Blends, primarily via Canpotex, and is expected to continue to do so in the future.
Other Products
With a strong brand position in a multi-billion dollar animal feed ingredients global market, our Phosphates segment supplies animal feed ingredients for poultry and livestock to customers in North America, Latin America and Asia. Our potash sales to non-agricultural users are primarily to large industrial accounts and the animal feed industry. Additionally, we sell potash for de-icing and as a water softener regenerant, as well as fluorosilicic acid for water fluoridation.
COMPETITION
Because crop nutrients are global commodities available from numerous sources, crop nutrition companies compete primarily on the basis of delivered price. Other competitive factors include product quality, cost and availability of raw materials, customer service, plant efficiency and availability of product. As a result, markets for our products are highly competitive. We compete with a broad range of domestic and international producers, including farmer cooperatives, subsidiaries of larger companies, and independent crop nutrient companies. Foreign competitors often have access to cheaper raw materials, are required to comply with less stringent regulatory requirements or are owned or subsidized by governments and, as a result, may have cost advantages over North American companies. We believe that our extensive North American and international production and distribution system provides us with a competitive advantage by allowing us to achieve economies of scale, transportation and storage efficiencies, and obtain market intelligence. Also, we believe our premium products provide us a competitive advantage with customers in North and South America.
Unlike many of our competitors, we have our own distribution system to sell phosphate- and potash-based crop nutrients and animal feed ingredients, whether produced by us or by other third parties, around the globe. In North America, we have one of the largest and most strategically located distribution systems for crop nutrients, including warehouse facilities in key agricultural regions. We also have an extensive network of distribution facilities internationally, including in the key growth regions of South America and Asia, with port terminals, warehouses, and blending plants in Brazil, Paraguay, China, and India. Our global presence allows us to efficiently serve customers in approximately 40 countries.
Phosphates Segment
Our Phosphates segment operates in a highly competitive global market. Among the competitors in the global phosphate industry are domestic and foreign companies, as well as foreign government-supported producers in Asia and North Africa. Phosphate producers compete primarily based on price, as well as product quality, service and innovation. Major integrated producers of feed phosphates are located in the United States, Europe and China. Many smaller producers are located in emerging markets around the world. Many of these smaller producers are not miners of phosphate rock or manufacturers of phosphoric acid and are required to purchase this material on the open market.
We believe that we are a low-cost integrated producer of phosphate-based crop nutrients, due in part to our scale, vertical integration and strategic network of production and distribution facilities. As the world’s largest producer of concentrated phosphates, as well as the second largest miner of phosphate rock in the world and the largest in the United States, we maintain an advantage over some competitors as the scale of operations effectively reduces production costs per unit. We are also vertically integrated to captively supply one of our key inputs, phosphate rock, to our phosphate production facilities. We believe that our position as an integrated producer of phosphate rock provides us with a significant cost advantage over competitors that are non-integrated phosphate producers. Our investment in the Miski Mayo Mine and related commercial offtake supply agreement to purchase a share of the phosphate rock allows us to supplement our overall phosphate rock needs. In addition, we expect that MWSPC will enable us to not only further diversify our sources of phosphates but also improve our access to key agricultural countries in Asia and the Middle East.
We produce ammonia at our Faustina, Louisiana concentrates plant in quantities sufficient to meet approximately one quarter of our total ammonia needs. With no captive ammonia production in Florida, we are subject to significant volatility in our purchase price of ammonia from world markets. The CF Ammonia Supply Agreement is expected to provide us with a long-term supply of a substantial volume of ammonia at prices based on the price of natural gas, and is intended to lessen this volatility.
With our dedicated sulfur transportation barges and tugs, and our 50% ownership interest in Gulf Sulphur Services, we are also well-positioned to source an adequate, flexible and cost-effective supply of sulfur, our third key input. We believe that our investments in sulfur assets continue to afford us a competitive advantage compared to other producers in cost and access to sulfur.
With facilities in both central Florida and Louisiana, we are logistically well positioned to fulfill our needs at very competitive prices. Those multiple production points also afford us the flexibility to optimally balance supply and demand.
Potash Segment
Potash is a commodity available from several geographical regions around the world and, consequently, the market is highly competitive. Through our participation in Canpotex, we compete outside of North America against various independent and
state-owned potash producers. Canpotex has substantial expertise and logistical resources for the international distribution of potash including strategically located export assets in Portland, Oregon, St. John, New Brunswick, and Vancouver, British Columbia. Our principal methods of competition with respect to the sale of potash include product pricing, and offering consistent, high-quality products and superior service. We believe that our potash cost structure is competitive in the industry and should improve as we continue to complete our potash expansion projects.
International Distribution Segment
Our International Distribution segment generally operates in highly competitive business environments in each of its markets, competing with local businesses and with products that are available from many other sources. We believe that our International Distribution segment's vertical integration with our own production businesses, as well as our focus on product innovation and customer solutions, position us with an advantage over many of our competitors. We have a strong brand in the countries in which we have international distribution activities. In addition to having access to our own production, our international distribution activities have the capability to supply a wide variety of crop nutrients to our dealer/farmer customer base. Our strategic positions in Brazil, Paraguay, China and India allow us to capitalize on the nutrient demand in these large and growing international regions.
FACTORS AFFECTING DEMAND
Our results of operations historically have reflected the effects of several external factors which are beyond our control and have in the past produced significant downward and upward swings in operating results. Revenues are highly dependent upon conditions in the agriculture industry and can be affected by, among other factors: crop conditions; changes in agricultural production practices; worldwide economic conditions, including the increasing world population, household incomes, and demand for more protein-rich food, particularly in developing regions such as China, India, and Latin America; changing demand for biofuels; variability in commodity pricing; governmental policies; the level of inventories in the crop nutrient distribution channels; customer expectations about farmer economics, future crop nutrient prices and availability, and transportation costs, among other matters; market trends in raw material costs; market prices for crop nutrients; and weather. Furthermore, our crop nutrients business is seasonal to the extent farmers and agricultural enterprises in the markets in which we compete purchase more crop nutrient products during the spring and fall. The international scope of our business, spanning the northern and southern hemispheres, reduces to some extent the seasonal impact on our business. The degree of seasonality of our business can change significantly from year to year due to conditions in the agricultural industry and other factors. The seasonal nature of our businesses requires significant working capital for inventory in advance of the planting seasons.
We sell products throughout the world. Unfavorable changes in trade protection laws, policies and measures, government policies and other regulatory requirements affecting trade; unexpected changes in tax and trade treaties; strengthening or weakening of foreign economies as well as political relations with the United States may cause sales trends to customers in one or more foreign countries to differ from sales trends in the United States.
Our international operations are subject to risks from changes in foreign currencies, or government policy, which can affect local farmer economics.
OTHER MATTERS
Employees
We had approximately 8,700 employees as of December 31, 2016, consisting of approximately 3,600 salaried and 5,100 hourly employees.
Labor Relations
As of December 31, 2016:
| • | We had ten collective bargaining agreements with unions covering 81% of our hourly employees in the U.S. and Canada. Of these employees, approximately 30% are covered under collective bargaining agreements scheduled to expire in 2017. |
| • | Agreements with twelve unions covered all employees in Brazil, representing 83% of our international employees. More than one agreement may govern our relations with each of these unions. In general, the agreements are renewable on an annual basis. |
Failure to renew any of our union agreements could result in a strike or labor stoppage that could have a material adverse effect on our operations. However, we have not experienced significant work stoppage in many years and historically have had good labor relations.
Financial Information about our Business Segments and Operations by Geographic Areas
We have included financial information about our business segments, our operations by geographic area and our revenues by class of similar products in Note 25 of our Consolidated Financial Statements.
Information Available on our Website
Our annual reports on Form 10-K, quarterly reports on Form 10-Q, current reports on Form 8-K, and amendments thereto, filed with the SEC pursuant to Section 13(a) of the Securities Exchange Act of 1934, as amended, and the rules and regulations thereunder are made available free of charge on our website, (www.mosaicco.com), as soon as reasonably practicable after we electronically file such material with, or furnish it to, the SEC. The information contained on our website is not being incorporated in this report.
EXECUTIVE OFFICERS
Information regarding our executive officers as of February 15, 2017 is set forth below:
| Name | Age | Position | |||
| Bruce M. Bodine Jr. | 45 | Senior Vice President—Potash Operations | |||
| Mark J. Isaacson | 54 | Senior Vice President, General Counsel and Corporate Secretary | |||
| Richard L. Mack | 49 | Executive Vice President and Chief Financial Officer | |||
| Richard N. McLellan | 60 | Senior Vice President—Commercial | |||
| James “Joc” C. O’Rourke | 56 | Chief Executive Officer, President and Director | |||
| Walter F. Precourt III | 52 | Senior Vice President—Phosphates Operations | |||
| Corrine D. Ricard | 53 | Senior Vice President—Human Resources |
Bruce M. Bodine Jr. Mr. Bodine has been Senior Vice President - Potash since June 2016. Prior to that, he served as our Vice President - Potash (since April 2016), prior to that as our Vice President - Supply Chain (since August 2015), prior to that as our Vice President - Operations Business Development (since October 2014), prior to that as Vice President - Operations for our Esterhazy and Colonsay potash production facilities (since July 2013), prior to that as the General Manager, Esterhazy (since September 2012) and prior to that as the General Manager, Four Corners (since March 2010). Before that, Mr. Bodine held various plant and mine development management positions in the Phosphates segment beginning with Mosaic's formation in 2004, and prior to that he served in various engineering leadership positions with our predecessor company, IMC Global Inc.
Mark J. Isaacson. Mr. Isaacson was elected Senior Vice President, General Counsel and Corporate Secretary in August 2015 and previously served as our Vice President, General Counsel and Corporate Secretary since August 2014. Mr. Isaacson joined Mosaic upon its formation in 2004 as its Chief Phosphates Counsel before being promoted to Vice President, Associate General Counsel and Chief Compliance Officer in 2011 and to Vice President, Acting General Counsel and Corporate Secretary in June 2014. Prior to joining Mosaic, Mr. Isaacson worked for 15 years at Cargill, Inc., where he served as Senior Attorney for a number of its business units.
Richard L. Mack. Mr. Mack has been our Executive Vice President and Chief Financial Officer since June 2014. Prior to that, he served as Executive Vice President, General Counsel and Corporate Secretary since January 1, 2009 and before that as Senior Vice President, General Counsel and Corporate Secretary since our formation in 2004. Mr. Mack was a founding executive responsible for our formation in the 2004 business combination between IMC Global Inc. and Cargill Crop Nutrition and was a core member of the executive team responsible for our subsequent successful spin-off from Cargill.
Since that time he has played key roles in negotiating and executing strategic transactions; led our successful resolution of a number critical legal disputes; led the development of our land use strategy, including the development of Streamsong Resort®; and led the development and implementation of our phosphate rock mine permitting strategy in Florida. Prior to our formation, Mr. Mack was a Senior Attorney in Cargill’s worldwide law department and a co-founder of Cargill’s venture capital business unit. Mr. Mack is a director of Titan Machinery, Inc. and a member of the MWSPC board, and serves on the Boards of Trustees of Hamline University and Mitchell | Hamline School of Law.
Richard N. McLellan. Mr. McLellan was appointed Senior Vice President - Brazil in February 2017. Prior to that time he served as Senior Vice President—Commercial since April 2007, and before that as our Vice President—North American Sales since December 2005 and as Country Manager for our (and, prior to the Combination, Cargill’s) Brazilian crop nutrient business since November, 2002. Mr. McLellan joined Cargill in 1989 and held various roles in its Canadian and U.S. operations, including grain, retail and wholesale crop nutrient distribution.
James “Joc” C. O’Rourke. Mr. O’Rourke was promoted to President and Chief Executive Officer effective in August 2015. Previously, he served as Executive Vice President—Operations and Chief Operating Officer since August 2012 and before that as Executive Vice President—Operations since January 2009. Prior to joining Mosaic, Mr. O’Rourke was President, Australia Pacific for Barrick Gold Corporation, the largest gold producer in Australia, since May 2006, where he was responsible for the Australia Pacific Business Unit consisting of ten gold and copper mines in Australia and Papua New Guinea. Before that, Mr. O’Rourke was Executive General Manager in Australia and Managing Director of Placer Dome Asia Pacific Ltd., the second largest gold producer in Australia, from December 2004, where he was responsible for the Australia Business Unit consisting of five gold and copper mines; and General Manager of Western Australia Operations for Iluka Resources Ltd., the world’s largest zircon and second largest titanium producer, from September 2003, where he was responsible for six mining and concentrating operations and two mineral separation/synthetic rutile refineries. Mr. O’Rourke had previously held various management, engineering and other roles in the mining industry in Canada and Australia since 1984. Mr. O'Rourke has served on our Board of Directors since May 2015 and is also a director of The Toro Company.
Walter F. Precourt III. Mr. Precourt was named Senior Vice President—Phosphates effective in June 2016 and in this role he also provides executive oversight for the corporate procurement and Environmental, Health and Safety organizations. He previously served as our Senior Vice President—Potash Operations since May 2012, and before that he led our Environment, Health and Safety organization since joining Mosaic in 2009. Prior to joining Mosaic, Mr. Precourt was employed by cement and mineral component producer Holcim (U.S.) where he initially led its safety transformation and later became Vice President of Environment and Government Affairs. Mr. Precourt started his career at The Dow Chemical Company where he served in a variety of roles in Operations, Technology, Capital Project Management, and Environmental, Health and Safety. Mr. Precourt serves as a director and is the past Chairman of the Board of the Saskatchewan Potash Producers Association and is a director of Fertilizer Canada.
Corrine D. Ricard. Ms. Ricard was appointed Senior Vice President - Commercial in February 2017. Prior to that time she served as our Senior Vice President—Human Resources since April 2012, and before that she held a number of other leadership positions at Mosaic, including Vice President—International Distribution, Vice President—Business Development and Vice President—Supply Chain. Prior to Mosaic’s formation, Ms. Ricard worked for Cargill in various roles including risk management, supply chain and commodity trading.
Our executive officers are generally elected to serve until their respective successors are elected and qualified or until their earlier death, resignation or removal. No “family relationships,” as that term is defined in Item 401(d) of Regulation S-K, exist among any of the listed officers.
Previous: Cover and table of contents · Next: Item 1A. Risk Factors.