 filings.tools
Item 1. Business
94K characters. Original on sec.gov · Markdown
Item 1. Business
Overview
Marathon Petroleum Corporation (“MPC”) has 130 years of experience in the energy business with roots tracing back to the formation of the Ohio Oil Company in 1887. We are one of the largest independent petroleum product refining, marketing, retail and transportation businesses in the United States and the largest east of the Mississippi. We are one of the largest natural gas processors in the United States and the largest processor and fractionator in the Marcellus and Utica shale regions.
Our operations consist of three reportable operating segments: Refining & Marketing; Speedway; and Midstream. Each of these segments is organized and managed based upon the nature of the products and services it offers.
| • | Refining & Marketing – refines crude oil and other feedstocks at our six refineries in the Gulf Coast and Midwest regions of the United States, purchases refined products and ethanol for resale and distributes refined products through various means, including pipeline and marine transportation, terminals and storage services provided by our Midstream segment. We sell refined products to wholesale marketing customers domestically and internationally, buyers on the spot market, our Speedway® business segment and to independent entrepreneurs who operate Marathon® retail outlets. |
| • | Speedway – sells transportation fuels and convenience products in the retail market in the Midwest, East Coast and Southeast regions of the United States. |
| • | Midstream – gathers, processes and transports natural gas; gathers, transports, fractionates, stores and markets NGLs; and transports and stores crude oil and refined products principally for the Refining & Marketing segment via pipelines, terminals, towboats and barges. The Midstream segment primarily reflects the results of MPLX, our sponsored master limited partnership. |
See Item 8. Financial Statements and Supplementary Data – Note 10 for operating segment and geographic financial information, which is incorporated herein by reference.
Corporate History and Structure
MPC was incorporated in Delaware on November 9, 2009 in connection with an internal restructuring of Marathon Oil Corporation (“Marathon Oil”). On May 25, 2011, the Marathon Oil board of directors approved the spinoff of its Refining, Marketing & Transportation Business (“RM&T Business”) into an independent, publicly traded company, MPC, through the distribution of MPC common stock to the stockholders of Marathon Oil common stock on June 30, 2011 (the “Spinoff”). Following the Spinoff, Marathon Oil retained no ownership interest in MPC, and each company has separate public ownership, boards of directors and management. All subsidiaries and equity method investments not contributed by Marathon Oil to MPC remained with Marathon Oil and, together with Marathon Oil, are referred to as the “Marathon Oil Companies.” On July 1, 2011, our common stock began trading “regular-way” on the NYSE under the ticker symbol “MPC.”
MPLX is a diversified, growth-oriented publicly traded master limited partnership (“MLP”) formed by us in 2012 to own, operate, develop and acquire midstream energy infrastructure assets. MPLX is engaged in the gathering, processing and transportation of natural gas; the gathering, transportation, fractionation, storage and marketing of NGLs; and the gathering, transportation and storage of crude oil and refined petroleum products. On December 4, 2015, we completed the MarkWest Merger, whereby MarkWest became a wholly-owned subsidiary of MPLX.
As of December 31, 2017, we owned a 30.4 percent interest in MPLX, including a two percent general partner interest. MPLX is a VIE because the limited partners of MPLX do not have substantive kick-out or substantive participating rights over the general partner. We are the primary beneficiary of MPLX because in addition to significant economic interest, we also have the power, through our 100 percent ownership of the general partner, to control the decisions that most significantly impact MPLX. We therefore consolidate MPLX and record a noncontrolling interest for the interest owned by the public. The creditors of MPLX do not have recourse to MPC’s general credit through guarantees or other financial arrangements. The assets of MPLX are the property of MPLX and cannot be used to satisfy the obligations of MPC.
Recent Developments
Strategic Actions to Enhance Shareholder Value
On January 3, 2017, we announced plans to significantly accelerate the dropdown of assets with an estimated $1.4 billion of MLP-eligible annual EBITDA to MPLX and to exchange our economic interests in the general partner of MPLX, including IDRs, for newly issued MPLX common units. In 2017, in connection with these plans, we contributed assets to MPLX with projected annual EBITDA of approximately $400 million for $1.93 billion of cash and approximately 31 million MPLX
common units and general partner units. On February 1, 2018, we completed the dropdown of the remaining identified assets, which included our refining logistics assets and fuels distribution services with projected annual EBITDA of approximately $1 billion, in exchange for $4.1 billion of cash and 114 million MPLX common units and general partner units.
The cash consideration for these dropdowns in 2017 and 2018 was financed by MPLX with $6.0 billion of debt. See “Other Highlights” section for additional information on MPLX debt financing in 2017 and 2018. The equity financing was funded through new MPLX common units and general partner units issued to us. Immediately following the closing of the February 1, 2018 dropdown, our IDRs were cancelled and our economic general partner interest in MPLX was converted into a non-economic general partner interest, all in exchange for 275 million newly issued MPLX common units, which resulted in us owning approximately 64 percent of the issued and outstanding MPLX common units as of February 1, 2018. These actions were designed to provide a clear valuation of our midstream platform and to provide an ongoing return of capital to our shareholders in a manner consistent with maintaining an investment-grade credit profile.
See Item 7. Management’s Discussion and Analysis of Financial Condition and Results of Operations for additional information on our strategic actions to enhance shareholder value. See Item 8. Financial Statements and Supplementary Data – Note 4 for more information on the 2017 dropdowns to MPLX and Note 26 for more information on the 2018 dropdown to MPLX.
Acquisitions and Investments
Our acquisition and investment activity in 2017 was primarily focused in our Midstream segment as follows:
| • | On March 1, 2017, MPLX acquired the Ozark pipeline from Enbridge Pipelines (Ozark) LLC for approximately $219 million. |
| • | On February 15, 2017, MPLX acquired a partial, indirect equity interest in the Dakota Access Pipeline (“DAPL”) and Energy Transfer Crude Oil Company Pipeline (“ETCOP”) projects, collectively referred to as the Bakken Pipeline system, through a joint venture, MarEn Bakken Company LLC (“MarEn Bakken”), with Enbridge Energy Partners L.P. (“Enbridge Energy Partners”). MPLX holds, through a subsidiary, a 25 percent interest in MarEn Bakken, which equates to an approximate 9.2 percent indirect equity interest in the Bakken Pipeline system. MPLX contributed $500 million of the $2 billion purchase price paid by the joint venture. |
| • | Effective January 1, 2017, MPLX and Antero Midstream formed a joint venture, Sherwood Midstream LLC (“Sherwood Midstream”), to support the development of Antero Resources Corporation’s Marcellus Shale acreage in West Virginia. MarkWest has a 50 percent ownership interest in Sherwood Midstream. In connection with this transaction, MarkWest contributed certain gas processing plants that were under construction at the Sherwood Complex with a fair value of approximately $134 million, cash of approximately $20 million and sold Class A Interests in MarkWest Ohio Fractionation to Sherwood Midstream for $126 million in cash. Sherwood Midstream Holdings LLC (“Sherwood Midstream Holdings”), a joint venture with MarkWest and Sherwood Midstream, was also formed to own, operate and maintain certain assets owned by Sherwood Midstream and MarkWest. MarkWest contributed certain real property, equipment and facilities with a fair value of approximately $209 million to Sherwood Midstream Holdings in exchange for a 79 percent initial ownership interest. |
See Item 8. Financial Statements and Supplementary Data – Note 5 for additional information on these acquisitions and investments and Note 6 for additional information related to the investments in Sherwood Midstream, Ohio Fractionation and Sherwood Midstream Holdings.
Other Highlights
| • | On February 8, 2018, MPLX issued $5.5 billion in aggregate principal amount of senior notes in a public offering, consisting of $500 million aggregate principal amount of 3.375 percent unsecured senior notes due March 2023, $1.25 billion aggregate principal amount of 4.000 percent unsecured senior notes due March 2028, $1.75 billion aggregate principal amount of 4.500 percent unsecured senior notes due April 2038, $1.5 billion aggregate principal amount of 4.700 percent unsecured senior notes due April 2048, and $500 million aggregate principal amount of 4.900 percent unsecured senior notes due April 2058. On February 8, 2018, $4.1 billion of the net proceeds were used to repay the 364-day term-loan facility, which was drawn on February 1, 2018 to fund the cash portion of the consideration MPLX paid MPC for the dropdown of assets on February 1, 2018. The remaining proceeds will be used to repay outstanding borrowings under MPLX’s revolving credit facility and intercompany loan agreement with us and for general partnership purposes. |
| • | On February 10, 2017, MPLX completed a public offering of $1.25 billion aggregate principal amount of 4.125% unsecured senior notes due March 2027 and $1.0 billion aggregate principal amount of 5.200% unsecured senior notes due March 2047. MPLX used the net proceeds from this offering to fund the $1.5 billion cash portion of the consideration MPLX paid MPC for the dropdown of assets on March 1, 2017, as well as for general partnership purposes. |
| • | Primarily during the first six months of 2017, MPLX issued an aggregate of 14 million MPLX common units under the Second Amended and Restated Distribution Agreement (the “Distribution Agreement”) providing for at-the-market issuances of common units, in amounts, at prices and on terms determined by market conditions and other factors at the time of the offerings (such at-the-market program, referred to as the “ATM Program”), generating net proceeds of approximately $473 million. |
See Item 8. Financial Statements and Supplementary Data – Note 4 for additional information on MPLX.
Our Competitive Strengths
Extensive Integrated Platform of Midstream, Retail and Refining Assets
We believe the integration of our midstream, retail and refining assets distinguishes us from our competitors. Our midstream, retail and refining assets have significant scale.We currently own, lease or have ownership interests in approximately 10,800 miles of crude oil and products pipelines. Additionally, we have more than 6,000 miles of natural gas gathering and NGL pipelines. We also own or have ownerships interests in one of the largest private domestic fleets of inland petroleum product barges and one of the largest terminal operations in the United States, as well as trucking and rail assets. We operate this transportation and distribution system in coordination with our refining and marketing network, which can process up to 1.9 mmbpcd of crude oil, enabling us to optimize raw material supplies and refined product distribution, and deliver important economies of scale across our platform. Our Speedway segment, discussed further below, is one of our largest distribution channels and also our most ratable.
We believe our integrated platform of assets gives us extensive flexibility and optionality to meet the growth needs of the market and the ability to respond promptly to dynamic market conditions, including weather-related and marketplace disruptions.
Competitively Positioned Marketing Operations Provide Assured Product Sales
We are one of the largest wholesale suppliers of gasoline and distillates to resellers within our market area. We have two strong retail brands: Speedway® and Marathon®. We believe Speedway LLC, a wholly-owned subsidiary, operates the second largest chain of company-owned and operated retail gasoline and convenience stores in the United States, with approximately 2,740 convenience stores in 21 states throughout the Midwest, East Coast and Southeast regions of the United States. In addition, our highly successful Speedy Rewards® customer loyalty program, which averaged approximately 6 million active members in 2017, provides us with a unique competitive advantage and opportunity to increase our customer base at existing and new Speedway locations. The Marathon brand is an established motor fuel brand primarily in the Midwest and Southeast regions of the United States, comprised of approximately 5,600 retail outlets operated by independent entrepreneurs across 20 states as of December 31, 2017. The Marathon brand and Speedway have been channels for sales volume growth in existing and contiguous markets.
We consider assured sales as those sales we make to Marathon brand customers, our Speedway operations and to our wholesale customers with whom we have required minimum volume sales contracts. Our assured sales currently account for approximately 70% of our gasoline production. We believe having assured sales brings ratability to our distribution systems, provides a solid base to enhance our overall supply reliability and allows us to efficiently and effectively optimize our operations across our refineries and our transportation and distribution system.
High Quality Network of Strategically Located Assets
We believe we are the largest crude oil refiner in the Midwest and the second largest in the United States based on crude oil refining capacity. We own a six-plant refinery network, with approximately 1.9 mmbpcd of crude oil throughput capacity. Our refineries process a wide range of crude oils, feedstocks and condensate, including heavy and sour crude oils, which can generally be purchased at a discount to sweet crude oil, and produce transportation fuels such as gasoline and distillates, specialty chemicals and other refined products. While we have historically processed significant quantities of heavy and sour crude oils, our refineries have the ability to process as much as 65 percent to 70 percent light sweet or sour crude oils.
The geographic locations of our refineries provide us with strategic advantages. Located in PADD II and PADD III, which consist of states in the Midwest and the Gulf Coast regions of the United States, our refineries have the ability to procure crude oil from a variety of supply sources, including domestic, Canadian and other foreign sources, which provides us with flexibility to optimize crude supply costs. For example, geographic proximity to various United States shale oil regions and Canadian crude oil supply sources allows our refineries access to price-advantaged crude oils and lower transportation costs than certain of our refining competitors. Our refinery locations and midstream distribution system also allow us to access refined product export markets and to serve a broad range of key end-user markets across the United States quickly and cost-effectively.
MPLX’s logistics assets are similarly located in the Midwest and Gulf Coast regions of the United States. These regions collectively comprised approximately 75 percent of total United States crude distillation capacity and can serve markets representing approximately 81 percent of total United States finished products demand for the year ended December 31, 2017, according to the EIA. This significantly complements our Refining & Marketing segment and creates strategic opportunities for MPC. MPLX is also the largest natural gas processor and fractionator in the Marcellus and Utica shale regions which provides it with strategic competitive advantages in capturing and contracting for gathering, processing and fractionation of new supplies of natural gas as production in these regions continues to increase. MPLX also has a growing presence in the southwestern portion of the United States with an existing strong competitive position with ample opportunities for long-term continued organic growth and close proximity to other expansion opportunities. As of December 31, 2017, MPLX’s gathering and processing operations include approximately 5.9 bcf/d of gathering capacity, 8.0 bcf/d of natural gas processing capacity and 610 mbpd of fractionation capacity. Our integrated midstream energy asset network links producers of natural gas, NGLs and crude oil from some of the largest supply basins in the United States to domestic and international markets.
Our Speedway segment, which operates in the Midwest, East Coast and Southeast, complements our refining and midstream assets providing a significant and ratable outlet for our refinery production. Speedway’s expansion from nine to 21 states since 2013 has also enabled us to further leverage our integrated refining and transportation system. Speedway is a top performer in the convenience store industry with the highest EBITDA per store per month of its public peers and leading positions with respect to other comparisons based on light products volume, merchandise sales and total margin on a per store per month basis.
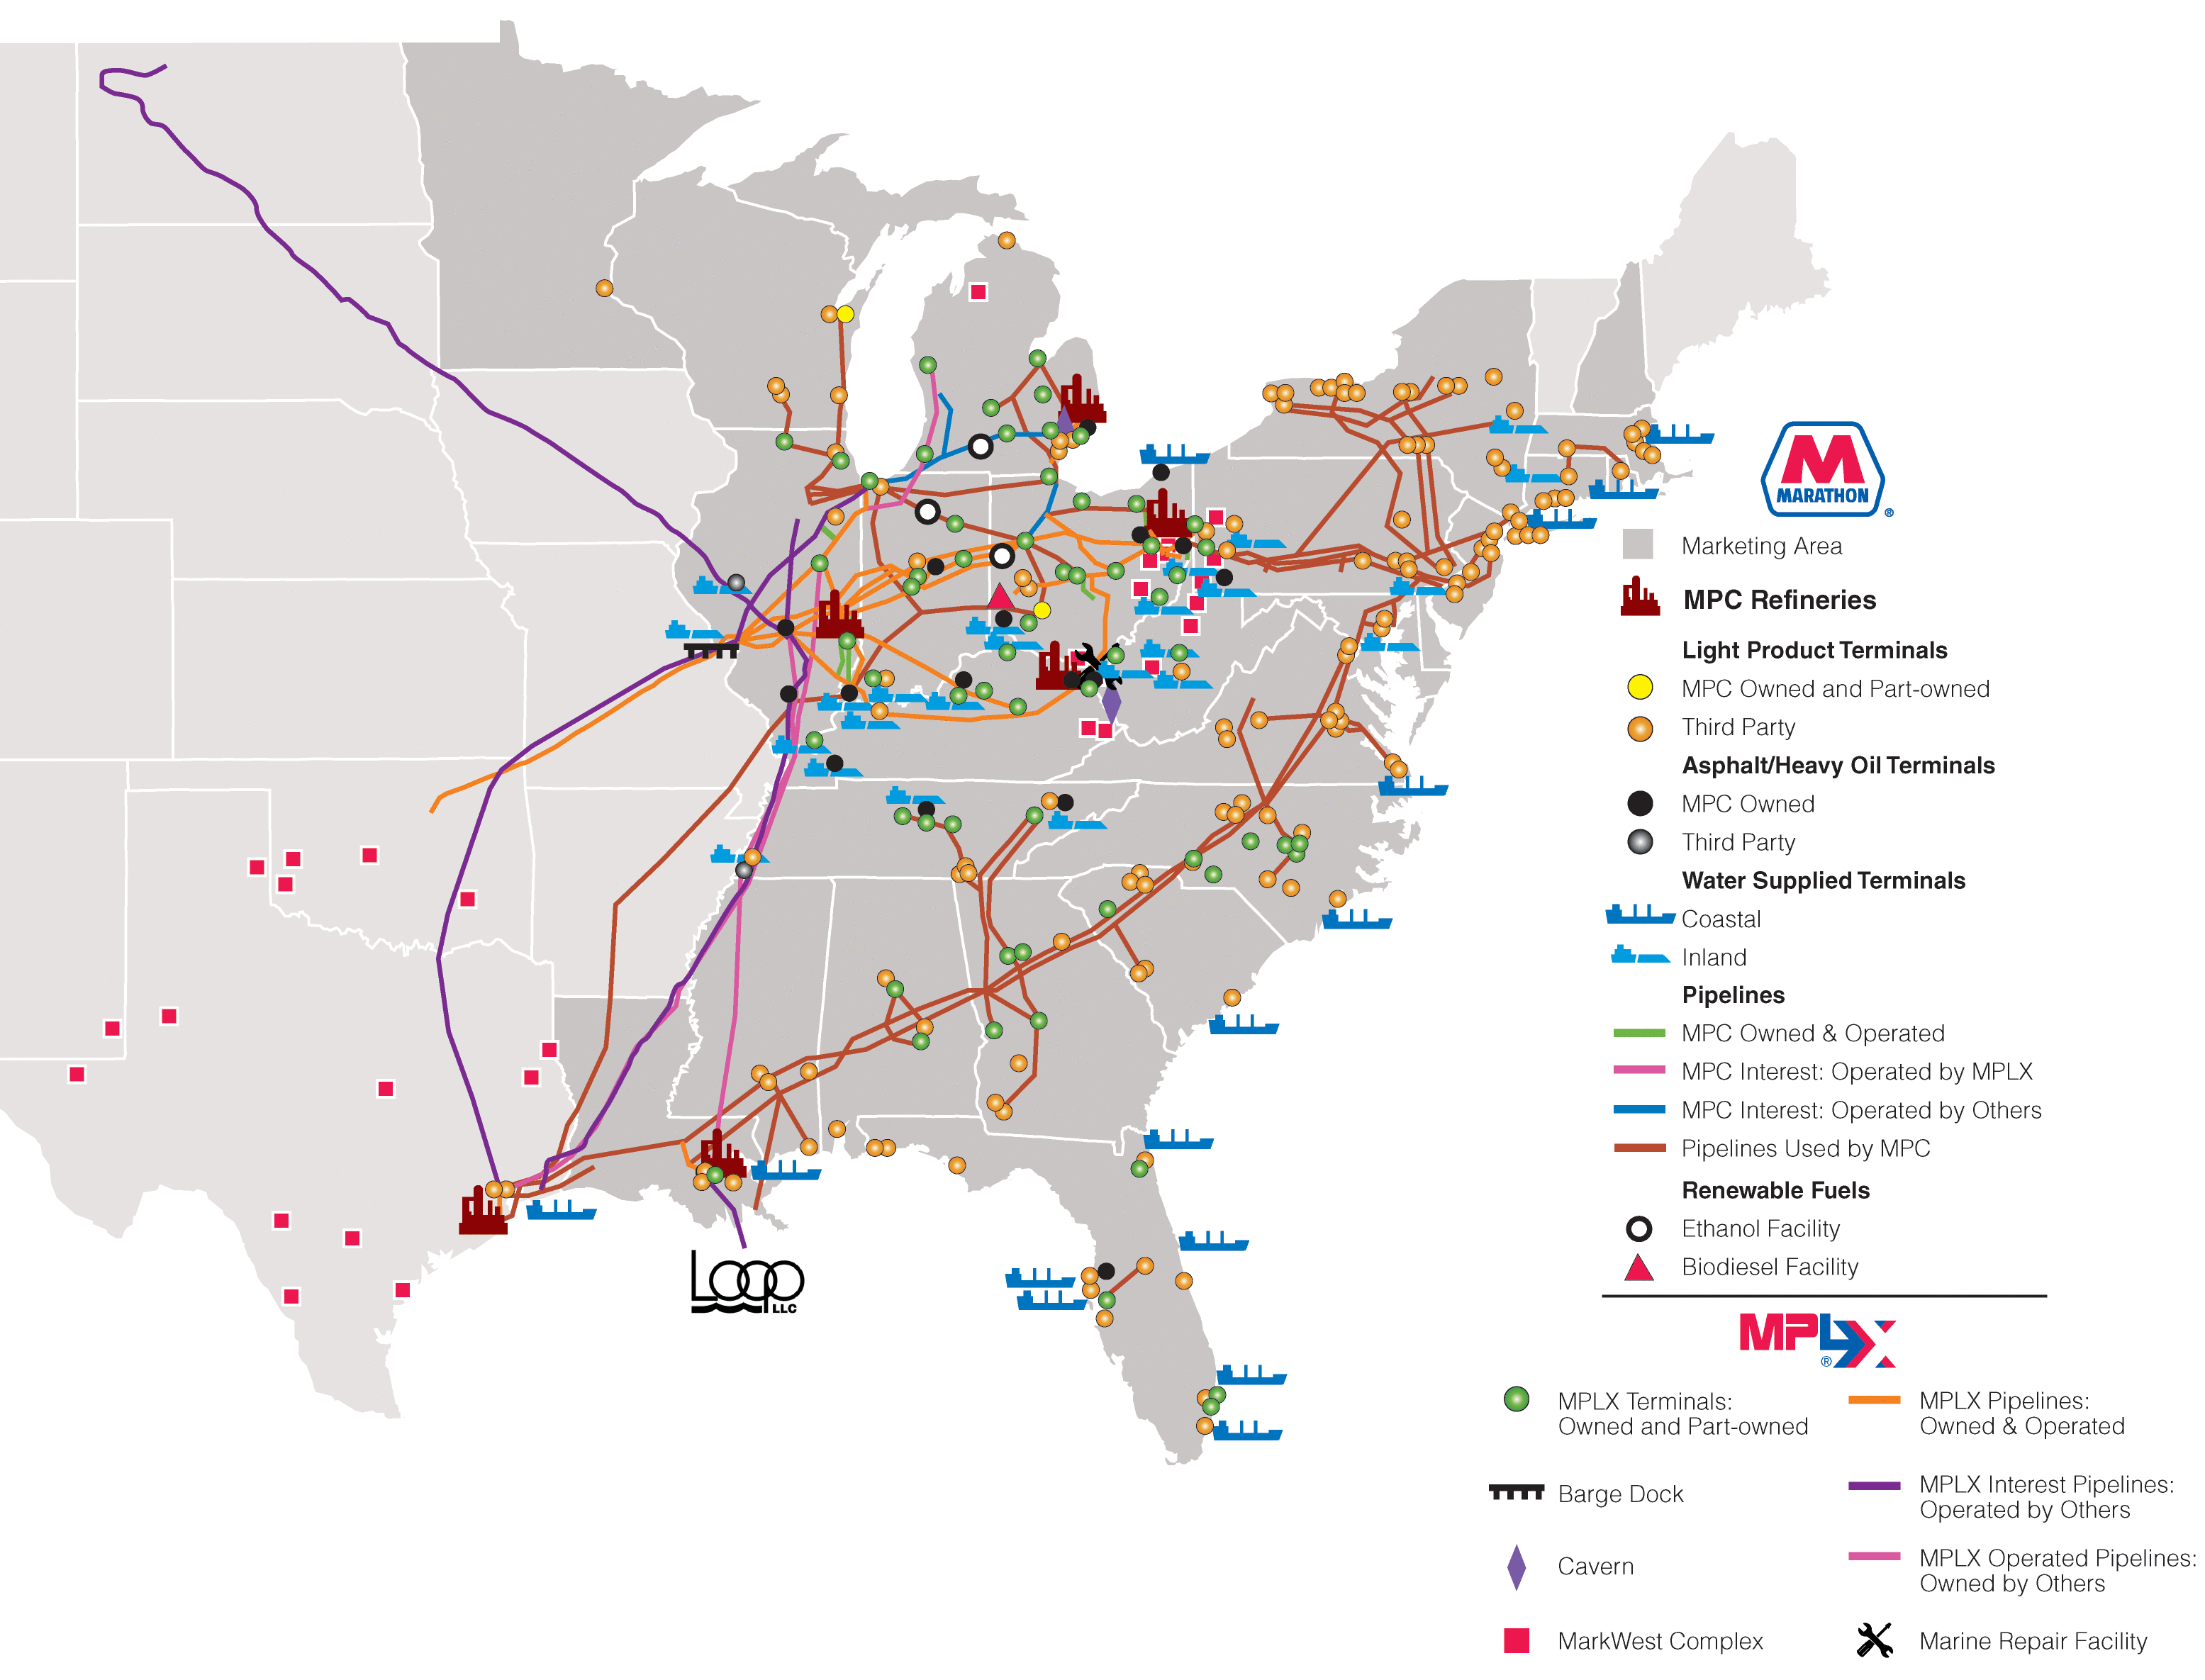
- As of December 31, 2017
General Partner and Sponsor of MPLX
Our investment in MPLX provides us an efficient vehicle to invest in organic projects and pursue acquisitions of midstream assets; all with the focus of enhancing our share price through our limited partner interest in MPLX. MLP interests tend to receive higher market multiples. MPLX’s liquidity, size, scale and access to the capital markets should provide us a strong foundation to execute our strategy for growing our midstream business.
Following the completion of our strategic actions to enhance shareholder value discussed earlier, we own approximately 505 million MPLX common units with a value of $19.15 billion based on MPLX’s February 1, 2018 closing unit price of $37.95.
See Item 8. Financial Statements and Supplementary Data – Note 4 for additional information on the dropdowns to MPLX.
Established Track Record of Profitability
We have demonstrated an ability to achieve positive financial results throughout all stages of the business cycle due in large part to our business mix and geographic diversity. Income generated by our Speedway segment is less sensitive to business cycles. Similarly, long-term, fee based income generated by our Midstream segment is more stable over business cycles, while our Refining & Marketing segment enables us to generate significant income and cash flow when market conditions are more favorable. We also believe our strategies position us well to continue to achieve competitive financial results.
Strong Financial Position
As of December 31, 2017, we had $3.01 billion in cash and cash equivalents and $4.25 billion in unused committed borrowing facilities, excluding MPLX’s cash and cash equivalents of $5 million and its credit facilities. We had $6.00 billion of debt at year-end, excluding MPLX debt of $6.95 billion. This combination of strong liquidity and manageable leverage provides financial flexibility to fund our growth projects and to pursue our business strategies.
Our Business Strategies
Maintain Top-Tier Safety and Environmental Performance
We remain committed to operating our assets in a safe and reliable manner and targeting continual improvement in our safety record across all of our operations. We have a history of safe and reliable operations, which was demonstrated again in 2017 with solid personal and process safety performance compared to similar industry averages. In addition, our corporate headquarters, four of our six refineries and 11 additional facilities have earned designations as an OSHA VPP Star site which recognizes employers and workers who have implemented effective safety and health management systems.
We also remain committed to environmental stewardship by continuing to improve the efficiency and reliability of our operations. For instance, in 2010, we established a “Focus on Energy” initiative to bolster our commitment to improving the efficiency of our existing installations. As part of this initiative, a team of dedicated energy specialists was formed to: track and communicate nearly 600 individual energy metrics throughout our refining system; ensure energy efficiency is designed into proposed capital and expense projects; and identify and implement energy-efficiency improvements at each of our refineries, including multi-year programs to enhance insulation, steam system performance and heat integration. Through this focus, our refineries have achieved significant energy-efficiency improvements and performance. Since the EPA began recognizing petroleum refineries under its Energy Star® program in 2006, we have earned 76 percent of the Energy Star® recognitions, despite owning and operating just 10 percent of total U.S. refining capacity. We have also implemented similar initiatives in our transportation fleet which has been recognized as an EPA SmartWay® partner. The SmartWay program recognizes the best-performing freight carriers for greenhouse gas and energy efficiency. These measures not only reduce emissions but can also reduce operating costs.
We proactively address our regulatory requirements and encourage our operations to continually improve their environmental performance through our DEI program, which establishes goals and measures performance. In 2017, we began to include our natural gas gathering and processing operations in certain aspects of the program. Even with the additional assets included, we maintained our performance from 2016 with 31 DEI’s, a 53 percent reduction in DEI’s since 2013. Since 2001, MPC’s health, environment, safety and security (“HES&S”) performance has been continually improving under the Responsible Care® Management System, and we are now moving into a more rigorous phase of HES&S management that represents a new level of commitment: RC14001®:2015 certification. RC14001 is a management system that combines Responsible Care with the globally recognized ISO14001:2015 environmental management system, established by the International Organization for Standardization (“ISO”). ISO is an independent, nongovernmental international body that provides world-class specifications for products, services and systems that ensure quality, safety and efficiency. Similar to Responsible Care, RC14001 provides the Company a management system that integrates health, environmental stewardship, safety and security, and is third-party audited to ensure compliance and continual improvement. Two of our six refineries and our Marathon Pipeline organization and Terminal, Transport and Rail organization are already certified to the RC14001 standard. We expect that our remaining refineries will by certified in 2018 and our natural gas gathering and processing operations will begin to seek RC14001 certification in 2019.
Grow Higher Valued, Stable Cash Flow Businesses
We intend to continue allocating significant portions of our capital to investments to grow our midstream and retail businesses. These businesses typically have more predictable and stable income and cash flows compared to our refining operations and we believe investors assign a higher value to such businesses.
MPLX has significantly expanded its midstream activities through mergers and acquisitions, dropdown transactions with MPC and organic growth projects. MPLX will consider organic growth projects that provide attractive returns and cash flows both within its geographic footprint as well as in new regions. MPLX may pursue these opportunities as standalone projects, with MPC or with other parties. MPLX has identified a number of potential projects over the next several years. These primarily include projects to expand gathering, processing and fractionation infrastructure in the Marcellus and Utica regions and infrastructure investments in the Permian Basin to support significant oil and gas production activities forecasted in those regions.
We intend to continue growing Speedway’s profitability by focusing on organic growth opportunities targeted to fill in voids in our existing markets by building new locations and by rebuilding or remodeling existing stores. We will also look to expand our presence by opportunistically acquiring high quality stores in new and existing markets. We have identified numerous opportunities for new convenience stores or store rebuilds in our existing market, with a continued focus in Chicago and Tennessee, as well as opportunities for growth in new markets including Georgia, South Carolina and upstate New York. We also plan to capitalize on diesel demand growth by building out our network of commercial fueling lane locations, which cater to local and regional transport fleets, within our core market.
Focus on Long-Term Integrated Relationships with Our Producer Customers
MPLX has developed long-term integrated relationships with its natural gas and NGL producer customers. These relationships are characterized by an intense focus on customer service and a deep understanding of producer customers’ requirements coupled with the ability to increase the level of our midstream services in response to their midstream requirements. Through collaborative planning with these producer customers, MPLX continues to construct high-quality midstream infrastructure and provide unique solutions that are critical to the ongoing success of producer customers’ development plans. As a result of these efforts, MPLX’s MarkWest subsidiary has been a top-rated midstream service provider in customer satisfaction since 2006, as determined by an independent research provider.
Pursue Margin Enhancing Investments in Refining to Deliver Top Quartile Refining Performance
Our refining system has the flexibility to process a wide array of crude oils, which positions us well to benefit from economically attractive Canadian heavy crudes, heavy/sour waterborne cargos, as well as the growing crude oil and condensate production from North American shale plays. In addition to having access to multiple domestic markets for our refined products, we are also well positioned to export distillates and gasoline from our Gulf Coast refineries.
We intend to enhance margins in our Refining & Marketing segment by realizing benefits from targeted investments, primarily in our Gulf Coast refining operations. Over the mid- to long-term, we believe significant opportunities exist for refiners that can access international markets with their refined products and that can upgrade residual fuel oil into more valuable refined products, especially distillates. To this end, we are investing approximately $1.5 billion in Galveston Bay through the STAR project to create a world-class refining complex. This investment will enable us to upgrade low value residual fuel oil into higher value refined products and lowers the refinery’s cost of production. The project scope increases heavy crude processing capacity, increases distillate and gas oil recovery and improves the refinery’s overall reliability. Project implementation began in 2016 and will complete in early 2022. In addition to STAR, we are expanding Galveston Bay’s waterborne product loading capacity to optimize our Gulf Coast product supply system. We are also investing approximately $200 million in our Garyville refinery to increase coking capacity and ULSD production, scheduled to complete in 2020. Both the Galveston Bay STAR and Garyville coker expansion projects will allow MPC to capitalize on the expected increase in demand for low sulfur distillate arising from the International Maritime Organization (“IMO”) low sulfur bunker fuel requirements effective in 2020. Additionally, Garyville will complete the final phase of its Diesel Max project in early-2018, increasing MPC’s ULSD production, anticipated to be a key blending component for compliant bunker fuel. Finally, MPC has additional projects under development that would yield benefit through residual fuel oil destruction or increased ULSD production.
Sustain Focus on Disciplined Capital Allocation and Shareholder Returns
We intend to maintain our focus on a disciplined and balanced approach to capital allocation, including return of capital to shareholders, in a manner consistent with maintaining an investment-grade credit profile. Since becoming a stand-alone company in June 2011, our dividend has increased by a 26.5 percent compound annual growth rate and our board of directors has authorized share repurchases totaling $13.0 billion. Through open market purchases and two ASR programs, we repurchased 246 million shares of our common stock for approximately $9.81 billion, representing approximately 35 percent of our outstanding common shares when we became a stand-alone company in June 2011. We achieved these shareholder returns while also investing in the business and maintaining an investment-grade credit profile. As of December 31, 2017, $3.19 billion of authorization remains available for future share repurchases.
Utilize and Enhance our High Quality Employee Workforce
We utilize our high quality employee workforce by continuously leveraging their commercial skills. In addition, we continue to enhance our workforce through active recruitment of the best candidates from diverse backgrounds and effective training programs on safety, environmental stewardship, diversity and inclusion and other professional and technical skills.
The above discussion contains forward-looking statements with respect to the business and operations of MPC and our competitive strengths and business strategies, including our expected investments and the adequacy of our capital resources and liquidity. Factors that could impact our competitive strengths and business strategies, including the adequacy of our capital resources and liquidity include, but are not limited to, our ability to achieve the strategic and other objectives related to the strategic initiatives discussed herein; our ability to generate sufficient income and cash flow to effect the intended share repurchases, including within the expected timeframe; our ability to manage disruptions in credit markets or changes to our credit rating; the potential impact on our share price if we are unable to effect the intended share repurchases; adverse changes in laws including with respect to tax and regulatory matters; changes to the expected construction costs and timing of projects; continued/further volatility in and/or degradation of market and industry conditions; the availability and pricing of crude oil and other feedstocks; slower growth in domestic and Canadian crude supply; the effects of the lifting of the U.S. crude oil export ban; completion of pipeline capacity to areas outside the U.S. Midwest; consumer demand for refined products; transportation logistics; the reliability of processing units and other equipment; MPC's ability to successfully implement growth opportunities; the impact of adverse market conditions affecting MPC’s and MPLX’s midstream business; modifications to MPLX earnings
and distribution growth objectives; compliance with federal and state environmental, economic, health and safety, energy and other policies and regulations, including the cost of compliance with the Renewable Fuel Standard, and/or enforcement actions initiated thereunder; adverse results in litigation; changes to MPC's capital budget; other risk factors inherent to MPC's industry. These factors, among others, could cause actual results to differ materially from those set forth in the forward-looking statements. For additional information on forward-looking statements and risks that can affect our business, see “Disclosures Regarding Forward-Looking Statements” and Item 1A. Risk Factors in this Annual Report on Form 10-K.
Refining & Marketing
Refineries
We currently own and operate six refineries in the Gulf Coast and Midwest regions of the United States with an aggregate crude oil refining capacity of 1,881 mbpcd. During 2017, we merged the management and operations of the Galveston Bay and Texas City refineries into a single world-class refining complex that is now operated as Galveston Bay Refinery. As of December 31, 2017, historical refinery data reported for Galveston Bay will include the former Texas City refinery. During 2017, our refineries processed 1,765 mbpd of crude oil and 179 mbpd of other charge and blendstocks. During 2016, our refineries processed 1,699 mbpd of crude oil and 151 mbpd of other charge and blendstocks.
Our refineries include crude oil atmospheric and vacuum distillation, fluid catalytic cracking, hydrocracking, catalytic reforming, coking, desulfurization and sulfur recovery units. The refineries process a wide variety of condensate, light and heavy crude oils purchased from various domestic and foreign suppliers. We produce numerous refined products, ranging from transportation fuels, such as reformulated gasolines, blend-grade gasolines intended for blending with ethanol and ULSD fuel, to heavy fuel oil and asphalt. Additionally, we manufacture aromatics, propane, propylene and sulfur. See the Refined Product Marketing section for further information about the products we produce.
Our refineries are integrated with each other via pipelines, terminals and barges to maximize operating efficiency. The transportation links that connect our refineries allow the movement of intermediate products between refineries to optimize operations, produce higher margin products and efficiently utilize our processing capacity. For example, naphtha may be moved from Galveston Bay to Robinson where excess reforming capacity is available. Also, shipping intermediate products between facilities during partial refinery shutdowns allows us to utilize processing capacity that is not directly affected by the shutdown work.
Following is a description of each of our refineries and their capacity.
Galveston Bay, Texas City, Texas Refinery (571 mbpcd). Our Galveston Bay refinery is a world-class refining complex resulting from the combination of our former Texas City refinery and Galveston Bay refinery, which we acquired on February 1, 2013. The refinery is located on the Texas Gulf Coast approximately 30 miles southeast of Houston, Texas and can process a wide variety of crude oils into gasoline, distillates, aromatics, heavy fuel oil, refinery-grade propylene, fuel-grade coke, dry gas and sulfur. The refinery has access to the export market and multiple options to sell refined products. Our cogeneration facility, which supplies the Galveston Bay refinery, currently has 1,055 megawatts of electrical production capacity and can produce 4.3 million pounds of steam per hour. Approximately 46 percent of the power generated in 2017 was used at the refinery, with the remaining electricity being sold into the electricity grid.
Garyville, Louisiana Refinery (556 mbpcd). Our Garyville, Louisiana refinery is located along the Mississippi River in southeastern Louisiana between New Orleans, Louisiana and Baton Rouge, Louisiana. The Garyville refinery is configured to process a wide variety of crude oils into gasoline, distillates, fuel-grade coke, asphalt, polymer-grade propylene, propane, dry gas, heavy fuel oil, slurry, refinery-grade propylene and sulfur. The refinery has access to the export market and multiple options to sell refined products. A major expansion project was completed in 2009 that increased Garyville’s crude oil refining capacity, making it one of the largest refineries in the U.S. Our Garyville refinery has earned designation as an OSHA VPP Star site.
Catlettsburg, Kentucky Refinery (277 mbpcd). Our Catlettsburg, Kentucky refinery is located in northeastern Kentucky on the western bank of the Big Sandy River, near the confluence with the Ohio River. The Catlettsburg refinery processes sweet and sour crude oils into gasoline, distillates, asphalt, aromatics, heavy fuel oil and propane. In the second quarter of 2015, we completed construction of a condensate splitter at our Catlettsburg refinery, which increased our capacity to process condensate from the Utica shale region.
Robinson, Illinois Refinery (245 mbpcd). Our Robinson, Illinois refinery is located in southeastern Illinois. The Robinson refinery processes sweet and sour crude oils into gasoline, distillates, anode-grade coke, propane, aromatics, slurry and refinery-grade propylene. The Robinson refinery has earned designation as an OSHA VPP Star site.
Detroit, Michigan Refinery (139 mbpcd). Our Detroit, Michigan refinery is located in southwest Detroit. It is the only petroleum refinery currently operating in Michigan. The Detroit refinery processes sweet and heavy sour crude oils into gasoline, distillates, asphalt, fuel-grade coke, chemical-grade propylene, propane and slurry. Our Detroit refinery earned designation as an OSHA VPP Star site. In the fourth quarter of 2012, we completed a heavy oil upgrading and expansion project that enabled the refinery to process up to an additional 80 mbpd of heavy sour crude oils, including Canadian crude oils.
Canton, Ohio Refinery (93 mbpcd). Our Canton, Ohio refinery is located approximately 60 miles south of Cleveland, Ohio. The Canton refinery processes sweet and sour crude oils, including production from the nearby Utica Shale, into gasoline, distillates, asphalt, roofing flux, propane, refinery-grade propylene and slurry. In December 2014, we completed construction of a condensate splitter at our Canton refinery, which increased our capacity to process condensate from the Utica shale region. The Canton refinery has earned designation as an OSHA VPP Star site.
As of December 31, 2017, our refineries had 22 rail loading racks and 26 truck loading racks and three of our refineries had a total of seven owned and 12 non-owned docks. Total throughput in 2017 was 99 mbpd for the refinery loading racks and 875 mbpd for the refinery docks.
Planned maintenance activities, or turnarounds, requiring temporary shutdown of certain refinery operating units, are periodically performed at each refinery. See Item 7. Management’s Discussion and Analysis of Financial Condition and Results of Operations for additional detail.
Refined Product Yields
The following table sets forth our refinery production by product group for each of the last three years.
| Refined Product Yields (mbpd) | 2017 | 2016 | 2015 | ||||||
| Gasoline | 932 | 900 | 913 | ||||||
| Distillates | 641 | 617 | 603 | ||||||
| Propane | 36 | 35 | 36 | ||||||
| Feedstocks and special products | 277 | 241 | 281 | ||||||
| Heavy fuel oil | 37 | 32 | 31 | ||||||
| Asphalt | 63 | 58 | 55 | ||||||
| Total | 1,986 | 1,883 | 1,919 |
Crude Oil Supply
We obtain the crude oil we refine through negotiated term contracts and purchases or exchanges on the spot market. Our term contracts generally have market-related pricing provisions. The following table provides information on our sources of crude oil for each of the last three years. The crude oil sourced outside of North America was acquired from various foreign national oil companies, production companies and trading companies.
| Sources of Crude Oil Refined (mbpd) | 2017 | 2016 | 2015 | ||||||
| United States | 999 | 986 | 1,138 | ||||||
| Canada | 381 | 326 | 244 | ||||||
| Middle East and other international | 385 | 387 | 329 | ||||||
| Total | 1,765 | 1,699 | 1,711 |
Our refineries receive crude oil and other feedstocks and distribute our refined products through a variety of channels, including pipelines, trucks, railcars, ships and barges.
Renewable Fuels
We currently own a biofuel production facility in Cincinnati, Ohio that produces biodiesel, glycerin and other by-products. The capacity of the plant is approximately 70 million gallons per year.
We hold ownership interests in ethanol production facilities in Albion, Michigan; Clymers, Indiana and Greenville, Ohio. These plants have a combined ethanol production capacity of approximately 415 million gallons per year (27 mbpd) and are managed by a co-owner.
Refined Product Marketing
We believe we are one of the largest wholesale suppliers of gasoline and distillates to resellers and consumers within our 26-state market area. Independent retailers, wholesale customers, our Marathon brand jobbers and Speedway brand convenience stores, airlines, transportation companies and utilities comprise the core of our customer base.
The following table sets forth our refined product sales volumes by product group for each of the last three years.
| Refined Product Sales by Product Group (mbpd) | 2017 | 2016 | 2015 | ||||||
| Gasoline | 1,201 | 1,219 | 1,241 | ||||||
| Distillates | 691 | 676 | 667 | ||||||
| Propane | 37 | 35 | 36 | ||||||
| Feedstocks and special products | 265 | 231 | 258 | ||||||
| Heavy fuel oil | 69 | 35 | 30 | ||||||
| Asphalt | 68 | 63 | 57 | ||||||
| Total | 2,331 | 2,259 | 2,289 |
In addition, we sell gasoline, distillates and asphalt for export, primarily out of our Garyville and Galveston Bay refineries. The following table sets forth our refined product sales destined for export by product group for the past three years.
| Refined Product Sales Destined for Export (mbpd) | 2017 | 2016 | 2015 | ||||||
| Gasoline | 96 | 91 | 101 | ||||||
| Distillates | 192 | 199 | 214 | ||||||
| Asphalt | 9 | 6 | 4 | ||||||
| Total | 297 | 296 | 319 |
Gasoline and Distillates. We sell gasoline, gasoline blendstocks and distillates (including No. 1 and No. 2 fuel oils, jet fuel, kerosene and diesel fuel) to wholesale customers, Marathon-branded independent entrepreneurs and our Speedway® convenience stores and on the spot market. In addition, we sell diesel fuel and gasoline for export to international customers. We sold 52 percent of our gasoline sales volumes and 89 percent of our distillates sales volumes on a wholesale or spot market basis in 2017. The demand for gasoline and distillates is seasonal in many of our markets, with demand typically at its highest levels during the summer months.
We have blended ethanol into gasoline for more than 25 years and began expanding our blending program in 2007, in part due to federal regulations that require us to use specified volumes of renewable fuels. Ethanol volumes sold in blended gasoline were 81 mbpd in 2017, 84 mbpd in 2016 and 85 mbpd in 2015. We sell reformulated gasoline, which is also blended with ethanol, in 12 states in our marketing area. We also sell biodiesel-blended diesel fuel in 17 states in our marketing area. The future expansion or contraction of our ethanol and biodiesel blending programs will be driven by market economics and government regulations.
Propane. We produce propane at all of our refineries. Propane is primarily used for home heating and cooking, as a feedstock within the petrochemical industry, for grain drying and as a fuel for trucks and other vehicles. Our propane sales are typically split evenly between the home heating market and petrochemical consumers.
Feedstocks and Special Products. We are a producer and marketer of feedstocks and special products. Product availability varies by refinery and includes platformate, alkylate, FCC unit gas, naptha, dry gas, propylene, raffinate, butane, benzene, xylene, molten sulfur, cumene and toluene. We market these products domestically to customers in the chemical, agricultural and fuel-blending industries. In addition, we produce fuel-grade coke at our Garyville, Detroit and Galveston Bay refineries, which is used for power generation and in miscellaneous industrial applications, and anode-grade coke at our Robinson refinery, which is used to make carbon anodes for the aluminum smelting industry. Our feedstocks and special products sales increased to 265 mbpd in 2017 from 231 mbpd in 2016 and decreased in 2016 from 258 mbpd in 2015. The increase in 2017 was primarily due to more feedstocks and special products sold on the spot market as a result of increased product yields. The decrease in 2016 was primarily due to more feedstocks used in production versus selling them on the spot market.
Heavy Fuel Oil. We produce and market heavy residual fuel oil or related components, including slurry, at all of our refineries. Heavy residual fuel oil is primarily used in the utility and ship bunkering (fuel) industries, though there are other more specialized uses of the product.
Asphalt. We have refinery-based asphalt production capacity of up to 104 mbpcd, which includes asphalt cements, polymer-modified asphalt, emulsified asphalt, industrial asphalts and roofing flux. We have a broad customer base, including asphalt-paving contractors, government entities (states, counties, cities and townships) and asphalt roofing shingle manufacturers. We sell asphalt in the domestic and export wholesale markets via rail, barge and vessel.
The following table sets forth, as a percentage of total refined product sales volume, the sales of refined products to our different customer types for the past three years.
| Refined Product Sales by Customer Type | 2017 | 2016 | 2015 | ||||||
| Private-brand marketers, commercial and industrial customers, including spot market | 71 | % | 69 | % | 69 | % | |||
| Marathon-branded independent entrepreneurs | 13 | % | 14 | % | 14 | % | |||
| Speedway® convenience stores | 16 | % | 17 | % | 17 | % |
As of December 31, 2017, there were 5,617 retail outlets in 20 states and the District of Columbia where independent entrepreneurs maintain Marathon-branded retail outlets.
Terminals
As of December 31, 2017, our Refining & Marketing segment owned and operated 18 asphalt terminals and two light products terminals. In addition, we distribute refined products through 59 light products terminals owned by MPLX and approximately 130 third-party light products and two third-party asphalt terminals in our market area.
Transportation - Truck and Rail
As of December 31, 2017, we owned 180 transport trucks and 193 trailers with an aggregate capacity of 1.8 million gallons for the movement of refined products and crude oil. In addition, we had 1,999 leased and 19 owned railcars of various sizes and capacities for movement and storage of refined products.
The locations and detailed information about our Refining & Marketing assets are included under Item 2. Properties and are incorporated herein by reference.
Speedway
Our Speedway segment sells gasoline, diesel and merchandise through convenience stores that it owns and operates under the Speedway brand. Speedway convenience stores offer a wide variety of merchandise, including prepared foods, beverages and non-food items. Speedway’s Speedy Rewards® loyalty program has been a highly successful loyalty program since its inception in 2004, with a consistently growing base which averaged approximately 6 million active members in 2017. Speedway’s ability to capture and analyze member-specific transactional data enables us to offer Speedy Rewards® members discounts and promotions specific to their buying behavior. We believe Speedy Rewards® is a key reason customers choose Speedway over competitors and it continues to drive significant value for both Speedway and our Speedy Rewards® members.
The demand for gasoline is seasonal, with the highest demand usually occurring during the summer driving season. Margins from the sale of merchandise tend to be less volatile than margins from the retail sale of gasoline and diesel fuel.
As of December 31, 2017, Speedway had 2,744 convenience stores in 21 states. Speedway also owns a 29 percent interest in PFJ Southeast LLC (“PFJ Southeast”), which is a joint venture between Speedway and Pilot Flying J with 124 travel center locations primarily in the Southeast United States as of December 31, 2017.
As of December 31, 2017, Speedway owned 109 transport trucks and 103 trailers for the movement of gasoline and distillate.
The locations and detailed information about our Speedway assets are included under Item 2. Properties and are incorporated herein by reference.
Midstream
The Midstream segment, which primarily includes the operations of MPLX, gathers, processes and transports natural gas; gathers, transports, fractionates, stores and markets NGLs; and transports and stores crude oil and refined products principally for the Refining & Marketing segment via pipelines, terminals, towboats and barges. The Midstream segment also includes certain related operations retained by MPC.
MPLX
As of December 31, 2017, MPLX assets included approximately 5.9 bcf/d of natural gas gathering capacity, 8.0 bcf/d of natural gas processing capacity and 610 mbpd of NGL fractionation capacity.
MPLX assets as of December 31, 2017, also included 1,613 miles of owned or leased and operated common carrier crude oil pipelines and 2,360 miles of common carrier products pipelines and partial ownership in 2,194 miles of crude oil pipelines and 1,917 miles of products pipelines, all of which are across 17 states. In 2017, third parties generated 16 percent of the crude oil and product shipments on MPLX’s common carrier pipelines, excluding volumes shipped by MPC under joint tariffs with third parties. MPLX owns nine butane and propane storage caverns with total capacity of approximately 3 million barrels.
As of December 31, 2017, MPLX owned and operated 59 light products terminals and distributes refined products through one leased light products terminal and two light products terminals in which it has partial ownership interests but does not operate.
As of December 31, 2017, MPLX’s marine transportation operations included 18 owned towboats, as well as 208 owned and 24 leased barges that transport refined products and crude oil on the Ohio, Mississippi and Illinois rivers and their tributaries and inter-coastal waterways.
MPC-Retained Midstream Assets and Investments
We retained ownership interests in several crude oil and products pipeline systems and pipeline companies. We own 228 miles of private products pipelines that are operated by MPL for the benefit of our Refining & Marketing segment on a cost recovery basis. We also have undivided joint interests in 739 miles of common carrier crude oil pipeline systems and partial ownership interests in pipeline companies including 1,741 miles of products pipelines.
As of December 31, 2017, we also have indirect ownership interests in two ocean vessel joint ventures with Crowley through our investment in Crowley Coastal Partners. These joint ventures operate and charter four Jones Act product tankers, most of which are leased to MPC, and own and operate three 750 Series ATB vessels that are leased to MPC.
The locations and detailed information about our Midstream assets are included under Item 2. Properties and are incorporated herein by reference.
Competition, Market Conditions and Seasonality
The downstream petroleum business is highly competitive, particularly with regard to accessing crude oil and other feedstock supply and the marketing of refined products. We compete with a large number of other companies to acquire crude oil for refinery processing and in the distribution and marketing of a full array of refined products. Based upon the “The Oil & Gas Journal 2018 Worldwide Refinery Survey,” we ranked second among U.S. petroleum companies on the basis of U.S. crude oil refining capacity.
We compete in four distinct markets for the sale of refined products—wholesale, spot, branded and retail distribution. We believe we compete with about 50 companies in the sale of refined products to wholesale marketing customers, including private-brand marketers and large commercial and industrial consumers; about 110 companies in the sale of refined products in the spot market; about 10 refiners or marketers in the supply of refined products to refiner-branded independent entrepreneurs; and approximately 830 retailers in the retail sale of refined products. In addition, we compete with producers and marketers in other industries that supply alternative forms of energy and fuels to satisfy the requirements of our industrial, commercial and retail consumers. We do not produce any of the crude oil we refine.
We also face strong competition for sales of retail gasoline, diesel fuel and merchandise. Our competitors include service stations and convenience stores operated by fully integrated major oil companies, independent entrepreneurs and other well-recognized national or regional convenience stores and travel centers, often selling gasoline, diesel fuel and merchandise at competitive prices. Non-traditional retailers, such as supermarkets, club stores and mass merchants, have affected the convenience store industry with their entrance into sales of retail gasoline and diesel fuel. Energy Analysts International, Inc. estimated such retailers had approximately 15 percent of the U.S. gasoline market in mid-2017.
Our Midstream operations face competition for natural gas gathering, crude oil transportation and in obtaining natural gas supplies for our processing and related services; in obtaining unprocessed NGLs for gathering and fractionation; and in marketing our products and services. Competition for natural gas supplies is based primarily on the location of gas gathering facilities and gas processing plants, operating efficiency and reliability and the ability to obtain a satisfactory price for products recovered. Competitive factors affecting our fractionation services include availability of capacity, proximity to supply and industry marketing centers and cost efficiency and reliability of service. Competition for customers to purchase our natural gas and NGLs is based primarily on price, delivery capabilities, flexibility and maintenance of high-quality customer relationships. In addition, certain of our Midstream operations are highly regulated, which affects the rates that our common carrier pipelines can charge for transportation services and the return we obtain from such pipelines.
Market conditions in the oil and gas industry are cyclical and subject to global economic and political events and new and changing governmental regulations. Our operating results are affected by price changes in crude oil, natural gas and refined
products, as well as changes in competitive conditions in the markets we serve. Price differentials between sweet and sour crude oils, WTI and LLS crude oils and other market structure differentials also affect our operating results.
Demand for gasoline, diesel fuel and asphalt is higher during the spring and summer months than during the winter months in most of our markets, primarily due to seasonal increases in highway traffic and construction. As a result, the operating results for each of our segments for the first and fourth quarters may be lower than for those in the second and third quarters of each calendar year.
Our Midstream segment can be affected by seasonal fluctuations in the demand for natural gas and NGLs and the related fluctuations in commodity prices caused by various factors such as changes in transportation and travel patterns and variations in weather patterns from year to year. Overall, our exposure to the seasonal fluctuations in the commodity markets is declining due to our growth in fee-based business.
Environmental Matters
Our management is responsible for ensuring that our operating organizations maintain environmental compliance systems that support and foster our compliance with applicable laws and regulations, and for reviewing our overall environmental performance. We also have a Corporate Emergency Response Team that oversees our response to any major environmental or other emergency incident involving us or any of our facilities.
We believe it is likely that the scientific and political attention to issues concerning the extent and causes of climate change will continue, with the potential for further regulations that could affect our operations. Currently, legislative and regulatory measures to address greenhouse gases are in various phases of review, discussion or implementation. The cost to comply with these laws and regulations cannot be estimated at this time, but could be significant. For additional information, see Item 1A. Risk Factors. We estimate and publicly report greenhouse gas emissions from our operations and products. Additionally, we continuously strive to improve operational and energy efficiencies through resource and energy conservation where practicable.
Our operations are subject to numerous other laws and regulations relating to the protection of the environment. Such laws and regulations include, among others, the Clean Air Act (“CAA”) with respect to air emissions, the Clean Water Act (“CWA”) with respect to water discharges, the Resource Conservation and Recovery Act (“RCRA”) with respect to solid and hazardous waste treatment, storage and disposal, the Comprehensive Environmental Response, Compensation, and Liability Act (“CERCLA”) with respect to releases and remediation of hazardous substances and the Oil Pollution Act of 1990 (“OPA-90”) with respect to oil pollution and response. In addition, many states where we operate have similar laws. New laws are being enacted and regulations are being adopted on a continuing basis, and the costs of compliance with such new laws and regulations are very difficult to estimate until finalized.
For a discussion of environmental capital expenditures and costs of compliance for air, water, solid waste and remediation, see Item 7. Management’s Discussion and Analysis of Financial Condition and Results of Operations-Environmental Matters and Compliance Costs.
Air
We are subject to many requirements in connection with air emissions from our operations. Internationally and domestically, emphasis has been placed on reducing greenhouse gas emissions. There has been a dramatic shift in climate-related policy under the Trump Administration as compared to the Obama Administration’s policies. On March 28, 2017, President Trump published Executive Order 13783, pledging, among other things, to review, rescind, revoke or withdraw much of the Obama-era climate change policies, regulations and guidance. The most prominent policies and regulations impacted by the Executive Order include the Obama Administration’s 2013 Climate Action Plan, the “Clean Power Plan,” the “Social Cost of Carbon,” the “Social Cost of Methane” and the Council on Environmental Quality’s “Final Guidance for Federal Departments and Agencies on Consideration of Greenhouse Gas Emissions and the Effects of Climate Change in National Environmental Policy Act Reviews.” President Trump also announced the United States would withdraw from the 2015 Paris UN Climate Change Conference Agreement, which aims to hold the increase in the global average temperature to well below two degrees Celsius as compared to pre-industrial levels. Many of the policies and regulations rescinded through Executive Order 13783 had been adopted to meet the United States’ pledge under the Agreement. The U.S. climate change strategy and implementation of that strategy through legislation and regulation may change under future administrations; therefore, the impact to our industry and operations due to greenhouse gas regulation is unknown at this time.
Regardless of whether legislation or regulation is enacted, given the continuing global demand for oil and gas - even under different hypothetical carbon-constrained scenarios - MPC has taken actions that have resulted in lower greenhouse gas emissions and we are positioned to remain a successful company well into the future. We have instituted a program to improve energy efficiency of our refineries and other assets which will continue to pay dividends in reducing our environmental
footprint as well as making us more cost-competitive. We believe our mature governance and risk-management processes enable the company to effectively monitor and adjust to any transitional or physical climate-related risks.
In 2009, the EPA issued an “endangerment finding” that greenhouse gas emissions contribute to air pollution that endangers public health and welfare. Related to the endangerment finding, in April 2010, the EPA finalized a greenhouse gas emission standard for mobile sources (cars and other light duty vehicles). The endangerment finding, the mobile source standard and the EPA’s determination that greenhouse gases are subject to regulation under the Clean Air Act resulted in permitting of greenhouse gas emissions at stationary sources. Through a series of legal challenges filed against the EPA, the requirement to control greenhouse gas emissions through Best Available Control Technology has been limited to new and modified large stationary sources, such as refineries, that will also emit a criteria pollutant. Implementing Best Available Control Technology may result in increased costs to our operations. A few MPC projects may trigger greenhouse gas permitting requirements but any additional capital spending will likely not be significant.
The EPA has finalized Source Performance Standards for greenhouse gas emissions for new and existing electric utility generating units. These standards could impact electric and natural gas rates for all our operations. Legal challenges have been filed by several states and by industry groups seeking to overturn the final rules. In February 2016, the United States Supreme Court stayed implementation of the standards for existing utility generating units (also known as the Clean Power Plan) until complete disposition of the litigation. The litigation has been placed in abeyance. On October 10, 2017, the EPA issued a Notice of Proposed Rulemaking proposing to repeal the Clean Power Plan. The EPA has also announced its intention to replace the Clean Power Plan with a narrower rule. A proposed replacement rule is expected in 2018.
In the absence of federal legislation or regulation of greenhouse gas emissions, states are becoming more active in regulating greenhouse gas emissions. These measures may include state actions to develop statewide or regional programs to impose emission reductions. These measures may also include low-carbon fuel standards, such as the California program, or a state carbon tax. These measures could result in increased costs to operate and maintain our facilities, capital expenditures to install new emission controls and costs to administer any carbon trading or tax programs implemented.
We could also face increased climate-related litigation with respect to our operations or products. Private party litigation seeking damages and injunctive relief is pending against MPC and other oil and gas companies in California state court. Although uncertain, these actions could increase our costs or operations or reduce the demand for the refined products we produce, transport, store and sell.
Private parties have also sued federal and certain state governmental entities seeking additional greenhouse gas emission reductions beyond those currently being undertaken. In sum, requiring reductions in greenhouse gas emissions could result in increased costs to (i) operate and maintain our facilities, (ii) install new emission controls at our facilities and (iii) administer and manage any greenhouse gas emissions programs, including acquiring emission credits or allotments. These requirements may also significantly affect MPC’s refinery operations and may have an indirect effect on our business, financial condition and results of operations. The extent and magnitude of the impact from greenhouse gas regulation or legislation cannot be reasonably estimated due to the uncertainty regarding the additional measures and how they will be implemented.
In 2015, the EPA finalized a revision to the National Ambient Air Quality Standards (“NAAQS”) for ozone. The EPA lowered the primary ozone NAAQS from 75 ppb to 70 ppb. This revision initiated a multi-year process in which nonattainment designations will be made based on more recent ozone measurements that includes data from 2016. On November 6, 2017, the EPA finalized ozone attainment/unclassifiable designations for certain areas under the new standard. The EPA has not yet designated any counties as nonattainment under the lower primary ozone standard, but such nonattainment designations could result in increased costs associated with, or result in cancellation or delay of, capital projects at our facilities. For areas designated nonattainment, states will be required to adopt State Implementation Plans (“SIPs”) for nonattainment areas. These SIPs may include NOx and/or VOC reductions that could result in increased costs to our facilities. We cannot predict the various SIPs requirements at this time.
On September 29, 2015, the EPA signed the final regulations revising existing refinery air emissions standards. The revised regulations were published in the Federal Register on December 1, 2015. The revised rule requires additional controls, lower emission standards and ambient air monitoring to be implemented over a multi-year period. We do not anticipate that MPC’s costs to comply with the revised regulations will be material to our results of operations or cash flows.
Water
We maintain numerous discharge permits as required under the National Pollutant Discharge Elimination System program of the CWA and have implemented systems to oversee our compliance with these permits. In addition, we are regulated under OPA-90, which among other things, requires the owner or operator of a tank vessel or a facility to maintain an emergency plan to respond to releases of oil or hazardous substances. OPA-90 also requires the responsible company to pay resulting removal
costs and damages and provides for civil penalties and criminal sanctions for violations of its provisions. We operate tank vessels and facilities from which spills of oil and hazardous substances could occur. We have implemented emergency oil response plans for all of our components and facilities covered by OPA-90 and we have established Spill Prevention, Control and Countermeasures plans for all facilities subject to such requirements.
Additionally, OPA-90 requires that new tank vessels entering or operating in U.S. waters be double-hulled and that existing tank vessels that are not double-hulled be retrofitted or removed from U.S. service. All barges used for river transport of our raw materials and refined products meet the double-hulled requirements of OPA-90. Some coastal states in which we operate have passed state laws similar to OPA-90, but with expanded liability provisions, that include provisions for cargo owner responsibility as well as ship owner and operator responsibility.
In June 2015, the EPA and the United States Army Corps of Engineers finalized significant changes to the definition of the term “waters of the United States” (“WOTUS”) used in numerous programs under the CWA. This final rulemaking is referred to as the Clean Water Rule. The Clean Water Rule, as written, expands permitting, planning and reporting obligations and may extend the timing to secure permits for pipeline and fixed asset construction and maintenance activities. The Clean Water Rule has been challenged in multiple federal courts by many states, trade groups, and other interested parties, and in October 2015, a United States Court of Appeals issued a nationwide stay of the Clean Water Rule. On appeal, however, the Supreme Court determined that the court of appeals did not have original jurisdiction to review challenges to the 2015 Rule. As such, legal challenges to the rule will proceed in federal district courts. Concurrent with the legal challenges, on February 28, 2017, President Trump signed Executive Order 13778, directing the EPA and the Army Corps of Engineers to review the 2015 Rule for consistency with the policy outlined in the Order, and to issue a proposed rule rescinding or revising the 2015 Rule as appropriate and consistent with law. The Order also directed the agencies to consider interpreting the term ‘‘navigable waters’’ in a manner consistent with Justice Scalia’s plurality opinion in Rapanos v. United States, 547 U.S. 715 (2006). On June 27, 2017, the EPA and the U.S. Army Corps of Engineers proposed a rule to rescind the Clean Water Rule and re-codify the regulatory text that existed prior to 2015 defining "waters of the United States." Then, on February 6, 2018, the EPA and the U.S. Army Corps of Engineers published a final rule adding an applicability date of February 6, 2020, to the 2015 Clean Water Rule. Establishing an applicable date in 2020 will allow the agencies the time needed to reconsider the definition of “waters of the United States” consistent with the Executive Order.
In 2015, the EPA issued its intent to review the CWA categorical effluent limitation guidelines (“ELG”) for the petroleum refining sector. During 2017, the EPA prepared and issued a draft information request (“ICR”) requesting significant wastewater and treatment process details from select refineries, four of which were ours. EPA may also perform sampling of effluent at one or more of our refineries. The EPA has indicated they believe there have been significant changes in the characteristics of waste waters generated within refining operations that warrant the review. Specific targets for the review are the impacts of processing heavier crude oils and the transfer of air pollutants to wastewater when air pollution abatement devices are in use. A similar project, initiated in 2007 for steam electric power generation with similar attributes, resulted in a significant change in the treatment requirements for coal-fired power plants. However, on September 18, 2017, EPA postponed certain compliance dates while it conducts a rulemaking to revise the ELGs for power plants. The refining sector ELG review has the potential to result in a similar impact. The typical life-cycle for an ELG review from the intent to review to issuance of a final rule that would require upgrades is seven years. The impact of an ELG review cannot be accurately estimated at this time.
Solid Waste
We continue to seek methods to minimize the generation of hazardous wastes in our operations. RCRA establishes standards for the management of solid and hazardous wastes. Besides affecting waste disposal practices, RCRA also addresses the environmental effects of certain past waste disposal operations, the recycling of wastes and the regulation of USTs containing regulated substances. We have ongoing RCRA treatment and disposal operations at our Galveston Bay and Robinson refineries and primarily utilize offsite third-party treatment and disposal facilities. Ongoing RCRA-related costs, however, are not expected to be material to our results of operations or cash flows.
Remediation
We own or operate, or have owned or operated, certain convenience stores and other locations where, during the normal course of operations, releases of refined products from USTs have occurred. Federal and state laws require that contamination caused by such releases at these sites be assessed and remediated to meet applicable standards. Penalties or other sanctions may be imposed for noncompliance. The enforcement of the UST regulations under RCRA has been delegated to the states, which administer their own UST programs. Our obligation to remediate such contamination varies, depending on the extent of the releases and the stringency of the applicable state laws and regulations. A portion of these remediation costs may be recoverable from the appropriate state UST reimbursement funds once the applicable deductibles have been satisfied. We also have ongoing remediation projects at a number of our current and former refinery, terminal and pipeline locations.
Claims under CERCLA and similar state acts have been raised with respect to the clean-up of various waste disposal and other sites. CERCLA is intended to facilitate the clean-up of hazardous substances without regard to fault. Potentially responsible parties for each site include present and former owners and operators of, transporters to and generators of the hazardous substances at the site. Liability is strict and can be joint and several. Because of various factors including the difficulty of identifying the responsible parties for any particular site, the complexity of determining the relative liability among them, the uncertainty as to the most desirable remediation techniques and the amount of damages and clean-up costs and the time period during which such costs may be incurred, we are unable to reasonably estimate our ultimate cost of compliance with CERCLA; however, we do not believe such costs will be material to our business, financial condition, results of operations or cash flows.
Mileage Standards, Renewable Fuels and Other Fuels Requirements
The U.S. Congress passed the Energy Independence and Security Act of 2007 (“EISA”), which, among other things, set a target of 35 miles per gallon for the combined fleet of cars and light trucks in the United States by model year 2020, and contains the RFS2. In August 2012, the EPA and the National Highway Traffic Safety Administration (“NHTSA”) jointly adopted regulations that establish average industry fleet fuel economy standards for passenger cars and light trucks of up to 41 miles per gallon by model year 2021 and average fleet fuel economy standards of up to 49.7 miles per gallon by model year 2025. The standards from 2022 to 2025 are the government’s current estimate but will require further rulemaking by the NHTSA. In 2017, the EPA announced its intention to reconsider whether the light-duty vehicle greenhouse gas emission standards previously established for years 2022-2025 are appropriate under section 202(a) of the Clean Air Act and to coordinate its reconsideration with the parallel rulemaking process to be undertaken by the Department of Transportation’s NHTSA regarding Corporate Average Fuel Economy (CAFE) standards for cars and light trucks for the same model years. Higher CAFE standards for cars and light trucks have the potential to reduce demand for our transportation fuels. New or alternative transportation fuels such as compressed natural gas could also pose a competitive threat to our operations.
The RFS2 requires the total volume of renewable transportation fuels sold or introduced annually in the U.S. to reach 24.0 billion gallons in 2017, 26.0 billion gallons in 2018 and increase to 36.0 billion gallons by 2022. Within the total volume of renewable fuel, EISA established an advanced biofuel volume of 9.0 billion gallons in 2017, 11.0 billion gallons in 2018 and increasing to 21.0 billion gallons in 2022. Subsets within the advanced biofuel volume include biomass-based diesel, which was set as at least 1.0 billion gallons in 2014 through 2022 (to be determined by the EPA through rulemaking), and cellulosic biofuel, which was set at 5.5 billion gallons in 2017, 7.0 billion gallons in 2018 and increasing to 16.0 billion gallons in 2022.
On November 30, 2015, the EPA finalized the renewable fuel standards for the years of 2014, 2015 and 2016 as well as the biomass-based diesel standard for 2017. In a legal challenge to the 2014-2016 volumes, the court vacated the total renewable volume for 2016 and remanded to EPA for reconsideration consistent with the court’s opinion. A remanded rule that increases the 2016 total renewable volume could increase our cost of compliance with the Renewable Fuels Standards and be detrimental to the RIN market.
On November 23, 2016, the EPA finalized the renewable fuel standards for the year 2017 and the biomass based diesel standard for 2018. The EPA used its cellulosic waiver authority to reduce the standards for 2017 from the statutory amounts to the following: 19.28 billion gallons total renewable fuel; 4.28 billion gallons advanced biofuel; and 311 million gallons cellulosic ethanol. The EPA increased the biomass based diesel standard for 2018 to 2.1 billion gallons. The 2017 standards have been challenged in court. On November 30, 2017, the EPA announced the final renewable fuel standards for 2018 and the biomass based diesel standard for 2019. The EPA again used its cellulosic waiver authority to reduce the standards for 2018 from the statutory amounts to the following: 19.29 billion gallons total renewable fuel; 4.29 billion gallons advanced biofuel; and 288 million gallons cellulosic ethanol. The EPA maintained the biomass based diesel standard for 2019 at 2.1 billion gallons. In the near term, the RFS2 will be satisfied primarily with ethanol blended into gasoline. Vehicle, regulatory and infrastructure constraints limit the blending of significantly more than 10 percent ethanol into gasoline (“E10”). The volumes for 2016, 2017 and 2018 result in the ethanol content of gasoline exceeding the E10 blendwall, which will require obligated parties to either sell E15 or ethanol flex fuel at levels that exceed historical levels or retire carryover RINs. In October 2010, the EPA issued a partial waiver decision under the CAA to allow for an increase in the amount of ethanol permitted to be blended into gasoline from E10 to E15 for model year 2007 and newer light-duty motor vehicles. In January 2011, the EPA issued a second waiver for the use of E15 in vehicles model year 2001-2006. There are numerous issues, including state and federal regulatory issues, associated with marketing E15 such as infrastructure compatibility issues and vehicle manufacturer warranty concerns related to E15 usage. Neither E15 nor ethanol flex fuel has been readily accepted by the consumer.
With potentially uncertain supplies, the advanced biofuels programs may present specific challenges in that we may have to enter into arrangements with other parties or purchase credits from the EPA to meet our obligations to use advanced biofuels, including biomass-based diesel and cellulosic biofuel.
We made investments in infrastructure capable of expanding biodiesel blending capability to help comply with the biodiesel RFS2 requirement by buying and blending biodiesel into our refined diesel product, and by buying needed biodiesel RINs in
the EPA-created biodiesel RINs market. On April 1, 2014, we purchased a facility in Cincinnati, Ohio, which currently produces biodiesel, glycerin and other by-products. The capacity of the plant is approximately 60 million gallons per year. As a producer of biodiesel, we now generate RINs, thereby reducing our reliance on the external RIN market.
In November 2017, the EPA finalized its decision to deny petitions requesting that the point of obligation for the RFS2 be moved to the terminal rack. Legal challenge of the EPA’s decision is expected and, should the court decide that EPA’s decision was incorrect and move the point of obligation, we could be subject to increased costs and compliance uncertainties.
The RFS2 has required, and may in the future continue to require, additional capital expenditures or expenses by us to accommodate increased renewable fuels use. We may experience a decrease in demand for refined products due to an increase in combined fleet mileage or due to refined products being replaced by renewable fuels. Demand for our refined products also may increase as a result of low carbon fuel standard programs or electric vehicle mandates.
On March 3, 2014, the EPA signed the final Tier 3 fuel standards. The final Tier 3 fuel standards require, among other things, a lower annual average sulfur level in gasoline to no more than 10 ppm beginning in calendar year 2017. In addition, gasoline refiners and importers may not exceed a maximum per-gallon sulfur standard of 80 ppm while retailers may not exceed a maximum per-gallon sulfur standard of 95 ppm. We anticipate that we will spend an estimated $650 million between 2014 and 2019 for capital expenditures necessary to comply with these standards, which includes estimated capital expenditures of approximately $400 million in 2018-2019.
Trademarks, Patents and Licenses
Our Marathon trademark is material to the conduct of our refining and marketing operations, and our Speedway trademark is material to the conduct of our retail marketing operations. We currently hold a number of U.S. and foreign patents and have various pending patent applications. Although in the aggregate our patents and licenses are important to us, we do not regard any single patent or license or group of related patents or licenses as critical or essential to our business as a whole. In general, we depend on our technological capabilities and the application of know-how rather than patents and licenses in the conduct of our operations.
Employees
We had approximately 43,800 regular full-time and part-time employees as of December 31, 2017, which includes approximately 32,150 employees of Speedway.
Certain hourly employees at our Canton, Catlettsburg and Galveston Bay refineries are represented by the United Steel, Paper and Forestry, Rubber, Manufacturing, Energy, Allied Industrial and Service Workers Union under labor agreements that are due to expire in 2019. The International Brotherhood of Teamsters represents certain hourly employees at our Detroit refinery under a labor agreement that is also scheduled to expire in 2019. In addition, they represent certain hourly employees at Speedway under agreements that cover certain retail locations in New York and New Jersey that expire on March 14, 2019 and June 30, 2019, respectively. In addition, certain hourly employees at our Cincinnati biofuel production facility are represented by the Employees Representation Association under a labor agreement that is due to expire in 2021.
Executive and Corporate Officers of the Registrant
The executive and corporate officers of MPC are as follows:
| Name | Age as of February 1, 2018 | Position with MPC | ||
| Gary R. Heminger | 64 | Chairman and Chief Executive Officer | ||
| Molly R. Benson(a) | 51 | Vice President, Corporate Secretary and Chief Compliance Officer | ||
| Raymond L. Brooks | 57 | Senior Vice President, Refining | ||
| Suzanne Gagle | 52 | Vice President and General Counsel | ||
| Timothy T. Griffith | 48 | Senior Vice President and Chief Financial Officer | ||
| Thomas Kaczynski | 56 | Vice President, Finance and Treasurer | ||
| Thomas M. Kelley | 58 | Senior Vice President, Marketing | ||
| Anthony R. Kenney | 64 | President, Speedway LLC | ||
| D. Rick Linhardt(a) | 59 | Vice President, Tax | ||
| C. Michael Palmer | 64 | Senior Vice President, Supply, Distribution and Planning | ||
| Brian K. Partee(a) | 44 | Vice President, Business Development | ||
| John J. Quaid | 46 | Vice President and Controller | ||
| David R. Sauber | 54 | Senior Vice President, Human Resources, Health and Administrative Services | ||
| Donald C. Templin | 54 | President | ||
| Donald W. Wehrly(a) | 58 | Vice President and Chief Information Officer | ||
| David L. Whikehart(a) | 58 | Vice President, Environment, Safety and Corporate Affairs |
| (a) | Corporate officer. |
Mr. Heminger is chairman of the board and chief executive officer. He has served as the chairman of the board since April 2016 and as chief executive officer since 2011. Mr. Heminger also served as president from 2011 until 2017, and as president of Marathon Petroleum Company LP (formerly known as Marathon Ashland Petroleum LLC and Marathon Petroleum Company LLC), currently a wholly owned subsidiary of MPC and prior to the Spinoff, a wholly owned subsidiary of Marathon Oil. He assumed responsibility as president of Marathon Petroleum Company LP in September 2001.
Ms. Benson was appointed vice president, corporate secretary and chief compliance officer effective March 1, 2016. Prior to this appointment, Ms. Benson was assistant general counsel, corporate and finance beginning in April 2012, group counsel, corporate and finance beginning in 2011, group counsel, North American production for Marathon Oil Company beginning in 2010 and senior attorney, downstream business beginning in 2006.
Mr. Brooks was appointed senior vice president, Refining effective March 1, 2016. Prior to this appointment, Mr. Brooks was general manager, Galveston Bay refinery beginning in February 2013, general manager, Robinson refinery beginning in 2010 and general manager, St. Paul Park, Minnesota refinery (no longer owned by MPC) beginning in 2006.
Ms. Gagle was appointed vice president and general counsel effective March 1, 2016. Prior to this appointment, Ms. Gagle was assistant general counsel, litigation and Human Resources beginning in April 2011, senior group counsel, downstream operations beginning in 2010 and group counsel, litigation, beginning in 2003.
Mr. Griffith was appointed senior vice president and chief financial officer effective March 3, 2015. Prior to this appointment, Mr. Griffith served as vice president, Finance and Investor Relations, and treasurer beginning in January 2014. He was vice president of Finance and treasurer beginning in August 2011. Previously, Mr. Griffith was vice president Investor Relations and treasurer of Smurfit-Stone Container Corporation, a packaging manufacturer, in St. Louis, Missouri, from 2008 to 2011.
Mr. Kaczynski was appointed vice president, Finance and treasurer effective August 31, 2015. Prior to this appointment, Mr. Kaczynski was vice president and treasurer of Goodyear Tire and Rubber Company, one of the world’s largest tire manufacturers, beginning in 2014. Previously, he served as vice president, Investor Relations, of Goodyear Tire and Rubber Company beginning in 2013, vice president and corporate treasurer of Affinia Group Inc. beginning in 2005, and director of affiliate finance and of capital markets and bank relations of Visteon Corporation beginning in 2000.
Mr. Kelley was appointed senior vice president, Marketing effective June 30, 2011. Prior to this appointment, Mr. Kelley served in the same capacity for Marathon Petroleum Company LP beginning in January 2010. Previously, he served as director
of Crude Supply and Logistics for Marathon Petroleum Company LP beginning in January 2008, and as a Brand Marketing manager for eight years prior to that.
Mr. Kenney has served as president of Speedway LLC since August 2005. Prior to this appointment, Mr. Kenney served as vice president, Business Development of Marathon Ashland Petroleum LLC beginning in 2001.
Mr. Linhardt was appointed vice president, Tax effective February 1, 2018. Prior to this appointment, Mr. Linhardt served as director of Tax beginning in June 2017 and manager of Tax Compliance beginning in May 2013. Previously, he served as head of tax at RRI Energy, Inc., an energy service provider, beginning in 2009.
Mr. Palmer was appointed senior vice president, Supply, Distribution and Planning effective June 30, 2011. Prior to this appointment, Mr. Palmer served as vice president, Crude, Supply and Logistics for Marathon Petroleum Company LP beginning in June 2010. He served as director of Crude, Supply and Logistics beginning in February 2010, and as senior vice president, Oil Sands Operations and Commercial Activities for Marathon Oil Canada Corporation beginning in 2007.
Mr. Partee was appointed vice president, Business Development effective February 1, 2018. Prior to this appointment, Mr. Partee was director of Business Development beginning in January 2017. Previously, he was manager of crude oil logistics beginning in September 2014, vice president, Business Development and Franchise at Speedway beginning in November 2012 and commercial director for Speedway beginning in December 2009.
Mr. Quaid was appointed vice president and controller effective June 23, 2014. Prior to this appointment, Mr. Quaid was vice president of Iron Ore at United States Steel Corporation (“U. S. Steel”), an integrated steel producer, beginning in January 2014. Previously, Mr. Quaid served in various leadership positions at U. S. Steel since February 2002, including vice president and treasurer beginning in August 2011, controller, North American Flat-Rolled Operations beginning in July 2010 and assistant corporate controller beginning in 2008.
Mr. Sauber was appointed senior vice president, Human Resources, Health and Administrative services effective January 1, 2018. Prior to this appointment, Mr. Sauber served as vice president, Human Resources and Labor Relations beginning February 1, 2017. Previously he was vice president, Human Resources Policy, Benefits and Services of Shell Oil Company, a global energy and petrochemical company, beginning in 2013 and served in various leadership positions at Shell Oil Company since 2000 including regional Human Resources manager for U.S. manufacturing in 2009.
Mr. Templin was appointed president effective July 1, 2017. Prior to this appointment, Mr. Templin served as executive vice president beginning January 1, 2016, executive vice president, Supply, Transportation and Marketing beginning March 3, 2015 and senior vice president and chief financial officer beginning on June 30, 2011. Previously, he was a partner at PricewaterhouseCoopers LLP, an audit, tax and advisory services provider, with various audit and management responsibilities beginning in 1996.
Mr. Wehrly was appointed vice president and chief information officer effective June 30, 2011. Prior to this appointment, Mr. Wehrly was the manager of Information Technology Services for Marathon Petroleum Company LP beginning in 2003.
Mr. Whikehart was appointed vice president, Environment, Safety and Corporate Affairs effective February 29, 2016. Prior to this appointment, Mr. Whikehart served as vice president, Corporate Planning, Government & Public Affairs effective January 1, 2016 and director, Product Supply and Optimization beginning in March 2011. Previously, Mr. Whikehart served as director, Climate Change and Carbon Management beginning in 2010 and director, Business Development beginning in 2008.
Available Information
General information about MPC, including Corporate Governance Principles and Charters for the Audit Committee, Compensation Committee and Corporate Governance and Nominating Committee, can be found at
http://ir.marathonpetroleum.com. In addition, our Code of Business Conduct and Code of Ethics for Senior Financial Officers are also available in this same location.
MPC uses its website, www.marathonpetroleum.com, as a channel for routine distribution of important information, including news releases, analyst presentations, financial information and market data. Our Annual Report on Form 10-K, Quarterly Reports on Form 10-Q and Current Reports on Form 8-K, as well as any amendments and exhibits to those reports, are available free of charge through our website as soon as reasonably practicable after the reports are filed or furnished with the SEC. These documents are also available in hard copy, free of charge, by contacting our Investor Relations office. In addition, our website allows investors and other interested persons to sign up to automatically receive email alerts when we post news releases and financial information on our website. Information contained on our website is not incorporated into this Annual Report on Form 10-K or other securities filings.
Previous: Cover and table of contents · Next: Item 1A. Risk Factors