 filings.tools
Monolithic Power Systems 2019 10-K Annual Report
MPWR · CIK 1280452 · Form 10-K · Fiscal year ended December 31, 2019 · Filed February 28, 2020
Revenue rose 7.8% to $628 million. Operating margin was 16.3%, against 19.5% the year before. Net income was $109 million.
22 sections, 342K characters. Original on sec.gov · ·
| Measure | Year ended Dec 31, 2019 | Year ended Dec 31, 2018 | Change |
|---|---|---|---|
| Revenue | $628M | $582M | +7.8% |
| Operating income | $103M | $113M | -9.6% |
| Net income | $109M | $105M | +3.4% |
| Diluted EPS | $2.38 | $2.36 | +0.8% |
| Free cash flow* | $120M | $119M | +1.3% |
| Cash and equivalents | $173M | $173M | +0.1% |
| Operating margin* | 16.3% | 19.5% | -3.2 pts |
From the XBRL facts tagged to this filing; both columns are as reported in this filing. * Computed by filings.tools: free cash flow is operating cash flow less capital spending; operating margin is operating income over revenue.
Cover and table of contents
UNITED STATES
SECURITIES AND EXCHANGE COMMISSION
Washington, D.C. 20549
FORM 10-K
(Mark One)
| ☒ | ANNUAL REPORT PURSUANT TO SECTION 13 OR 15(d) OF THE SECURITIES EXCHANGE ACT OF 1934 |
|---|
For the fis****cal year ended December 31, 2019
or
| ☐ | TRANSITION REPORT PURSUANT TO SECTION 13 OR 15(d) OF THE SECURITIES EXCHANGE ACT OF 1934 |
|---|
Commission file number: 000-51026
Monolithic Power Systems, Inc.
(Exact name of registrant as specified in its charter)
| Delaware | 77-0466789 |
|---|---|
| (State or other jurisdiction of incorporation or organization) | (I.R.S. Employer Identification Number) |
5808 Lake Washington Blvd. NE, Kirkland, Washington 98033
(Address of principal executive offices)(Zip Code)
(425) 296-9956
(Registrant’s telephone number, including area code)
Securities registered pursuant to Section 12(b) of the Act:
| Title of each class | Trading Symbol | Name of each exchange on which registered | ||
|---|---|---|---|---|
| Common Stock, par value $0.001 per share | MPWR | The NASDAQ Global Select Market |
Securities registered pursuant to Section 12(g) of the Act: None
Indicate by check mark if the registrant is a well-known seasoned issuer, as defined in Rule 405 of the Securities Act. Yes ☒ No ☐
Indicate by check mark if the registrant is not required to file reports pursuant to Section 13 or Section 15(d) of the Act. Yes ☐ No ☒
Indicate by check mark whether the registrant (1) has filed all reports required to be filed by Section 13 or 15(d) of the Securities Exchange Act of 1934 during the preceding 12 months (or for such shorter period that the registrant was required to file such reports), and (2) has been subject to such filing requirements for the past 90 days. Yes ☒ No ☐
Indicate by check mark whether the registrant has submitted electronically every Interactive Data File required to be submitted pursuant to Rule 405 of Regulation S-T (§ 232.405 of this chapter) during the preceding 12 months (or for such shorter period that the registrant was required to submit such files). Yes ☒ No ☐
Indicate by check mark whether the registrant is a large accelerated filer, an accelerated filer, a non-accelerated filer, a smaller reporting company, or an emerging growth company. See the definitions of “large accelerated filer,” “accelerated filer,” “smaller reporting company,” and “emerging growth company” in Rule 12b-2 of the Exchange Act.
| Large accelerated filer ☒ | Accelerated filer ☐ |
|---|---|
| Non-accelerated filer ☐ | Smaller reporting company ☐ |
| Emerging growth company ☐ |
If an emerging growth company, indicate by check mark if the registrant has elected not to use the extended transition period for complying with any new or revised financial accounting standards provided pursuant to Section 13(a) of the Exchange Act. ☐
Indicate by check mark whether the registrant is a shell company (as defined in Rule 12b-2 of the Act). ☐ Yes ☒ No
The aggregate market value of the voting and non-voting common equity held by non-affiliates of the registrant, based upon the closing price of the common stock on the Nasdaq Global Select Market on June 28, 2019, was $4.3 billion.*
There were 44,602,000 shares of the registrant’s common stock issued and outstanding as of February 19, 2020.
DOCUMENTS INCORPORATED BY REFERENCE
Portions of the registrant’s Proxy Statement for the registrant’s 2020 Annual Meeting of Stockholders are incorporated by reference into Part III of this Annual Report on Form 10-K where indicated. The Proxy Statement will be filed with the Securities and Exchange Commission within 120 days of the registrant’s fiscal year ended December 31, 2019.
| * | Excludes 11,709,000 shares of the registrant’s common stock held by executive officers, directors and stockholders whose ownership exceeds 5% (“affiliates”) of the common stock outstanding at June 28, 2019. Exclusion of such shares should not be construed to indicate that any such person possesses the power, direct or indirect, to direct or cause the direction of the management or policies of the registrant or that such person is controlled by or under common control with the registrant. |
|---|
MONOLITHIC POWER SYSTEMS, INC.
TABLE OF CONTENTS
FORWARD-LOOKING STATEMENTS
This Annual Report on Form 10-K contains forward-looking statements within the meaning of Section 27A of the Securities Act of 1933, as amended, and Section 21E of the Securities Exchange Act of 1934, as amended, that have been made pursuant to and in reliance on the provisions of the Private Securities Litigation Reform Act of 1995. These statements include, among others, statements concerning:
| • | the above-average industry growth of product and market areas that we have targeted, | |
|---|---|---|
| • | our plan to increase our revenue through the introduction of new products within our existing product families as well as in new product categories and families, | |
| • | our belief that we may incur significant legal expenses that vary with the level of activity in each of our current or future legal proceedings, | |
| • | the effect that liquidity of our investments has on our capital resources, | |
| • | the continuing application of our products in the computing and storage, automotive, industrial, communications and consumer markets, | |
| • | estimates of our future liquidity requirements, | |
| • | the cyclical nature of the semiconductor industry, | |
| • | protection of our proprietary technology, | |
| • | business outlook for 2020 and beyond, | |
| • | the factors that we believe will impact our business, operations and financial condition, as well as our ability to achieve revenue growth, | |
| • | the percentage of our total revenue from various end markets, | |
| • | our ability to identify, acquire and integrate the companies, businesses and products that we acquire and achieve the anticipated benefits from such acquisitions, | |
| • | the impact of the U.S. Tax Cuts and Jobs Act enacted in December 2017 (the “2017 Tax Act”) and other tax laws on our income tax provision, financial position and cash flows, | |
| • | our plan to repatriate cash from our subsidiary in Bermuda, | |
| • | our intention and ability to pay future cash dividends and dividend equivalents, and | |
| • | the factors that differentiate us from our competitors. |
In some cases, words such as “would,” “could,” “may,” “should,” “predict,” “potential,” “targets,” “continue,” “anticipate,” “expect,” “intend,” “plan,” “believe,” “seek,” “estimate,” “project,” “forecast,” “will,” the negative of these terms or other variations of such terms and similar expressions relating to the future identify forward-looking statements. All forward-looking statements are based on our current outlook, expectations, estimates, projections, beliefs and plans or objectives about our business and our industry. These statements are not guarantees of future performance and are subject to risks and uncertainties. Actual events or results could differ materially and adversely from those expressed in any such forward-looking statements. Risks and uncertainties that could cause actual results to differ materially include those set forth throughout this Annual Report on Form 10-K and, in particular, in the section entitled “Item 1A. Risk Factors.” Except as required by law, we disclaim any duty to, and undertake no obligation to, update any forward-looking statements, whether as a result of new information relating to existing conditions, future events or otherwise or to release publicly the results of any future revisions we may make to forward-looking statements to reflect events or circumstances after the date hereof or to reflect the occurrence of unanticipated events. Readers are cautioned not to place undue reliance on such statements, which speak only as of the date of this Annual Report on Form 10-K. Readers should carefully review future reports and documents that we file from time to time with the Securities and Exchange Commission (“SEC”), such as our Annual Reports on Form 10-K, Quarterly Reports on Form 10-Q and any Current Reports on Form 8-K.
Except as the context otherwise requires, the terms “Monolithic Power Systems,” “MPS,” “Registrant,” “Company,” “we,” “us,” or “our” as used herein are references to Monolithic Power Systems, Inc. and its consolidated subsidiaries.
Item 1. BUSINESS
General
Monolithic Power Systems (“MPS”) is a leading semiconductor company that designs, develops and markets high-performance power solutions. Incorporated in 1997, MPS’s core strengths include deep system-level and applications knowledge, strong analog design expertise and innovative proprietary process technologies. These combined strengths enable MPS to deliver highly integrated monolithic products that offer energy efficient, cost-effective, easy-to-use solutions for systems found in computing and storage, automotive, industrial, communications and consumer applications. MPS’s mission is to reduce total energy consumption in its customers’ systems with green, practical and compact solutions.
Our principal executive office is located in Kirkland, Washington. We have over 2,000 employees worldwide, with locations in Asia (primarily in China, India, Japan, Korea, Singapore and Taiwan), Europe (primarily in France, Germany, Spain, Switzerland and the United Kingdom), and the United States.
Industry Overview
Semiconductors comprise the basic building blocks of electronic systems and equipment. Within the semiconductor industry, components can be classified either as discrete devices, such as individual transistors or integrated circuits (“ICs”), in which a number of transistors and other elements are combined to form a more complicated electronic circuit. ICs can be further divided into three primary categories: digital, analog, and mixed-signal. Digital ICs, such as memory devices and microprocessors, can store or perform arithmetic functions on data that is represented by a series of ones and zeroes. Analog ICs, in contrast, handle real world signals such as temperature, pressure, light, sound, or speed. In addition, analog ICs also perform power management functions, such as regulating or converting voltages, for electronic devices. Mixed-signal ICs combine digital and analog functions onto a single chip and play an important role in bridging real world to digital systems.
Analog and Mixed-Signal Markets. We focus on the market for high performance analog and mixed-signal ICs. High performance products generally are differentiated by functionality and performance factors, which include integration of higher levels of functionality onto a single chip, greater precision, higher speed and lower heat and noise. There are several key factors that distinguish the analog and mixed-signal IC markets from digital IC markets. These factors include longer product life cycles, numerous market segments, technology that is difficult to replicate, relative complexity of design and process technology, importance of experienced design engineers, lower capital requirements and diversity of end markets. We have targeted product and market areas that we believe have the ability to offer above-average growth over the long term compared to the semiconductor industry as a whole.
End Markets and Applications
We design and develop our products for the computing and storage, automotive, industrial, communications and consumer markets, with the computing and storage market representing the largest portion of our revenue in 2019. The following table is a summary of the various end market applications for our products, and those markets’ contribution as a percentage of our total revenue:
| Percentage of Total Revenue | |||||||||||||
|---|---|---|---|---|---|---|---|---|---|---|---|---|---|
| End Markets | Applications | 2019 | 2018 | 2017 | |||||||||
| Computing and storage | Storage, computers and notebooks, printers, servers and workstations | 30.1 | % | 27.3 | % | 21.4 | % | ||||||
| Automotive | Infotainment, safety and connectivity applications | 14.4 | % | 13.8 | % | 11.4 | % | ||||||
| Industrial | Power sources, security, point-of-sale systems, smart meters and other industrial equipment | 15.8 | % | 15.2 | % | 13.4 | % | ||||||
| Communications | Networking and telecommunication infrastructure, routers and modems, wireless access points and voice over IP | 13.5 | % | 12.1 | % | 13.5 | % | ||||||
| Consumer | Set-top boxes, monitors, gaming, lighting, chargers, home appliances, cellular handsets, digital video players, GPS, televisions, stereos and cameras | 26.2 | % | 31.6 | % | 40.3 | % |
Product Families
Our proprietary process technologies enable us to design and deliver smaller, single-chip power management ICs. These technologies simplify the design process, and are applicable across a wide range of analog applications within the computing and storage, automotive, industrial, communications and consumer markets. Our product families are differentiated with respect to their high degree of integration and strong levels of accuracy and efficiency, making them cost-effective relative to many competing solutions. Our key product families include the following:
Direct Current (“DC”) to DC Products. DC to DC ICs are used to convert and control voltages within a broad range of electronic systems, such as portable electronic devices, wireless LAN access points, computers, and monitors, automobiles and medical equipment. We believe that our DC to DC products are differentiated in the market, particularly with respect to their high degree of integration, high voltage operation, high load current, high switching speed and small footprint. These features are important to our customers as they result in fewer components, a smaller form factor, more accurate regulation of voltages, and, ultimately, lower system cost and increased reliability through the elimination of many discrete components and power devices. The DC to DC product family accounted for 94%, 92% and 92% of our total revenue in 2019, 2018 and 2017, respectively.
Lighting Control Products. Lighting control ICs are used in backlighting and general illumination products. Lighting control ICs for backlighting are used in systems that provide the light source for LCD panels typically found in notebook computers, monitors, car navigation systems and televisions. Backlighting solutions are typically either white light emitting diode lighting sources or cold cathode fluorescent lamps. The Lighting Control product family accounted for 6%, 8% and 8% of our total revenue in 2019, 2018 and 2017, respectively.
In the future, we plan to continue to introduce additional new products within our existing product families, as well as expand our newer product families. Our ability to achieve revenue growth will depend in part upon our ability to enter new market segments, gain market share, grow in regions outside of China, Taiwan and other Asian markets, expand our customer base and continue to secure manufacturing capacity.
Customers, Sales and Marketing
We sell our products through third-party distributors, value-added resellers and directly to original equipment manufacturers (“OEMs”), original design manufacturers (“ODMs”), and electronic manufacturing service (“EMS”) providers. Our third-party distributors are subject to distribution agreements with us, which allow the distributors to sell our products to end customers and other resellers, including OEMs, ODMs or EMS providers. Our value-added resellers may second source our products and provide other services to customers. ODMs typically design and manufacture electronic products on behalf of OEMs, and EMS providers typically provide manufacturing services for OEMs and other electronic product suppliers.
Sales to our largest distributor accounted for 23% of our total revenue in 2019, 22% in 2018, and 17% in 2017. In addition, one other distributor accounted for 10% of our total revenue in 2018 and one other distributor accounted for 10% of our total revenue in 2017. No other distributors or end customers accounted for more than 10% of our full-year, total revenue in any of the periods presented.
Current distribution agreements with several of our major distributors provide that each distributor has the non-exclusive right to sell and use its best efforts to promote and develop a market for our products. These agreements provide that payment for purchases from us will generally occur within 30 to 60 days from the date of invoice. In addition, we allow for limited stock rotation in certain agreements.
We have sales offices located in China, India, Japan, Korea, Singapore, Taiwan, the United States and throughout Europe. Our products typically require a highly technical sales and applications engineering effort where we assist our customers in the design and use of our products in their application. We maintain a staff of applications engineers who work directly with our customers’ engineers in the development of their systems’ electronics containing our products.
Because our sales are primarily billed and payable in United States dollars, our sales are generally not subject to fluctuating currency exchange rates. However, because a majority of our revenue is attributable to sales to customers in Asia, changes in the relative value of the dollar may create pricing pressures for our products. For the years ended December 31, 2019, 2018 and 2017, our revenue from sales to customers in Asia was 89%, 88% and 89%, respectively.
Our sales are made primarily pursuant to standard individual purchase orders. Our backlog consists of orders that we have received from customers which have not yet shipped. Because orders in backlog are subject to cancellation or postponement, and backlog at any particular date is not necessarily representative of actual sales for any succeeding period, we believe that our backlog is not necessarily a reliable indicator of future revenue.
Our manufacturing lead times are generally 8 to 16 weeks and we often build inventory in advance of customer orders based on our forecast of future customer orders. This subjects us to certain risks, most notably the possibility that sales will not meet our forecast, which could lead to inventories in excess of demand. If excess inventory exists, it may be necessary for us to sell it at a substantial discount, take a significant write-down or dispose of it altogether, all of which would negatively affect our profit margins. In addition, in response to market conditions, we may slow the rate of manufacturing our products, which could result in insufficient inventory levels if we underestimate the demand for our products.
We operate in the cyclical semiconductor industry where there is seasonal demand for certain of our products. While we are not immune from current and future industry downturns, we have targeted product and market areas that we believe have the ability to offer above average industry performance over the long term.
Research and Development
We have assembled a qualified team of engineers primarily in China, Spain, Taiwan and the United States, with core competencies in analog and mixed-signal design. Through our research and development efforts, we have developed a collection of intellectual property and know-how that we are able to leverage across our products and markets. These include the development of high efficiency power devices, the design of precision analog circuits, expertise in mixed-signal integration and the development of proprietary semiconductor process technologies.
Our research and development efforts are generally targeted at three areas: systems architecture, circuit design and implementation, and process technology. In the area of systems architecture, we are exploring new ways of solving our customers’ system design challenges and are investing in the development of systems expertise in new markets and applications that align well with our core capabilities. In the area of circuit design and implementation, our initiatives include expanding our portfolio of products and adding new features to our products. In the area of process technology, we are investing research and development resources to provide leading-edge analog power processes for our next generation of integrated circuits. Process technology is a key strategic component to our future growth.
Patents and Intellectual Property Matters
We rely on our proprietary technologies, which include both our proprietary circuit designs for our products and our proprietary manufacturing process technologies. Our future success and competitive position depend in part upon our ability to obtain and maintain protection of our proprietary technologies.
In general, we have elected to pursue patent protection for aspects of our circuit and device designs that we believe are patentable and to protect our manufacturing process technologies by maintaining those process technologies as trade secrets. As of December 31, 2019, we had 1,162 patents/applications issued or pending, of which 419 patents have been issued in the United States. Our issued patents are scheduled to expire at various times through December 2039. Our patents are material to our business, but we do not rely on any one particular patent for our success. We also rely on a combination of nondisclosure agreements and other contractual provisions, as well as our employees’ commitment to confidentiality and loyalty, to protect our technology, know-how and processes. We also seek to register certain of our trademarks as we deem appropriate. We have not registered any of our copyrights and do not believe registration of copyrights is material to our business. Despite precautions that we take, it may be possible for unauthorized third parties to copy aspects of our current or future technology or products or to obtain and use information that we regard as proprietary. There can be no assurance that the steps we take will be adequate to protect our proprietary rights, that our patent applications will lead to issued patents, that others will not develop or patent similar or superior products or technologies, or that our patents will not be challenged, invalidated or circumvented by others. Furthermore, the laws of the countries in which our products are or may be developed, manufactured or sold may not protect our products and intellectual property rights to the same extent as laws in the United States. Our failure to adequately protect our proprietary technologies could materially harm our business.
The semiconductor industry is characterized by frequent claims of infringement and litigation regarding patent and other intellectual property rights. Patent infringement is an ongoing risk, in part because other companies in our industry could have patent rights that may not be identifiable when we initiate development efforts. Litigation may be necessary to enforce our intellectual property rights, and we may have to defend ourselves against infringement claims. Any such litigation could be very costly and may divert our management resources. Further, we have agreed to indemnify certain of our customers and suppliers in some circumstances against liability from infringement by our products. In the event any third party were to make an infringement claim against us or our customers, we could be enjoined from selling selected products, could be required to indemnify our customers or suppliers, or could pay royalties or other damages to third parties. If any of our products are found to infringe and we are unable to obtain necessary licenses or other rights on acceptable terms, we would either have to change our product so that it does not infringe or stop making the infringing product, which could have a material adverse effect on our operating results, financial condition and cash flows.
Manufacturing
We utilize a fabless business model, working with third parties to manufacture and assemble our ICs. This fabless approach allows us to focus our engineering and design resources on our strengths and to reduce our fixed costs and capital expenditures. In contrast to many fabless semiconductor companies, which utilize standard process technologies and design rules established by their foundry partners, we have developed our own proprietary process technologies and collaborate with our foundry partners to install our technologies on their equipment in their facilities for use on our behalf. This close collaboration and control over the manufacturing process has historically resulted in favorable yields and product performance for our ICs.
We currently contract with six suppliers to manufacture our wafers in foundries located in China and Korea. Once our silicon wafers have been produced, they are shipped to our facility in Chengdu, China for wafer sort, which is a testing process performed to identify non-functioning dies. Our semiconductor products are then assembled and packaged by independent subcontractors in China and Malaysia. The assembled ICs are then sent either for final testing at our Chengdu facility, or to other turnkey providers who perform final testing based on our standards prior to shipping to our customers.
We have a 60,000 square-foot manufacturing facility located in Chengdu, China, which enables us to benefit from shorter manufacturing cycle times and lower labor and overhead costs. We have expanded our product testing capabilities in this facility and are able to take advantage of the rich pool of local engineering talent to expand our manufacturing support and engineering operations.
Key Personnel and Employees
Our performance is substantially dependent on the performance of our executive officers and key employees. Due to the relative complexity of the design of our analog and mixed-signal ICs, our engineers generally have more years of experience and greater circuit design aptitude than the more prevalent digital circuit design engineer does. Analog engineers with advanced skills are limited in number and difficult to replace. The loss of the services of key officers, managers, engineers and other technical personnel would materially harm our business. Our future success will depend, in part, on our ability to attract, train, retain, and motivate highly qualified technical and managerial personnel. We may not be successful in attracting and retaining such personnel. Our employees are not represented by a collective bargaining organization, and we have never experienced a work stoppage or strike. Our management considers employee relations to be good. As of December 31, 2019, we employed 2,002 employees primarily located in Asia, Europe and the United States, compared with 1,737 employees as of December 31, 2018.
Competition
The analog and mixed-signal semiconductor industry is highly competitive, and we expect competitive pressures to continue. Our ability to compete effectively and to expand our business will depend on our ability to continue to recruit both applications engineering and design engineering personnel, our ability to introduce new products, and our ability to maintain the rate at which we introduce these new products. Our industry is characterized by decreasing average selling prices over the life of a product. We compete with domestic and international semiconductor companies, many of which have substantially greater financial and other resources with which to pursue engineering, manufacturing, marketing, and distribution of their products and, in some cases, have a broader number of product offerings that may enable them to more effectively market and sell to customers. We are in direct and active competition, with respect to one or more of our product lines, with at least ten manufacturers of such products, of varying size and financial strength. We consider our primary competitors to include Analog Devices, Infineon Technologies, Maxim Integrated Products, NXP Semiconductors, ON Semiconductor, Power Integrations, Renesas Electronics, ROHM Semiconductor, Semtech and Texas Instruments.
We expect continued competition from existing competitors as well as competition from new entrants into the semiconductor market. We believe that we are competitive in the markets in which we sell, particularly because our ICs typically are smaller in size, are highly integrated, possess higher levels of power management functionalities and achieve high performance specifications at lower price points than most of our competition. However, there is no assurance that our products will continue to compete favorably or that we will be successful in the face of increasing competition from new products and enhancements introduced by existing competitors or new companies entering this market. In addition, there has recently been a high level of consolidation in the semiconductor industry. If these or future acquisitions are successful, competition may intensify and our competitors may have additional resources to compete against us.
Available Information
Our Annual Reports on Form 10-K, Quarterly Reports on Form 10-Q, current reports on Form 8-K, and amendments to those reports that are filed or furnished pursuant to Sections 13(a) or 15(d) of the Securities Exchange Act of 1934, as amended, are available free of charge. They may be obtained from our website at www.monolithicpower.com under “Investor Relations” as soon as reasonably practicable after we electronically file such documents with, or furnish them to, the SEC or at the SEC website at www.sec.gov. Information contained on our website is not a part of this Annual Report on Form 10-K.
Information About Executive Officers
Information regarding our executive officers as of February 28, 2020 is as follows:
| Name | Age | Position | ||
|---|---|---|---|---|
| Michael Hsing | 60 | President, Chief Executive Officer and Director | ||
| Bernie Blegen | 62 | Vice President and Chief Financial Officer | ||
| Deming Xiao | 57 | President of Asia Operations | ||
| Maurice Sciammas | 60 | Senior Vice President of Worldwide Sales and Marketing | ||
| Saria Tseng | 49 | Vice President, Strategic Corporate Development, General Counsel and Corporate Secretary |
Michael Hsing has served on our Board of Directors and has served as our President and Chief Executive Officer since founding MPS in August 1997. Prior to founding MPS, Mr. Hsing was a Senior Silicon Technology Developer at several analog IC companies, where he developed and patented key technologies, which set new standards in the power electronics industry. Mr. Hsing is an inventor on numerous patents related to the process development of bipolar mixed-signal semiconductor manufacturing. Mr. Hsing holds a B.S.E.E. from the University of Florida.
Bernie Blegen has served as our Chief Financial Officer since July 2016 and is responsible for finance, accounting, tax, treasury and investor relations. From August 2011 to June 2016, Mr. Blegen served as our Corporate Controller. Prior to joining MPS, Mr. Blegen held a number of executive finance and accounting positions for other publicly traded technology companies, including Xilinx, Inc. and Credence Systems. Mr. Blegen holds a B.A. from the University of California, Santa Barbara.
Deming Xiao has served as our President of Asia Operations since January 2008. Since joining us in May 2001, Mr. Xiao has held several executive positions, including Foundry Manager and Senior Vice President of Operations. Before joining MPS, from June 2000 to May 2001, Mr. Xiao was Engineering Account Manager at Chartered Semiconductor Manufacturing, Inc. Prior to that, Mr. Xiao spent six years as the Manager of Process Integration Engineering at Fairchild Imaging Sensors. Mr. Xiao holds a B.S. in Semiconductor Physics from Sichuan University, Chengdu, China and an M.S.E.E. from Wayne State University.
Maurice Sciammas has served as our Senior Vice President of Worldwide Sales and Marketing since 2007. Mr. Sciammas joined MPS in July 1999 and served as Vice President of Products and Vice President of Sales (excluding greater China) until he was appointed to his current position. Before joining MPS, he was Director of IC Products at Supertex from 1990 to 1999. He has also held positions at Micrel, Inc. He holds a B.S.E.E. degree from San Jose State University.
Saria Tseng has served as our Vice President, General Counsel and Corporate Secretary since 2004 and additionally as our Vice President, Strategic Corporate Development since 2009. Ms. Tseng joined the Company from MaXXan Systems, Inc., where she was Vice President and General Counsel from 2001 to 2004. Previously, Ms. Tseng was an attorney at Gray Cary Ware & Freidenrich, LLP and Jones, Day, Reavis & Pogue. Ms. Tseng is a member of the state bar in both California and New York and is a member of the bar association of the Republic of China (Taiwan). Ms. Tseng currently serves on the Board of Directors of Super Micro Computer, Inc., a global leader in high performance server technology. Ms. Tseng holds Masters of Law degrees from the University of California at Berkeley and the Chinese Culture University in Taipei.
Item 1A. RISK FACTORS
Our business involves numerous risks and uncertainties. You should carefully consider the risks described below, together with all of the other information in this Annual Report on Form 10-K and other filings with the SEC in evaluating our business. If any of the following risks actually occur, our business, financial condition, operating results, and growth prospects would likely be materially and adversely affected. In such an event, the trading price of our common stock could decline, and you could lose all or part of your investment in our common stock. Our past financial performance should not be considered to be a reliable indicator of future performance, and investors should not use historical trends to anticipate results or trends in future periods. These risks involve forward-looking statements and our actual results may differ substantially from those discussed in these forward-looking statements.
The future trading price of our common stock could be subject to wide fluctuations in response to a variety of factors.
The future trading price of our common stock is likely to be highly volatile and could be subject to wide fluctuations in response to various factors, many of which are beyond our control, including:
| • | actual or anticipated results of operations and financial performance; |
|---|
| • | general economic, industry and market conditions worldwide; |
|---|---|
| • | our ability to outperform the market and outperform at a level that meets or exceeds our investors’ expectations; |
| • | whether our guidance meets the expectations of our investors; |
| • | the breath and liquidity of the market for our common stock; |
| • | developments generally affecting the semiconductor industry; |
| • | commencement of or developments relating to our involvement in litigation; |
| • | investor perceptions of us and our business strategies; |
| • | changes in securities analysts’ expectations or our failure to meet those expectations; |
| • | actions by institutional or other large stockholders; |
| • | terrorist acts or acts of war; |
| • | epidemics and illnesses, such as the COVID-19 outbreak first identified in China in December 2019; |
| • | trading activity in our common stock, including short positions; |
| • | actual or anticipated manufacturing capacity limitations; |
| • | developments with respect to intellectual property rights; |
| • | introduction of new products by us or our competitors; |
| • | our sale of common stock or other securities in the future; |
| • | conditions and trends in technology industries; |
| • | our loss of key customers; |
| • | changes in market valuation or earnings of our competitors; |
| • | any mergers, acquisitions or divestitures of assets undertaken by us; |
| • | government debt default; |
| • | changes in corporate tax laws; |
| • | government policies and regulations on international trade policies and restrictions, including tariffs on imports of foreign goods; |
|---|---|
| • | export controls, trade and economic sanctions and regulations, and other regulatory or contractual limitations on our ability to sell or develop our products in certain foreign markets, particularly in China; |
| • | our ability to obtain governmental licenses and approvals for international trading activities or technology transfers, including export licenses; |
| • | our ability to develop new products, enter new market segments, gain market share, manage litigation risk, diversify our customer base and successfully secure manufacturing capacity; |
|---|---|
| • | our ability to increase our gross margins; |
| • | our ability to accurately forecast future demand for our products; |
| • | market reactions to guidance from other semiconductor companies or third-party research groups; |
| • | market reactions to merger and acquisition activities in the semiconductor industry, and rumors or expectations of further consolidation in the industry; |
|---|---|
| • | investments in sales and marketing resources to enter new markets; |
| • | costs of increasing wafer capacity and qualifying additional third-party wafer fabrication facilities; |
| • | cyber attacks or other system security, data protection and privacy breaches; |
| • | our ability to pay quarterly cash dividends to stockholders; and |
| • | changes in the estimation of the future size and growth rate of our markets. |
In addition, the stock market often experiences substantial volatility that may be unrelated to the operating performance of particular companies. These broad market fluctuations may adversely affect the trading price of our common stock.
We expect our operating results to fluctuate from quarter to quarter and year over year, which may make it difficult to predict our future performance and could cause our stock price to decline and be volatile.
Our revenue, expenses, and results of operations are difficult to predict, have varied significantly in the past and will continue to fluctuate significantly in the future due to a number of factors, many of which are beyond our control. We expect fluctuations to continue for a number of reasons, including:
| • | changes in general demand for electronic products as a result of worldwide macroeconomic conditions; |
|---|---|
| • | changes in business conditions at our distributors, value-added resellers and/or end-customers; |
| • | changes in general economic conditions in the countries where our products are sold or used; |
| • | adverse changes in laws and government regulations, such as tariffs on imports of foreign goods, export regulations and export classifications, including in foreign countries where we have offices or operations; |
| • | the timing of developments and related expenses in our litigation matters; |
| • | the loss of key customers or our inability to attract new customers due to customer and prospective customer concerns about being litigation targets; |
| • | continued dependence on turns business (orders received and shipped within the same fiscal quarter); |
| • | continued dependence on the Asian markets for our customer base; |
| • | increases in assembly costs due to commodity price increases, such as the price of gold; |
| • | the timing of new product introductions by us and our competitors; |
| • | changes in our revenue mix between OEMs, ODMs, distributors and value-added resellers; |
| • | changes in product mix, product returns, and actual and potential product liability; |
| • | the acceptance of our new products in the marketplace; |
| • | our ability to develop new process technologies and achieve volume production; |
|---|---|
| • | our ability to meet customer product demand in a timely manner; |
| • | the scheduling, rescheduling, or cancellation of orders by our customers; |
|---|---|
| • | the cyclical nature of demand for our customers’ products; |
| • | fluctuations in our estimate for stock rotation reserves; |
| • | our ability to manage our inventory levels, including the levels of inventory held by our distributors; |
| • | our ability to accurately assess the impact of market conditions on the demand for our products; |
| • | product obsolescence; |
| • | seasonality and variability in the computing and storage, automotive, industrial, communications and consumer markets; |
| • | the availability of adequate manufacturing capacity from our outside suppliers; |
| • | increases in prices for finished wafers due to general capacity shortages; |
| • | the potential loss of future business resulti
Showing the first 8K of 87K characters. Open the full section
Item 1B. UNRESOLVED STAFF COMMENTS
None.
Item 2. PROPERTIES
The following table summarizes our significant properties as of December 31, 2019:
| Location | Approximate Building Square Footage | Primary Use | |||
|---|---|---|---|---|---|
| Owned: | |||||
| United States: | |||||
| Kirkland, Washington | 98,000 | Principal executive office, research and development, sales and marketing | |||
| Livonia, Michigan | 40,000 | Sales and marketing, research and development | |||
| San Jose, California | 106,000 | Research and development, sales and marketing, administrative | |||
| International: | |||||
| Chengdu, China | 150,000 | Research and development, administrative | |||
| Chengdu, China | 60,000 | Testing and manufacturing | |||
| Hangzhou, China | 68,000 | Research and development | |||
| Shanghai, China | 23,000 | Sales and marketing | |||
| Shenzhen, China | 8,000 | Sales and marketing | |||
| Taipei, Taiwan | 47,000 | Sales and marketing, research and development | |||
| Leased: | |||||
| Chengdu, China | 89,000 | Manufacturing operations, inventory warehouse | |||
| Barcelona, Spain | 12,000 | Research and development |
We also lease other sales and marketing, and research and development offices in Asia, Europe and the United States. We believe that our existing facilities are adequate for our current operations.
Item 3. LEGAL PROCEEDINGS
We are a party to actions and proceedings in the ordinary course of business, including potential litigation initiated by our stockholders, challenges to the enforceability or validity of our intellectual property, claims that our products infringe on the intellectual property rights of others, and employment matters. These proceedings often involve complex questions of fact and law and may require the expenditure of significant funds and the diversion of other resources to prosecute and defend. We defend ourselves vigorously against any such claims. As of December 31, 2019, there were no material pending legal proceedings to which we were a party.
Item 4. MINE SAFETY DISCLOSURES
Item 5. Market for Registrant’s Common Equity, Related Stockholder Matters and Issuer Purchases of Equity Securities.
Common Stock Information
Our common stock is traded on the Nasdaq Global Select Market under the symbol “MPWR.”
Holders of Common Stock
As of February 19, 2020, there were 23 registered holders of record of our common stock. A substantially greater number of holders of our common stock are “street name” or beneficial holders, whose shares are held by banks, brokers and other financial institutions on their behalf.
Dividend Policy
We currently have a dividend program approved by our Board of Directors, pursuant to which we intend to pay quarterly cash dividends on our common stock. Based on our historical practice, stockholders of record as of the last business day of the quarter are entitled to receive the quarterly cash dividends when and if declared by our Board of Directors, which are payable to the stockholders in the following month.
The declaration of any future cash dividends is at the discretion of our Board of Directors and will depend on, among other things, our financial condition, results of operations, capital requirements, business conditions and other factors that our Board of Directors may deem relevant, as well as a determination that cash dividends are in the best interests of the stockholders.
Stock Performance Graph
The following graph compares the cumulative five-year total return on our common stock relative to the cumulative total returns of the Nasdaq Composite Index and the PHLX Semiconductor Sector Index. An investment of $100 is assumed to have been made in our common stock on December 31, 2014 and its performance relative to the performance of a similar investment in the two indexes is shown through December 31, 2019, assuming the reinvestment of dividends. Historic stock performance is not indicative of future performance.
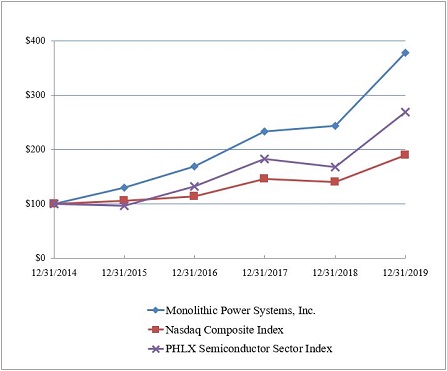
The information contained in this stock performance graph section shall not be deemed to be “soliciting material,” or “filed” or incorporated by reference in future filings with the SEC, or subject to the liabilities of Section 18 of the Securities Exchange Act of 1934, except to the extent that we specifically incorporate it by reference into a document filed under the Securities Act of 1933 or the Securities Exchange Act of 1934.
Item 6. SELECTED FINANCIAL DATA
The following selected consolidated financial data should be read in conjunction with “Management’s Discussion and Analysis of Financial Condition and Results of Operations” and the consolidated financial statements and the notes thereto included elsewhere in this Annual Report on Form 10-K to fully understand factors that may affect the comparability of the information presented below. We derived the selected consolidated balance sheet data as of December 31, 2019 and 2018, and the consolidated statement of operations data for the years ended December 31, 2019, 2018 and 2017 from our audited consolidated financial statements and accompanying notes included in this Annual Report on Form 10-K. The consolidated balance sheet data as of December 31, 2017, 2016 and 2015, and the consolidated statement of operations data for the years ended December 31, 2016 and 2015 are derived from our audited consolidated financial statements which are not included in this report. Operating results for any year are not necessarily indicative of results to be expected for any future periods.
Consolidated Statement of Operations Data:
| Year Ended December 31, | ||||||||||||||||||||
|---|---|---|---|---|---|---|---|---|---|---|---|---|---|---|---|---|---|---|---|---|
| 2019 | 2018 | 2017 | 2016 | 2015 | ||||||||||||||||
| (in thousands, except per share amounts) | ||||||||||||||||||||
| Revenue | $ | 627,921 | $ | 582,382 | $ | 470,929 | $ | 388,665 | $ | 333,067 | ||||||||||
| Cost of revenue | 281,596 | 259,714 | 212,646 | 177,792 | 152,898 | |||||||||||||||
| Gross profit | 346,325 | 322,668 | 258,283 | 210,873 | 180,169 | |||||||||||||||
| Operating expenses: | ||||||||||||||||||||
| Research and development | 107,757 | 93,455 | 82,359 | 73,643 | 65,787 | |||||||||||||||
| Selling, general and administrative | 133,542 | 113,803 | 97,257 | 83,012 | 72,312 | |||||||||||||||
| Litigation expense (benefit), net | 2,464 | 1,922 | 1,243 | (229 | ) | 1,000 | ||||||||||||||
| Total operating expenses | 243,763 | 209,180 | 180,859 | 156,426 | 139,099 | |||||||||||||||
| Income from operations | 102,562 | 113,488 | 77,424 | 54,447 | 41,070 | |||||||||||||||
| Interest and other income, net | 10,558 | 4,994 | 5,520 | 2,817 | 1,421 | |||||||||||||||
| Income before income taxes | 113,120 | 118,482 | 82,944 | 57,264 | 42,491 | |||||||||||||||
| Income tax expense | 4,281 | 13,214 | 17,741 | 4,544 | 7,319 | |||||||||||||||
| Net income | $ | 108,839 | $ | 105,268 | $ | 65,203 | $ | 52,720 | $ | 35,172 | ||||||||||
| Net income per share: | ||||||||||||||||||||
| Basic | $ | 2.52 | $ | 2.49 | $ | 1.58 | $ | 1.30 | $ | 0.89 | ||||||||||
| Diluted | $ | 2.38 | $ | 2.36 | $ | 1.50 | $ | 1.26 | $ | 0.86 | ||||||||||
| Weighted-average shares outstanding: | ||||||||||||||||||||
| Basic | 43,165 | 42,247 | 41,350 | 40,436 | 39,470 | |||||||||||||||
| Diluted | 45,763 | 44,602 | 43,578 | 41,915 | 40,869 | |||||||||||||||
| Cash dividends declared per common share | $ | 1.60 | $ | 1.20 | $ | 0.80 | $ | 0.80 | $ | 0.80 |
Consolidated Balance Sheet Data:
| December 31, | ||||||||||||||||||||
|---|---|---|---|---|---|---|---|---|---|---|---|---|---|---|---|---|---|---|---|---|
| 2019 | 2018 | 2017 | 2016 | 2015 | ||||||||||||||||
| (in thousands) | ||||||||||||||||||||
| Cash and cash equivalents | $ | 172,960 | $ | 172,704 | $ | 82,759 | $ | 112,703 | $ | 90,860 | ||||||||||
| Short-term investments | $ | 282,437 | $ | 204,577 | $ | 216,331 | $ | 155,521 | $ | 144,103 | ||||||||||
| Total assets | $ | 956,375 | $ | 793,432 | $ | 652,569 | $ | 511,126 | $ | 431,285 | ||||||||||
| Common stock and additional paid-in capital | $ | 549,517 | $ | 450,908 | $ | 376,586 | $ | 315,969 | $ | 265,763 | ||||||||||
| Total stockholders' equity | $ | 773,491 | $ | 640,093 | $ | 522,007 | $ | 431,116 | $ | 368,516 | ||||||||||
| Working capital | $ | 556,981 | $ | 500,371 | $ | 383,253 | $ | 330,063 | $ | 288,645 |
Item 7. MANAGEMENT’S DISCUSSION AND ANALYSIS OF FINANCIAL CONDITION AND RESULTS OF OPERATIONS
The following discussion should be read in conjunction with the consolidated financial statements and related notes which appear under Item 8 in this Annual Report on Form 10-K.
Overview
We are a leading semiconductor company that designs, develops and markets high-performance power solutions. Incorporated in 1997, MPS’s core strengths include deep system-level and applications knowledge, strong analog design expertise and an innovative proprietary process technology. These combined strengths enable MPS to deliver highly integrated monolithic products that offer energy-efficient, cost-effective, easy-to-use solutions for systems found in computing and storage, automotive, industrial, communications and consumer applications. Our mission is to reduce total energy consumption in our customers’ systems with green, practical and compact solutions. We believe that we differentiate ourselves by offering solutions that are more highly integrated, smaller in size, more energy-efficient, more accurate with respect to performance specifications and, consequently, more cost-effective than many competing solutions. We plan to continue to introduce new products within our existing product families, as well as in new innovative product categories.
We operate in the cyclical semiconductor industry where there is seasonal demand for certain products. We are not immune from current and future industry downturns, but we have targeted product and market areas that we believe have the ability to offer above average industry performance over the long term.
We work with third parties to manufacture and assemble our ICs. This has enabled us to limit our capital expenditures and fixed costs, while focusing our engineering and design resources on our core strengths.
Following the introduction of a product, our sales cycle generally takes a number of quarters after we receive an initial customer order for a new product to ramp up. Typical lead times for orders are generally 8 to 16 weeks. These factors, combined with the fact that orders in the semiconductor industry can typically be cancelled or rescheduled without significant penalty to the customer, make the forecasting of our orders and revenue difficult.
We derive most of our revenue from sales through distribution arrangements and direct sales to customers in Asia, where our products are incorporated into end-user products. Our revenue from direct or indirect sales to customers in Asia was 89%, 88% and 89% for the years ended December 31, 2019, 2018 and 2017, respectively. We derive a majority of our revenue from the sales of our DC to DC converter products which serve the computing and storage, automotive, industrial, communications and consumer markets. We believe our ability to achieve revenue growth will depend, in part, on our ability to develop new products, enter new market segments, gain market share, manage litigation risk, diversify our customer base and continue to secure manufacturing capacity.
Critical Accounting Policies and Estimates
Our discussion and analysis of our financial condition and results of operations are based upon our consolidated financial statements, which have been prepared in accordance with generally accepted accounting principles in the U.S. The preparation of these financial statements requires us to make estimates and judgments that affect the reported amount of assets, liabilities, revenue and expenses, and related disclosure of contingent assets and liabilities. We evaluate our estimates on an on-going basis, including those related to revenue recognition, stock-based compensation, inventories, income taxes and contingencies. We base our estimates on historical experience and on various other assumptions that are believed to be reasonable under the circumstances, the results of which form the basis for making the judgments about the carrying values of assets and liabilities that are not readily apparent from other sources. Estimates and judgments used in the preparation of our financial statements are, by their nature, uncertain and unpredictable, and depend upon, among other things, many factors outside of our control, such as demand for our products and economic conditions. Accordingly, our estimates and judgments may prove to be incorrect and actual results may differ, perhaps significantly, from these estimates.
We believe the following critical accounting policies reflect our more significant judgments used in the preparation of our consolidated financial statements.
Revenue Recognition
We generate revenue primarily from product sales, which include assembled and tested integrated circuits, as well as dies in wafer form. These product sales were 99%, 98% and 98% of our total revenue for the years ended December 31, 2019, 2018 and 2017, respectively. The remaining revenue primarily includes royalty revenue from licensing arrangements and revenue from wafer testing services performed for third parties, which have not been significant in all periods presented.
We recognize revenue from product sales when we satisfy a performance obligation by transferring control of the promised goods or services to our customers, in an amount that reflects the consideration we expect to be entitled to in exchange for those goods or services.
Product sales consist of a single performance obligation that we satisfy at a point in time. We recognize product revenue from distributors and direct end customers when the following events have occurred: (a) we have transferred physical possession of the products, (b) we have a present right to payment, (c) the customer has legal title to the products, and (d) the customer bears significant risks and rewards of ownership of the products. In accordance with the shipping terms specified in the contracts, these criteria are generally met when the products are shipped from our facilities (such as the “Ex Works” shipping term) or delivered to the customers’ locations (such as the “Delivered Duty Paid” shipping term).
Under certain consignment agreements, revenue is not recognized when the products are shipped and delivered to be held at customers’ designated locations because we continue to control the products and retain ownership, and the customers do not have an unconditional obligation to pay. We recognize revenue when the customers consume the products from the consigned inventory locations or, in some cases, after a 60-day period from the delivery date has passed, at which time control transfers to the customers and we invoice them for payment.
We account for price adjustment and stock rotation rights as variable consideration that reduces the transaction price, and recognize that reduction in the same period the associated revenue is recognized. Three U.S.-based distributors have price adjustment rights when they sell our products to their end customers at a price that is lower than the distribution price invoiced by us. When we receive claims from the distributors that products have been sold to the end customers at the lower price, we issue the distributors credit memos for the price adjustments. We estimate the price adjustments using the expected value method based on an analysis of historical claims, at both the distributor and product level, as well as an assessment of any known trends of product sales mix. Other U.S. distributors and non-U.S. distributors, which make up the majority of our total sales to distributors, do not have price adjustment rights. We record a credit against accounts receivable for the estimated price adjustments, with a corresponding reduction to revenue.
Certain distributors have limited stock rotation rights that permit the return of a small percentage of the previous six months’ purchases in accordance with the contract terms. We estimate the stock rotation returns using the expected value method based on an analysis of historical returns, and the current level of inventory in the distribution channel. We record a liability for the stock rotation reserve, with a corresponding reduction to revenue. In addition, we recognize an asset for product returns which represents the right to recover products from the customers related to stock rotations, with a corresponding reduction to cost of revenue.
We pay sales commissions based on the achievement of pre-determined product sales targets. We have elected the practical expedient to expense sales commissions as incurred because the amortization period would have been one year or less.
Inventory Valuation
We value our inventories at the lower of the standard cost (which approximates actual cost on a first-in, first-out basis) or their current estimated net realizable value. We write down excess and obsolete inventories based on assumptions about future demand and market conditions. If actual demand or market conditions are less favorable than those projected by management, additional inventory write-downs may be required. Conversely, if actual demand or market conditions are more favorable, inventories may be sold that were previously written down.
Accounting for Income Taxes
We recognize federal, state and foreign current tax liabilities or assets based on our estimate of taxes payable or refundable in the current fiscal year by tax jurisdiction. We also recognize federal, state and foreign deferred tax assets or liabilities for our estimate of future tax effects attributable to temporary differences and carryforwards. We record a valuation allowance to reduce any deferred tax assets by the amount of any tax benefits that, based on available evidence and judgment, are not expected to be realized.
Our calculation of current and deferred tax assets and liabilities is based on certain estimates and judgments and involves dealing with uncertainties in the application of complex tax laws. Our estimates of current and deferred tax assets and liabilities may change based, in part, on added certainty, finality or uncertainty to an anticipated outcome, changes in accounting or tax laws in the U.S. or foreign jurisdictions where we operate, or changes in other facts or circumstances. In addition, we recognize liabilities for potential U.S. and foreign income tax for uncertain income tax positions taken on our tax returns if it has less than a 50% likelihood of being sustained. If we determine that payment of these amounts is unnecessary or if the recorded tax liability is less than our current assessment, we may be required to recognize an income tax benefit or additional income tax expense in our financial statements in the period such determination is made. We have calculated our uncertain tax positions which were attributable to certain estimates and judgments.
As of December 31, 2019 and 2018, we had a valuation allowance of $15.4 million and $13.0 million, respectively, attributable to management’s determination that it is more likely than not that certain deferred tax assets will not be fully realized. In the event we determine that it is more likely than not that we would be able to realize the deferred tax assets in the future in excess of our net recorded amount, an adjustment to the valuation allowance for the deferred tax assets would increase income in the period such determination was made. Likewise, should it be determined that additional amounts of the net deferred tax assets will not be realized in the future, an adjustment to increase the deferred tax assets valuation allowance will be charged to income in the period such determination is made.
Contingencies
We are a party to actions and proceedings in the ordinary course of business, including potential litigation regarding our stockholders and our intellectual property, challenges to the enforceability or validity of our intellectual property, claims that our products infringe on the intellectual property rights of others, and employment matters. The pending proceedings involve complex questions of fact and law and will require the expenditure of significant funds and the diversion of other resources to prosecute and defend. In addition, from time to time, we become aware that we are subject to other contingent liabilities. When this occurs, we will evaluate the appropriate accounting for the potential contingent liabilities to determine whether a contingent liability should be recorded. In making this determination, management may, depending on the nature of the matter, consult with internal and external legal counsel and technical experts. Based on the facts and circumstances in each matter, we use our judgment to determine whether it is probable that a contingent loss has occurred and whether the amount of such loss can be estimated. If we determine a loss is probable and estimable, we record a contingent loss. In determining the amount of a contingent loss, we take into account advice received from experts for each specific matter regarding the status of legal proceedings, settlement negotiations, prior case history and other factors. Should the judgments and estimates made by management need to be adjusted as additional information becomes available, we may need to record additional contingent losses that could materially and adversely impact our results of operations. Alternatively, if the judgments and estimates made by management are adjusted, for example, if a particular contingent loss does not occur, the contingent loss recorded would be reversed which could result in a favorable impact on our results of operations.
Stock-Based Compensation
We measure the cost of employee services received in exchange for an award of equity instruments based on the grant-date fair value of the award. The fair value of RSUs with service conditions or performance conditions is based on the grant date share price. The fair value of shares issued under the employee stock purchase plan (“ESPP”) and RSUs with a purchase price feature is estimated using the Black-Scholes model. The fair value of RSUs with market conditions, as well as RSUs containing both market and performance conditions, is estimated using a Monte Carlo simulation model.
Compensation expense related to awards with service conditions is recorded on a straight-line basis over the requisite service period. Compensation expense related to awards subject to market or performance conditions is recognized over the requisite service period for each separately vesting tranche. For awards with only market conditions, compensation expense is not reversed if the market conditions are not satisfied. For awards with performance conditions, as well as awards containing both market and performance conditions, we recognize compensation expense when the performance goals are achieved, or when it becomes probable that the performance goals will be achieved. Management performs the probability assessment on a quarterly basis by reviewing external factors, such as macroeconomic conditions and the analog industry revenue forecasts, and internal factors, such as our business and operational objectives and revenue forecasts. Changes in the probability assessment of achievement of the performance conditions are accounted for in the period of change by recording a cumulative catch-up adjustment as if the new estimate had been applied since the service inception date. If the projected achievement was revised upward or if the actual results were higher than the projected achievement, additional compensation expense would be recorded for the awards due to the cumulative catch-up adjustment, which would have an adverse impact on our results of operations. Conversely, if the projected achievement was revised downward or if the actual results were lower than the projected achievement, previously accrued compensation expense would be reversed for the awards, which would have a favorable impact on our results of operations. As a result, our stock-based compensation expense is subject to volatility and may fluctuate significantly each quarter due to changes in our probability assessment of achievement of the performance conditions or actual results being different from projections made by management.
We account for forfeitures of equity awards when they occur.
Recent Accounting Pronouncements
Refer to Note 1 to our consolidated financial statements regarding recently adopted accounting pronouncements and recent accounting pronouncements not yet adopted as of December 31, 2019.
Results of Operations
The following table summarizes our results of operations:
| Year Ended December 31, | ||||||||||||||||||||||||
|---|---|---|---|---|---|---|---|---|---|---|---|---|---|---|---|---|---|---|---|---|---|---|---|---|
| 2019 | 2018 | 2017 | ||||||||||||||||||||||
| (in thousands, except percentages) | ||||||||||||||||||||||||
| Revenue | $ | 627,921 | 100.0 | % | $ | 582,382 | 100.0 | % | $ | 470,929 | 100.0 | % | ||||||||||||
| Cost of revenue | 281,596 | 44.8 | 259,714 | 44.6 | 212,646 | 45.2 | ||||||||||||||||||
| Gross profit | 346,325 | 55.2 | 322,668 | 55.4 | 258,283 | 54.8 | ||||||||||||||||||
| Operating expenses: | ||||||||||||||||||||||||
| Research and development | 107,757 | 17.2 | 93,455 | 16.0 | 82,359 | 17.5 | ||||||||||||||||||
| Selling, general and administrative | 133,542 | 21.3 | 113,803 | 19.5 | 97,257 | 20.7 | ||||||||||||||||||
| Litigation expense | 2,464 | 0.4 | 1,922 | 0.4 | 1,243 | 0.2 | ||||||||||||||||||
| Total operating expenses | 243,763 | 38.9 | 209,180 | 35.9 | 180,859 | 38.4 | ||||||||||||||||||
| Income from operations | 102,562 | 16.3 | 113,488 | 19.5 | 77,424 | 16.4 | ||||||||||||||||||
| Interest and other income, net | 10,558 | 1.7 | 4,994 | 0.9 | 5,520 | 1.2 | ||||||||||||||||||
| Income before income taxes | 113,120 | 18.0 | 118,482 | 20.4 | 82,944 | 17.6 | ||||||||||||||||||
| Income tax expense | 4,281 | 0.7 | 13,214 | 2.3 | 17,741 | 3.8 | ||||||||||||||||||
| Net income | $ | 108,839 | 17.3 | % | $ | 105,268 | 18.1 | % | $ | 65,203 | 13.8 | % |
Revenue
The following table summarizes our revenue by end market:
| Year Ended December 31, | Change | |||||||||||||||||||||||||||||||
|---|---|---|---|---|---|---|---|---|---|---|---|---|---|---|---|---|---|---|---|---|---|---|---|---|---|---|---|---|---|---|---|---|
| End Market | 2019 | % of Revenue | 2018 | % of Revenue | 2017 | % of Revenue | From 2018 to 2019 | From 2017 to 2018 | ||||||||||||||||||||||||
| (in thousands, except percentages) | ||||||||||||||||||||||||||||||||
| Computing and storage | $ | 189,215 | 30.1 | % | $ | 159,121 | 27.3 | % | $ | 100,782 | 21.4 | % | 18.9 | % | 57.9 | % | ||||||||||||||||
| Automotive | 90,303 | 14.4 | 80,078 | 13.8 | 53,888 | 11.4 | 12.8 | % | 48.6 | % | ||||||||||||||||||||||
| Industrial | 99,381 | 15.8 | 88,472 | 15.2 | 62,896 | 13.4 | 12.3 | % | 40.7 | % | ||||||||||||||||||||||
| Communications | 84,794 | 13.5 | 70,589 | 12.1 | 63,606 | 13.5 | 20.1 | % | 11.0 | % | ||||||||||||||||||||||
| Consumer | 164,228 | 26.2 | 184,122 | 31.6 | 189,757 | 40.3 | (10.8 | )% | (3.0 | )% | ||||||||||||||||||||||
| Total | $ | 627,921 | 100.0 | % | $ | 582,382 | 100.0 | % | $ | 470,929 | 100.0 | % | 7.8 | % | 23.7 | % |
Revenue for the year ended December 31, 2019 was $627.9 million, an increase of $45.5 million, or 7.8%, from $582.4 million for the year ended December 31, 2018. This increase was driven by higher sales in all of our end markets except for the consumer market. Overall unit shipments increased by 8% due to higher market demand and average sales prices were essentially flat compared to the same period in 2018.
For the year ended December 31, 2019, revenue from the communications market increased $14.2 million, or 20.1%, from the same period in 2018. This increase was primarily driven by higher demand in infrastructure sales including the 5G network. Revenue from the computing and storage market increased $30.1 million, or 18.9%, from the same period in 2018. This increase was primarily driven by strength in the high-performance notebook and cloud computing markets, which was partially offset by lower demand in the solid-state drive storage market. Revenue from the automotive market increased $10.2 million, or 12.8%, from the same period in 2018. This increase was primarily driven by higher sales of products for infotainment applications. Revenue from the industrial market increased $10.9 million, or 12.3%, from the same period in 2018. This increase was primarily driven by higher sales in power source and security products. Revenue from the consumer market decreased $19.9 million, or 10.8%, from the same period in 2018. This decrease was primarily due to a decrease in demand for high volume consumer-related products, as well as lower sales from specialty lighting, chargers and gaming products. This decrease was partially offset by higher demand for wearables and home appliance products.
Revenue for the year ended December 31, 2018 was $582.4 million, an increase of $111.5 million, or 23.7%, from $470.9 million for the year ended December 31, 2017. This increase was driven by higher sales in all of our end markets except for the consumer market. Overall unit shipments increased by 19% due to higher market demand and average sales prices increased by 4% from the same period in 2017.
For the year ended December 31, 2018, revenue from the computing and storage market increased $58.3 million, or 57.9%, from the same period in 2017. This increase was primarily driven by strength in the solid-state drive storage, cloud computing and high-performance notebook markets. Revenue from the automotive market increased $26.2 million, or 48.6%, from the same period in 2017. This increase was primarily driven by higher sales of products for infotainment, safety and connectivity applications. Revenue from the industrial market increased $25.6 million, or 40.7%, from the same period in 2017. This increase was primarily driven by higher sales in power source, security and meter products. Revenue from the communications market increased $7.0 million, or 11.0%, from the same period in 2017. This increase was primarily driven by higher demand in networking applications. Revenue from the consumer market decreased $5.6 million, or 3.0%, from the same period in 2017. This decrease was primarily due to softness in demand for high volume consumer-related products, particularly those sold in the greater China region. This decrease was partially offset by higher demand for products related to home appliance, specialty lighting and internet-of-things applications.
Cost of Revenue and Gross Margin
Cost of revenue primarily consists of costs incurred to manufacture, assemble and test our products, as well as warranty costs, inventory-related and other overhead costs, and stock-based compensation expenses.
| Year Ended December 31, | Change | |||||||||||||||||||
|---|---|---|---|---|---|---|---|---|---|---|---|---|---|---|---|---|---|---|---|---|
| 2019 | 2018 | 2017 | From 2018 to 2019 | From 2017 to 2018 | ||||||||||||||||
| (in thousands, except percentages) | ||||||||||||||||||||
| Cost of revenue | $ | 281,596 | $ | 259,714 | $ | 212,646 | 8.4 | % | 22.1 | % | ||||||||||
| As a percentage of revenue | 44.8 | % | 44.6 | % | 45.2 | % | ||||||||||||||
| Gross profit | $ | 346,325 | $ | 322,668 | $ | 258,283 | 7.3 | % | 24.9 | % | ||||||||||
| Gross margin | 55.2 | % | 55.4 | % | 54.8 | % |
Cost of revenue was $281.6 million, or 44.8% of revenue, for the year ended December 31, 2019, and $259.7 million, or 44.6% of revenue, for the year ended December 31, 2018. The $21.9 million increase in cost of revenue was primarily due to an 8% increase in overall unit shipments and a 6% increase in the average direct cost of units shipped. The increase in cost of revenue was partially offset by a decrease in inventory write-downs and warranty expenses.
Gross margin was 55.2% for the year ended December 31, 2019, compared with 55.4% for the year ended December 31, 2018. The decrease in gross margin was primarily due to increased sales of lower margin products, which was partially offset by lower inventory write-downs and warranty expenses as a percentage of revenue.
Cost of revenue was $259.7 million, or 44.6% of revenue, for the year ended December 31, 2018, and $212.6 million, or 45.2% of revenue, for the year ended December 31, 2017. The $47.1 million increase in cost of revenue was primarily due to a 19% increase in overall unit shipments, which was partially offset by a 1% decrease in the average direct cost of units shipped. The increase in cost of revenue was also driven by a $10.5 million increase in inventory write-downs, a $2.1 million increase in warranty expenses, and a $1.7 million increase in manufacturing overhead costs, which was partially offset by a $1.2 million decrease in amortization expense as certain intangible assets were fully amortized in 2018.
Gross margin was 55.4% for the year ended December 31, 2018, compared with 54.8% for the year ended December 31, 2017. The increase in gross margin was primarily due to increased sales of higher margin products and lower manufacturing overhead costs as a percentage of revenue, which was partially offset by higher inventory write-downs as a percentage of revenue.
Research and Development (“R&D”)
R&D expenses primarily consist of salary and benefit expenses, bonuses, stock-based compensation and deferred compensation for design and product engineers, expenses related to new product development and supplies, and facility costs.
| Year Ended December 31, | Change | |||||||||||||||||||
|---|---|---|---|---|---|---|---|---|---|---|---|---|---|---|---|---|---|---|---|---|
| 2019 | 2018 | 2017 | From 2018 to 2019 | From 2017 to 2018 | ||||||||||||||||
| (in thousands, except percentages) | ||||||||||||||||||||
| R&D expenses | $ | 107,757 | $ | 93,455 | $ | 82,359 | 15.3 | % | 13.5 | % | ||||||||||
| As a percentage of revenue | 17.2 | % | 16.0 | % | 17.5 | % |
R&D expenses were $107.8 million, or 17.2% of revenue, for the year ended December 31, 2019, and $93.5 million, or 16.0% of revenue, for the year ended December 31, 2018. The $14.3 million increase in R&D expenses was primarily due to an increase of $4.6 million in compensation expenses, which include salary, benefits and bonuses, an increase of $3.6 million in stock-based compensation expenses, which were mainly associated with performance-based equity awards, an increase of $2.4 million in new product development expenses, and an increase of $1.8 million in expenses related to changes in the value of the deferred compensation plan liabilities. Our R&D headcount was 839 employees as of December 31, 2019, compared with 710 employees as of December 31, 2018.
R&D expenses were $93.5 million, or 16.0% of revenue, for the year ended December 31, 2018, and $82.4 million, or 17.5% of revenue, for the year ended December 31, 2017. The $11.1 million increase in R&D expenses was primarily due to an increase of $6.9 million in compensation expenses, which include salary, benefits and bonuses, an increase of $2.4 million in laboratory supplies, an increase of $1.4 million in new product development expenses, and an increase of $1.2 million in stock-based compensation expenses mainly associated with performance-based equity awards. These increases were partially offset by an increase of $1.4 million in income related to changes in the value of the deferred compensation plan liabilities. Our R&D headcount was 710 employees as of December 31, 2018, compared with 629 employees as of December 31, 2017.
Selling, General and Administrative (“SG&A”)
SG&A expenses primarily include salary and benefit expenses, bonuses, stock-based compensation and deferred compensation for sales, marketing and administrative personnel, sales commissions, travel expenses, facilities costs, and professional service fees.
| Year Ended December 31, | Change | |||||||||||||||||||
|---|---|---|---|---|---|---|---|---|---|---|---|---|---|---|---|---|---|---|---|---|
| 2019 | 2018 | 2017 | From 2018 to 2019 | From 2017 to 2018 | ||||||||||||||||
| (in thousands, except percentages) | ||||||||||||||||||||
| SG&A expenses | $ | 133,542 | $ | 113,803 | $ | 97,257 | 17.3 | % | 17.0 | % | ||||||||||
| As a percentage of revenue | 21.3 | % | 19.5 | % | 20.7 | % |
SG&A expenses were $133.5 million, or 21.3% of revenue, for the year ended December 31, 2019, and $113.8 million, or 19.5% of revenue, for the year ended December 31, 2018. The $19.7 million increase in SG&A expenses was primarily due to an increase of $14.0 million in stock-based compensation expenses, which were mainly associated with performance-based equity awards, an increase of $2.8 million in compensation expenses, which include salary, benefits and bonuses, and an increase of $2.7 million in expenses related to changes in the value of the deferred compensation plan liabilities. Our SG&A headcount was 503 employees as of December 31, 2019, compared with 433 employees as of December 31, 2018.
SG&A expenses were $113.8 million, or 19.5% of revenue, for the year ended December 31, 2018, and $97.3 million, or 20.7% of revenue, for the year ended December 31, 2017. The $16.5 million increase in SG&A expenses was primarily due to an increase of $6.6 million in stock-based compensation expenses mainly associated with performance-based equity awards, an increase of $5.0 million in compensation expenses, which include salary, benefits and bonuses, and an increase of $4.0 million in commission expenses driven by higher revenue. These increases were partially offset by an increase of $2.0 million in income related to changes in the value of the deferred compensation plan liabilities. Our SG&A headcount was 433 employees as of December 31, 2018, compared with 389 employees as of December 31, 2017.
Litigation Expense
Litigation expense was $2.5 million for the year ended December 31, 2019, compared with $1.9 million for the year ended December 31, 2018. The increase was primarily due to an ongoing lawsuit in which we are the plaintiff.
Litigation expense was $1.9 million for the year ended December 31, 2018, compared with $1.2 million for the year ended December 31, 2017. The increase was primarily due to an ongoing lawsuit in which we are the plaintiff.
Interest and Other Income, Net
Interest and other income, net, was $10.6 million for the year ended December 31, 2019, compared with $5.0 million for the year ended December 31, 2018. The increase was primarily due to an increase of $4.8 million in income related to changes in the value of the deferred compensation plan investments, an increase of $1.0 million in interest income as a result of higher investment balances and yields, and a decrease of $0.6 million in amortization of premium on available-for-sale securities. These favorable changes were partially offset by an increase of $1.3 million in foreign currency exchange losses.
Interest and other income, net, was $5.0 million for the year ended December 31, 2018, compared with $5.5 million for the year ended December 31, 2017. The decrease was primarily due to an increase of $3.6 million in expenses related to changes in the value of the deferred compensation plan investments. This decrease was partially offset by an increase of $1.5 million in foreign currency exchange gains, an increase of $1.0 million in interest income as a result of higher investment balances and yields, and a decrease of $0.6 million in amortization of premium on available-for-sale securities.
Income Tax Provision
The income tax expense for the year ended December 31, 2019 was $4.3 million, or 3.8% of pre-tax income. The effective tax rate differed from the federal statutory rate primarily due to foreign income from our subsidiaries in Bermuda and China being taxed at lower statutory tax rates, the impact of certain tax credits and excess tax benefits from stock-based compensation. The decrease in the effective tax rate relative to the federal statutory rate was partially offset by the inclusion of the global intangible low-taxed income (“GILTI”) tax.
The income tax expense for the year ended December 31, 2018 was $13.2 million, or 11.2% of pre-tax income. The effective tax rate differed from the federal statutory rate primarily due to foreign income from our subsidiaries in Bermuda and China being taxed at lower statutory tax rates. The decrease in the effective tax rate relative to the federal statutory rate was partially offset by the inclusion of the GILTI tax.
The income tax expense for the year ended December 31, 2017 was $17.7 million, or 21.4% of pre-tax income. The effective tax rate differed from the federal statutory rate primarily due to foreign income from our subsidiaries in Bermuda and China being taxed at lower rates and the release of the U.S. valuation allowance. The decrease in the effective tax rate relative to the federal statutory rate was partially impacted by the effects of the 2017 Tax Act, including the remeasurement of deferred taxes and the one-time deemed repatriation transition tax.
See Note 12 of the Notes to Consolidated Financial Statements included in Part II, Item 8 of this Annual Report on Form 10-K for further discussion.
Liquidity and Capital Resources
| December 31, | ||||||||
|---|---|---|---|---|---|---|---|---|
| 2019 | 2018 | |||||||
| (in thousands, except percentages) | ||||||||
| Cash and cash equivalents | $ | 172,960 | $ | 172,704 | ||||
| Short-term investments | 282,437 | 204,577 | ||||||
| Total cash, cash equivalents and short-term investments | $ | 455,397 | $ | 377,281 | ||||
| Percentage of total assets | 47.6 | % | 47.6 | % | ||||
| Total current assets | $ | 655,206 | $ | 580,810 | ||||
| Total current liabilities | (98,225 | ) | (80,439 | ) | ||||
| Working capital | $ | 556,981 | $ | 500,371 |
As of December 31, 2019, we had cash and cash equivalents of $173.0 million and short-term investments of $282.4 million, compared with cash and cash equivalents of $172.7 million and short-term investments of $204.6 million as of December 31, 2018. As of December 31, 2019, $99.5 million of cash and cash equivalents and $186.7 million of short-term investments were held by our international subsidiaries. For the year ended December 31, 2019, we repatriated $75 million of cash from our Bermuda subsidiary to the U.S. The proceeds were primarily used to fund real estate purchases and cash dividend payments. We may repatriate additional cash from our Bermuda subsidiary to fund our expenditures in future periods. We anticipate that earnings from other foreign subsidiaries will continue to be indefinitely reinvested.
The significant components of our working capital are cash and cash equivalents, short-term investments, accounts receivable, inventories and other current assets, reduced by accounts payable, accrued compensation and related benefits, and other accrued liabilities. As of December 31, 2019, we had working capital of $557.0 million, compared with working capital of $500.4 million as of December 31, 2018. The $56.6 million increase in working capital was due to a $74.4 million increase in current assets, which was partially offset by a $17.8 million increase in current liabilities. The increase in current assets was primarily due to an increase in short-term investments and other current assets, which was partially offset by a decrease in inventories. The increase in current liabilities was primarily due to an increase in accounts payable, accrued compensation and related benefits and other accrued liabilities.
Summary of Cash Flows
The following table summarizes our cash flow activities:
| Year Ended December 31, | ||||||||||||
|---|---|---|---|---|---|---|---|---|---|---|---|---|
| 2019 | 2018 | 2017 | ||||||||||
| (in thousands) | ||||||||||||
| Net cash provided by operating activities | $ | 216,303 | $ | 141,451 | $ | 133,821 | ||||||
| Net cash used in investing activities | (167,112 | ) | (14,740 | ) | (134,060 | ) | ||||||
| Net cash used in financing activities | (48,050 | ) | (34,559 | ) | (31,325 | ) | ||||||
| Effect of change in exchange rates | (883 | ) | (2,208 | ) | 1,625 | |||||||
| Net increase (decrease) in cash, cash equivalents and restricted cash | $ | 258 | $ | 89,944 | $ | (29,939 | ) |
For the year ended December 31, 2019, net cash provided by operating activities was $216.3 million, primarily due to our net income adjusted for certain non-cash items, including depreciation and amortization and stock-based compensation, and a net increase of $17.8 million from the changes in our operating assets and liabilities. The increase in other assets was primarily due to an increase in prepaid income taxes and an increase in certain tax withholding proceeds receivable related to RSUs that vested at the end of the year. The increase in other accrued liabilities was primarily driven by an increase in employee contributions to the deferred compensation plan. The decrease in inventories was primarily driven by a decrease in wafer and die purchases.
For the year ended December 31, 2018, net cash provided by operating activities was $141.5 million, primarily due to our net income adjusted for certain non-cash items, including depreciation and amortization and stock-based compensation, and a net decrease of $37.5 million from the changes in our operating assets and liabilities. The increase in accounts receivable was primarily driven by increased sales. The increase in inventories was primarily driven by an increase in strategic wafer and die inventories as well as an increase in finished goods to meet current demand and future growth. The increase in accrued liabilities was primarily driven by an increase in employee contributions to the deferred compensation plan.
For the year ended December 31, 2017, net cash provided by operating activities was $133.8 million, primarily due to our net income adjusted for certain non-cash items, including depreciation and amortization, stock-based compensation and deferred taxes, and a net increase of $15.7 million from the changes in our operating assets and liabilities. The increase in deferred taxes was primarily due to the release of the U.S. valuation allowance, partially offset by the remeasurement of the deferred tax balance in the fourth quarter of 2017 as a result of the 2017 Tax Act. The increase in accounts receivable was primarily driven by higher sales. The increase in inventories was primarily driven by an increase in strategic wafer and die inventories as well as an increase in finished goods to meet current demand and future growth. The increase in accounts payable was primarily driven by increased inventory and capital asset purchases to meet future demand. The increase in accrued liabilities was primarily driven by an increase in employee contributions to the deferred compensation plan and warranty expenses. The increase in income tax liabilities was primarily driven by the one-time deemed repatriation transition tax liability recorded in the fourth quarter of 2017.
For the year ended December 31, 2019, net cash used in investing activities was $167.1 million, primarily due to purchases of property and equipment of $95.8 million, net purchases of short-term investments of $76.8 million and net contributions to the deferred compensation plan of $3.1 million. These cash outflows were partially offset by proceeds from sales of property and equipment of $9.3 million. For the year ended December 31, 2018, net cash used in investing activities was $14.7 million, primarily due to purchases of property and equipment of $22.5 million and net contributions to the deferred compensation plan of $4.1 million, which was partially offset by net sales of investments of $11.9 million. For the year ended December 31, 2017, net cash used in investing activities was $134.1 million, primarily due to purchases of property and equipment of $65.8 million, net purchases of short-term investments of $63.0 million, and net contributions to the deferred compensation plan of $5.3 million.
For the year ended December 31, 2019, we funded the purchases of properties in Kirkland, Washington and Livonia, Michigan for $57.4 million. We did not purchase any significant properties for the year ended December 31, 2018. For the year ended December 31, 2017, we funded the purchases of land in Kirkland, Washington, office space in Shanghai and Hangzhou, China, and land and office space in Taipei, Taiwan for $53.8 million.
For the year ended December 31, 2019, net cash used in financing activities was $48.1 million, primarily reflecting $67.3 million used to pay dividends to our stockholders and dividend equivalents to our employees who hold RSUs, which was partially offset by $19.9 million of cash proceeds from the vesting of RSUs and the issuance of shares through our ESPP. For the year ended December 31, 2018, net cash used in financing activities was $34.6 million, primarily reflecting $47.5 million used to pay dividends to our stockholders and dividend equivalents to our employees who hold RSUs, which was partially offset by $13.6 million of cash proceeds from the vesting of RSUs and the issuance of shares through our ESPP. For the year ended December 31, 2017, net cash used in financing activities was $31.3 million, primarily reflecting $33.9 million used to pay dividends to our stockholders and dividend equivalents to our employees who hold RSUs, which was partially offset by $2.9 million of cash proceeds from stock option exercises and the issuance of shares through our ESPP.
In February 2020, our Board of Directors approved an increase in our quarterly cash dividends from $0.40 per share to $0.50 per share.
We anticipate that cash used for future dividends and dividend equivalent payments, as well as payments for the one-time deemed repatriation transition tax and other expenditures, will come from our domestic cash, cash generated from ongoing U.S. operations, and cash repatriated from our Bermuda subsidiary. Earnings from other foreign subsidiaries will continue to be indefinitely reinvested.
Although cash requirements will fluctuate based on the timing and extent of many factors such as those discussed above, we believe that cash generated from operations, together with the liquidity provided by existing cash balances and short-term investments, will be sufficient to satisfy our liquidity requirements for the next 12 months.
In the future, in order to strengthen our financial position, respond to changes in our circumstance or unforeseen events or conditions, or fund our growth, we may need to discontinue paying dividends and dividend equivalents, and may need to raise additional funds by any one or a combination of the following: issuing equity securities, issuing debt or convertible debt securities, incurring indebtedness secured by our assets, or selling certain product lines and/or portions of our business. Accordingly, we cannot ensure that we will continue to pay dividends and dividend equivalents in the future, and there can be no guarantee that we will be able to raise additional funds on terms acceptable to us, or at all.
From time to time, we have engaged in discussions with third parties concerning potential acquisitions of product lines, technologies, businesses and companies, and we continue to consider potential acquisition candidates. Any such transactions could involve the issuance of a significant number of new equity securities, assumptions of debt, and/or payment of cash consideration. We may also be required to raise additional funds to complete any such acquisitions, through either the issuance of equity and debt securities or incurring indebtedness secured by our assets. If we raise additional funds or acquire businesses or technologies through the issuance of equity securities or convertible debt securities, our existing stockholders may experience significant dilution.
Contractual Obligations
The following table summarizes our contractual obligations at December 31, 2019:
| Payment Due by Period | ||||||||||||||||||||
|---|---|---|---|---|---|---|---|---|---|---|---|---|---|---|---|---|---|---|---|---|
| Total | Less Than 1 Year | 1 - 3 Years | 3 - 5 Years | More Than 5 years | ||||||||||||||||
| (in thousands) | ||||||||||||||||||||
| Operating lease obligations (1) | $ | 2,717 | $ | 1,571 | $ | 1,124 | $ | 22 | $ | - | ||||||||||
| Outstanding purchase commitments (2) | 90,613 | 79,937 | 9,826 | 300 | 550 | |||||||||||||||
| Transition tax liability (3) | 20,705 | 1,972 | 3,944 | 8,627 | 6,162 | |||||||||||||||
| Other long-term obligations (4) | 45,930 | - | 9,304 | 11,506 | 25,120 | |||||||||||||||
| Total | $ | 159,965 | $ | 83,480 | $ | 24,198 | $ | 20,455 | $ | 31,832 |
| (1) | Operating lease obligations represent the undiscounted remaining lease payments. While we have elected not to record short-term leases with a term of 12 months or less at the commencement date on the Consolidated Balance Sheets, the remaining obligations for these leases are included in the table above. |
|---|
| (2) | Outstanding purchase commitments represent our obligations with our suppliers and other parties that require the future purchases of goods or services, which primarily consist of wafer and other inventory purchases, assembly and other manufacturing services, construction or purchases of property and equipment, and license arrangements. |
|---|
| (3) | The transition tax liability represents the one-time, mandatory deemed repatriation tax imposed on previously deferred foreign earnings under the 2017 Tax Act. As permitted by the 2017 Tax Act, we have elected to pay the tax liability in installments on an interest-free basis through 2025. |
|---|---|
| (4) | Other long-term obligations include long-term liabilities reflected on our Consolidated Balance Sheets, which primarily consist of the deferred compensation plan liabilities and accrued dividend equivalents. Because of the uncertainty as to the timing of payments related to our liabilities for unrecognized tax benefits, we have excluded estimated obligations of $18.9 million from the table above. |
Off Balance Sheet Arrangements
As of December 31, 2019, we had no off-balance sheet arrangements as defined in Item 303(a)(4) of the Securities and Exchange Commission’s Regulation S-K.
Item 7A. QUANTITATIVE AND QUALITATIVE DISCLOSURES ABOUT MARKET RISK
Interest Rate Risk
Our cash equivalents and short-term investments are subject to market risk, primarily interest rate and credit risk. Our investments are managed by outside professional managers within investment guidelines set by management and approved by our Board of Directors. Such guidelines include security type, credit quality and maturity and are intended to limit market risk by restricting our investments to high quality debt instruments with relatively short-term maturities. Based on our investment positions as of December 31, 2019, a 10% decline in interest rates would impact our results of operations by approximately $0.7 million in interest income.
We do not use derivative financial instruments in our investment portfolio. Investments in debt securities are classified as available-for-sale, which are reported at fair value with the unrealized gains or losses being included in accumulated other comprehensive income (loss), a component of stockholders’ equity. When the fair value of an investment is below its amortized cost basis, no realized losses are recognized in our results of operations due to changes in interest rates (i.e., non-credit loss factors) unless we have the intent to sell the securities or it is more likely than not that we will be required to sell the securities before recovery of the entire amortized cost basis.
Long-Term Investments
As of December 31, 2019, our holdings in auction-rate securities had a face value of $3.4 million and a fair value of $3.1 million. The decline in the fair value could impact our operating results by $0.2 million if we have the intent to sell the securities, it is more likely than not that we will be required to sell the securities before recovery of the entire amortized cost basis, or the decline in value is related to credit loss factors. An additional 10% decline in the fair value could further impact our operating results by $0.3 million. To date, we have redeemed $40.0 million, or 92% of the original portfolio in these securities, at par without any realized losses.
Foreign Currency Exchange Risk
Our sales outside the United States are primarily transacted in U.S. dollars through our subsidiary in Bermuda. Accordingly, our sales are not generally impacted by foreign currency rate changes. The functional currency of the Company’s offshore operations is generally the local currency, primarily including the Renminbi, the New Taiwan Dollar and the Euro. In addition, we incur foreign currency exchange gains or losses related to certain intercompany transactions between the U.S. and our foreign subsidiaries that are denominated in a currency other than the functional currency. Gains or losses from the settlement and remeasurement of the balances are reported in interest and other income, net. Fluctuations in foreign currency exchange rates have not had a material impact on our results of operations in any of the periods presented.
Item 8. FINANCIAL STATEMENTS AND SUPPLEMENTARY DATA
MONOLITHIC POWER SYSTEMS, INC.
CONSOLIDATED FINANCIAL STATEMENTS
Contents
REPORT OF INDEPENDENT REGISTERED PUBLIC ACCOUNTING FIRM
To the Stockholders and the Board of Directors of Monolithic Power Systems, Inc.
Opinion on the Financial Statements
We have audited the accompanying consolidated balance sheet of Monolithic Power Systems Inc. (the Company) as of December 31, 2019, the related consolidated statements of operations, comprehensive income, stockholders’ equity and cash flows for the year ended December 31, 2019, and the related notes (collectively referred to as the “consolidated financial statements”). In our opinion, the consolidated financial statements present fairly, in all material respects, the financial position of the Company at December 31, 2019, and the results of its operations and its cash flows for the year ended December 31, 2019, in conformity with U.S. generally accepted accounting principles.
We also have audited, in accordance with the standards of the Public Company Accounting Oversight Board (United States) (PCAOB), the Company’s internal control over financial reporting as of December 31, 2019, based on criteria established in Internal Control - Integrated Framework issued by the Committee of Sponsoring Organizations of the Treadway Commission (2013 framework) and our report dated February 28, 2020 expressed an unqualified opinion thereon.
Basis for Opinion
These financial statements are the responsibility of the Company’s management. Our responsibility is to express an opinion on the Company’s financial statements based on our audit. We are a public accounting firm registered with the PCAOB and are required to be independent with respect to the Company in accordance with the U.S. federal securities laws and the applicable rules and regulations of the Securities and Exchange Commission and the PCAOB.
We conducted our audit in accordance with the standards of the PCAOB. Those standards require that we plan and perform the audit to obtain reasonable assurance about whether the financial statements are free of material misstatement, whether due to error or fraud. Our audit included performing procedures to assess the risks of material misstatement of the financial statements, whether due to error or fraud, and performing procedures that respond to those risks. Such procedures included examining, on a test basis, evidence regarding the amounts and disclosures in the financial statements. Our audit also included evaluating the accounting principles used and significant estimates made by management, as well as evaluating the overall presentation of the financial statements. We believe that our audit provides a reasonable basis for our opinion.
Critical Audit Matter
The critical audit matter communicated below is a matter arising from the current period audit of the financial statements that was communicated or required to be communicated to the audit committee and that: (1) relates to accounts or disclosures that are material to the financial statements and (2) involved our especially challenging, subjective, or complex judgments. The communication of the critical audit matter does not alter in any way our opinion on the financial statements, taken as a whole, and we are not, by communicating the critical audit matter below, providing a separate opinion on the critical audit matter or on the account or disclosure to which it relates.
| Inven****tory Valuation | |
|---|---|
| Description of the Matter | The Company’s inventories totaled $127.5 million as of December 31, 2019, representing 13.3% of total assets. As explained in Note 1 to the consolidated financial statements, the Company values inventories at the lower of standard cost (which approximates actual cost determined on a first-in first-out basis) and estimated net realizable value in each reporting period. Excess and obsolete inventory is written down to its estimated net realizable value if less than cost. |
| Auditing management’s estimates for excess and obsolete inventory involved subjective auditor judgment because management’s assessment of whether a write down is required and the measurement of any excess of cost over net realizable value is judgmental and considers a number of qualitative factors that are affected by market and economic conditions outside the Company’s control. In particular, the excess and obsolete inventory calculations are sensitive to significant assumptions, including demand for the Company’s products, which considers adjustments to sales forecasts for specific product considerations, including but not limited to new product launches and expected industry sales growth. | |
| How We Addressed the Matter in Our Audit | We obtained an understanding, evaluated the design, and tested the operating effectiveness of internal controls over the Company's excess and obsolete inventory reserve process. This included controls over management’s assessment of inventory valuation, including the determination of forecasted usage of inventories and how factors outside of the Company’s control might affect management’s judgment related to the valuation of excess and obsolete inventory. |
| Our substantive audit procedures included, among others, evaluating the significant assumptions stated above and testing the completeness and accuracy of the underlying data used in management’s excess and obsolete inventory valuation assessment. We evaluated inventory levels compared to forecasted product demand, historical sales and specific product considerations. We also assessed the historical accuracy of management’s estimates and performed sensitivity analyses over the significant assumptions to evaluate the changes in the excess and obsolete inventory estimates that would result from changes in the underlying assumptions. | |
| /s/ Ernst & Young LLP |
We have served as the Company's auditor since 2019.
San Jose, California
February 28, 2020
REPORT OF INDEPENDENT REGISTERED PUBLIC ACCOUNTING FIRM
To the Stockholders and the Board of Directors of Monolithic Power Systems, Inc.
Opinion on Internal Control Over Financial Reporting
We have audited Monolithic Power Systems Inc.’s internal control over financial reporting as of December 31, 2019, based on criteria established in Internal Control – Integrated Framework issued by the Committee of Sponsoring Organizations of the Treadway Commission (2013 framework) (the COSO criteria). In our opinion, Monolithic Power Systems Inc. (the Company) maintained, in all material respects, effective internal control over financial reporting as of December 31, 2019, based on the COSO criteria.
We also have audited, in accordance with the standards of the Public Company Accounting Oversight Board (United States) (PCAOB), the consolidated balance sheet of the Company as of December 31, 2019, the related consolidated statements of operations, comprehensive income, stockholders’ equity and cash flows for the year ended December 31, 2019, and the related notes and our report dated February 28, 2020 expressed an unqualified opinion thereon.
Basis for Opinion
The Company’s management is responsible for maintaining effective internal control over financial reporting and for its assessment of the effectiven
Showing the first 8K of 140K characters. Open the full section
Item 9. CHANGES IN AND DISAGREEMENTS WITH ACCOUNTANTS ON ACCOUNTING AND FINANCIAL DISCLOSURE
None.
Item 9A. CONTROLS AND PROCEDURES
Evaluation of Disclosure Controls and Procedures
Our management, with the participation of our Chief Executive Officer and Chief Financial Officer, evaluated the effectiveness of our disclosure controls and procedures pursuant to Rule 13a-15(e) and Rule 15d-15(e) under the Securities Exchange Act of 1934 as of the end of the period covered by this Annual Report on Form 10-K.
Based on this evaluation, our Chief Executive Officer and Chief Financial Officer concluded that, as of December 31, 2019, our disclosure controls and procedures are designed at a reasonable assurance level and are effective to provide reasonable assurance that information we are required to disclose in reports that we file or submit under the Exchange Act is recorded, processed, summarized, and reported within the time periods specified in the SEC’s rules and forms, and that such information is accumulated and communicated to our management, including our Chief Executive Officer and Chief Financial Officer, as appropriate, to allow timely decisions regarding required disclosure.
Management’s Report on Internal Control over Financial Reporting
Our management is responsible for establishing and maintaining adequate internal control over financial reporting. Our management conducted an evaluation of the effectiveness of our internal control over financial reporting based on the framework in Internal Control—Integrated Framework (2013) issued by the Committee of Sponsoring Organizations of the Treadway Commission. Based on this evaluation, management concluded that our internal control over financial reporting was effective as of December 31, 2019. Management reviewed the results of its assessment with our Audit Committee.
Our independent registered public accounting firm, Ernst & Young LLP, independently assessed the effectiveness of our internal control over financial reporting, as stated in the firm’s attestation report, which appears in Part II, Item 8 of this Annual Report on Form 10-K.
Changes in Internal Control over Financial Reporting
Effective January 1, 2019, we adopted ASU No. 2016-02, Leases (Topic 842). We have implemented additional business processes and control activities, primarily related to the analysis of lease contracts, recognition of the ROU assets and lease liabilities, and presentation and disclosure, in order to monitor and maintain appropriate controls over financial reporting. There were no other changes in our internal control over financial reporting that occurred during the quarter ended December 31, 2019, that have materially affected, or are reasonably likely to materially affect, our internal control over financial reporting.
Limitations on Effectiveness of Controls and Procedures
In designing and evaluating the disclosure controls and procedures, management recognizes that any controls and procedures, no matter how well designed and operated, can provide only reasonable assurance of achieving the desired control objectives. In addition, the design of disclosure controls and procedures must reflect the fact that there are resource constraints and that management is required to apply its judgment in evaluating the benefits of possible controls and procedures relative to their costs.
Item 9B. OTHER INFORMATION
Item 10. DIRECTORS, EXECUTIVE OFFICERS AND CORPORATE GOVERNANCE
Reference is made to the information regarding directors and nominees, code of ethics, corporate governance matters and disclosure relating to compliance with Section 16(a) of the Securities Exchange Act of 1934 appearing under the captions “Election of Directors” and “Delinquent Section 16(a) Reports” in the Company’s Proxy Statement for its 2020 Annual Meeting of Stockholders (the “2020 Annual Meeting”), which information is incorporated in this Annual Report on Form 10-K by reference. Information regarding executive officers is set forth under the caption “Information about Executive Officers” in Part I of this Annual Report on Form 10-K.
Item 11. EXECUTIVE COMPENSATION
The information required by this item will be set forth under the caption “Executive Officer Compensation” in the Company’s Proxy Statement for the 2020 Annual Meeting, and is incorporated herein by reference.
Item 12. SECURITY OWNERSHIP OF CERTAIN BENEFICIAL OWNERS AND MANAGEMENT AND RELATED STOCKHOLDER MATTERS
The information required by this item will be set forth under the captions “Security Ownership of Certain Beneficial Owners and Management” and “Equity Compensation Plan Information” in the Company’s Proxy Statement for the 2020 Annual Meeting, and is incorporated herein by reference.
Item 13. CERTAIN RELATIONSHIPS AND RELATED TRANSACTIONS, AND DIRECTOR INDEPENDENCE
The information required by this item will be set forth under the captions “Certain Relationships and Related Transactions” and “Election of Directors” in the Company’s Proxy Statement for the 2020 Annual Meeting, and is incorporated herein by reference.
Item 14. PRINCIPAL ACCOUNTING FEES AND SERVICES
Item 15. EXHIBITS, FINANCIAL STATEMENT SCHEDULES.
(a) Documents filed as part of this report
(1) All financial statements
Reports of Independent Registered Public Accounting Firms
Consolidated Balance Sheets
Consolidated Statements of Operations
Consolidated Statements of Comprehensive Income
Consolidated Statements of Stockholders’ Equity
Consolidated Statements of Cash Flows
Notes to Consolidated Financial Statements
(2) Financial Statement Schedules
All schedules have been omitted because the required information is not present or not present in amounts sufficient to require submission of the schedules, or because the information required is included in the consolidated financial statements or notes thereto.
(3) Exhibits
| + | Management contract or compensatory plan or arrangement. |
|---|
| * | This exhibit shall not be deemed “filed” for purposes of Section 18 of the Securities Exchange Act of 1934 or otherwise subject to the liabilities of that Section, nor shall it be deemed incorporated by reference in any filings under the Securities Act of 1933 or the Securities Exchange Act of 1934, whether made before or after the date hereof and irrespective of any general incorporation language in any filings. |
|---|
| (1) | Incorporated by reference to Exhibit 3.2 of the Registrant’s Registration Statement on Form S-1/A (Registration No. 333-117327), filed with the Securities and Exchange Commission on November 15, 2004. |
|---|
| (2) | Incorporated by reference to Exhibit 3.4 of the Registrant’s Registration Statement on Form S-1/A (Registration No. 333-117327), filed with the Securities and Exchange Commission on November 15, 2004. |
|---|
| (3) | Incorporated by reference to Exhibit 10.3 of the Registrant’s Registration Statement on Form S-1/A (Registration No. 333-117327), filed with the Securities and Exchange Commission on November 15, 2004. |
|---|
| (4) | Incorporated by reference to Exhibit 10.4 of the Registrant’s Registration Statement on Form S-1/A (Registration No. 333-117327), filed with the Securities and Exchange Commission on November 15, 2004. |
|---|
| (5) | Incorporated by reference to Exhibit 10.7 of the Registrant’s annual report on Form 10-K (File No. 000-51026), filed with the Securities and Exchange Commission on March 11, 2008 and Exhibit 10.1 of the Registrant’s current report on Form 8-K (File No. 000-51026), filed with the Securities and Exchange Commission on December 19, 2008. |
|---|
| (6) | Incorporated by reference to Exhibit 10.8 of the Registrant’s annual report on Form 10-K (File No. 000-51026), filed with the Securities and Exchange Commission on March 11, 2008 and Exhibit 10.3 of the Registrant’s current report on Form 8-K (File No. 000-51026), filed with the Securities and Exchange Commission on December 19, 2008. |
|---|
| (7) | Incorporated by reference to Exhibit 10.9 of the Registrant’s Registration Statement on Form S-1 (Registration No. 333-117327), filed with the Securities and Exchange Commission on July 13, 2004. |
|---|
| (8) | Incorporated by reference to Exhibit 10.10 of the Registrant’s annual report on Form 10-K (File No. 000-51026), filed with the Securities and Exchange Commission on March 11, 2008 and Exhibit 10.4 of the Registrant’s current report on Form 8-K (File No. 000-51026), filed with the Securities and Exchange Commission on December 19, 2008. |
|---|
| (9) | Incorporated by reference to Exhibit 10.1 of the Registrant’s current report on Form 8-K (File No. 000-51026), filed with the Securities and Exchange Commission on September 14, 2006. |
|---|
| (10) | Incorporated by reference to Exhibit 10.1 of the Registrant’s current report on Form 8-K (File No. 000-51026), filed with the Securities and Exchange Commission on February 3, 2010. |
|---|
| (11) | Incorporated by reference to Annexure C of the Registrant’s Proxy Statement on Schedule 14A (File No. 000-51026), filed with the Securities and Exchange Commission on April 30, 2013. |
|---|---|
| (12) | Incorporated by reference to Exhibit 10.36 of the Registrant’s annual report on Form 10-K (File No. 000-51026), filed with the Securities and Exchange Commission on March 10, 2014. |
| (13) | Incorporated by reference to Exhibit 4.4 of the Registrant’s Registration Statement on Form S-8 (Registration No. 333-199782), filed with the Securities and Exchange Commission on November 3, 2014. |
| (14) | Incorporated by reference to Exhibit 4.6 of the Registrant’s Registration Statement on Form S-8 (Registration No. 333-199782), filed with the Securities and Exchange Commission on November 3, 2014. |
| (15) | Incorporated by reference to Exhibit 10.1 of the Registrant’s current report on Form 8-K (File No. 000-51026), filed with the Securities and Exchange Commission on July 22, 2016. |
Item 16. FORM 10-K SUMMARY.
None.
Pursuant to the requirements of Section 13 or 15(d) of the Securities Exchange Act of 1934, the registrant has duly caused this report to be signed on its behalf by the undersigned, thereunto duly authorized.
| MONOLITHIC POWER SYSTEMS, INC. | |||
|---|---|---|---|
| Date: February 28, 2020 | By: | /s/ Michael Hsing | |
| Michael Hsing | |||
| President and Chief Executive Officer |
KNOW ALL PERSONS BY THESE PRESENTS, that each person whose signature appears below constitutes and appoints Michael Hsing and T. Bernie Blegen, jointly and severally, his attorneys-in-fact, each with the power of substitution, for him in any and all capacities, to sign any amendments to this report, and to file the same, with exhibits thereto and other documents in connection therewith, with the Securities and Exchange Commission, hereby ratifying and confirming all that each of said attorneys-in-fact, or his substitute or substitutes, may do or cause to be done by virtue hereof.
Pursuant to the requirements of the Securities Exchange Act of 1934, this report has been signed below on February 28, 2020 by the following persons on behalf of the registrant and in the capacities indicated:
| /s/ Michael Hsing | President, Chief Executive Officer, and Director (Principal Executive Officer) | |
|---|---|---|
| Michael Hsing | ||
| /s/ T. Bernie Blegen | Chief Financial Officer (Principal Financial and Accounting Officer) | |
| T. Bernie Blegen | ||
| /s/ HERBERT CHANG | Director | |
| Herbert Chang | ||
| /s/ EUGEN ELMIGER | Director | |
| Eugen Elmiger | ||
| /s/ VICTOR K. LEE | Director | |
| Victor K. Lee | ||
| /s/ JAMES C. MOYER | Director | |
| James C. Moyer | ||
| /s/ JEFF ZHOU | Director | |
| Jeff Zhou |