 filings.tools
Marvell Technology 10-K 2024-02-03
Filed 2024-03-13. 24 sections, 573K characters. Original on sec.gov · Markdown · JSON
Cover and table of contents
UNITED STATES
SECURITIES AND EXCHANGE COMMISSION
Washington, D.C. 20549
Form 10-K
(Mark One)
| ☒ | ANNUAL REPORT PURSUANT TO SECTION 13 OR 15(d) OF THE SECURITIES EXCHANGE ACT OF 1934 |
For the fiscal year ended February 3, 2024
or
| ☐ | TRANSITION REPORT PURSUANT TO SECTION 13 OR 15(d) OF THE SECURITIES EXCHANGE ACT OF 1934 |
For the transition period from to
Commission file number 001-40357

MARVELL TECHNOLOGY, INC.
(Exact name of registrant as specified in its charter)
| Delaware | 85-3971597 | |||||||
| (State or other jurisdiction of incorporation or organization) | (I.R.S. Employer Identification No.) |
1000 N. West Street, Suite 1200
Wilmington, Delaware 19801
(Address of principal executive offices)
(302) 295 - 4840
(Registrant’s telephone number, including area code)
Securities registered pursuant to Section 12(b) of the Exchange Act:
| Title of each class | Trading Symbol | Name of each exchange on which registered | ||||||
| Common stock, $0.002 par value per share | MRVL | The Nasdaq Global Select Market |
Securities registered pursuant to Section 12(g) of the Act:
None
Indicate by check mark if the registrant is a well-known seasoned issuer, as defined in Rule 405 of the Securities Act. Yes ☒ No ☐
Indicate by check mark if the registrant is not required to file reports pursuant to Section 13 or Section 15(d) of the Exchange Act. Yes ☐ No ☒
Indicate by check mark whether the registrant (1) has filed all reports required to be filed by Section 13 or 15(d) of the Exchange Act during the preceding 12 months (or for such shorter period that the registrant was required to file such reports), and (2) has been subject to such filing requirements for the past 90 days. Yes ☒ No ☐
Indicate by check mark whether the registrant has submitted electronically every Interactive Data File required to be submitted pursuant to Rule 405 of Regulation S-T (§232.405 of this chapter) during the preceding 12 months (or for such shorter period that the registrant was required to submit such files). Yes ☒ No ☐
Indicate by check mark whether the registrant is a large accelerated filer, an accelerated filer, a non-accelerated filer, a smaller reporting company, or an emerging growth company. See the definitions of “large accelerated filer,” “accelerated filer,” “smaller reporting company,” and “emerging growth company” in Rule 12b-2 of the Exchange Act.
| Large accelerated filer ☒ | Accelerated filer ☐ | Non-accelerated filer ☐ | Smaller reporting company ☐ | Emerging growth company ☐ | ||||||||||
If an emerging growth company, indicate by check mark if the registrant has elected not to use the extended transition period for complying with any new or revised financial accounting standards provided pursuant to Section 13(a) of the Exchange Act. ☐
Indicate by check mark whether the registrant has filed a report on and attestation to its management’s assessment of the effectiveness of its internal control over financial reporting under Section 404(b) of the Sarbanes-Oxley Act (15 U.S.C. 7262(b)) by the registered public accounting firm that prepared or issued its audit report. ☒
If securities are registered pursuant to Section 12(b) of the Act, indicate by check mark whether the financial statements of the registrant included in the filing reflect the correction of an error to previously issued financial statements. ☐
Indicate by check mark whether any of those error corrections are restatements that required a recovery analysis of incentive-based compensation received by any of the registrant’s executive officers during the relevant recovery period pursuant to §240.10D-1(b). ☐
Indicate by check mark whether the registrant is a shell company (as defined in Rule 12b-2 of the Exchange Act). Yes ☐ No ☒
The aggregate market value of the registrant’s common stock held by non-affiliates of the registrant was $55,800,186,642 based upon the closing price of $64.91 per share on the Nasdaq Global Select Market on July 28, 2023 (the last business day of the registrant’s most recently completed second quarter).
As of March 6, 2024, there were 866.0 million shares of the registrant’s common stock outstanding.
DOCUMENTS INCORPORATED BY REFERENCE
Portions of Part III of this Form 10-K are incorporated by reference from the registrant’s definitive proxy statement for its 2024 annual meeting of stockholders, which will be filed with the Securities and Exchange Commission within 120 days after the end of the fiscal year covered by this Form 10-K. Except with respect to information specifically incorporated by reference in this Form 10-K, the proxy statement is not deemed to be filed as part of this Form 10-K.
TABLE OF CONTENTS
MARVELL TECHNOLOGY, INC.
Forward-Looking Statements
This Annual Report on Form 10-K contains forward-looking statements within the meaning of Section 27A of the Securities Act of 1933, as amended (the “Securities Act”), and Section 21E of the Securities Exchange Act of 1934, as amended (the “Exchange Act”), which are subject to the “safe harbor” created by those sections. These statements involve known and unknown risks, uncertainties and other factors, which may cause our actual results to differ materially from those implied by the forward-looking statements. Words such as “anticipates,” “expects,” “intends,” “plans,” “projects,” “believes,” “seeks,” “estimates,” “forecasts,” “targets,” “may,” “can,” “will,” “would” and similar expressions identify such forward-looking statements.
Forward-looking statements are subject to risks and uncertainties that could cause actual results to differ materially from those indicated in the forward-looking statements. Factors that could cause actual results to differ materially from those predicted include, but are not limited to:
*•*risks related to changes in general macroeconomic conditions such as economic slowdowns, inflation, stagflation, rising interest rates, financial institution instability, and recessions or political conditions, such as the tariffs and trade restrictions with China, Russia and other foreign nations, and specific conditions in the end markets we address, including the continuing volatility in the technology sector and semiconductor industry and the U.S. National Science and Technology Council’s designation of semiconductors as a critical and emerging technology;
-
risks related to cancellations, rescheduling or deferrals of significant customer orders or shipments, as well as the ability of our customers to manage inventory;
-
risks related to our ability to scale our business;
-
risks related to our debt obligations;
-
risks related to the ability of our customers, particularly in jurisdictions such as China that may be subject to trade restrictions (including the need to obtain export licenses) to develop their own solutions or acquire fully developed solutions from third-parties;
-
risks related to our ability to design, develop and introduce new and enhanced products, in particular in the 5G, Cloud and Artificial Intelligence (“AI”) markets in a timely and effective manner, as well as our ability to anticipate and adapt to changes in technology;
-
risks related to our ability to successfully integrate and to realize anticipated benefits or synergies, on a timely basis or at all, in connection with our past, current, or any future acquisitions, divestitures, significant investments or strategic transactions;
-
risks related to the highly competitive nature of the end markets we serve, particularly within the semiconductor and infrastructure industries;
-
risks related to our dependence on a few customers for a significant portion of our revenue including risks related to severe financial hardship or bankruptcy or other attrition of one or more of our major customers, particularly as our major customers comprise an increasing percentage of our revenue;
-
risks related to our ability to execute on changes in strategy and realize the expected benefits from restructuring activities;
-
risks related to our ability to maintain a competitive cost structure for our manufacturing, assembly, testing and packaging processes and our reliance on third parties to produce our products;
-
risks related to the extension of lead time due to supply chain disruptions, component shortages that impact the costs and production of our products and kitting process, and constrained availability from other electronic suppliers impacting our customers’ ability to ship their products, which in turn may adversely impact our sales to those customers;
-
risks related to our ability to attract, retain and motivate a highly skilled workforce, especially engineering, managerial, sales and marketing personnel;
-
risks related to any current and future litigation, regulatory investigations, or contractual disputes with customers that could result in substantial costs and a diversion of management’s attention and resources that are needed to successfully maintain and grow our business;
-
risks related to gain or loss of a design win or key customer;
-
risks related to seasonality or volatility related to sales into the infrastructure, semiconductor and related industries and end markets;
-
risks related to failures to qualify our products or our suppliers’ manufacturing lines;
-
risks related to failures to protect our intellectual property, particularly outside the United States;
-
risks related to the potential impact of significant events or natural disasters or the effects of climate change (such as drought, flooding, wildfires, increased storm severity, sea level rise, and power outages), particularly in certain regions in which we operate or own buildings, such as Santa Clara, California, and where our third-party manufacturing partners or suppliers operate, such as Taiwan and elsewhere in the Pacific Rim;
-
risks related to our sustainability programs;
-
cybersecurity risks;
-
risks related to the impact of the COVID-19 pandemic or other future pandemics, on the global economy and on our customers, suppliers, employees and business; and
-
risks related to failures of our customers to agree to pay for NRE (non-recurring engineering) costs, failure to pay enough to cover the costs we incur in connection with NREs or non-payment of previously agreed NRE costs due to us.
Additional factors that could cause actual results to differ materially include the risks discussed in Part I, Item 1A, “Risk Factors.” These forward-looking statements speak only as of the date hereof. Unless required by law, we undertake no obligation to update publicly any forward-looking statements.
PART I
Item 1. Business
Our Company
Marvell Technology, Inc., together with its consolidated subsidiaries (“Marvell,” “MTI,” the “Company,” “we,” or “us”) is a leading supplier of data infrastructure semiconductor solutions, spanning the data center core to network edge. We are a fabless semiconductor supplier of high-performance standard and semi-custom products with core strengths in developing and scaling complex System-on-a-Chip architectures, integrating analog, mixed-signal and digital signal processing functionality. Leveraging leading intellectual property and deep system-level expertise, as well as highly innovative security firmware, our solutions are empowering the data economy and enabling the data center, enterprise networking, carrier infrastructure, consumer, and automotive/industrial end markets.
We currently are incorporated in Delaware, United States. Our corporate headquarters is 1000 N. West Street, Suite 1200 Wilmington, Delaware 19801, and our telephone number is (302) 295-4840. We also have operations in many countries, including Argentina, China, India, Israel, Japan, Singapore, South Korea, Taiwan and Vietnam. Our fiscal year ends on the Saturday nearest January 31.
Available Information
Our website address is www.marvell.com. The information contained on any website referred to in this Form 10-K does not form any part of this Annual Report on Form 10-K and is not incorporated by reference herein unless expressly noted. We make available free of charge through our website our annual reports on Form 10-K, our quarterly reports on Form 10-Q, our current reports on Form 8-K and amendments to those reports filed or furnished pursuant to Section 13(a) or 15(d) of the Securities Exchange Act of 1934, as amended (the “Exchange Act”), as soon as reasonably practicable after we electronically file these materials with, or furnish them to, the U.S. Securities and Exchange Commission (“SEC”). In addition, the SEC’s website, www.sec.gov, contains reports, proxy statements, and other information that we file electronically with the SEC.
Our Markets and Products
Our product solutions serve five large end markets: (i) data center, (ii) enterprise networking, (iii) carrier infrastructure, (iv) consumer, and (v) automotive/industrial. These markets and their corresponding customer products and applications are noted in the table below:
| End market | Customer products and applications | ||||
| Data center | •Cloud and on-premise Artificial intelligence (“AI”) systems •Cloud and on-premise ethernet switching •Cloud and on-premise network-attached storage (“NAS”) •Cloud and on-premise AI servers •Cloud and on-premise general-purpose servers •Cloud and on-premise storage area networks •Cloud and on-premise storage systems •Data center interconnect (“DCI”) | ||||
| Enterprise networking | •Campus and small medium enterprise routers •Campus and small medium enterprise ethernet switches •Campus and small medium enterprise wireless access points (“WAPs”) •Network appliances (firewalls, and load balancers) •Workstations | ||||
| Carrier infrastructure | •Broadband access systems •Ethernet switches •Optical transport systems •Routers •Wireless radio access network (“RAN”) systems | ||||
| Consumer | •Broadband gateways and routers •Gaming consoles •Home data storage •Home wireless access points (“WAPs”) •Personal Computers (“PCs”) •Printers •Set-top boxes | ||||
| Automotive/industrial | •Advanced driver-assistance systems (“ADAS”) •Autonomous vehicles (“AV”) •In-vehicle networking •Industrial ethernet switches •United States military and government solutions •Video surveillance |
The following table summarizes net revenue disaggregated by end market (in millions, except percentages):
| Year Ended | |||||||||||||||||||||||||||||||||||
| February 3, 2024 | % of Total | January 28, 2023 | % of Total | January 29, 2022 | % of Total | ||||||||||||||||||||||||||||||
| Data center | $ | 2,216.7 | 40 | % | $ | 2,408.8 | 41 | % | $ | 1,784.7 | 40 | % | |||||||||||||||||||||||
| Enterprise networking | 1,228.4 | 22 | % | 1,369.2 | 23 | % | 907.7 | 20 | % | ||||||||||||||||||||||||||
| Carrier infrastructure | 1,051.9 | 19 | % | 1,084.0 | 18 | % | 820.4 | 18 | % | ||||||||||||||||||||||||||
| Consumer | 622.4 | 11 | % | 701.1 | 12 | % | 700.0 | 16 | % | ||||||||||||||||||||||||||
| Automotive/industrial | 388.3 | 8 | % | 356.5 | 6 | % | 249.6 | 6 | % | ||||||||||||||||||||||||||
| Total | $ | 5,507.7 | $ | 5,919.6 | $ | 4,462.4 |
We categorize revenue from our five end markets by using a number of data points, including the type of customer purchasing the product, the function of our product being sold, and our knowledge of the end customer product or application into which our product will be incorporated. The categorization of products by end market is inherently subjective and can vary over time as a result of, for example, our knowledge of the ways in which our customers utilize our products.
We serve these five end markets with a broad portfolio of semiconductor solutions based on our compute, networking, security, electro-optics, and storage technologies, which are essential and differentiating for these markets.
Our portfolio of solutions integrate multiple analog, mixed-signal and digital intellectual property components incorporating hardware, firmware and software technologies and our system knowledge to provide our customers highly-integrated solutions for their end products. In addition to selling standard product solutions, where the exact same product is sold to multiple customers, we also offer optimized solutions which are customized to a specific customer’s requirements. The demand for optimized solutions has been increasing as our customers seek greater customization and differentiation for their products and services.
Our current product offerings include custom Application Specific Integrated Circuits (“ASICs”), electro-optics, ethernet solutions, fibre channel adapters, processors and storage controllers.
Custom ASICs
We develop custom SoC (System-on-a-Chip) solutions tailored to individual customer specifications that deliver system-level differentiation for next-generation carrier, networking, data center, artificial intelligence, automotive, aerospace and defense applications. These custom offerings are built on our proven ASIC platform which leverages a broad suite of differentiated Marvell intellectual property including ultra-high-speed SerDes, ARM compute, security, storage, and advanced packaging, including die to die interconnects and chiplets. We have successfully executed multiple 5 nanometer (“nm”) designs in the last few years, and are progressing through 3nm designs now and investing in the advanced 2nm generation platform.
Electro-optics
We offer a complete portfolio of high-speed optical communication semiconductor solutions for inside cloud data centers, between cloud data centers and in carrier networks. Our electro-optical products include PAM (pulse amplitude modulation) and coherent DSPs (digital signal processors), laser drivers, TIAs (trans-impedance amplifiers), silicon photonics and DCI (data center interconnect) solutions.
Our low-power and low-latency PAM DSPs implement equalization, estimation, clock recovery, carrier recovery, forward error correction, and coded modulation to enable ultra-fast data transmission speeds. In combination with our drivers, TIAs and silicon photonics, our suite of electro-optical products performs a wide range of functions such as amplifying, encoding, multiplexing, demultiplexing, and retiming signals. These products are key enablers for inter-connecting servers, routers, switches, storage and other infrastructure equipment that process, store and transport data traffic.
Our coherent TIAs, drivers and DSPs enable optical data transmission over distances of 100s to 1000s of kilometers in telecom carrier networks. Our PAM DSPs along with our accompanying TIAs and drivers deliver low-power and cost-effective solutions for optical connectivity inside cloud data centers. Our data center interconnect solutions enable pluggable transceiver technology to directly interconnect regional cloud data centers, at lower cost, complexity and power compared to traditional optical transport solutions.
Ethernet Solutions
We offer a broad portfolio of Ethernet solutions spanning controllers, network adapters, physical transceivers and switches. Our Ethernet solutions address a wide variety of end-customer data infrastructure products from small, high-reliability automotive sub-systems to large, high-performance modular enterprise and data center solutions.
Our Prestera and Teralynx Ethernet switches integrate market-optimized innovative features, such as advanced tunneling and routing, high throughput forwarding, and packet processing that make networks more effective at delivering content with low-latency and high-reliability. Our comprehensive Ethernet switch portfolio addresses enterprise campus, enterprise data center, industrial, carrier, cloud and AI system applications. The feature-rich Prestera® switch portfolio includes silicon optimized for each market and use case, with capacities ranging from 12Gbps to 12.8Tbps. The high-bandwidth Teralynx® switch portfolio is optimized for cloud data centers, with capacities up to 51.2Tbps, and beyond.
We complement our Ethernet switches and infrastructure processors with a broad selection of Alaska Ethernet physical-layer transceivers for both optical and copper interconnects with advanced power management, link security, and time synchronization features. Our Ethernet physical-layer transceiver portfolio addresses all the critical speeds ranging from 10Mbps to 1.6Tbps including the emerging Multi-Gigabit (“M-Gig”) speeds. Our M-Gig products offer increased data rates over existing cabling infrastructure, supporting data rates beyond 1Gbps and up to 10Gbps.
Our Ethernet controllers and network adapters are optimized to accelerate and simplify data center and enterprise networking. Our family of products provide exceptional value features and performance enabling the most agile and data-intensive applications. They deliver Ethernet connectivity for enterprise-class workstations all the way up to enterprise and cloud data centers.
For the automotive market, we offer an automotive-grade portfolio of Brightlane Ethernet physical-layer transceivers, bridges and switches supporting speeds from 100Mbps to 10Gbps with enhanced safety and security features required for today’s and tomorrow’s in-vehicle networks. Our Brightlane automotive Ethernet products provide the in-vehicle connectivity for key applications such as advanced driver assistance systems (“ADAS”), central gateways, body domain controllers, vehicle cameras, and in-vehicle infotainment. Our automotive products are being used and adopted across the broad spectrum of vehicle types: internal combustion engine (“ICE”) vehicles, battery electric vehicles (“BEVs”), plug-in hybrid electric vehicles (“PHEVs”), fuel cell electric vehicles (“FCEVs”) and traditional hybrids (“HEVs”).
Fibre Channel Products
Our QLogic Fibre Channel product family comprises of host bus adapters (“HBAs”) and controllers for server and storage system connectivity. These products accelerate enterprise and data center applications, deliver a highly resilient infrastructure, enable greater server virtualization density along with an advanced set of data center diagnostic, orchestration and quality of service capabilities to optimize information technology (“IT”) productivity. Our latest Fibre Channel products are well-suited for use with all-flash arrays by offering best-in-class latency and performance.
Processors
We offer highly integrated semiconductors that provide single or multiple core processors, along with intelligent Layer 2 through 7 processing of the OSI (Open Systems Interconnection) stack which is the framework that governs network communications within enterprise, data center, storage, and carrier markets. All of our products are compatible with standards-based operating systems and general-purpose software to enable ease of programming, and are supported by our ecosystem partners.
Our OCTEON data processor units (“DPUs”) and multi-core infrastructure processor families provide integrated Layer 4 through 7 data and security processing with additional capabilities at Layers 2 and 3 at line speeds. These software-compatible processors integrate next-generation networking I/Os along with advanced security, storage, and application hardware accelerators, offering programmability for the Layer 2 through Layer 7 processing requirements of intelligent networks. The OCTEON DPUs and processors are targeted for use in a wide variety of carrier, data center, and enterprise equipment, including routers, switches, security UTM appliances, content-aware switches, application-aware gateways, wireless access points, 3G/4G/5G wireless base stations, storage arrays, smart network interface controllers, network functions virtualization (“NFV”) and software-defined networking (“SDN”) infrastructure.
Our OCTEON Fusion family of wireless baseband infrastructure processors is a highly scalable product family supporting enterprise small cells, high capacity outdoor picocells and microcells all the way up to multi-sector macrocells for multiple wireless protocols including 5G. The key features include highly optimized processor cores, a highly efficient caching subsystem, high memory bandwidth digital signal processing engines along with a host of hardware accelerators. Additionally, multiple OCTEON Fusion chips can be cascaded for even denser deployments or higher order multiple-input and multiple-output, or MIMO. Our OCTEON Fusion processors have also been designed into 5G base station radio units to help enable Massive MIMO (Multiple Input Multiple Output) antenna and advanced Beamforming implementations.
Our NITROX security processor family provides the functionality required for Layer 3 to Layer 5 secure communication in a single chip. These single chip, custom-designed processors provide security protocol processing, encryption, authentication and compression algorithms to reduce the load on the system processor and increase total system throughput. The LiquidSecurity product family is a high-performance hardware-based transaction security solution for cloud data center and enterprise applications. It addresses the high-performance security requirements for private key management and administration. This family is available as an adapter with complete software or as a standalone appliance.
Our LiquidIO Server Adapter family is a high-performance, general-purpose programmable adapter platform that enables cloud data centers and enterprises to offload their server processors for higher performance and power efficiencies. The LiquidIO Server Adapter family is supported by a feature rich software development kit that allows customers and partners to develop high-performance SDN (software defined networking) applications with packet processing, switching, security, tunneling, quality of service, and metering.
Storage Controllers
We offer a broad portfolio of storage controllers for hard disk drives (“HDDs”) and solid-state-drives (“SSDs”) across all high-volume markets. Our Bravera controllers integrate several key Marvell technologies spanning compute, networking, security and storage. These key technologies enable our controllers to be optimized performance-power solutions and to help our customers high-efficient storage products. Our Bravera HDD controllers integrate Marvell’s industry-leading read channel technologies to enable higher volumetric densities at low power profiles and are being used by all the current HDD makers. Our technology density and power differentiators are critical for addressing the fast-growing high-capacity, nearline HDD data center and enterprise markets. To further enhance our Bravera HDD controller differentiation and value propositions, we offer customers preamplifier products as part of a chipset with our HDD controllers, seeking to increase our customers’ product efficiencies. Our Bravera HDD controllers support all the high-volume host system interfaces, including Serial Advanced Technology Attachment (“SATA”) and Serial Attached SCSI (“SAS”), which are critical for the data center and enterprise markets.
Our Bravera SSD controller products leverage our strong HDD controller know-how and system-level expertise. We integrate several of our Bravera HDD controller IPs with our flash technologies to deliver optimal solutions for data center, enterprise and client computing markets. Our Bravera SSD controller products integrate hardware and firmware components to help accelerate our customers’ time to market and maximize the capabilities of our solutions. Like our HDD controllers, our SSD controllers support all the high-volume SSD host system interfaces, including SAS, SATA, peripheral component interconnect express (“PCIe”), non-volatile memory express (“NVMe”) and NVMe over Fabrics (“NVMe-oF”).
Our new controller chipset products enable innovative flash-based storage architectures in data centers and enterprises. These solutions increase overall data center performance, density and scalability while lowering overall power, resulting in lower total cost of ownership for the infrastructure organizations.
Financial Information about Segments and Geographic Areas
We have determined that we operate in one reportable segment: the design, development and sale of integrated circuits. For information regarding our revenue by geographic area, and property and equipment by geographic area, please see “Note 15 – Segment and Geographic Information” in our Notes to Consolidated Financial Statements set forth in Part II, Item 8 of this Annual Report on Form 10-K. See “Risk Factors” under Item 1A of this Annual Report on Form 10-K for a discussion of the risks associated with our international operations.
Customers, Sales and Marketing
Our target customers are original equipment manufacturers (“OEMs”) and original design manufacturers, both of which design and manufacture end market devices. We seek to strategically align our sales force along key customer lines in order to offer fully integrated platforms to our customers. In this way, we believe we can more effectively offer a broader set of content into our key customers’ end products, without having multiple product groups separately engage the same customer. We seek to complement and support our direct sales force with manufacturers’ representatives for our products in North America. In addition, we have contracted with distributors who support our sales and marketing activities in the United States, Europe and Asia. We also use third-party logistics providers who maintain warehouses in close proximity to our customers’ facilities. We expect that a significant percentage of our sales will continue to come from direct sales to key customers.
We use field application engineers to provide technical support and assistance to existing and potential customers in designing, testing and qualifying systems designs that incorporate our products. Our marketing team works in conjunction with our field sales and application engineering force, and is organized around our product groups.
During fiscal 2024, 2023 and 2022, there was no net revenue attributable to a customer, other than one distributor, whose revenues as a percentage of net revenue was 10% or greater of total net revenues. Net revenue attributable to significant distributors whose revenues as a percentage of net revenue was 10% or greater of total net revenues is presented in the following table:
| Year Ended | |||||||||||||||||
| February 3, 2024 | January 28, 2023 | January 29, 2022 | |||||||||||||||
| Distributor: | |||||||||||||||||
| Distributor A | 24 | % | 20 | % | 15 | % | |||||||||||
Net revenue attributable to Distributor A increased due to the four module makers whose business activity increased in fiscal 2024 as they were involved in supporting data center sales to hyperscale customers.
We continue to monitor the creditworthiness of our customers and distributors and believe these distributors’ sales to diverse end customers and geographies further serve to mitigate our exposure to credit risk.
Inventory and Working Capital
We typically place firm orders with our suppliers up to 26 weeks prior to the anticipated delivery to our customer and may make further supply commitments up to 52 weeks to secure capacity. Occasionally, orders may be placed in advance of receiving a binding order from our customers. To secure capacity over the long term, we have entered into and expect to continue to enter into capacity reservation arrangements with certain foundries and substrate partners. We often maintain substantial inventories to meet short lead time orders for multi-year product runs.
Research and Development
We believe that our future success depends on our ability to introduce improvements to our existing products and to develop new products that deliver cost-effective solutions for both existing and new markets. Our research and development efforts are directed largely to the development of high-performance analog, mixed-signal, digital signal processing and accelerated compute circuits based on known microprocessor architectures with highest performance and lowest power consumption. We devote a significant portion of our resources to expanding our product portfolio based on a broad intellectual property portfolio with designs that are intended to enable high-performance, reliable communications over a variety of physical transmission media. We are also focused on incorporating functions currently provided by stand-alone integrated circuits into our integrated platform solutions to reduce our customers’ overall system costs. Our portfolio of products is based on foundational intellectual property on leading edge Advanced CMOS processes in 5nm and 3nm. Our development will also include state-of-the-art improvements of available process technologies in 2nm and below geometries. Advanced packaging technologies are also critical for reducing and optimizing overall system costs. Advanced packaging techniques like Chip on Wafer on Substrate (“CoWoS”), Integrated fanout (“InFo”) along with advanced substrates, thermal solutions enable large 2.5D/3D interposers for complex accelerated compute ASICs.
We have assembled a core team of engineers who have experience in the areas of complementary metal oxide semiconductor (“CMOS”) technology, digital signal processing, electro-optics, embedded microprocessors, mixed-signal circuit design, silicon photonics, and system-level architectures. We have invested and expect to continue to invest a significant amount in research and development. See our discussion of research and development expenses in Part II, Item 7, Management’s Discussion and Analysis of Financial Condition and Results of Operations, of this Annual Report on Form 10-K for further information.
Manufacturing
Integrated Circuit Fabrication
The vast majority of our integrated circuits are fabricated using widely available CMOS processes, which is intended to provide greater flexibility to engage independent foundries to manufacture integrated circuits at lower costs. By outsourcing manufacturing, we are able to avoid the cost associated with owning and operating our own manufacturing facilities. This is intended to allow us to focus our efforts on the design and marketing of our products. We seek to work closely with our foundry partners to forecast on a monthly basis our manufacturing capacity requirements. We also seek to closely monitor foundry production to help ensure consistent overall quality, reliability and yield levels. Our integrated circuits are currently fabricated in several advanced manufacturing processes. Because more precise manufacturing processes are expected to lead to enhanced performance, smaller silicon chip size and lower power requirements, we continually seek to evaluate the benefits and feasibility of migrating to smaller geometry process technology in order to reduce cost and improve performance.
Assembly and Test
We typically outsource all product packaging and testing requirements for our products in production to several assembly and test subcontractors primarily located in Taiwan, Canada, Korea, Singapore and China.
Governmental Regulations
Import/Export, National Security and Other Regulations Related to International Operations and Ownership
We are subject to laws and regulations worldwide, which may differ among jurisdictions, affecting our operations in areas including, but not limited to: intellectual property ownership and infringement; tax; import and export requirements; anti-corruption; foreign exchange controls and cash repatriation restrictions; conflict minerals; data privacy requirements; competition; advertising; employment; product regulations; environment, health and safety requirements; and consumer laws. For example, government export regulations apply to the encryption or other features contained in some of our products.
A portion of the business we acquired in our Avera acquisition in fiscal 2021 requires facility security clearances under the National Industrial Security Program. The National Industrial Security Program requires that a corporation maintaining a facility security clearance be effectively insulated from foreign ownership, control or influence (“FOCI”). Because we were organized in Bermuda at the time of the Avera acquisition, we entered into agreements with the U.S. Department of Defense with respect to FOCI mitigation arrangements that relate to our operation of the portion of the Avera business involving facility clearances. These measures and arrangements may materially and adversely affect our operating results due to the increased cost of compliance with these measures. If we fail to comply with our obligations under these agreements, our ability to operate our business may be adversely affected. Now that we are domiciled in the United States, we have requested to be released from some of the above FOCI-related obligations. We can offer no assurance that such a request will be granted in a timely manner or at all.
Primarily as a result of our acquisition of Avera, we are now a party to certain contracts with the U.S. government and its subcontractors. Our contracts with government entities are subject to various procurement regulations and other requirements relating to their formation, administration and performance.
See “Risk Factors” under Item 1A of this Annual Report on Form 10-K for additional information on regulatory matters.
Environmental Management
We are also subject to environmental rules and regulations in multiple jurisdictions, such as the European Union (“EU”) Directive on Restriction of Hazardous Substances (“RoHS”), the EU Regulation, Evaluation and Authorization of Chemicals SVHC Substances Directive, the EU Waste Electrical and Electronic Equipment Directive (“WEEE Directive”), China’s regulation on Management Methods for Controlling Pollution Caused by Electronic Information Products, and California Safe Drinking Water and Toxic Enforcement Act of 1986.
We believe that our products comply with the current Restriction of Hazardous Substances Directive, the European legislation that restricts the use of a number of substances, including lead, and the Regulation, Evaluation and Authorization of Chemicals SVHC Substances Directive. In addition, each of our manufacturing subcontractors certifies to us compliance with ISO 14001:2004, the international standard related to environmental management. We are also working to establish a “conflict-free” supply chain, including ethical sourcing of certain minerals for our products.
Intellectual Property
Our future revenue growth and overall success depend in large part on our ability to protect our intellectual property (“IP”). We rely on a combination of patents, copyrights, trademarks, trade secrets, contractual provisions, confidentiality agreements and licenses to protect our intellectual property. As of February 3, 2024, we have over 10,000 issued patents and pending patent applications in the United States and other countries, covering various aspects of our technology. The expiration of our patents ranges from 2024 to 2043, and none of the patents expiring in the near future are expected to be material to our IP portfolio as we are not substantially dependent on any single patent or group of related patents. While we believe the duration of our patents generally covers the expected lives of our products, our patents may not collectively or individually cover every feature on innovation in our product. In addition, our efforts may not be sufficient to protect our intellectual property from misappropriation or infringement. See “Risk Factors” under Item 1A of this Annual Report on Form 10-K for a discussion of the risks associated with our intellectual property.
We have expended and expect to continue to expend considerable resources in establishing a patent position designed to protect our intellectual property. While our ability to compete is enhanced by our ability to protect our intellectual property, we believe that in view of the rapid pace of technological change, the combination of the technical experience and innovative skills of our employees may be as important to our business as the legal protection of our patents and other proprietary information.
From time to time, we may desire or be required to renew or to obtain licenses from third parties in order to further develop and effectively market commercially viable products or in connection with a pending or future claim or action asserted against us. We cannot be sure that any necessary licenses will be available or will be available on commercially reasonable terms.
The integrated circuit industry is characterized by vigorous pursuit and protection of intellectual property rights, which has resulted in significant and often time consuming and expensive litigation. From time to time, we receive, and may continue to receive in the future, notices that claim we have infringed upon, misappropriated or misused the proprietary rights of other parties.
In addition, we have in the past and may in the future be sued by other parties who claim that we have infringed their patents or misappropriated or misused other intellectual property rights, or who may seek to invalidate one or more of our patents, trademarks, or other rights. Although we defend these claims vigorously, it is possible that we will not prevail in pending or future lawsuits. See “Risk Factors” under Item 1A of this Annual Report on Form 10-K and “Note 6 – Commitments and Contingencies” in our Notes to Consolidated Financial Statements set forth in Part II, Item 8, of this Annual Report on Form 10-K for further discussion of the risks associated with patent litigation matters.
Competition
The markets for our products are intensely competitive, and are characterized by rapid technological change, evolving industry standards, frequent new product introductions and pricing pressures. Competition has intensified as a result of the increasing demand for higher levels of performance, integration and smaller process geometries. We expect competition to further intensify as current competitors strengthen the depth and breadth of their product offerings, either through in-house development or by acquiring existing technology. In addition, some of our customers have chosen to develop certain semiconductor products internally and this trend may continue to proliferate. We believe that our ability to compete successfully in the rapidly evolving markets for our products depends on multiple factors, including, but not limited to:
-
the performance, features, quality and price of our products;
-
the development execution, timing and success of enhanced and new product introductions by us, our customers and our competitors;
-
the emergence, rate of adoption and acceptance of new industry standards;
-
market demand trends;
-
competitive tactics;
-
our ability to obtain adequate foundry capacity with the appropriate technological capability; and
-
the number and nature of our competitors in a given market.
Companies that compete directly with our businesses include, but are not limited to, Advanced Micro Devices, Inc.(“AMD”), Alchip Technologies (“Alchip”), Alphawave Semi (“Alphawave”), Astera Labs, Inc., Broadcom Inc.(“Broadcom”), Cisco Systems, Inc.(“Cisco”), Credo Technology Group Holding Ltd, Intel Corporation, Global Unichip Corporation (“GUC”), MACOM Technology Solutions Holdings, Inc., MediaTek Inc., Microchip Technology Inc., Montage Technology, Nvidia Corporation, NXP Semiconductors N.V., Phison Electronics Corporation, Qualcomm Incorporated (“Qualcomm”), Rambus, Inc., Realtek Semiconductor Corporation, Semtech Corporation, Silicon Motion Technology Corporation, and Socionext Inc. We expect increased competition in the future from both emerging and established companies, as well as from alliances among competitors, customers or other third parties, any of which could acquire significant market share. See “Risk Factors” under Item 1A of this Annual Report on Form 10-K for a discussion of competitive risks associated with our business.
We expect that the average unit selling prices of our products will continue to be subject to significant pricing pressures. In order to offset expected declines in the selling prices of our products, we will need to continue to introduce innovative new products and attempt to reduce the cost to design and manufacture our products. To accomplish this, we intend to continue to implement design changes that lower the cost of manufacturing, assembly and testing of our products. See “Risk Factors” under Item 1A of this Annual Report on Form 10-K for a discussion of pricing risks.
Sustainability
We are strengthening the company by acting on our highest priority sustainability topics. By integrating environmental and social considerations into our operations, supply chain and product design, we aim to deliver innovative semiconductor solutions that reduce impacts throughout our full value chain and meet customer expectations. Our sustainability initiatives are a corporate priority and strongly supported by our Board of Directors and leadership team. The following sections provide an overview of Human Capital and Climate Change management. More information can be found on the Environmental, Social and Governance (“ESG”) section of our website and in our annual ESG Report. Information contained on our website or in our annual ESG Report is not incorporated by reference into this or any other report we file with the SEC. See “Risk Factors” under Item 1A of this Annual Report on Form 10-K for a discussion of risks and uncertainties we face related to sustainability.
Human Capital
We believe that engaged and supported employees lead to innovation and collaboration, enabling our company to maintain a leadership position in our industry. Our ability to attract and retain the best talent from diverse backgrounds and establish a culture that embraces integrity, respect and inclusion is key to our goal to be a great place of work. We work hard to provide opportunities to learn and grow, and create an environment where our employees feel motivated, appreciated and engaged, and have a pathway to building a long-term career at Marvell.
Our Board of Directors (the “Board”) and its committees share oversight of our human capital management strategy. The Nominating and Governance Committee has oversight of our approach to human capital and inclusion and diversity as part of its broader focus on sustainability. Marvell annually conducts talent reviews and succession planning and the Board receives updates regularly from senior management on succession planning, management talent assessment, attrition and employee survey results. Our executive management team also reviews our human capital initiatives and our progress on such initiatives. The Audit Committee provides oversight of business risks and ethics and compliance programs, both of which have relevance for human capital- and workplace-related issues. The Executive Compensation Committee provides oversight of our overall compensation philosophy, policies and programs, and their respective alignment with our human capital strategy.
The Company employed 6,577 people as of February 3, 2024. As of February 3, 2024, our global workforce was comprised of approximately: 99% full time employees and 1% part time employees. Our employees sit across three geographical regions: 51% of employees are based in the Americas, 37% are in APAC (which includes India) and 12% are in EMEA.
Marvell’s Core Behaviors lay the foundation of our culture and are centered around four key aspects:
-
Act with integrity and treat everyone with respect,
-
Innovate to solve customer needs,
-
Execute with thoroughness and rigor, and
-
Help others achieve their objectives.
Our efforts to attract, develop, engage and retain employees, as well as our efforts to embed inclusion and diversity (“I&D”) across the Company, reinforce these behaviors. Our Core Behaviors also serve as a roadmap to help integrate employees as we grow through hiring and acquisitions.
Attracting and Retaining the Best Talent
We continue to invest in attracting and recruiting the best talent from across the world. By developing new sourcing strategies, we are striving for continuous flow of talent, despite the competitive market in technical talent. Our annual internship program has been a strong source of talent for our company. We also attract a diverse workforce through our university recruiting program, which helps us hire students across all degree levels from a number of universities around the world. This strategy helps provide us with a diversity of knowledge and unique approaches to solving technological challenges.
We are actively focused on retaining our people through our rewards, benefits, employee engagement and development programs, as well as by fostering an inclusive culture where our employees feel appreciated and purposeful. We are committed to offering our employees a comprehensive benefits package, competitive compensation, a range of wellness offerings, flexibility in hybrid work options and a safe work environment. Our efforts at retention also include measuring and evaluating employee turnover rates to obtain insights into employee dissatisfaction and to influence our actions and improve our internal policies.
Growing and Developing Our People
At Marvell, we pride ourselves on a culture of continuous learning, where we invest in the professional growth and careers of our employees. We have a variety of offerings including workshops, coaching, mentoring and educational resources, to develop employees so that they have the skills they need to deliver on our current and future business priorities.
Engineers and technical professionals make up the majority of our employee population. To support and develop our engineers, we offer avenues to pursue either technical or managerial career tracks at Marvell. We have also developed a suite of programs and events that provide opportunities for engineers to learn new skills, mentor colleagues and participate in activities that build our technical community around the world.
Inclusion and Diversity
At Marvell, we strive to create a workplace where every employee, regardless of background, feels respected and valued for who they are as an individual. This is a Core Behavior that guides our work. We also believe that a diverse, inclusive and equitable culture brings unique value to the work we do, as individuals and as a company.
Our Inclusion and Diversity (“I&D”) approach is centered around three key aspects:
-
Interconnected across the company: Embedding inclusivity in every function and in everything we do
-
Full participation and responsibility: Empowering every employee to do their part toward creating a welcoming and inclusive environment
-
Globally aligned and locally relevant: Applying our global strategic framework to specific regional and local site needs
Our efforts focus on four I&D business outcomes:
-
Activate and empower leaders
-
Create an inclusive best place to work
-
Cultivate a diverse workforce
-
Lead in the marketplace and community
Building a Great Place to Work
The mental, emotional and physical wellbeing of our employees is a top priority for our company. To create a safe workplace where people thrive, we continue to listen to our employees and evolve with their needs.
We work to provide support during times of mental stress or emotional challenges through a range of mental health resources. Another way we support employees is through paid time off for wellness. For example, we provide three recharge weekends throughout the year for our global employees, that allow them to focus on self-care, minimizing the risk of burnout and boosting productivity. Across the globe, many of our offices host events dedicated to employee fitness. We continue to introduce programs to support working parents, both globally and by country.
Everyone deserves a safe workplace and this includes our employees, contractors and visitors. While our workplaces are mainly office facilities, with limited safety hazards, we recognize the importance of preventing and addressing any risks that may occur. We work to prevent injury by focusing on ergonomics, internal audits and inspections, training and reporting mechanisms.
Fostering Organizational and Team Health
Nurturing the health of our company and teams starts with listening to and engaging with our employees globally. Recognizing that listening to our employees is critical to identifying opportunities to enhance our culture, we consistently look for new ways to solicit employees’ feedback. We also measure levels of engagement through our annual Voice of the Employee Survey, which helps us better understand employee needs and opportunities for improvement, and to develop action plans to address them. In addition, we measure levels of engagement in individual teams by gathering feedback from employees through a Manager 180 Survey.
How we work at Marvell is central to our culture. Our hybrid model allows flexibility for employees to work from home some of the time, while maintaining Marvell offices as a destination to collaborate, socialize with their teams, and engage customers. Our goal is to foster a dynamic workplace for our employees working from homes and offices all over the world, enabled by technology and powered by our core behaviors.
Climate Change
We are working on climate change mitigation and adaptation strategies in our direct operations and supply chain, to improve our resilience to potential risks and align our strategies with the goals of the Paris Agreement.
Management is responsible for formulating and executing our climate strategy. Marvell also runs an executive-level Sustainability Committee to provide senior leadership and strategic guidance on sustainability, as well as Sustainability Working Groups who are responsible for gathering data, setting strategy and goals, and supporting disclosure efforts on material sustainability topics. Marvell’s Chief Operations Officer (the “COO”) is the executive sponsor of the Environment Working Group and has overall responsibility at the executive level for climate strategy and related issues. The COO is responsible for assessing and leading the management of climate-related risks and opportunities, elevating stakeholder concerns and guiding the implementation of climate-related policies, programs and disclosures. The COO is also a member of the executive-level Sustainability Committee, and, in that capacity, is responsible for elevating climate topics to Marvell’s senior leadership and, ultimately, to the Board’s Nominating and Governance and Audit Committees. The Nominating and Governance Committee has oversight of our climate strategy and sustainability matters and receives quarterly updates on our sustainability performance. Our Board of Directors receives periodic updates on our sustainability performance.
Preparing for and responding to climate related risks and opportunities in our direct operations and supply chain is one of the key aspects of our business strategy. We have reported against the Task Force for Climate-related Financial Disclosures (“TCFD”) framework in our fiscal 2023 ESG Report and have conducted scenario analysis on the potential impacts of climate change to our business in alignment with the TCFD framework.
We have developed a 2030 Science Based Target to reduce greenhouse gas emissions across our value chain. We are working to strengthen our business by decarbonizing our operations, primarily our offices and Research & Development hubs. In addition, we are focused on developing power-efficient semiconductor solutions that help reduce energy consumption during the use phase. Across our product categories, we work collaboratively with our customers to meet their needs to optimize power performance. As a fabless semiconductor company, we also have a key opportunity to reduce our carbon impact in our supply chain. We engage our direct suppliers to reduce our own emissions and enable our customers to reduce their upstream emissions.
Health and Safety
We believe everyone deserves a safe workplace that supports their health and wellbeing. To help create this environment, we seek to continue to evolve our programs and resources to support employees’ mental and physical wellbeing.
The COVID-19 pandemic has placed a continued emphasis on health and safety at Marvell, and we took various steps to promote the health, safety and wellness of our employees during the crisis.
While our workplaces are mainly office facilities with limited safety hazards, we recognize the importance of preventing and addressing any risks that may occur. As a company, we work to prevent injury by focusing on ergonomics, employee training, maintenance, hazard reporting mechanisms and developing emergency action plans. We encourage our employees to report unsafe conditions.
Item 1A. Risk Factors
Investing in our common stock involves a high degree of risk. You should carefully consider the material risks and uncertainties described below and all information contained in this report before you decide to purchase our common stock. Many of these risks and uncertainties are beyond our control, including business cycles and seasonal trends of the computing, infrastructure, semiconductor and related industries and end markets. A manifestation of any of the following risks and uncertainties could, in circumstances we may or may not be able to accurately predict, render us unable to conduct our business as currently planned and materially and adversely affect our reputation, business, prospects, financial condition, cash flows, liquidity and operating results. In addition, the trading price of our common stock could decline due to the occurrence of any of these risks, and you could lose all or part of your investment. It is not possible to predict or identify all such risks and uncertainties; our operations could also be affected by risks or uncertainties that are not presently known to us or that we currently do not consider to present significant risks to our operations. Therefore, you should not consider the following discussion to be a complete statement of all the potential risks or uncertainties that we face.
SUMMARY OF FACTORS THAT MAY AFFECT OUR FUTURE RESULTS
The following summarizes the principal factors that make an investment in the Company speculative or risky. This summary should be read in conjunction with the remainder of this “Risk Factors” section and should not be relied upon as an exhaustive summary of the material risks facing our business. The occurrence of any of these risks could harm our business, financial condition, results of operations and/or growth prospects or cause our actual results to differ materially from those contained in forward-looking statements we have made in this report and those we may make from time to time. You should consider all of the risk factors described in our public filings when evaluating our business.
-
risks related to changes in general macroeconomic conditions such as economic slowdowns, inflation, stagflation, rising interest rates, financial institution instability, and recessions or political conditions, such as the tariffs and trade restrictions with China, Russia and other foreign nations, and specific conditions in the end markets we address, including the continuing volatility in the technology sector and semiconductor industry and the U.S. National Science and Technology Council’s designation of semiconductors as a critical and emerging technology;
-
risks related to cancellations, rescheduling or deferrals of significant customer orders or shipments, as well as the ability of our customers to manage inventory;
-
risks related to our ability to scale our business;
-
risks related to our debt obligations;
-
risks related to the ability of our customers, particularly in jurisdictions such as China that may be subject to trade restrictions (including the need to obtain export licenses) to develop their own solutions or acquire fully developed solutions from third-parties;
-
risks related to our ability to design, develop and introduce new and enhanced products, in particular in the 5G, Cloud and Artificial Intelligence (“AI”) markets, in a timely and effective manner, as well as our ability to anticipate and adapt to changes in technology;
-
risks related to our ability to successfully integrate and to realize anticipated benefits or synergies, on a timely basis or at all, in connection with our past, current, or any future acquisitions, divestitures, significant investments or strategic transactions;
-
risks related to the highly competitive nature of the end markets we serve, particularly within the semiconductor and infrastructure industries;
-
risks related to our dependence on a few customers for a significant portion of our revenue including risks related to severe financial hardship or bankruptcy or other attrition of one or more of our major customers, particularly as our major customers comprise an increasing percentage of our revenue;
-
risks related to our ability to execute on changes in strategy and realize the expected benefits from restructuring activities;
-
risks related to our ability to maintain a competitive cost structure for our manufacturing, assembly, testing and packaging processes and our reliance on third parties to produce our products;
-
risks related to the extension of lead time due to supply chain disruptions, component shortages that impact the costs and production of our products and kitting process, and constrained availability from other electronic suppliers impacting our customers’ ability to ship their products, which in turn may adversely impact our sales to those customers;
-
risks related to our ability to attract, retain and motivate a highly skilled workforce, especially engineering, managerial, sales and marketing personnel;
-
risks related to any current and future litigation, regulatory investigations, or contractual disputes with customers that could result in substantial costs and a diversion of management’s attention and resources that are needed to successfully maintain and grow our business;
-
risks related to gain or loss of a design win or key customer;
-
risks related to seasonality or volatility related to sales into the infrastructure, semiconductor and related industries and end markets;
-
risks related to failures to qualify our products or our suppliers’ manufacturing lines;
-
risks related to failures to protect our intellectual property, particularly outside the United States;
-
risks related to the potential impact of significant events or natural disasters or the effects of climate change (such as drought, flooding, wildfires, increased storm severity, sea level rise, and power outages), particularly in certain regions in which we operate or own buildings, such as Santa Clara, California, and where our third-party manufacturing partners or suppliers operate, such as Taiwan and elsewhere in the Pacific Rim;
-
risks related to our sustainability programs;
-
cybersecurity risks;
-
risks related to the impact of the COVID-19 pandemic or other future pandemics, on the global economy and on our customers, suppliers, employees and business; and
-
risks related to failures of our customers to agree to pay for NRE (non-recurring engineering) costs, failure to pay enough to cover the costs we incur in connection with NREs or non-payment of previously agreed NRE costs due to us.
Our quarterly results of operations have fluctuated in the past and could do so in the future. Because our results of operations are difficult to predict, you should not rely on quarterly comparisons of our results of operations as an indication of our future performance. Due to fluctuations in our quarterly results of operations and other factors, the price at which our common stock will trade is likely to continue to be highly volatile. Accordingly, you may not be able to resell your common stock at or above the price you paid. In future periods, our stock price could decline if, among other factors, our revenue or operating results are below our estimates or the estimates or expectations of securities analysts and investors. Our stock is traded on the Nasdaq Global Select Market under the ticker symbol “MRVL”. As a result of stock price volatility, we may be subject to securities class action litigation. Any litigation could result in substantial costs and a diversion of management’s attention and resources that are needed to successfully maintain and grow our business.
CHANGES IN PRODUCT DEMAND CAN ADVERSELY AFFECT OUR FINANCIAL RESULTS
We face risks related to recessions, inflation, stagflation and other macroeconomic conditions.
Customer demand for our products may be impacted by weak macroeconomic conditions,
Showing the first 8K of 136K characters. Open the full section
Item 1B. Unresolved Staff Comments
None.
Item 1C. Cybersecurity
Cybersecurity Risk Management and Strategy
We recognize the importance of assessing, identifying, and managing risks associated with cybersecurity threats, as such term is defined in Item 106(a) of Regulation S-K, and have implemented processes for our systems taking guidance from recognized cybersecurity frameworks, such as U.S. National Institute of Standards and Technology (“NIST”) Cyber Security Framework (“CSF”) in an effort to mitigate risks. As part of these proactive measures, we maintain a Cybersecurity Incident Response and Escalation Process with defined roles, responsibilities, and reporting protocols that is periodically reviewed, tested, and updated. The Company has an Executive Cyber Response and Disclosure Committee (consisting of senior executives from the business, finance, operations and legal functions), which is responsible for determining what actions are necessary to respond to cybersecurity events, with input from the Chief Information Security Officer and other subject matter experts directly participating in incident response efforts.
Identifying and assessing cybersecurity risk is integrated into our overall risk management systems and processes. Additionally, on a quarterly basis, our Audit Committee receives reports from the Chief Information Officer, Chief Information Security Officer, and other members of management. As part of its annual assessment, the Audit Committee evaluates significant risks related to our business including cybersecurity risks, and provides such information to our Board of Directors. Our Internal Audit Group also reviews our cybersecurity governance and controls annually.
Our cybersecurity risk management program encompasses periodic risk assessments, designed to help identify cybersecurity risks to our critical systems, information, services, and our broader enterprise IT environment. More specifically, an independent third-party performs a regular penetration test of Marvell’s IT infrastructure. In addition to our penetration testing, an independent third-party security firm is engaged to perform additional security controls testing and provide an independent report to our executive team. This external assessment provides us and our Audit Committee with a comprehensive evaluation of our security posture.
Our information security team plays a pivotal role in managing our cybersecurity risk. They oversee security controls and orchestrate our response to incidents—whether they originate internally or from our vendors, suppliers or other third parties that we conduct business with. As part of our vendor selection process, we evaluate cybersecurity risks in appropriate situations. Furthermore, we conduct tabletop exercises periodically. These simulations allow us to test our response strategies across various business functions, allowing preparedness for real-world incidents. When risks are identified through our processes, we analyze their potential impact on the Company and assess the likelihood of occurrence. Our monitoring efforts help us to timely mitigate and remediate risks and incidents. As part of our commitment to security awareness, information security training is mandatory for every employee and contractor. This ongoing compliance program reinforces best practices and helps to foster a security-conscious culture.
To safeguard our systems, we regularly install and update anti-malware and endpoint detection and response software across all IT-managed systems and workstations. These measures help detect and prevent malicious code from compromising our infrastructure.
We also engage third-party providers to bolster our cybersecurity risk management and strategy. Some provide ongoing assistance, including threat monitoring, mitigation strategies, and updates on emerging trends. Others provide targeted expertise, such as security assessments and forensic analysis.
Cybersecurity Governance
Our Board of Directors considers cybersecurity and other information technology risk as part of its risk oversight function. The Audit Committee receives quarterly reports from our Chief Information Security Officer (“CISO”) on our cybersecurity risks and risk management program. Our cybersecurity team, led by our CISO, who reports directly to our Executive Vice President and Chief Operations Officer, is responsible for assessing and managing risks from cybersecurity threats. The CISO and his team have primary responsibility for our overall cybersecurity risk management program and supervise both our internal cybersecurity personnel and any retained external cybersecurity experts. Our CISO has over 20 years of security experience managing global security organizations including architecture, operations, strategy, applications, infrastructure, support and execution. The information security team collectively have decades of relevant experience in the industry and many hold various cybersecurity certifications such as a Certified Information Systems Security Professional or Certified Information Security Manager. Further, we invest in regular, ongoing cybersecurity training for our team.
The CISO reports such cybersecurity threats and incidents to the Audit Committee. These reports may be included in, or in addition to, his regular quarterly reports to the Audit Committee. In addition, pursuant to our internal procedures, in the event of a significant cybersecurity incident, members of senior management will report such threats and incidents in a timely manner directly to the Audit Committee and, when appropriate, to the full Board of Directors.
We, like other technology companies operating in the current environment, have experienced cybersecurity incidents, but in the last three years we have not experienced an incident which has been determined to be material. For additional information regarding whether any risks from cybersecurity threats are reasonably likely to materially affect our company, including our business strategy, results of operations, or financial condition, please refer to “Cybersecurity risks could adversely affect our business and disrupt our operations” in Item 1A, “Risk Factors,” in this annual report on Form 10-K.
Item 2. Properties
The following table presents the approximate square footage of our significant owned and leased facilities as of February 3, 2024:
| (Square Feet) | ||||||||||||||||||||
| Locations | Primary Use | Owned Facilities | Leased Facilities (1) | |||||||||||||||||
| United States | Research and design, sales and marketing, administration and operations | 983,000 | 439,000 | |||||||||||||||||
| India | Research and design | — | 313,000 | |||||||||||||||||
| Israel | Research and design | — | 291,000 | |||||||||||||||||
| Taiwan | Research and design | — | 94,000 | |||||||||||||||||
| Singapore | Operations, and research and design | — | 71,000 | |||||||||||||||||
| Canada | Research and design | — | 56,000 | |||||||||||||||||
| China | Research and design, and sales and marketing | 116,000 | 16,000 | |||||||||||||||||
| Total | 1,099,000 | 1,280,000 |
(1)Lease terms expire in various years from 2024 through 2037; provided, however, that we have the option to extend certain leases past the current lease term. We have ceased-use lease facilities and subleased facilities of approximately 323,000 square feet in the United States that are excluded from the table above.
We also lease smaller facilities in various international locations, which are occupied by administrative, sales, design and field application personnel. Based on the potential for future hiring, we believe that our current facilities in most locations will be adequate to meet our requirements at least through the next fiscal year.
Item 3. Legal Proceedings
The information set forth under “Note 6 – Commitments and Contingencies” in our Notes to Consolidated Financial Statements set forth in Part II, Item 8 of this Annual Report on Form 10-K is incorporated herein by reference. For a discussion of certain risks associated with legal proceedings, please see Part I, Item 1A, “Risk Factors” above.
Item 4. Mine Safety Disclosures
Not Applicable.
PART II
Item 5. Market for Registrant’s Common Equity, Related Stockholder Matters and Issuer Purchases of Equity Securities
Market Information
Our shares of common stock are traded on the Nasdaq Global Select Market under the symbol “MRVL.” Shares of Marvell Technology Group Ltd. (our prior parent company) began trading under the MRVL symbol on June 27, 2000, upon completion of an initial public offering. As of April 20, 2021, shares of Marvell Technology, Inc. began trading under the symbol MRVL.
As of March 6, 2024, the approximate number of record holders of our common stock was 563 (not including beneficial owners of stock held in street name).
Stock Price Performance Graph
This performance graph shall not be deemed “filed” for purposes of Section 18 of the Exchange Act or incorporated by reference into any filings under the Securities Act or the Exchange Act, except as shall be expressly set forth by specific reference in such filing.
The graph below compares the cumulative total stockholder return of our common stock with the cumulative total return of the S&P 500 Index and the Philadelphia Semiconductor Index (“PHLX”) since February 2, 2019 through February 3, 2024. The graph compares a $100 investment on February 2, 2019 in our common stock with a $100 investment on February 2, 2019 in each index and assumes that any dividends were reinvested. Stockholder returns over the indicated periods should not be considered indicative of future stock prices or stockholder returns.
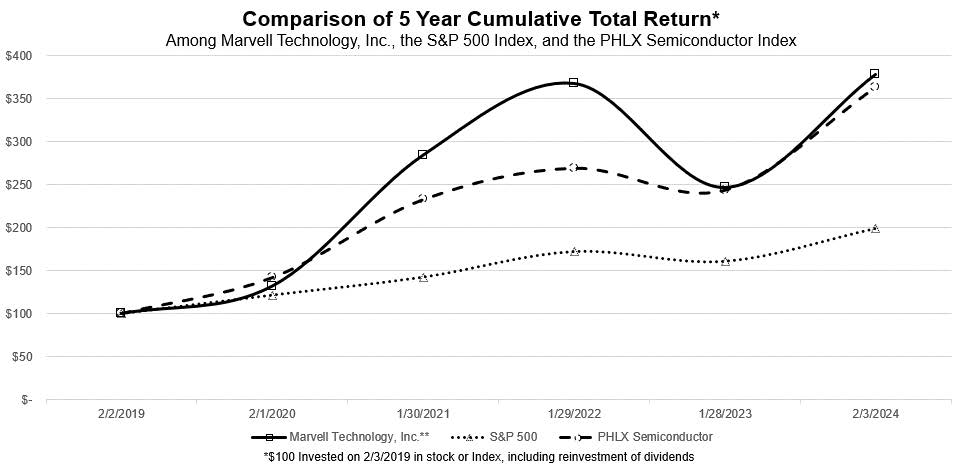
| 2/2/2019 | 2/1/2020 | 1/30/2021 | 1/29/2022 | 1/28/2023 | 2/3/2024 | ||||||||||||||||||||||||||||||||||||||||||
| Marvell Technology, Inc.** | $ | 100.00 | $ | 131.92 | $ | 284.34 | $ | 367.87 | $ | 246.73 | $ | 378.29 | |||||||||||||||||||||||||||||||||||
| S&P 500 | 100.00 | 121.56 | 142.53 | 172.46 | 161.03 | 199.42 | |||||||||||||||||||||||||||||||||||||||||
| PHLX Semiconductor | 100.00 | 141.76 | 232.45 | 269.10 | 243.43 | 363.11 | |||||||||||||||||||||||||||||||||||||||||
| **Information prior to April 20, 2021 is for Marvell Technology Group, Ltd. |
Dividends
Our Board of Directors declared quarterly cash dividends of $0.06 per share payable to holders of our common stock in each quarter of fiscal 2024, 2023 and 2022. As a result, we paid total cash dividends of $206.8 million in fiscal 2024, $204.4 million in fiscal 2023, and $191.0 million in fiscal 2022.
Future payment of a regular quarterly cash dividend on the Company’s common stock will be subject to, among other things, the best interests of the Company and its stockholders, the Company’s results of operations, cash balances and future cash requirements, financial condition, developments in ongoing litigation, statutory requirements under Delaware law and other factors that our Board of Directors may deem relevant. The Company’s dividend payments may change from time to time, and we cannot provide assurance that we will continue to declare dividends at all or in any particular amounts.
Recent Sales of Unregistered Securities
Sales of unregistered equity securities made during fiscal 2022 were disclosed on our Quarterly Reports on Form 10-Q for the quarters ended May 1, 2021; July 31, 2021; and October 30, 2021.
In fiscal 2023, on December 2, 2022, the Company acquired all the equity interests of a private company for cash and stock. Pursuant to this transaction, 439,499 shares of Marvell common stock were issued, which shares are subject to forfeiture in some circumstances. The shares of Marvell common stock were issued in a private placement pursuant to Rule 4(a)(2) of the Securities Act.
There were no sales of unregistered equity securities during fiscal 2024.
Issuer Purchases of Equity Securities
We resumed our stock repurchase program in the first quarter of fiscal 2023, which had been temporarily suspended in fiscal 2021 to preserve cash during the COVID-19 pandemic.
The following table presents details of our stock repurchases during the three months ended February 3, 2024 (in millions, except per share data):
| Period (1) | Total Number of Shares Purchased | Average Price Paid per Share | Total Number of Shares Purchased as Part of Publicly Announced Plans or Programs | Approximate Dollar Value of Shares that May Yet be Purchased Under the Plan or Programs (2) | ||||||||||||||||||||||
| October 29, 2023 to November 25, 2023 | — | $ | — | — | $ | 399.5 | ||||||||||||||||||||
| November 26, 2023 to December 23, 2023 | — | $ | — | — | $ | 399.5 | ||||||||||||||||||||
| December 24, 2023 to February 3, 2024 | 1.6 | $ | 62.72 | 1.6 | $ | 299.5 | ||||||||||||||||||||
| Total | 1.6 | $ | 62.72 | 1.6 |
(1)The monthly periods presented above for the three months ended February 3, 2024, are based on our fiscal accounting periods which followed a 4-4-6 week fiscal accounting period for the three months ended February 3, 2024.
(2)On November 17, 2016, we announced that our Board of Directors had authorized a $1.0 billion stock repurchase plan with no fixed expiration. The stock repurchase program replaced in its entirety the prior $3.3 billion stock repurchase program. On October 16, 2018, we announced that our Board of Directors authorized a $700.0 million addition to the balance of our existing stock repurchase plan. Our existing stock repurchase program had approximately $304.0 million of repurchase authority remaining as of October 16, 2018 prior to the approved addition. We intend to effect stock repurchases in accordance with the conditions of Rule 10b-18 under the Exchange Act, but may also make repurchases in the open market outside of Rule 10b-18 or in privately negotiated transactions. The stock repurchase program will be subject to market conditions and other factors and does not obligate us to repurchase any dollar amount or number of shares of our common stock and the repurchase program may be extended, modified, suspended or discontinued at any time. Subsequent to fiscal year end, in March 2024, our Board of Directors increased the repurchase program mentioned above and authorized an additional $3.0 billion to that repurchase program.
From August 2010 when our Board of Directors initially authorized a stock repurchase program through February 3, 2024, a total of 312.9 million shares have been repurchased under the Company’s stock repurchase program for a total $4.5 billion in cash and $299.5 million remains available for future stock repurchases. Subsequent to fiscal year end, with the additional authorized $3.0 billion to the repurchase program, $3.3 billion remains available for future stock repurchases as of March 6, 2024.
Our stock repurchase program is subject to market conditions, legal restrictions and regulations, and other factors, and does not obligate the Company to repurchase any dollar amount or number of shares of its common stock and the repurchase program may be extended, modified, suspended or discontinued at any time.
Item 6. Reserved
Item 7. Management’s Discussion and Analysis of Financial Condition and Results of Operations
The following discussion of our financial condition and results of operations should be read in conjunction with the financial statements and related notes included in this Annual Report on Form 10-K. This discussion contains forward-looking statements based upon current expectations that involve risks and uncertainties, including those discussed under Part I, Item 1A, “Risk Factors.” These risks and uncertainties may cause actual results to differ materially from those discussed in the forward-looking statements.
Overview
We are a leading supplier of data infrastructure semiconductor solutions, spanning the data center core to network edge. We are a fabless semiconductor supplier of high-performance standard and semi-custom products with core strengths in developing and scaling complex System-on-a-Chip architectures, integrating analog, mixed-signal and digital signal processing functionality. Leveraging leading intellectual property and deep system-level expertise, as well as highly innovative security firmware, our solutions are empowering the data economy and enabling the data center, enterprise networking, carrier infrastructure, consumer, and automotive/industrial end markets.
Our fiscal year is the 52- or 53-week period ending on the Saturday closest to January 31. Accordingly, every fifth or sixth fiscal year will have a 53-week period. The additional week in a 53-week year is added to the fourth quarter, making such quarter consist of 14 weeks. Fiscal 2024 had a 53-week period. Fiscal 2023 and fiscal 2022 each had a 52-week period.
Net revenue in fiscal 2024 was $5.5 billion and was 7.0% lower than net revenue of $5.9 billion in fiscal 2023. This was due to a decrease in sales from a majority of our end markets. Sales decreased from the data center end market by 8%, from the enterprise networking end market by 10%, from the consumer end market by 11%, and from the carrier infrastructure end market by 3%. The decreases were partially offset by an increase in sales from the automotive/industrial end market by 9% compared to fiscal 2023.
During the second half of fiscal 2023, in response to a softening demand environment, customers started requesting to push out shipments and reschedule orders to manage their inventory. We have seen these inventory corrections continue to impact our storage customers, as well as enterprise networking and our wired carrier customers. In addition, we have continued to see low demand from our OEM customers in China. Starting in the first quarter of fiscal 2024, we have seen a strong increase in demand for our optical products, driven by AI applications.
To secure capacity over the long term, we have entered into and expect to continue to enter into capacity reservation arrangements with certain foundries and partners for substrates. See “Note 6 – Commitments and Contingencies” in the Notes to Consolidated Financial Statements for additional information.
We expect that the U.S. government’s export restrictions on certain Chinese customers to continue to impact our revenue. Moreover, concerns that U.S. companies may not be reliable suppliers as a result of these and other actions has caused, and may in the future cause, some of our customers in China to amass large inventories of our products well in advance of need or cause some of our customers to replace our products in favor of products from other suppliers. Customers in China may also choose to develop indigenous solutions, as replacements for products that are subject to U.S. export controls. In addition, there may be indirect impacts to our business that we cannot easily quantify such as the fact that some of our other customers’ products which use our solutions may also be impacted by export restrictions. See also Part I, Item IA, “Risk Factors,” including, but not limited to, the risk detailed under the caption “Adverse changes in the political, regulatory and economic policies of governments in connection with trade with China and Chinese customers have reduced the demand for our products and damaged our business.”
Restructuring. In the first quarter of fiscal 2024, we initiated a restructuring plan to streamline our organization and optimize resources. The restructuring and other related charges recorded were $131.1 million for the year ended February 3, 2024. See “Note 10 - Restructuring” in the Notes to Consolidated Financial Statements for further information.
Capital Return Program. We remain committed to delivering stockholder value through our stock repurchase and dividend programs. Under the program authorized by our Board of Directors, we may repurchase shares of our common stock in the open-market or through privately negotiated transactions. The extent to which we repurchase our stock and the timing of such repurchases will depend upon market conditions, legal rules and regulations, and other corporate considerations, as determined by our management team. During the year ended February 3, 2024, we repurchased 2.5 million shares of our common stock for $150.0 million, including 0.8 million shares of our common stock repurchased for $50.0 million pursuant to a 10b5-1 trading plan. As of February 3, 2024, $299.5 million remained available for future stock repurchases. Subsequent to fiscal year end, in March 2024, our Board of Directors increased the repurchase program mentioned above and authorized an additional $3.0 billion to that repurchase program. See “Note 11 – Stockholders’ Equity” in the Notes to Consolidated Financial Statements for further information.
As of February 3, 2024, a total of 312.9 million shares have been repurchased since inception of our current and previous stock repurchase programs for an aggregate total of $4.5 billion in cash. We returned $356.8 million to stockholders in fiscal 2024 through $150.0 million in repurchases of shares of common stock and $206.8 million in cash dividends.
Cash and Short-Term Investments. Our cash and cash equivalents were $950.8 million at February 3, 2024, which were $39.8 million higher than our balance at January 28, 2023 of $911.0 million.
Sales and Customer Composition. We regularly monitor the creditworthiness of our customers and distributors and believe these distributors’ sales to diverse end customers and geographies further serve to mitigate our exposure to credit risk.
Most of our sales are made to customers with operations located outside of the United States, primarily in Asia, and a majority of our products are manufactured outside the United States. Sales shipped to customers with operations in Asia represented approximately 70% of our net revenue in fiscal 2024, 75% of our net revenue in fiscal 2023 and 78% of our net revenue in fiscal 2022. Because many manufacturers and manufacturing subcontractors of our customers are located in Asia, we expect that most of our net revenue will continue to be represented by sales to our customers in that region. For risks related to our global operations, see Part I, Item 1A, “Risk Factors,” including but not limited to the risk detailed under the caption “We face additional risks due to the extent of our global operations since a majority of our products, and those of many of our customers, are manufactured and sold outside of the United States. The occurrence of any or a combination of the additional risks described below would significantly and negatively impact our business and results of operations.”
The development process for our products is long, which may cause us to experience a delay between the time we incur expenses and the time revenue is generated from these expenditures. We anticipate that the rate of new orders may vary significantly from quarter to quarter. For risks related to our sales cycle, see Part I, Item 1A, “Risk Factors,” including but not limited to the risk detailed under the caption “We are subject to order and shipment uncertainties. If we are unable to accurately predict customer demand, we may hold excess or obsolete inventory, which would reduce our gross margin. Conversely, we may have insufficient inventory or be unable to obtain the supplies or contract manufacturing capacity to meet demand which would result in lost revenue opportunities and potential loss of market share as well as damaged customer relationships.”
Critical Accounting Policies and Estimates
The preparation of consolidated financial statements in conformity with accounting principles generally accepted in the United States of America (“GAAP”) requires management to make estimates, judgments and assumptions that affect the reported amounts of assets, liabilities, revenues and expenses, and related disclosure of contingent assets and liabilities. On an ongoing basis, we evaluate our estimates, including those related to revenue recognition, provisions for sales returns and allowances, inventory excess and obsolescence, goodwill and other intangible assets, business combinations, restructuring, income taxes, litigation, and other contingencies. We base our estimates of the carrying value of certain assets and liabilities on historical experience and on various other assumptions that are believed to be reasonable under the circumstances when these carrying values are not readily available from other sources. Actual results could differ from these estimates, and such differences could affect the results of operations reported in future periods. In the current macroeconomic environment, these estimates could require increased judgment and carry a higher degree of variability and volatility. We continue to monitor and assess our estimates in light of developments, and as events continue to evolve and additional information becomes available, our estimates may change materially in future periods. We believe the following critical accounting policies affect our more significant judgments and estimates used in the preparation of our consolidated financial statements. For further information on our significant accounting policies, see “Note 2 – Significant Accounting Policies” in the Notes to Consolidated Financial Statements.
Revenue Recognition. We recognize revenue upon transfer of control of promised products or services to customers in an amount that reflects the consideration we expect to receive in exchange for those products or services. Under the revenue recognition standard, we apply the following five step approach: (1) identify the contract with a customer, (2) identify the performance obligations in the contract, (3) determine the transaction price, (4) allocate the transaction price to the performance obligations in the contract, and (5) recognize revenue when a performance obligation is satisfied.
We enter into contracts that may include various combinations of products and services that are capable of being distinct and accounted for as separate performance obligations. To date, the majority of the revenue has been generated by sales of products as revenue from services has been insignificant. Performance obligations associated with product sales transactions are generally satisfied when control passes to customers upon shipment. Accordingly, product revenue is recognized at a point in time when control of the asset is transferred to the customer. We recognize revenue when we satisfy a performance obligation by transferring control of a product to a customer in an amount that reflects the consideration to which we expect to be entitled in exchange for those goods or services. For product revenue, the performance obligation is deemed to be the delivery of the product and therefore, the revenue is generally recognized upon shipment to customers, net of accruals for estimated sales returns and rebates. These estimates are based on historical returns, analysis of credit memo data and other known factors. Actual returns could differ from these estimates. We account for rebates by recording reductions to revenue for rebates in the same period that the related revenue is recorded. The amount of these reductions is based upon the terms agreed to with the customer. Some of our sales are made to distributors under agreements allowing for price protection, price discounts and limited rights of stock rotation on products unsold by the distributors. Control passes to the distributor upon shipment, and terms and payment by our distributors is not contingent on resale of the product. Product revenue on sales made to distributors is recognized upon shipment, net of estimated variable consideration. Variable consideration primarily consists of price discounts, price protection, rebates, and stock rotation programs and is estimated based on a portfolio approach using the expected value method derived from historical data, current economic conditions, and contractual terms. Actual variable consideration could differ from these estimates.
A portion of our net revenue is derived from sales through third-party logistics providers who maintain warehouses in close proximity to our customers’ facilities. Revenue from sales through these third-party logistics providers is not recognized until the product is pulled from stock by the customer.
Our products are generally subject to warranty, which provides for the estimated future costs of replacement upon shipment of the product. We generally warrant that our products sold to our customers will conform to our approved specifications and be free from defects in material and workmanship under normal use and conditions for one year. We may offer a longer warranty period in limited situations based on product type and negotiated warranty terms with certain customers. The warranty accrual is estimated primarily based on historical claims compared to historical revenues and assumes that we will have to replace products subject to a claim. From time to time, we become aware of specific warranty situations, and we record specific accruals to cover these exposures.
Inventories. We value our inventory at the lower of cost or net realizable value, cost being determined under the first-in, first-out method. We regularly review inventory quantities on hand and record a reduction to the total carrying value of our inventory for any difference between cost and estimated net realizable value of inventory that is determined to be excess, obsolete or unsellable inventory based primarily on our estimated forecast of product demand and production requirements. The estimate of future demand is compared to our inventory levels, including open purchase commitments, to determine the amount, if any, of obsolete or excess inventory. Demand for our products can fluctuate significantly from period to period. A significant decrease in demand could result in an increase in the amount of excess inventory on hand. In addition, our industry is characterized by rapid technological change, frequent new product development and rapid product obsolescence that could result in an increase in the amount of obsolete inventory quantities on hand. Additionally, our estimates of future product demand and judgement to determine excess inventory may prove to be inaccurate, in which case we may have understated or overstated the reduction to the total carrying value of our inventory for excess and obsolete inventory. In the future, if our inventory is determined to be overvalued, we would be required to recognize such costs in our cost of goods sold at the time of such determination. Likewise, if our inventory is determined to be undervalued, we may have over-reported our cost of goods sold in previous periods and would be required to recognize additional gross margin at the time the related inventory is sold. Therefore, although we make every effort to ensure the accuracy of our forecasts of future product demand, any significant unanticipated changes in demand or technological developments could have a significant impact on the value of our inventory and our results of operations.
Accounting for Income Taxes. We estimate our income taxes in each of the jurisdictions in which we operate. This process involves estimating our actual tax expense together with assessing temporary differences resulting from the differing treatment of certain items for tax return and financial statement purposes. These differences result in deferred tax assets and liabilities, which are included in our consolidated balance sheets.
We recognize income taxes using an asset and liability approach. This approach requires the recognition of taxes payable or refundable for the current year, and deferred tax liabilities and assets for the future tax consequences of events that have been recognized in our consolidated financial statements or tax returns. The measurement of current and deferred taxes is based on provisions of the enacted tax law and the effects of future changes in tax laws or rates are not anticipated.
Evaluating the need for a valuation allowance for deferred tax assets requires judgment and analysis of all available positive and negative evidence, including recent earnings history and cumulative losses in recent years, reversals of deferred tax liabilities, projected future taxable income, and tax planning strategies to determine whether all or some portion of the deferred tax assets will not be realized. Forming a conclusion that a valuation allowance is not needed is difficult when there is negative evidence such as cumulative losses in recent years. Using available evidence and judgment, we establish a valuation allowance for deferred tax assets, when it is determined that it is more likely than not that they will not be realized. Valuation allowances have been provided primarily against U.S. federal and state research and development credits and certain acquired net operating losses and deferred tax assets of foreign subsidiaries. A change in the assessment of the realizability of deferred tax assets may materially impact our tax provision in the period in which a change of assessment occurs. Taxes due on Global Intangible Low-Taxed Income (“GILTI”) inclusions in U.S. are recognized as a current period expense when incurred.
As a multinational corporation, we conduct our business in many countries and are subject to taxation in many jurisdictions. The taxation of our business is subject to the application of various and sometimes conflicting tax laws and regulations as well as multinational tax conventions. Our effective tax rate is highly dependent upon the geographic distribution of our worldwide earnings or losses, the tax laws and regulations in various jurisdictions, the availability of tax incentives, tax credits and loss carryforwards, and the effectiveness of our tax planning strategies, which includes our estimates of the fair value of our intellectual property. The application of tax laws and regulations is subject to legal and factual interpretation, judgment and uncertainty. Tax laws themselves are subject to change as a result of changes in fiscal policy, changes in legislation, and the evolution of regulations and court rulings and tax audits. There can be no assurance that we will accurately predict the outcome of audits, and the amounts ultimately paid on resolution of audits could be materially different than the amounts previously included in our income tax expense and therefore, could have a material impact on our tax provision, results of operations, and cash flows. Consequently, taxing authorities may impose tax assessments or judgments against us that could materially impact our tax liability and/or our effective income tax rate.
We are subject to income tax audits by the respective tax authorities in the jurisdictions in which we operate. We recognize the effect of income tax positions only if these positions are more likely than not to be sustained. Recognized income tax positions are measured at the largest amount that is more than 50% likely to be realized. Changes in judgment regarding the recognition or measurement of uncertain tax positions are reflected in the period in which the change occurs. We record interest and penalties related to unrecognized tax benefits in income tax expense. The calculation of our tax liabilities involves the inherent uncertainty associated with complex tax laws. We believe we have adequately provided for in our financial statements additional taxes that we estimate to be required to be paid as a result of such examinations. While we believe that we have adequately provided for all tax positions, amounts asserted by tax authorities could be greater or less than our accrued position. Unpaid tax liabilities, including the interest and penalties, are released pursuant to a final settlement with tax authorities, completion of audit or expiration of various statutes of limitations. The material jurisdictions in which we may be subject to examination by tax authorities throughout the world include China, India, Israel, Singapore, Germany, and the United States.
The recognition and measurement of current taxes payable or refundable, and deferred tax assets and liabilities require that we make certain estimates and judgments. Changes to these estimates or judgments may have a material effect on our income tax provision in a future period.
Long-Lived Assets and Intangible Assets. We assess the impairment of long-lived assets and intangible assets whenever events or changes in circumstances indicate that the carrying amount of long-lived assets may not be recoverable. Circumstances which could trigger a review include, but are not limited to the following:
-
significant decreases in the market price of the asset;
-
significant adverse changes in the business climate or legal factors;
-
accumulation of costs significantly in excess of the amount originally expected for the acquisition or construction of the asset;
-
current period cash flow or operating losses combined with a history of losses or a forecast of continuing losses associated with the use of the asset; and
-
current expectation that the asset will more likely than not be sold or disposed of significantly before the end of its estimated useful life.
Whenever events or changes in circumstances suggest that the carrying amount of long-lived assets and intangible assets may not be recoverable, we estimate the future cash flows, undiscounted and without interest charges, expected to be generated by the asset from its use or eventual disposition. If the sum of the expected undiscounted future cash flows is less than the carrying amount of those assets, we recognize an impairment loss based on the excess of the carrying amount over the fair value of the assets. Significant management judgment is required in the forecasts of future operating results that are used in the discounted cash flow method of valuation. These significant judgments may include future expected revenue, expenses, capital expenditures and other costs, discount rates and whether or not alternative uses are available for impacted long-lived assets.
Goodwill. We record goodwill when the consideration paid for a business acquisition exceeds the fair value of net tangible and intangible assets acquired. Goodwill is measured and tested for impairment annually on the last business day of our fiscal fourth quarter, and more frequently, if an event occurs or circumstances change that indicate the fair value of the reporting unit may be below its carrying amount. We have identified that our business operates as a single operating segment and as a single reporting unit for the purpose of goodwill impairment testing.
When testing goodwill for impairment, we first assess qualitative factors to determine whether it is more likely than not that the fair value of a reporting unit is less than its carrying amount or we may determine to proceed directly to the quantitative impairment test.
Factors we consider important in the qualitative assessment which could trigger a goodwill impairment review include;
-
significant underperformance relative to historical or projected future operating results;
-
significant changes in the manner of our use of the acquired assets or the strategy for our overall business;
-
significant negative industry or economic trends;
-
a significant decline in our stock price for a sustained period; and
-
a significant change in our market capitalization relative to our net book value.
If we assess qualitative factors and conclude that it is more likely than not that the fair value of a reporting unit is less than its carrying amount, or if we determine not to use the qualitative assessment, then a quantitative impairment test is performed. The quantitative impairment test requires comparing the fair value of the reporting unit to its carrying value, including goodwill. An impairment exists if the fair value of the reporting unit is lower than its carrying value. We would record an impairment loss in the fiscal quarter in which an impairment determination is made. Determining the fair value of a reporting unit involves the use of significant estimates and assumptions.
As of the last day of the fourth quarter of fiscal 2024, we performed our annual impairment assessment for testing goodwill. A quantitative assessment was performed. Based on our assessment, we determined there was no goodwill impairment.
Business Combinations. We allocate the fair value of the purchase consideration of a business acquisition to the tangible assets, liabilities, and intangible assets acquired, including in-process research and development (“IPR&D”), based on their estimated fair values. The excess of the fair value of purchase consideration over the fair values of these identifiable assets and liabilities is recorded as goodwill. IPR&D is initially capitalized at fair value as an intangible asset with an indefinite life and assessed for impairment thereafter. When an IPR&D project is completed, the IPR&D is reclassified as an amortizable purchased intangible asset and amortized over the asset’s estimated useful life. Our valuation of acquired assets and assumed liabilities requires significant estimates, especially with respect to intangible assets. The valuation of intangible assets, in particular, requires that we use valuation techniques such as the income approach. The income approach includes the use of a discounted cash flow model, which includes discounted cash flow scenarios and requires the following significant estimates: future expected revenue, expenses, capital expenditures and other costs, and discount rates. We estimate the fair value based upon assumptions we believe to be reasonable, but which are inherently uncertain and unpredictable and, as a result, actual results may differ from estimates. Estimates associated with the accounting for acquisitions may change as additional information becomes available regarding the assets acquired and liabilities assumed. Acquisition-related expenses and related restructuring costs are recognized separately from the business combination and are expensed as incurred.
Results of Operations
Years Ended February 3, 2024 and January 28, 2023
The following table sets forth information derived from our consolidated statements of operations expressed as a percentage of net revenue:
| Year Ended | |||||||||||||||||
| February 3, 2024 | January 28, 2023 | ||||||||||||||||
| Net revenue | 100.0 | % | 100.0 | % | |||||||||||||
| Cost of goods sold | 58.4 | 49.5 | |||||||||||||||
| Gross profit | 41.6 | 50.5 | |||||||||||||||
| Operating expenses: | |||||||||||||||||
| Research and development | 34.4 | 30.1 | |||||||||||||||
| Selling, general and administrative | 15.1 | 14.3 | |||||||||||||||
| Legal settlement | — | 1.7 | |||||||||||||||
| Restructuring related charges | 2.4 | 0.4 | |||||||||||||||
| Total operating expenses | 51.9 | 46.5 | |||||||||||||||
| Operating income (loss) | (10.3) | 4.0 | |||||||||||||||
| Interest income | 0.2 | 0.1 | |||||||||||||||
| Interest expense | (3.8) | (2.9) | |||||||||||||||
| Other income, net | 0.2 | 0.2 | |||||||||||||||
| Income (loss) before income taxes | (13.7) | 1.4 | |||||||||||||||
| Provision for income taxes | 3.2 | 4.2 | |||||||||||||||
| Net loss | (16.9) | % | (2.8) | % |
Net Revenue
| Year Ended | |||||||||||||||||
| February 3, 2024 | January 28, 2023 | % Change in 2024 | |||||||||||||||
| (in millions, except percentage) | |||||||||||||||||
| Net revenue | $ | 5,507.7 | $ | 5,919.6 | (7.0) | % |
Our net revenue for fiscal 2024 decreased by $411.9 million compared to net revenue for fiscal 2023. This was due to a decrease in sales from a majority of our end markets. Sales decreased from the data center end market by 8%, from the enterprise networking end market by 10%, from the consumer end market by 11%, and from the carrier infrastructure end market by 3%. The decreases were partially offset by an increase in sales from the automotive/industrial end market by 9% compared to fiscal 2023.
The overall decrease in net revenue of 7% for fiscal 2024 was primarily driven by lower unit shipments related to storage products, partially offset by higher average selling prices for certain products as well as an increase in demand for our optical products, driven by AI applications.
Cost of Goods Sold and Gross Profit
| Year Ended | |||||||||||||||||
| February 3, 2024 | January 28, 2023 | % Change in 2024 | |||||||||||||||
| (in millions, except percentages) | |||||||||||||||||
| Cost of goods sold | $ | 3,214.1 | $ | 2,932.1 | 9.6 | % | |||||||||||
| % of net revenue | 58.4 | % | 49.5 | % | |||||||||||||
| Gross profit | $ | 2,293.6 | $ | 2,987.5 | (23.2) | % | |||||||||||
| % of net revenue | 41.6 | % | 50.5 | % |
Cost of goods sold as a percentage of net revenue increased for fiscal 2024 compared to fiscal 2023, which includes charges of $251.0 million for product related claim matters that were fully resolved in the fourth quarter of fiscal 2024, as well as a shift in product mix. Refer to “Note 6 - Commitments and Contingencies” in the Notes to Consolidated Financial Statements for further information on the product related claim matters. As a result, gross margin for fiscal 2024 decreased 8.9 percentage points compared to fiscal 2023.
Research and Development
| Year Ended | |||||||||||||||||
| February 3, 2024 | January 28, 2023 | % Change in 2024 | |||||||||||||||
| (in millions, except percentages) | |||||||||||||||||
| Research and development | $ | 1,896.2 | $ | 1,784.3 | 6.3 | % | |||||||||||
| % of net revenue | 34.4 | % | 30.1 | % |
Research and development expense increased by $111.9 million in fiscal 2024 compared to fiscal 2023. The increase was primarily due to $57.4 million of higher engineering design costs and $45.6 million of higher employee compensation related costs.
Selling, General and Administrative
| Year Ended | |||||||||||||||||
| February 3, 2024 | January 28, 2023 | % Change in 2024 | |||||||||||||||
| (in millions, except percentages) | |||||||||||||||||
| Selling, general and administrative | $ | 834.0 | $ | 843.6 | (1.1) | % | |||||||||||
| % of net revenue | 15.1 | % | 14.3 | % |
Selling, general and administrative expense was relatively flat in fiscal 2024 compared to fiscal 2023.
Stock-Based Compensation Expense
| Year Ended | |||||||||||
| February 3, 2024 | January 28, 2023 | ||||||||||
| (in millions) | |||||||||||
| Cost of goods sold | $ | 49.1 | $ | 43.3 | |||||||
| Research and development | 411.1 | 372.4 | |||||||||
| Selling, general and administrative | 149.6 | 136.7 | |||||||||
| Total stock-based compensation | $ | 609.8 | $ | 552.4 |
Stock-based compensation expense increased by $57.4 million in fiscal 2024 compared to fiscal 2023. Stock-based compensation under research and development, selling, general and administrative, and cost of goods sold increased by $38.7 million, $12.9 million, and $5.8 million, respectively. The increase was primarily due to an increase in equity awards granted in fiscal 2024 as compared to prior years, as well as an increase in expense associated with our employee stock purchase plan.
Legal Settlement
| Year Ended | |||||||||||||||||
| February 3, 2024 | January 28, 2023 | % Change in 2024 | |||||||||||||||
| (in millions, except percentages) | |||||||||||||||||
| Legal settlement | $ | — | $ | 100.0 | * | ||||||||||||
| % of net revenue | — | % | 1.7 | % |
*Not meaningful
We recorded a charge of $100.0 million in fiscal 2023 related to the settlement of a contractual dispute. Refer to “Note 6 – Commitments and Contingencies” in the Notes to Consolidated Financial Statements for further information.
Restructuring Related Charges
| Year Ended | |||||||||||||||||
| February 3, 2024 | January 28, 2023 | ||||||||||||||||
| (in millions) | |||||||||||||||||
| Restructuring related charges | $ | 131.1 | $ | 21.6 | |||||||||||||
We recorded total restructuring related charges of $131.1 million in fiscal 2024 as a result of our restructuring plan to streamline our organization and optimize resources. Refer to “Note 10 – Restructuring” in the Notes to Consolidated Financial Statements for further information.
Interest Income
| Year Ended | |||||||||||||||||
| February 3, 2024 | January 28, 2023 | % Change in 2024 | |||||||||||||||
| (in millions, except percentages) | |||||||||||||||||
| Interest income | $ | 8.8 | $ | 5.3 | 66.0 | % | |||||||||||
| % of net revenue | 0.2 | % | 0.1 | % |
Interest income increased by $3.5 million in fiscal 2024 compared to fiscal 2023 due to higher interest rates on our invested cash.
Interest Expense
| Year Ended | |||||||||||||||||
| February 3, 2024 | January 28, 2023 | % Change in 2024 | |||||||||||||||
| (in millions, except percentages) | |||||||||||||||||
| Interest expense | $ | (211.7) | $ | (170.6) | 24.1 | % | |||||||||||
| % of net revenue | (3.8) | % | (2.9) | % |
Interest expense increased by $41.1 million in fiscal 2024 compared to fiscal 2023. The increase was primarily due to higher interest expense associated with the 2024 and 2026 Term Loans, as well as interest expense associated with the 2029 and 2033 Senior Notes issued during the third quarter of fiscal 2024. Refer to “Note 4 – Debt” in the Notes to Consolidated Financial Statements for further information.
Other Income, net
| Year Ended | |||||||||||||||||
| February 3, 2024 | January 28, 2023 | % Change in 2024 | |||||||||||||||
| (in millions, except percentages) | |||||||||||||||||
| Other income, net | $ | 11.9 | $ | 12.4 | (4.0)% | ||||||||||||
| % of net revenue | 0.2 | % | 0.2 | % |
Other income, net was relatively flat in fiscal 2024 compared to fiscal 2023.
Provision for Income Taxes
| Year Ended | |||||||||||||||||
| February 3, 2024 | January 28, 2023 | % Change in 2024 | |||||||||||||||
| (in millions, except percentage) | |||||||||||||||||
| Provision for income taxes | $ | 174.7 | $ | 248.6 | (29.7) | % |
The income tax expense for fiscal 2024 differs from the U.S. federal statutory rate of 21% as a result of foreign income inclusions in the U.S., a portion of our earnings or losses being taxed or benefited at rates lower than the U.S. statutory rate, research and development credit generation, and disallowed deductions related to non-deductible compensation. Further, during fiscal 2024, guidance was issued by the U.S. Internal Revenue Service in connection with the capitalization of research and development expenditures. As a result of this guidance, certain costs are currently deductible rather than capitalizable, which resulted in a reduction to our income tax payable and an increase in our deferred tax assets for which we maintain a full valuation allowance.
The income tax expense for fiscal 2023 differed from the U.S. federal statutory rate of 21% primarily due to the remeasurement of Singapore deferred taxes upon extension of our tax incentive in Singapore, tax benefits attributable to reduction in tax reserves as a result of settled income tax audits in combination with the lapsing of statute of limitations, offset by foreign income inclusions in the U.S., and a tax expense related to the recapture of Israel corporate income taxes. The income tax expense for fiscal 2023 is also impacted by a substantial portion of our earnings, or in some cases, losses being taxed or benefited at rates lower than the U.S. statutory rate, stock compensation tax benefits, and disallowed deductions related to non-deductible compensation.
Our provision for incomes taxes may be affected by changes in the geographic mix of earnings with different applicable tax rates, acquisitions, changes in the realizability of deferred tax assets, accruals related to contingent tax liabilities and period-to-period changes in such accruals, the results of income tax audits, the expiration of statutes of limitations, the implementation of tax planning strategies, tax rulings, court decisions, settlements with tax authorities and changes in tax laws and regulations. It is also possible that significant negative evidence may become available that causes us to conclude that a valuation allowance is needed on certain of our deferred tax assets, which would adversely affect our income tax provision in the period of such change in judgment. Additionally, please see the information in “Item 1A. Risk Factors” under the caption “Changes in existing taxation benefits, tax rules or tax practices may adversely affect our financial results.”
Our Annual Report on Form 10-K for the fiscal year ended January 28, 2023 includes a discussion and analysis of our financial condition and results of operations for the year ended January 29, 2022 and year-to-year comparisons between the fiscal years ended January 28, 2023 and January 29, 2022 in Item 7 of Part II, “Management’s Discussion and Analysis of Financial Condition and Results of Operations.”
Liquidity and Capital Resources
Our principal source of liquidity as of February 3, 2024 consisted of approximately $950.8 million of cash and cash equivalents, of which approximately $744.1 million was held by subsidiaries outside of the United States. We manage our worldwide cash requirements by, among other things, reviewing available funds held by our foreign subsidiaries and the cost effectiveness by which those funds can be accessed in the United States. See “Note 13 – Income Taxes” in the Notes to Consolidated Financial Statements for further information.
In December 2020, to fund the Inphi acquisition, we executed the 2024 and 2026 Term Loan Agreement to obtain the 2024 and 2026 Term Loans. On April 14, 2023, we entered into an amendment to the 2024 and 2026 Term Loan Agreement. The amendment modifies the existing agreement to, among other things, adopt Secured Overnight Financing Rate (“SOFR”) interest rates and conform the maximum leverage ratio financial covenant with the amended and restated revolving credit agreement. During the quarter ended October 28, 2023, we repaid in full the 3-Year Tranche Loan, due on April 19, 2024 (“2024 Term Loan”), which had a remaining principal of $735.0 million. For the year ended February 3, 2024, we repaid $87.5 million of the principal outstanding of the 5-Year Tranche Loan (“2026 Term Loan”). As of February 3, 2024, we had $700.0 million borrowings outstanding under the 2026 Term Loan.
In December 2020, we also executed a debt agreement to obtain a $750.0 million revolving credit facility. On April 14, 2023, we entered into an agreement to amend and restate the credit facility to increase the borrowing capacity to $1.0 billion (as so amended and restated, the “2023 Revolving Credit Facility”). The 2023 Revolving Credit Facility has a 5-year term and a stated floating interest rate which equates to an adjusted term SOFR plus an applicable margin. During the quarter ended April 29, 2023, we drew down $200.0 million on the 2023 Revolving Credit Facility. During the quarter ended July 29, 2023, the Company drew down $50.0 million on the 2023 Revolving Credit Facility and repaid $50.0 million in the same quarter. During the quarter ended October 28, 2023, we repaid the outstanding 2023 Revolving Credit Facility of $200.0 million. Further, we drew down an additional $50.0 million on the 2023 Revolving Credit Facility and repaid $50.0 million in the same quarter. As of February 3, 2024, the 2023 Revolving Credit Facility is undrawn and will be available for draw down through April 14, 2028.
During the quarter ended July 29, 2023, the MTI 2023 Notes and MTG 2023 Notes with aggregate principal of $500.0 million matured on June 22, 2023 and was repaid.
On September 18, 2023, we completed a debt offering and issued (i) $500.0 million of Senior Notes with a 5.5-year term due in 2029 (“2029 Senior Notes”) and (ii) $500.0 million of Senior Notes with a 10-year term due in 2033 (“2033 Senior Notes”).
As of February 3, 2024, we had total borrowings outstanding of $4.2 billion, consisting of $3.5 billion of senior notes outstanding and $700.0 million outstanding under the 2026 Term Loan.
For a description of our contractual obligations including debt, leases, and purchase commitments, see “Note 4 – Debt,” “Note 5 – Leases,” and “Note 6 – Commitments and Contingencies” in the Notes to Consolidated Financial Statements. In addition, see “Note 13 – Income Taxes” regarding tax related contingencies and uncertain tax positions in the Notes to Consolidated Financial Statements. We generally expect to satisfy these commitments with cash on hand and cash provided by operating activities.
We may elect to factor trade accounts receivable from time to time as part of our overall liquidity and working capital management strategy. During the year ended February 3, 2024, we generated cash from operations from the sale of certain trade accounts receivable on a non-recourse basis to a third-party financial institution pursuant to a factoring arrangement. See “Note 16 - Supplemental Financial Information” in the Notes to Consolidated Financial Statements for additional information.
We believe that our existing cash, cash equivalents, together with cash generated from operations, and funds from our 2023 Revolving Credit Facility will be sufficient to cover our working capital needs, capital expenditures, investment requirements, any declared dividends, repurchases of our common stock and commitments (including those discussed in “Note 6 – Commitments and Contingencies” in the Notes to Consolidated Financial Statements) for at least the next twelve months. Our capital requirements will depend on many factors, including our rate of sales growth, market acceptance of our products, costs of securing access to adequate manufacturing capacity, the timing and extent of research and development projects and increases in operating expenses, all of which are subject to uncertainty.
To the extent that our existing cash and cash equivalents, together with cash generated by operations, and funds available under our 2023 Revolving Credit Facility are insufficient to fund our future activities, we may need to raise additional funds through public or private debt or equity financing. We may also acquire additional businesses, purchase assets or enter into other strategic arrangements in the future, which could also require us to seek debt or equity financing. Additional equity financing or convertible debt financing may be dilutive to our current stockholders. If we elect to raise additional funds, we may not be able to obtain such funds on a timely basis or on acceptable terms, if at all. In addition, the equity or debt securities that we issue may have rights, preferences or privileges senior to our common stock.
Future payment of a regular quarterly cash dividend on our common stock and our planned repurchases of common stock will be subject to, among other things, the best interests of the Company and our stockholders, our results of operations, cash balances and future cash requirements, financial condition, developments in ongoing litigation, statutory requirements under Delaware law, U.S. securities laws and regulations, market conditions and other factors that our Board of Directors may deem relevant. Our dividend payments and repurchases of common stock may change from time to time, and we cannot provide assurance that we will continue to declare dividends or repurchase stock at all or in any particular amounts.
Cash Flows from Operating Activities
Net cash provided by operating activities was $1.4 billion for fiscal 2024 compared to net cash provided by operating activities of $1.3 billion for fiscal 2023. We had a net loss of $933.4 million adjusted for the following non-cash items: amortization of acquired intangible assets of $1.1 billion, stock-based compensation expense of $609.8 million, depreciation and amortization of $299.8 million, deferred income tax expense of $150.8 million, restructuring related impairment charges of $32.9 million, amortization of deferred debt issuance costs and debt discounts of $10.7 million, and $44.2 million net loss from other non-cash items. Cash inflow from working capital of $57.8 million for fiscal 2024 was primarily driven by a decrease in accounts receivable, and a decrease in inventories, partially offset by cash outflows due to an increase in prepaid expenses and other assets, and a decrease in accounts payable. The decrease in accounts receivable was primarily due to timing of billing and collections and the impact of factoring of receivables. The decrease in inventory was a result of utilizing previously built buffers. The increase in prepaid expenses and other assets was primarily due to prepayments on supply capacity reservation agreements net of refunds, and an increase in ship and debit reserve. The decrease in accounts payable was primarily due to the timing of payments.
Net cash provided by operating activities was $1.3 billion for fiscal 2023 compared to net cash provided by operating activities of $819.3 million for fiscal 2022. We had a net loss of $163.5 million adjusted for the following non-cash items: amortization of acquired intangible assets of $1.1 billion, stock-based compensation expense of $552.4 million, depreciation and amortization of $304.9 million, deferred income tax expense of $50.4 million, amortization of inventory fair value adjustment associated with Innovium acquisition of $38.7 million, amortization of deferred debt issuance costs and debt discounts of $10.3 million, restructuring related impairment charges of $5.6 million, and $52.4 million net loss from other non-cash items. Cash outflow from working capital of $649.8 million for fiscal 2023 was primarily driven by an increase in accounts receivable, an increase in inventories, an increase in prepaid expenses and other assets, and a decrease in accounts payable partially offset by cash inflows due to an increase in accrued liabilities and other non-current liabilities, and an increase in accrued employee compensation. The increase in accounts receivable was primarily due to increase in sales, as well as changes to the timing of shipments due to evolving supply chain dynamics. We increased inventory in order to better support unfulfilled backlog, new product ramps and the impact from inventory correction late in the year. The increase in prepaid expenses and other assets was primarily due to prepayments on supply capacity reservation agreements and an increase in ship and debit reserve. The decrease in accounts payable was primarily due to the timing of payments. The increase in accrued liabilities and other non-current liabilities was primarily due to accruals relating to settlement of contractual disputes and an increase in ship and debit claim reserve due to price increases and stock replenishment. The increase in accrued employee compensation was due to increases in our bonus accrual and in employee contributions to the employee stock purchase plan, net of payments.
Cash Flows from Investing Activities
Net cash used in investing activities of $350.5 million in fiscal 2024 was primarily driven by the purchases of property and equipment of $336.3 million, and purchases of technology licenses of $13.9 million.
Net cash used in investing activities of $328.4 million in fiscal 2023 was primarily driven by the purchases of property and equipment of $206.2 million, net cash consideration for business acquisitions of $112.3 million, and purchases of technology licenses of $11.1 million.
Cash Flows from Financing Activities
Net cash used in financing activities of $980.2 million in fiscal 2024 was primarily attributable to $1.6 billion repayment of debt principal, $223.7 million for withholding tax paid on behalf of employees for net share settlement, $206.8 million payment for our quarterly dividends, $150.3 million payments for technology license obligations, and $150.0 million repurchases of common stock. These outflows were partially offset by $1.3 billion proceeds from issuance of debt, and $99.2 million proceeds from the issuance of our common stock under our equity incentive plans.
Net cash used in financing activities of $662.9 million in fiscal 2023 was primarily attributable to $265.6 million repayment of debt principal, $227.6 million for withholding tax paid on behalf of employees for net share settlement, $204.4 million payment for our quarterly dividends, $142.5 million payments for technology license obligations, and $115.0 million repurchases of common stock. These outflows were partially offset by proceeds from issuance of debt of $200.0 million, and $91.3 million proceeds from the issuance of our common stock under our equity incentive plans.
Recent Accounting Pronouncements
Please see “Note 2 – Significant Accounting Policies - Recent Accounting Pronouncements” in our Notes to Consolidated Financial Statements set forth in Part II, Item 8 of this Annual Report on Form 10-K.
Related Party Transactions
None.
Item 7A. Quantitative and Qualitative Disclosures About Market Risk
Interest Rate Risk. With our outstanding debt, we are exposed to various forms of market risk, including the potential losses arising from adverse changes in interest rates on our outstanding 2026 Term Loan. See “Note 4 – Debt” in our Notes to Consolidated Financial Statements for further information. A hypothetical increase or decrease in the interest rate by 1 percentage point may result in an increase or decrease in annual interest expense by approximately $6.4 million.
We maintain an investment policy that requires minimum credit ratings, diversification of credit risk and limits the long-term interest rate risk by requiring effective maturities of generally less than five years. We typically invest our excess cash primarily in highly liquid debt instruments including money market funds and time deposits. Investments in both fixed rate and floating rate interest earning securities carry a degree of interest rate risk. Fixed rate securities may have their fair market value adversely impacted due to a rise in interest rates, while floating rate securities may produce less income than predicted if interest rates fall. There were no such investments on hand at February 3, 2024, aside from cash and cash equivalents.
Foreign Currency Exchange Risk. All of our sales and the majority of our expenses are denominated in U.S. dollars. Since we operate in many countries, a percentage of our international operational expenses are denominated in foreign currencies and exchange volatility could positively or negatively impact those operating costs. Increases in the value of the U.S. dollar relative to other currencies could make our products more expensive, which could negatively impact our ability to compete. Conversely, decreases in the value of the U.S. dollar relative to other currencies could result in our suppliers raising their prices to continue doing business with us. Additionally, we may hold certain assets and liabilities, including potential tax liabilities, in local currency on our consolidated balance sheet. These tax liabilities would be settled in local currency. Therefore, foreign exchange gains and losses from remeasuring the tax liabilities are recorded to interest and other income, net. We do not believe that foreign exchange volatility has a material impact on our current business or results of operations. However, fluctuations in currency exchange rates could have a greater effect on our business or results of operations in the future to the extent our expenses increasingly become denominated in foreign currencies.
We may enter into foreign currency forward and option contracts with financial institutions to protect against foreign exchange risks associated with certain existing assets and liabilities, certain firmly committed transactions, forecasted future cash flows and net investments in foreign subsidiaries. However, we may choose not to hedge certain foreign exchange exposures for a variety of reasons, including, but not limited to, accounting considerations and the prohibitive economic cost of hedging particular exposures.
To provide an assessment of the foreign currency exchange risk associated with our foreign currency exposures within operating expense, we performed a sensitivity analysis to determine the impact that an adverse change in exchange rates would have on our financial statements. If the U.S. dollar weakened by 10%, our operating expense could increase by approximately 2%.
Item 8. Financial Statements and Supplementary Data
INDEX TO CONSOLIDATED FINANCIAL STATEMENTS
REPORT OF INDEPENDENT REGISTERED PUBLIC ACCOUNTING FIRM
To the stockholders and the Board of Directors of Marvell Technology, Inc.
Opinion on the Financial Statements
We have audited the accompanying consolidated balance sheets of Marvell Technology, Inc. and subsidiaries (the "Company") as of February 3, 2024 and January 28, 2023, the related consolidated statements of operations, comprehensive loss, stockholders' equity, and cash flows, for each of the three years in the period ended February 3, 2024, and the related notes and the schedules listed in the Index at Item 15 (collectively referred to as the "financial statements"). In our opinion, the financial statements present fairly, in all material respects, the financial position of the Company as of February 3, 2024, and January 28, 2023, and the results of its operations and its cash flows for each of the three years in the period ended February 3, 2024, in conformity with accounting principles generally accepted in the United States of America.
We have also audited, in accordance with the standards of the Public Company Accounting Oversight Board (United States) (PCAOB), the Company's internal control over financial reporting as of February 3, 2024, based on criteria established in Internal Control — Integrated Framework (2013) issued by the Committee of Sponsoring Organizations of the Treadway Commission and our report dated March 13, 2024, expressed an unqualified opinion on the Company's internal control over financial reporting.
Basis for Opinion
These financial statements are the responsibility of the Company’s management. Our responsibility is to express an opinion on the Company’s financial statements based on our audits. We are a public accounting firm registered with the PCAOB and are required to be independent with respect to the Company in accordance with the U.S. federal securities laws and the applicable rules and regulations of the Securities and Exchange Commission and the PCAOB.
We conducted our audits in accordance with the standards of the PCAOB. Those standards require that we plan and perform the audit to obtain reasonable assurance about whether the financial statements are free of material misstatement, whether due to error or fraud. Our audits included performing procedures to assess the risks of material misstatement of the financial statements, whether due to error or fraud, and performing procedures that respond to those risks. Such procedures included examining, on a test basis, evidence regarding the amounts and disclosures in the financial statements. Our audits also included evaluating the accounting principles used and significant estimates made by management, as well as evaluating the overall presentation of the financial statements. We believe that our audits provide a reasonable basis for our opinion.
Critical Audit Matter
The critical audit matter communicated below is a matter arising from the current-period audit of the financial statements that was communicated or required to be communicated to the audit committee and that (1) relates to accounts or disclosures that are material to the financial statements and (2) involved our especially challenging, subjective, or complex judgments. The communication of critical audit matters does not alter in any way our opinion on the financial statements, taken as a whole, and we are not, by communicating the critical audit matter below, providing a separate opinion on the critical audit matter or on the accounts or disclosures to which it relates.
Inventories – Management Judgments Regarding Excess and Obsolete Inventory Reserves — Refer to Note 2 to the financial statements.
Critical Audit Matter Description
Management writes down excess inventories based upon regular analysis of inventory on hand compared to forecasted demand. Management’s estimates of forecasted demand are based upon analysis and assumptions including, but not limited to, expected product lifecycles and development plans, expected customer orders, projected and current market conditions, historical usage by product, and customer backlog. As of February 3, 2024, the Company’s consolidated inventories balance was $864.4 million.
We identified inventory valuation as a critical audit matter because of the significant assumptions management makes with regards to estimating the excess write-down and the potential impact of those judgments in periods of market uncertainty. Specifically, due to the ongoing market uncertainty, including the business impact of the macroeconomic environment, performing audit procedures to evaluate the reasonableness of management’s estimates of forecasted demand required a high degree of auditor judgment and increased audit effort.
How the Critical Audit Matter Was Addressed in the Audit
Our audit procedures related to management’s estimates of forecasted demand used in the valuation of inventory included the following, among others:
-
We tested the effectiveness of internal controls over management’s provisions for excess and obsolete inventories, including internal controls designed to review and approve forecasted demand and the underlying assumptions regarding expected product lifecycles, product development plans, expected customer orders, projected and current market conditions, and historical usage by product.
-
We evaluated management’s ability to accurately estimate forecasted demand by comparing estimates made in prior periods to the historical actual results for those same periods.
-
We made inquiries of business unit managers throughout the period as well as executives, sales and marketing, and operations personnel about the expected product lifecycles and product development plans and historical usage by product and compared expectations to actual developments over the period.
-
We selected a sample of inventory products and tested the forecasted demand by comparing internal and external information (e.g., historical usage, cont
Showing the first 8K of 218K characters. Open the full section
Item 9. Changes in and Disagreements with Accountants on Accounting and Financial Disclosure
None.
Item 9A. Controls and Procedures
Management’s Evaluation of Disclosure Controls and Procedures
Management, with the participation of our principal executive officer and principal financial officer, has evaluated the effectiveness of our disclosure controls and procedures (as defined in Rules 13a-15(e) and 15d-15(e) of the Exchange Act) as of February 3, 2024. Disclosure controls and procedures are designed to ensure that information required to be disclosed in the reports we file or submit under the Exchange Act is recorded, processed, summarized and reported within the time periods specified in the rules and forms of the SEC and that such information is accumulated and communicated to management, including our principal executive officer and principal financial officer, as appropriate, to allow timely decisions regarding required disclosures. Based on this evaluation, our principal executive officer and principal financial officer concluded that our disclosure controls and procedures were effective as of February 3, 2024.
Management has concluded that the consolidated financial statements included in this Form 10-K present fairly, in all material respects, our financial position, results of operations and cash flows for the periods presented in conformity with accounting principles generally accepted in the United States.
Management’s Report on Internal Control Over Financial Reporting
Management is responsible for establishing and maintaining adequate internal control over financial reporting as defined in Rules 13a-15(f) and 15d-15(f) of the Exchange Act. Internal control over financial reporting consists of policies and procedures that: (1) pertain to the maintenance of records that, in reasonable detail, accurately and fairly reflect the transactions and dispositions of the assets of the Company; (2) are designed and operated to provide reasonable assurance regarding the reliability of our financial reporting and our process for the preparation of financial statements for external purposes in accordance with generally accepted accounting principles and that receipts and expenditures of the Company are being made only in accordance with authorizations of management and directors of the Company; and (3) provide reasonable assurance regarding prevention or timely detection of unauthorized acquisition, use or disposition of the Company’s assets that could have a material effect on the financial statements.
Our internal control over financial reporting is designed by, and under the supervision of the principal executive officer and principal financial officer and effected by the Company’s Board of Directors, management, and others. Because of its inherent limitations, internal control over financial reporting may not prevent or detect all misstatements. Also, projections of any evaluation of effectiveness of future periods are subject to the risk that controls may become inadequate because of changes in conditions, or that the degree of compliance with the policies or procedures may deteriorate.
Under the supervision and with the participation of our management, including our principal executive officer and principal financial officer, we conducted an evaluation of the effectiveness of our internal control over financial reporting as of February 3, 2024 using the criteria for effective internal control over financial reporting as described in “Internal Control-Integrated Framework,” issued by the Committee of Sponsoring Organization of the Treadway Commission (2013 framework) (the COSO Criteria). Based on this assessment, management concluded that our internal control over financial reporting was effective as of February 3, 2024.
The effectiveness of our internal control over financial reporting as of February 3, 2024 has been audited by Deloitte & Touche LLP, our independent registered public accounting firm, as stated in its report that is included herein.
Inherent Limitations on Effectiveness of Controls
Our management, including our principal executive officer and our principal financial officer, does not expect that our disclosure controls or our internal control over financial reporting will prevent or detect all error and all fraud. A control system, no matter how well designed and operated, can provide only reasonable, not absolute, assurance that the control system’s objectives will be met. The design of a control system must reflect the fact that there are resource constraints and the benefits of controls must be considered relative to their costs. Further, because of the inherent limitations in all control systems, no evaluation of controls can provide absolute assurance that misstatements due to error or fraud will not occur or that all control issues and instances of fraud, if any, have been detected. The design of any system of controls is based in part on certain assumptions about the likelihood of future events and there can be no assurance that any design will succeed in achieving its stated goals under all potential future conditions. Projections of any evaluation of the effectiveness of controls to future periods are subject to risks. Over time, controls may become inadequate because of changes in conditions or deterioration in the degree of compliance with policies or procedures.
Changes to Internal Control over Financial Reporting
No change in the Company’s internal control over financial reporting (as defined in Rules 13a-15(f) and 15d-15(f) of the Exchange Act) occurred during the three months ended February 3, 2024 that has materially affected, or is reasonably likely to materially affect, the Company’s internal control over financial reporting.
Item 9B. Other Information
In the fourth quarter of fiscal 2024, the following trading plans were adopted or terminated by an executive officer or director of the Company:
| Name | Title | Adopted or Terminated | Adoption/Termination Date | Plan Start Date | Plan End Date | Transactions | Shares | |||||||||||||||||||||||||||||||||||||
| Officers | ||||||||||||||||||||||||||||||||||||||||||||
| Mark Casper | Chief Legal Officer | Adopted | 1/19/2024 | 4/19/2024 | 4/14/2025 | Sales | 10,000 | |||||||||||||||||||||||||||||||||||||
Item 9C. Disclosure Regarding Foreign Jurisdictions that Prevent Inspections
Not applicable.
REPORT OF INDEPENDENT REGISTERED PUBLIC ACCOUNTING FIRM
To the stockholders and the Board of Directors of Marvell Technology, Inc.
Opinion on Internal Control over Financial Reporting
We have audited the internal control over financial reporting of Marvell Technology, Inc. and subsidiaries (the “Company”) as of February 3, 2024, based on criteria established in Internal Control — Integrated Framework (2013) issued by the Committee of Sponsoring Organizations of the Treadway Commission (COSO). In our opinion, the Company maintained, in all material respects, effective internal control over financial reporting as of February 3, 2024, based on criteria established in Internal Control — Integrated Framework (2013) issued by COSO.
We have also audited, in accordance with the standards of the Public Company Accounting Oversight Board (United States) (PCAOB), the consolidated financial statements as of and for the year ended February 3, 2024, of the Company and our report dated March 13, 2024, expressed an unqualified opinion on those financial statements.
Basis for Opinion
The Company’s management is responsible for maintaining effective internal control over financial reporting and for its assessment of the effectiveness of internal control over financial reporting, included in the accompanying Management’s Report on Internal Control Over Financial Reporting. Our responsibility is to express an opinion on the Company’s internal control over financial reporting based on our audit. We are a public accounting firm registered with the PCAOB and are required to be independent with respect to the Company in accordance with the U.S. federal securities laws and the applicable rules and regulations of the Securities and Exchange Commission and the PCAOB.
We conducted our audit in accordance with the standards of the PCAOB. Those standards require that we plan and perform the audit to obtain reasonable assurance about whether effective internal control over financial reporting was maintained in all material respects. Our audit included obtaining an understanding of internal control over financial reporting, assessing the risk that a material weakness exists, testing and evaluating the design and operating effectiveness of internal control based on the assessed risk, and performing such other procedures as we considered necessary in the circumstances. We believe that our audit provides a reasonable basis for our opinion.
Definition and Limitations of Internal Control over Financial Reporting
A company’s internal control over financial reporting is a process designed to provide reasonable assurance regarding the reliability of financial reporting and the preparation of financial statements for external purposes in accordance with generally accepted accounting principles. A company’s internal control over financial reporting includes those policies and procedures that (1) pertain to the maintenance of records that, in reasonable detail, accurately and fairly reflect the transactions and dispositions of the assets of the company; (2) provide reasonable assurance that transactions are recorded as necessary to permit preparation of financial statements in accordance with generally accepted accounting principles, and that receipts and expenditures of the company are being made only in accordance with authorizations of management and directors of the company; and (3) provide reasonable assurance regarding prevention or timely detection of unauthorized acquisition, use, or disposition of the company’s assets that could have a material effect on the financial statements.
Because of its inherent limitations, internal control over financial reporting may not prevent or detect misstatements. Also, projections of any evaluation of effectiveness to future periods are subject to the risk that controls may become inadequate because of changes in conditions, or that the degree of compliance with the policies or procedures may deteriorate.
/s/ DELOITTE & TOUCHE LLP
San Jose, California
March 13, 2024
PART III
Unless we file an amendment to this Form 10-K within 120 days after February 3, 2024 to include the Part III information, we intend to incorporate such information by reference to our definitive proxy statement in connection with our 2024 annual meeting of stockholders to be held in June 2024 (the “2024 Proxy Statement”).
Item 10. Directors, Executive Officers and Corporate Governance
The information required by Items 401, 407(c)(3) and 408(b) of Regulation S-K with respect to our directors, director nominees, executive officers and corporate governance is incorporated by reference herein to the information set forth under the captions “Election of Directors,” “Corporate Governance and Matters Related to Our Board,” “Executive Officers of the Company” and “Insider Trading, Anti-Hedging and Anti-Pledging Policies” in our 2024 Proxy Statement.
Delinquent Section 16(a) Reports
The information required by Item 405 of Regulation S-K is incorporated by reference herein, as applicable, to the information set forth under the caption “Delinquent Section 16(a) Reports” in our 2024 Proxy Statement.
Code of Ethics
We have adopted a Code of Ethics and Business Conduct for Employees, Officers and Directors (the “Code of Ethics”) that applies to all of our directors, officers (including our Chief Executive Officer (our principal executive officer), Chief Financial Officer (our principal financial officer), Corporate Controller (our chief accounting officer) and any person performing similar functions) and employees. This Code of Ethics was most recently amended in March 2022. We intend to disclose certain future amendments to certain provisions of our Code of Ethics and waivers of our Code of Ethics granted to executive officers and directors on our website or in a report on Form 8-K within four business days following the date of such amendment or waiver. Our Code of Ethics is available on our website www.marvell.com. None of the material on our website is part of our Annual Report on Form 10-K or is incorporated by reference herein.
Committees of the Board of Directors
The information required by Items 407(d)(4) and (d)(5) of Regulation S-K concerning our Audit Committee and Audit Committee financial expert is incorporated by reference herein to the information set forth under the caption “Corporate Governance and Matters Related to Our Board” in our 2024 Proxy Statement.
Item 11. Executive Compensation
The information required by Items 402, 407(e)(4) and 407(e)(5) of Regulation S-K is incorporated by reference herein to the information set forth under the captions “Compensation of Directors,” “Director Compensation Table-Fiscal 2024,” “Executive Compensation” and “Compensation Committee Interlocks and Insider Participation” in our 2024 Proxy Statement.
Item 12. Security Ownership of Certain Beneficial Owners and Management and Related Stockholder Matters
The information required by Item 403 of Regulation S-K is incorporated by reference herein to the information set forth under the caption “Security Ownership of Certain Beneficial Owners and Management” in our 2024 Proxy Statement.
Securities Authorized for Issuance under Equity Compensation Plans
Equity Compensation Plan Information
The following table provides certain information with respect to all of our equity compensation plans in effect February 3, 2024:
| Plan Category | (a) Number of Securities to Be Issued Upon Exercise of Outstanding Options, Warrants and Rights (1) | (b) Weighted- Average Exercise Price of Outstanding Options, Warrants, and Rights (2) | (c) Number of Securities Remaining Available for Future Issuance under Equity Compensation Plans (Excluding Securities Reflected in Column (a)) | |||||||||||||||||
| Equity compensation plans approved by security holders (3) | 20,525,575 | $ | 33.38 | 92,039,616 | ||||||||||||||||
| Equity compensation plans not approved by security holders (4) | 921,554 | $ | 13.78 | — |
(1)Includes only options and restricted stock units (outstanding under our equity compensation plans, as no stock warrants or other rights were outstanding as of February 3, 2024).
(2)The weighted-average exercise price calculation does not take into account any restricted stock units as those units vest, without any cash consideration or other payment required for such shares.
(3)Includes our Amended and Restated 1995 Stock Option Plan, our Amended 2000 Employee Stock Purchase Plan (the “2000 ESPP”).
(4)Plans not approved by security holders consists of the Cavium 2007, 2016 and QLogic equity incentive plans which we assumed in our merger with Cavium Inc, Aquantia 2004, 2015 and 2017 equity incentive plans which we assumed in our merger with Aquantia, Inphi 2010 equity incentive plans which we assumed in our merger with Inphi and Innovium 2015 equity incentive plans which we assumed in our merger with Innovium.
Item 13. Certain Relationships and Related Transactions, and Director Independence
The information required by Item 404 of Regulation S-K is incorporated by reference herein to the information set forth under the caption “Certain Relationships and Related Party Transactions” in our 2024 Proxy Statement.
The information required by Item 407(a) of Regulation S-K is incorporated by reference herein to the information set forth under the caption “Board of Directors and Committees of the Board” in our 2024 Proxy Statement.
Item 14. Principal Accountant Fees and Services
The information required by Item 9(e) of Schedule 14A is incorporated by reference to the information set forth under the caption “Information Concerning Independent Registered Public Accounting Firm” in our 2024 Proxy Statement.
PART IV
Item 15. Exhibits and Financial Statement Schedules
(a)The following documents are filed as part of this Annual Report on Form 10-K:
1.Financial Statements:
See the “Index to Consolidated Financial Statements” on page 58 of this Annual Report on Form 10-K.
2.Financial Statement Schedules:
See “Schedule II — Valuation and Qualifying Accounts” on page 111 of this Annual Report on Form 10-K:
All other schedules not listed above have been omitted because they are not applicable or required, or the information required to be set forth therein is included in the Consolidated Financial Statements or Notes thereto.
3.Exhibits.
| 31.1 | Rule 13a-14(a)/15d-14(a) Certification of the Principal Executive Officer | Filed herewith | ||||||||||||||||||||||||||||||||||||||||||||||||||||||||||||||||||||||||
| 31.2 | Rule 13a-14(a)/15d-14(a) Certification of the Principal Financial Officer | Filed herewith | ||||||||||||||||||||||||||||||||||||||||||||||||||||||||||||||||||||||||
| 32.1* | Certification Pursuant to 18 U.S.C. Section 1350, as Adopted Pursuant to Section 906 of the Sarbanes-Oxley Act of 2002 for Principal Executive Officer | Filed herewith | ||||||||||||||||||||||||||||||||||||||||||||||||||||||||||||||||||||||||
| 32.2* | Certification Pursuant to 18 U.S.C. Section 1350, as Adopted Pursuant to Section 906 of the Sarbanes-Oxley Act of 2002 for Principal Financial Officer | Filed herewith | ||||||||||||||||||||||||||||||||||||||||||||||||||||||||||||||||||||||||
| 97 | Rule 10D-1 Clawback Policy | Filed herewith | ||||||||||||||||||||||||||||||||||||||||||||||||||||||||||||||||||||||||
| 101.INS | Inline XBRL Instance Document | |||||||||||||||||||||||||||||||||||||||||||||||||||||||||||||||||||||||||
| 101.SCH | Inline XBRL Taxonomy Extension Schema Document | |||||||||||||||||||||||||||||||||||||||||||||||||||||||||||||||||||||||||
| 101.CAL | Inline XBRL Taxonomy Extension Calculation Linkbase Document | |||||||||||||||||||||||||||||||||||||||||||||||||||||||||||||||||||||||||
| 101.DEF | Inline XBRL Taxonomy Extension Definition | |||||||||||||||||||||||||||||||||||||||||||||||||||||||||||||||||||||||||
| 101.LAB | Inline XBRL Taxonomy Extension Label Linkbase Document | |||||||||||||||||||||||||||||||||||||||||||||||||||||||||||||||||||||||||
| 101.PRE | Inline XBRL Taxonomy Presentation Linkbase Document | |||||||||||||||||||||||||||||||||||||||||||||||||||||||||||||||||||||||||
| 104 | Cover Page Interactive Data File - The cover page from this Annual Report on Form 10-K is formatted in iXBRL |
Management contracts or compensation plans or arrangements in which directors or executive officers are eligible to participate.
- In accordance with Item 601(b)(32)(ii) of Regulation S-K and SEC Release No. 33-8238 and 34-47986, Final Rule: Management’s Reports on Internal Control Over Financial Reporting and Certification of Disclosure in Exchange Act Periodic Reports, the certifications furnished in Exhibits 32.1 and 32.2 hereto are deemed to accompany this Annual Report Form 10-K and will not be deemed “filed” for purposes of Section 18 of the Exchange Act. Such certifications will not be deemed to be incorporated by reference into any filings under the Securities Act or the Exchange Act, except to the extent that the registrant specifically incorporates it by reference.
** Pursuant to Item 601(a)(5) of Regulation S-K, certain schedules and similar attachments have been omitted. The registrant hereby agrees to furnish a copy of any omitted schedule or similar attachment to the SEC upon request
Item 16. Form 10-K Summary
None.
SIGNATURES
Pursuant to the requirements of section 13 or 15(d) of the Securities Exchange Act of 1934, the registrant has duly caused this report to be signed on its behalf by the undersigned, thereunto duly authorized.
| MARVELL TECHNOLOGY, INC. | ||||||||||||||
| Dated: March 13, 2024 | By: | /S/ WILLEM MEINTJES | ||||||||||||
| Willem Meintjes Chief Financial Officer (Principal Financial Officer) |
POWER OF ATTORNEY
KNOW ALL PERSONS BY THESE PRESENTS, that each person whose signature appears below constitutes and appoints Matthew J. Murphy and Willem Meintjes, and each of them individually, as his or her attorney-in-fact, each with full power of substitution, for him or her in any and all capacities, to sign any and all amendments to this Annual Report on Form 10-K, and to file the same, with exhibits thereto and all other documents in connection therewith, with the Securities and Exchange Commission, hereby ratifying and confirming all that said attorney-in-fact, or his substitute or substitutes, may do or cause to be done by virtue hereof. Pursuant to the requirements of the Securities Exchange Act of 1934, this report has been signed by the following persons on behalf of the registrant in the capacities and on the dates indicated.
| Name and Signature | Title | Date | ||||||||||||
| /S/ MATTHEW J. MURPHY | Chair, President and Chief Executive Officer (Principal Executive Officer) | March 13, 2024 | ||||||||||||
| Matthew J. Murphy | ||||||||||||||
| /S/ WILLEM MEINTJES | Chief Financial Officer (Principal Financial Officer) | March 13, 2024 | ||||||||||||
| Willem Meintjes | ||||||||||||||
| /S/ PANTEHA DIXON | Chief Accounting Officer (Principal Accounting Officer) | March 13, 2024 | ||||||||||||
| Panteha Dixon | ||||||||||||||
| /S/ SARA ANDREWS | Director | March 13, 2024 | ||||||||||||
| Sara Andrews | ||||||||||||||
| /S/ TUDOR BROWN | Director | March 13, 2024 | ||||||||||||
| Tudor Brown | ||||||||||||||
| /S/ BRAD BUSS | Director | March 13, 2024 | ||||||||||||
| Brad Buss | ||||||||||||||
| /S/ REBECCA HOUSE | Director | March 13, 2024 | ||||||||||||
| Rebecca House |
| Name and Signature | Title | Date | ||||||||||||
| /S/ MARACHEL KNIGHT | Director | March 13, 2024 | ||||||||||||
| Marachel Knight | ||||||||||||||
| /S/ MICHAEL STRACHAN | Director | March 13, 2024 | ||||||||||||
| Michael Strachan | ||||||||||||||
| /S/ ROBERT E. SWITZ | Director | March 13, 2024 | ||||||||||||
| Robert E. Switz | ||||||||||||||
| /S/ FORD TAMER | Director | March 13, 2024 | ||||||||||||
| Ford Tamer |
SCHEDULE II
VALUATION AND QUALIFYING ACCOUNTS
(In millions)
| Balance at Beginning of Year | Additions | Deductions | Balance at End of Year | ||||||||||||||||||||
| Fiscal year ended February 3, 2024 | |||||||||||||||||||||||
| Allowance for doubtful accounts | $ | 2.1 | $ | 0.8 | $ | (0.9) | $ | 2.0 | |||||||||||||||
| Deferred tax asset valuation allowance | $ | 961.7 | $ | 138.1 | $ | (0.8) | $ | 1,099.0 | |||||||||||||||
| Fiscal year ended January 28, 2023 | |||||||||||||||||||||||
| Allowance for doubtful accounts | $ | 3.0 | $ | 1.2 | $ | (2.1) | $ | 2.1 | |||||||||||||||
| Deferred tax asset valuation allowance | $ | 1,003.4 | $ | — | $ | (41.7) | $ | 961.7 | |||||||||||||||
| Fiscal year ended January 29, 2022 | |||||||||||||||||||||||
| Allowance for doubtful accounts | $ | 2.1 | $ | 1.5 | $ | (0.6) | $ | 3.0 | |||||||||||||||
| Deferred tax asset valuation allowance | $ | 749.5 | $ | 253.9 | $ | — | $ | 1,003.4 | |||||||||||||||