 filings.tools
Mettler-Toledo (MTD) 10-K risk factor changes: FY2016 vs FY2015
The 2016-12-31 10-K against the 2015-12-31 one, compared heading by heading and sentence by sentence. One of these filings carries no fiscal year tag, so its year is the calendar year of the period end.
Item 1A39 rewritten15 added6 removed295 unchanged
All filing items676 rewritten354 added269 removed2,003 unchanged
Summary
counted, not written
- Item 1A headings could not be compared: only 0 carried over between the two years, which usually means one filing was read wrongly, so none is reported as new or removed.
- Sentence by sentence, 354 added, 269 removed, 676 rewritten and 2,003 unchanged across 14 items that differ.
Sentences by item
20 items, with every count and a link to each item that changed
Underlined words on a shaded ground are new in FY2016; struck-through words were in FY2015. Sentences that are wholly new or wholly gone are labelled rather than marked.
Item 1A. Risk Factors
39 rewritten, 15 added, 6 removed, 295 unchanged
For example, our Chinese operations account for [removed: 16%] [added: 15%] of sales to external customers, approximately 30% of our global production, and [removed: 29%] [added: 32%] of total segment profit during [removed: 2015.][added: 2016.]
| • | nationalization of private enterprises which may result in the confiscation of assets, as we hold significant assets around the world in the form of property, plant, and equipment, inventory, and accounts receivable, as well as [removed: $39] [added: $103] million of cash at December 31, [removed: 2015] [added: 2016] in our Chinese subsidiaries; |
Sanctions imposed on business in Russia [removed: will likely continue to] [added: may] affect the economy and our business in Russia.
[removed: During 2015,] [added: For example, during 2015] China, Russia, and Brazil accounted for 18% of our sales to external customers and declined 11% in local currencies as customer investments [removed: have] slowed due to a variety of economic factors.
Growth in [removed: other] emerging markets can [removed: also] be [removed: expected to be] volatile.
In [removed: September 2011,] [added: January 2015,] the Swiss National Bank [removed: established an] [added: abandoned its] exchange rate floor of 1.20 Swiss francs per [removed: euro which was abandoned in January 2015.][added: euro.]
Excluding the effects of any foreign currency hedging contracts, we estimate a 1% strengthening of the Swiss franc against the euro would reduce our earnings before tax by approximately [removed: $1.2] [added: $1.5] million to [removed: $1.4] [added: $1.7] million annually.
We also estimate a 1% strengthening of the Swiss franc against the U.S. dollar would reduce our earnings before tax by approximately [removed: $0.4 million to $0.6] [added: $0.2] million annually in addition to the previously mentioned strengthening of the Swiss franc against the euro impact.
We also conduct business [removed: in many geographies] throughout the world, including Asia Pacific, the United Kingdom, Eastern Europe, Latin America, and Canada.
The impact on our earnings before tax of the Chinese renminbi weakening 1% against the U.S. dollar is a reduction of approximately [removed: $0.3] [added: $0.4] million to [removed: $0.5] [added: $0.6] million annually.
In [removed: 2015,] [added: 2016,] the U.S. dollar strengthened against most of the major currencies throughout the world.
[removed: our outstanding debt at December 31, 2015, we estimate that a 10% weakening of] the [removed: U.S. dollar against the] currencies in which our debt is denominated would result in an increase of approximately [removed: $19.2] [added: $23.0] million in the reported U.S. dollar value of our debt.
Our systems are vulnerable to damage or interruption from natural disasters, power loss, telecommunication failures, terrorist or hacker attacks, malicious employees or employee negligence, computer viruses, [added: ransomware,] and other events.
We have implemented the program in our Swiss, Chinese, [added: U.K.,] and certain [removed: U.S., German, and U. K. operations] [added: U.S.] and [removed: have approximately two-thirds of the program implemented, as measured in users.][added: German operations.]
[removed: to implement the program than we] have [removed: planned, and the project may cost us more than we have] estimated, either of which would negatively impact our ability to generate cost savings or other efficiencies.
[added: To remain competitive, we must continue to] make significant investments in research and development, sales and marketing, and customer service and [removed: support.]
[removed: Recently,] [added: In recent years,] there has been an increase in consolidation within these industries.
Unanticipated changes in our tax rates or [removed: exposure to] additional income tax liabilities could impact our profitability.
We are subject to income taxes in the United States and various other [removed: foreign] jurisdictions, and our domestic and international tax liabilities are subject to allocation of expenses among different jurisdictions.
Our effective tax rates [added: and tax obligations] could be adversely affected by changes in [added: tax laws or rates, changes in] the mix of earnings by jurisdiction, changes in [removed: tax laws or tax rates, changes in] the valuation of deferred tax assets and liabilities, and material adjustments from tax audits.
Our tax expense [added: and tax obligations] could increase as a result of a changing application of tax law.
Any changes in corporate income tax rates or regulations, on repatriation of [removed: dividends] [added: dividends, earnings] or capital, or on transfer pricing, as well as changes in the interpretation of existing tax laws and regulations in the jurisdictions in which we operate, could adversely affect our cash flow and increase our overall tax burden, which would negatively affect our profitability.
A [added: terrorism attack, other geopolitical crisis, or] widespread outbreak of an illness or other health issue, [removed: terrorism attack, or other geopolitical crisis] could negatively affect our business, making it more difficult and expensive to meet our obligations to our customers, and could result in reduced demand from our customers.
[removed: In] [added: Also, in] recent years, a number of countries have experienced outbreaks of the H1N1 influenza (swine flu) or, in the Asia Pacific region, outbreaks of SARS and/or avian influenza (bird flu), and more recently, Ebola outbreaks in parts of Africa.
[removed: Also, our] [added: Our] global operations are susceptible to global events, including [removed: natural disasters,] acts or threats of war or terrorism, international conflicts, [removed: and threats to] political [removed: stability.][added: instability and natural disasters.]
[removed: In August 2012, the] [added: The] SEC [added: has] adopted disclosures and reporting requirements for companies whose products contain certain minerals and their derivatives, namely tin, tantalum, tungsten, or gold, known as conflict minerals.
[removed: The implementation of these] [added: These] requirements could adversely affect the sourcing, availability, and pricing of materials used in the manufacturing of our products.
Since our supply chain is complex, the due diligence procedures that we [removed: implement] [added: have implemented] may not enable us to ascertain with sufficient certainty the origins for these minerals or determine that these minerals are DRC conflict free, which may harm our reputation.
These regulations govern a wide variety of activities relating to our products, including design and development, product safety, labeling, [added: manufacturing, promotion, sales, and distribution.]
As of December 31, [removed: 2015,] [added: 2016,] our consolidated balance sheet included goodwill of [removed: $446.3] [added: $476.4] million and other intangible assets of [removed: $115.3] [added: $167.1] million.
As of December 31, [removed: 2015,] [added: 2016,] we had total indebtedness of approximately [removed: $492.6] [added: $735.4] million, net of cash of [removed: $98.9] [added: $158.7] million.
At December 31, [removed: 2015,] [added: 2016,] we had borrowings of [removed: $90.4] [added: $395.2] million outstanding under our credit facility.
Please consider the risks and factors that could cause our results to differ materially from what is described in our forward-looking [removed: statements.]
| • | developments in personnel costs; [removed: and] |
For example, although no single [removed: customer] [added: end-customer] accounts for more than 1% of our revenues, if a number of our customers experienced significant deteriorations in their financial positions concurrently, it could have an impact on our results of operations.
| • | the effectiveness of our sales and marketing programs such as our Spinnaker and market penetration [added: and Field Turbo] initiatives; |
| • | the continued growth of our sales in emerging markets; [added: and] |
| • | our ability to implement price increases as forecasted; [removed: and] |
| • | the effectiveness of [removed: our] [added: productivity and] cost saving initiatives. |
China, our largest emerging market country, had improved market conditions in 2016 but market uncertainties remain due to overcapacity in certain industries and ongoing volatility in credit availability.
Based on our outstanding debt at December 31, 2016, we estimate that a 10% weakening of the U.S. dollar against
We estimate that we have approximately two-thirds of the program implemented, as measured in users.
It may take us longer to implement the program than we have planned, and the project may cost us more than we
support.
Changes in political leadership in the United States and certain European countries may also impact global trade or create uncertainty impacting our business.
Changes in political leadership in the United States and certain European countries may impact global trade or create uncertainty.
In times of uncertainty, some customers delay investments or defer normal replacement cycles, which could have an adverse impact on our sales.
statements.
| • | our estimated income tax expense; and |
| • | the effectiveness of our programs to improve our service business, including growth, globalization and productivity initiatives; |
| | |
| --- | --- |
| | |
| --- | --- |
In particular, Chinese market conditions continue to reflect overcapacity in certain end-user segments and a reduction of credit availability for many local Chinese customers.
The timing of a market stabilization or recovery in China, Russia, and Brazil remains uncertain.
Based on
It may take us longer
To remain competitive, we must continue to
manufacturing, promotion, sales, and distribution.
Item 7. Management’s Discussion and Analysis of Financial Condition and Results of Operations
139 rewritten, 66 added, 82 removed, 251 unchanged
Net sales in U.S. dollars [removed: decreased 4%] [added: increased 5%] in [removed: 2015] [added: 2016] and [removed: increased] [added: decreased] 4% in [removed: 2014.][added: 2015.]
Excluding the effect of currency exchange rate fluctuations, or in local currencies, net sales increased [removed: 3%] [added: 7%] in [removed: 2015] [added: 2016] and [removed: 5%] [added: increased 3%] in [removed: 2014.][added: 2015.]
Examples of these programs include identifying and investing in growth and market penetration opportunities, [removed: improving our lead generation and lead nurturing processes, and] more effectively pricing our products and [removed: services.][added: services, increasing our sales force effectiveness through improved guidance, and continuing to optimize our lead generation and lead nurturing processes.]
With respect to our end-user markets, we experienced increased results during [removed: 2015] [added: 2016] versus the prior year in our laboratory-related markets, such as pharmaceutical and biotech customers, as well as the laboratories of chemical companies and food and beverage companies.
Demand from these markets was generally [removed: strong] [added: favorable] during [removed: 2015.][added: 2016.]
The local currency increase in net sales of our laboratory-related products during [removed: 2015] [added: 2016] was driven by strong [removed: volume and favorable price realization] [added: growth] in most product categories, [removed: including particularly strong growth in automated chemistry] [added: especially pipettes] and [removed: pipettes.][added: automated chemistry.]
Emerging market economies have historically been an important source of growth based upon the expansion of their [added: domestic economies, as well as increased exports as companies have]
[removed: domestic economies, as well as increased exports as companies have] moved production to low-cost countries.
In [removed: 2016,] [added: 2017,] we expect to continue to pursue the overall business growth strategies which we have followed in recent years:
For example, [added: over the past two years] we [added: have] added more than [removed: 200] [added: 450] field sales and service resources to pursue under-penetrated market opportunities and will look to [added: continue to] make [removed: similar] investments to front-end resources in [removed: 2016.][added: 2017.]
While this initiative is broad-based, efforts to improve these processes include [removed: increased segment marketing and leads generation] [added: leveraging big data analytics to identify, prioritize] and [removed: nurturing activities,] [added: pursue growth opportunities,] the implementation of more effective pricing and value-based selling strategies and processes, improved sales force [added: guidance,] training and effectiveness, cross-selling, [added: increased segment marketing] and [removed: other sales] [added: leads generation] and [removed: marketing topics.][added: nurturing activities.]
We estimate that we have the largest installed base of weighing instruments in the world, and we continue to [added: leverage big data analytics and] invest in sales and marketing activities aimed at increasing the proportion of our installed base that is under service contract, or selling new products that replace old products in our installed base.
We have [removed: over] [added: almost] a [removed: 25-year] [added: 30-year] track record in China, and our sales in Asia have grown more than [removed: 14%] [added: 13%] on a compound annual growth basis in local currencies since 1999.
We experienced a [removed: 2% decrease] [added: 9% increase] in emerging market local currency sales during [removed: 2015] [added: 2016] versus the prior year, [removed: due to unfavorable market conditions] [added: which included 9% local currency sales growth] in [removed: China, Russia, and Brazil.][added: China.]
Emerging market sales can be [removed: expected to be volatile, and the timing of a market stabilization or recovery in China, Russia,] [added: volatile] and [removed: Brazil remains] uncertain.
Within China, we [removed: are redeploying] [added: continue to redeploy] resources and sales and marketing efforts to the faster-growing segments of pharma, food safety, and environment.
[added: We expect our] laboratory, process analytics, and product inspection businesses will particularly benefit from these segments.
Our cost leadership [added: and productivity] initiatives are also focused on continuously improving our invested capital efficiency, such as reducing our working capital levels and ensuring appropriate returns on our expenditures.
We seek to pursue [added: "bolt-on"] acquisitions that may leverage our global sales and service network, respected brand, extensive distribution channels, and technological leadership.
[removed: For example, during] [added: During] the third quarter of 2015, we [added: also] acquired a real-time water purity technology in the United States that has been integrated into our process analytics product offering.
Net sales were [removed: $2,395.4] [added: $2,508.3] million for the year ended December 31, [removed: 2015,] [added: 2016,] compared to [removed: $2,486.0] [added: $2,395.4] million in [removed: 2014,] [added: 2015,] and [removed: $2,379.0] [added: $2,486.0] million in [removed: 2013.][added: 2014.]
This represents [removed: a decrease] [added: an increase] of [removed: 4%] [added: 5%] in [removed: 2015] [added: 2016] and [removed: an increase] [added: a decrease] of 4% in [removed: 2014] [added: 2015] in U.S. dollars and an increase of [removed: 3%] [added: 7%] and [removed: 5%] [added: 3%] in local currencies, respectively.
In [removed: 2015,] [added: 2016,] our net sales by geographic destination increased in U.S. dollars [removed: 6%] [added: 5%] in the Americas, [removed: decreased 12%] [added: 3%] in Europe, and [removed: decreased 5%] [added: 6%] in Asia/Rest of World.
In local currencies, our net sales by geographic destination increased in [removed: 2015] [added: 2016] by [removed: 8%] [added: 5%] in the [removed: Americas and 2%] [added: Americas, 5%] in Europe, and [removed: was flat] [added: 10%] in Asia/Rest of World.
Net sales of products [removed: decreased 3%] [added: increased 5%] in U.S. dollars and [removed: increased 3%] [added: 7%] in local currencies during [removed: 2015] [added: 2016] and [removed: increased 4%] [added: decreased 3%] in [removed: both] U.S. dollars and [added: increased 3% in] local currencies in [removed: 2014.][added: 2015.]
Service revenue (including spare parts) [removed: decreased 5%] [added: increased 4%] in U.S. dollars and [removed: increased 4%] [added: 6%] in local currencies in [removed: 2015,] [added: 2016,] and [removed: increased 7%] [added: decreased 5%] in U.S. dollars and [removed: 8%] [added: increased 4%] in local currencies in [removed: 2014.][added: 2015.]
Net sales of our laboratory-related products, which represented approximately [removed: 48%] [added: 49%] of our total net sales in [removed: 2015, decreased 1%] [added: 2016, increased 6%] in U.S. dollars and [removed: increased 7%] [added: 8%] in local currencies during [removed: 2015.][added: 2016.]
The local currency increase in net sales of our laboratory-related products during [removed: 2015] [added: 2016] was driven by strong [removed: volume][added: growth in most product categories, especially pipettes and automated chemistry.]
Net sales of our industrial-related products, which represented approximately [removed: 43%] [added: 42%] of our total net sales in [removed: 2015, decreased 7%] [added: 2016, increased 3%] in U.S. dollars and [removed: were flat] [added: 5%] in local currencies during [removed: 2015.][added: 2016.]
Net sales of our food retailing products, which represented approximately 9% of our total net sales in [removed: 2015, decreased 5%] [added: 2016, increased 4%] in U.S. dollars and [removed: increased 2%] [added: 6%] in local currencies during [removed: 2015.][added: 2016.]
Gross profit as a percentage of net sales was [removed: 56.4%] [added: 57.2%] for [removed: 2015,] [added: 2016,] compared to [removed: 54.7%] [added: 56.4%] for [removed: 2014] [added: 2015] and [removed: 53.9%] [added: 54.7%] for [removed: 2013.][added: 2014.]
Gross profit as a percentage of net sales for products was [removed: 60.1%] [added: 60.8%] for [removed: 2015,] [added: 2016,] compared to [removed: 58.1%] [added: 60.1%] for [removed: 2014] [added: 2015] and [removed: 57.3%] [added: 58.1%] for [removed: 2013.][added: 2014.]
Gross profit as a percentage of net sales for services (including spare parts) was [removed: 43.6%] [added: 44.6%] for [removed: 2015,] [added: 2016,] compared to [removed: 42.8%] [added: 43.6%] for [removed: 2014,] [added: 2015] and [removed: 41.7%] [added: 42.8%] for [removed: 2013.][added: 2014.]
The increase in gross profit as a percentage of net sales for [removed: 2015] [added: 2016] includes [removed: the benefit of hedging gains and currency translation,] [added: benefits from higher sales volume,] favorable price [removed: realization,] [added: realization and] reduced material costs, [removed: and improved labor efficiency,] [added: partially] offset [removed: in part] by investments in our field service organization.
Research and development expenses as a percentage of net sales were [added: 4.8% for 2016 and] 5.0% for both 2015 and [removed: 2014 and 4.9% for 2013.][added: 2014.]
Research and development expenses in U.S. dollars [removed: decreased 3%] [added: increased 1%] in [removed: 2015] [added: 2016] and [removed: increased 6%] [added: decreased 3%] in [removed: 2014,] [added: 2015,] and in local currencies increased [removed: 2%] [added: 4%] in [removed: 2015] [added: 2016] and [removed: increased 5%] [added: 2%] in [removed: 2014,] [added: 2015,] relating to the timing of research and development project activity.
Selling, general, and administrative expenses as a percentage of net sales were [added: 29.2% for 2016, compared to] 29.3% for both 2015 and [removed: 2014, compared to 29.1% for 2013.][added: 2014.]
Selling, general, and administrative expenses [removed: decreased] [added: increased] 4% in [removed: 2015] [added: 2016] in U.S. dollars and [removed: increased 3%] [added: 6%] in local currencies and [removed: increased 5%] [added: decreased 4%] in [removed: both] U.S. dollars and [added: increased 3% in] local currencies in [removed: 2014.][added: 2015.]
The increase during [removed: 2015] [added: 2016] includes [removed: additional] [added: higher cash incentive expense,] investments in our field sales organization and [removed: higher employee benefit costs,] [added: acquisitions,] offset in part by [removed: lower cash incentive expense and] benefits from our cost savings programs.
Amortization expense was [removed: $31.0] [added: $36.1] million in [removed: 2015,] [added: 2016,] compared to [removed: $29.2] [added: $31.0] million and [removed: $24.5] [added: $29.2] million in [removed: 2014] [added: 2015] and [removed: 2013,] [added: 2014,] respectively.
We also include in the discussion below disclosures of immaterial qualitative factors that are not quantified.
Although the impact of such factors is not considered material, we believe these disclosures can be useful in evaluating our operating results.
Net sales growth in local currencies during 2016 reflected broad-based growth across most geographies and product categories with generally favorable global market conditions.
While market conditions were generally stable in 2016 for our customers to maintain their replacement cycles, we remain cautious regarding our sales outlook given the uncertainty in global markets.
Our industrial markets continued to benefit from our customers' focus on brand protection and food safety within our product inspection end-market.
We also experienced improved market conditions in China despite continued market uncertainty related to overcapacity in a number of industries and volatility in credit availability.
Our food retailing markets experienced growth in each geographic region during 2016, with strong growth in Europe and Asia/Rest of World.
Overall, market conditions in emerging markets were generally favorable during 2016.
We continue to experience unfavorable market conditions and reduced demand in certain industrial-related end-user segments in China due to overcapacity.
We also continue to invest and add sales and marketing resources to pursue growth in underpenetrated emerging markets.
For example, during the third quarter of 2016, we acquired substantially all of the assets of Henry Troemner LLC (Troemner), a supplier of lab equipment, weights and weight calibration based in the United States for an aggregate purchase price $95.8 million that will be integrated into our laboratory product offering.
The Troemner acquisition contributed approximately 1% to our net sales during 2016.
Excluding the Troemner acquisition, our local currency net sales growth in the Americas was 4%.
While market conditions were generally favorable during 2016, we remain cautious regarding our sales outlook given the uncertainty in global markets.
The Troemner acquisition contributed approximately 1% to our net sales of products during 2016.
The Troemner acquisition contributed approximately 1% to our net sales of service during 2016.
The Troemner acquisition contributed approximately 1% to our net sales growth of laboratory-related products and services.
Local currency net sales included strong sales growth in product inspection.
The increase in net sales in local currencies of our food retailing products during 2016 included growth in each geographic region, with strong growth in Europe and Asia/Rest of World.
During 2016, other charges (income), net includes a one-time non-cash pension settlement charge of $8.2 million related to a lump sum offering to former employees of our U.S. pension plan, as well as $1.1 million of acquisition transaction costs.
| Net sales | $ | 958,542 | | | $ | 913,842 | | | $ | 847,706 | | | 5% | | 8% |
| Net sales to external customers | $ | 867,962 | | | $ | 826,354 | | | $ | 757,243 | | | 5% | | 9% |
| Segment profit | $ | 161,539 | | | $ | 147,491 | | | $ | 123,278 | | | 10% | | 20% |
Net sales in our U.S. operations also benefited approximately 1% from the Troemner acquisition during 2016.
| Net sales | $ | 655,657 | | | $ | 632,326 | | | $ | 687,541 | | | 4% | | (8)% |
| Net sales to external customers | $ | 130,674 | | | $ | 133,684 | | | $ | 137,756 | | | (2)% | | (3)% |
| Segment profit | $ | 163,663 | | | $ | 160,763 | | | $ | 149,987 | | | 2% | | 7% |
The decrease in local currency net sales to external customers during 2016 primarily relates to soft market conditions in Switzerland.
| Net sales | $ | 817,059 | | | $ | 785,660 | | | $ | 903,052 | | | 4% | | (13)% |
| Segment profit | $ | 123,507 | | | $ | 107,424 | | | $ | 119,603 | | | 15% | | (10)% |
| Net sales | $ | 606,307 | | | $ | 591,178 | | | $ | 579,557 | | | 3% | | 2% |
| Segment profit | $ | 187,924 | | | $ | 165,532 | | | $ | 163,832 | | | 14% | | 1% |
The increase in net sales to external customers during 2016 includes growth in most product categories with particularly strong growth in laboratory-related products and related services and food retailing products.
While we were pleased with our 2016 local currency sales growth in China, the outlook remains uncertain due to overcapacity in a number of industries and volatility in credit availability.
The increase in segment profit during 2016 includes increased local currency sales and benefits from our cost savings initiatives.
| | 2016 | | | | 2015 | | | | 2014 | | | | Increase (Decrease) in % (1)2016 vs. 2015 | | Increase (Decrease) in % (1)2015 vs. 2014 |
| Net sales | $ | 490,231 | | | $ | 447,077 | | | $ | 474,282 | | | 10% | | (6)% |
| Net sales to external customers | $ | 482,522 | | | $ | 438,990 | | | $ | 466,755 | | | 10% | | (6)% |
| Segment profit | $ | 64,060 | | | $ | 50,821 | | | $ | 52,869 | | | 26% | | (4)% |
Other includes reporting units in Southeast Asia, Latin America, Eastern Europe and other countries.
Net sales growth during 2015 reflected favorable market conditions in our Western markets, particularly the United States, and our ability to pursue under-penetrated markets, offset in part by reduced market demand in China, Russia, and Brazil.
While market conditions remain stable in most parts of the world, we continue to see unfavorable market conditions in China, Russia, and Brazil, where customer investments have slowed due to a variety of economic factors.
We remain cautious about our sales outlook as the timing of a market stabilization or recovery in these three countries remains uncertain.
These results were offset in part by significant sales volume declines in Brazil and Russia.
Our industrial markets experienced favorable market conditions in the United States and benefited from our customers' focus on brand protection and food safety within our product inspection end-market, but were adversely impacted in 2015 by a significant decline in our industrial-related sales in China, Russia, and Brazil due to reduced market demand related to a variety of economic conditions.
Our food retailing markets experienced modest growth during 2015, primarily driven by strong project activity in the United States, offset in part by reduced sales in Europe.
Overall, market conditions in emerging markets were mixed during 2015 and below our long-term expectations.
Chinese market conditions for our industrial products were particularly weak in 2015 related to overcapacity in certain end-user segments and a reduction of credit availability for many local Chinese customers.
We also experienced significant sales declines in Russia and Brazil due to reduced market demand.
During 2015, China, Russia, and Brazil represented 18% of our global sales to external customers and experienced a decline in sales of 11% in local currencies, while sales in our other emerging markets increased 10% in local currencies.
We expect our
We also continue to pursue “bolt-on” acquisitions.
Net sales were impacted by significant sales declines in China, Russia, and Brazil.
and favorable price realization in most product categories, including particularly strong growth in automated chemistry and pipettes.
Local currency net sales included significant sales volume declines of industrial-related products in China, Russia, and Brazil, offset by strong growth in the United States primarily due to increased volume and favorable price realization across most product categories.
The increase in net sales in local currencies of our food retailing products during 2015 was driven by strong project activity in the Americas offset in part by reduced net sales in Europe.
| Net sales | $ | 912,778 | | | $ | 849,598 | | | $ | 801,853 | | | 7% | | 6% |
| Net sales to external customers | $ | 825,290 | | | $ | 759,135 | | | $ | 718,671 | | | 9% | | 6% |
| Segment profit | $ | 147,331 | | | $ | 123,080 | | | $ | 126,423 | | | 20% | | (3)% |
| Net sales | $ | 588,598 | | | $ | 599,752 | | | $ | 568,144 | | | (2)% | | 6% |
| Net sales to external customers | $ | 134,169 | | | $ | 138,581 | | | $ | 132,240 | | | (3)% | | 5% |
| Segment profit | $ | 163,243 | | | $ | 152,090 | | | $ | 129,158 | | | 7% | | 18% |
growth in our laboratory-related products, offset in part by volume declines in industrial-related products related to soft market conditions.
| Net sales | $ | 750,632 | | | $ | 833,104 | | | $ | 786,327 | | | (10)% | | 6% |
| Segment profit | $ | 108,539 | | | $ | 120,580 | | | $ | 111,951 | | | (10)% | | 8% |
| Net sales | $ | 559,895 | | | $ | 571,164 | | | $ | 556,215 | | | (2)% | | 3% |
| Segment profit | $ | 153,314 | | | $ | 160,793 | | | $ | 152,459 | | | (5)% | | 5% |
The decrease in net sales to external customers during 2015 reflects a significant sales volume decline in industrial-related products, offset in part by growth in laboratory-related products and food retailing.
Net sales to external customers in local currency for our industrial-related products decreased 18% during 2015.
The decrease in segment profit during 2015 includes a reduction in net sales to external customers and increased sales and service investments, offset in part by favorable price realization and favorable business mix.
| Net sales | $ | 444,631 | | | $ | 471,565 | | | $ | 452,960 | | | (6)% | | 4% |
| Net sales to external customers | $ | 436,544 | | | $ | 464,038 | | | $ | 446,652 | | | (6)% | | 4% |
| Segment profit | $ | 50,454 | | | $ | 52,461 | | | $ | 49,673 | | | (4)% | | 6% |
The increase in local currency total net sales and net sales to external customers includes strong volume growth and increased price realization in several countries, offset in part by significant sales volume declines in Russia and Brazil.
The increase in 2015 includes higher net earnings, voluntary pension payments of $18 million in the prior year, and increased customer deposits, offset in part by increased cash incentive payments of $14 million and higher inventory levels.
Cash flows used in financing activities during 2015 included proceeds from the issuance of our $125 million 4.24% Senior Notes and Euro 125 million 1.47% Euro Senior Notes, offset by the payment of our $100 million 6.30% Senior Notes.
In September 2015, we consummated acquisitions totaling $16.6 million, including the acquisition of a real-time monitoring water purity technology for an estimated aggregate purchase price of $14.7 million that will be integrated into our process analytics product offering.
We may be required to pay additional cash consideration related to an earn-out period.
Goodwill recorded in connection with the acquisition totaled $9.0 million, which is included in our U.S. Operations segment.
We also recorded $6.8 million of identified intangibles primarily pertaining to technology in connection with the acquisitions, which will be amortized on a straight-line basis over 10 years.
An excerpt. Shown here: 40 of 139 rewritten, 40 of 66 added and 40 of 82 removed. The counts are complete. For every sentence, read Item 7. Management’s Discussion and Analysis of Financial Condition and Results of Operations in the FY2016 filing and the FY2015 filing.
Item 1. Business
19 rewritten, 3 added, 2 removed, 253 unchanged
Our business is geographically diversified, with net sales in [removed: 2015] [added: 2016] derived 32% from Europe, 39% from North and South America, and 29% from Asia and other countries.
The laboratory instruments business accounted for approximately [removed: 48%] [added: 49%] of our net sales in [removed: 2015, 47%] [added: 2016, 48%] in [removed: 2014,] [added: 2015,] and [removed: 46%] [added: 47%] in [removed: 2013.][added: 2014.]
The industrial instruments business accounted for approximately [removed: 43%] [added: 42%] of our net sales in [removed: 2015, 44%] [added: 2016, 43%] in [removed: 2014,] and [removed: 45%] [added: 2015, and 44%] in [removed: 2013.][added: 2014.]
The scale screen display allows for in-store [removed: marketing, which is supposed to] [added: marketing and can help] encourage consumers in the store to make more purchase decisions at the point of sale.
The retail business accounted for approximately 9% of our net sales in [added: 2016,] 2015, [removed: 2014,] and [removed: 2013.][added: 2014.]
We have a diversified customer base, with no single [removed: customer] [added: end-customer] accounting for more than 1% of [removed: 2015] [added: 2016] net sales.
At December 31, [removed: 2015,] [added: 2016,] our sales and service group consisted of approximately [removed: 6,800] [added: 7,200] employees in sales, marketing and customer service (including related administration), and post-sales technical service, located in 39 countries.
Service (representing service contracts, on demand services, and replacement parts) accounted for approximately 22% of our net sales in [added: 2016,] 2015, [removed: 2014,] and [removed: 2013.][added: 2014.]
A [removed: significant] portion of this amount is derived from the sale of replacement parts.
Over the last three years, we have invested [removed: almost $360] [added: $362] million in research and development [removed: ($119.1] [added: ($120.0] million in [removed: 2015, $123.3] [added: 2016, $119.1] million in [removed: 2014,] [added: 2015,] and [removed: $116.3] [added: $123.3] million in [removed: 2013),] [added: 2014),] which is approximately 5% of net sales for each year.
We expect to make [removed: increased] [added: net] investments in [added: new or expanded] manufacturing facilities of [removed: $80] [added: $65] million to [removed: $90] [added: $75] million over the next two years.
Our total workforce was [removed: 13,500] [added: 14,200] throughout the world, including employees and 1,000 of temporary personnel, as of December 31, [removed: 2015,] [added: 2016,] and includes approximately [removed: 5,100] [added: 5,500] in Europe, [removed: 3,600] [added: 3,800] in North and South America, and [removed: 4,800] [added: 4,900] in Asia and other countries.
In [removed: 2014,] [added: 2016,] we published our latest sustainability report, which measures progress and highlights accomplishments since our last report.
We are now working on making [removed: significant] [added: regular] reductions in our emissions by finding new ways of managing our vehicle fleets, incorporating new design features into our products, improving the energy efficiency of our buildings and processes, and looking at how we source the electricity we use in our facilities.
We have implemented the Blue Ocean program in our Swiss, Chinese, [added: U.K.,] and certain [removed: U.S., German, and U.K. operations] [added: U.S.] and [removed: have approximately two-thirds of the program completed as measured in users.][added: German operations.]
In addition, some of our products are used in “legal for trade” applications, in which prices based on weight are calculated and for which specific weights and [removed: measures approvals are required.]
[added: Although there are a large number of regulatory agencies across our] markets, there is an increasing trend toward harmonization of standards, and weights and measures regulation is harmonized across the European Union.
We estimate that the costs of compliance associated with the site over the next several years will approximate [added: a total of] $0.4 million.
Given the sometimes significant growth rates of these emerging markets, and in light of their cost advantage over developed markets, emerging market competitors could become more significant [removed: global competitors.]
We estimate that we have approximately two-thirds of the program completed as measured in users.
measures approvals are required.
global competitors.
Although there are a large number of regulatory agencies across our
Fax: +1 614 438 4646
Cover and table of contents
26 rewritten, 5 added, 5 removed, 93 unchanged
| | | For the fiscal year ended December 31, [removed: 2015] [added: 2016] |
As of January [removed: 29, 2016] [added: 30, 2017] there were [removed: 26,980,942] [added: 25,940,008] shares of the registrant’s Common Stock, $0.01 par value per share, outstanding.
The aggregate market value of the shares of Common Stock held by non-affiliates of the registrant on June 30, [removed: 2015] [added: 2016] (based on the closing price for the Common Stock on the New York Stock Exchange as of the last business day of the registrant’s most recently completed second fiscal quarter, June 30, [removed: 2015)] [added: 2016)] was approximately [removed: $9.5] [added: $9.7] billion.
| Certain Sections of the Proxy Statement for [removed: 2015] [added: 2016] | | Part III |
FOR THE FISCAL YEAR ENDED DECEMBER 31, [removed: 2015][added: 2016]
| [Item [removed: 1.](#s20E1152DC373CA977CF247765AC5135A)] [added: 1.](#s49E58F96C7581E915E4B74E41E22E2B5)] | [removed: [Business](#s20E1152DC373CA977CF247765AC5135A)] [added: [Business](#s49E58F96C7581E915E4B74E41E22E2B5)] | [removed: [4](#s20E1152DC373CA977CF247765AC5135A)] [added: [4](#s49E58F96C7581E915E4B74E41E22E2B5)] |
| [Item [removed: 1A.](#s558BCC1A0D7D52DB3C7E47765AF70973)] [added: 1A.](#sB942B8ACCE6D8A8F113774E41E45302B)] | [Risk [removed: Factors](#s558BCC1A0D7D52DB3C7E47765AF70973)] [added: Factors](#sB942B8ACCE6D8A8F113774E41E45302B)] | [removed: [14](#s558BCC1A0D7D52DB3C7E47765AF70973)] [added: [13](#sB942B8ACCE6D8A8F113774E41E45302B)] |
| [Item [removed: 1B.](#s827D6D4F7F2B2C71642847765B2C98CA)] [added: 1B.](#sC8D52CA56557C4D06F9F74E41E765334)] | [Unresolved Staff [removed: Comments](#s827D6D4F7F2B2C71642847765B2C98CA)] [added: Comments](#sC8D52CA56557C4D06F9F74E41E765334)] | [removed: [23](#s827D6D4F7F2B2C71642847765B2C98CA)] [added: [23](#sC8D52CA56557C4D06F9F74E41E765334)] |
| [Item [removed: 2.](#sD9493CCB97462822E7D5477656CD34A6)] [added: 2.](#sB6EDD70A16D935DDB15B74E4138F4435)] | [removed: [Properties](#sD9493CCB97462822E7D5477656CD34A6)] [added: [Properties](#sB6EDD70A16D935DDB15B74E4138F4435)] | [removed: [24](#sD9493CCB97462822E7D5477656CD34A6)] [added: [24](#sB6EDD70A16D935DDB15B74E4138F4435)] |
| [Item [removed: 3.](#s783A13070AACF6C0F53147765B706D7A)] [added: 3.](#sF3A22437AB3E8EA288C974E41EC98473)] | [Legal [removed: Proceedings](#s783A13070AACF6C0F53147765B706D7A)] [added: Proceedings](#sF3A22437AB3E8EA288C974E41EC98473)] | [removed: [24](#s783A13070AACF6C0F53147765B706D7A)] [added: [24](#sF3A22437AB3E8EA288C974E41EC98473)] |
| | [Executive Officers of the [removed: Registrant](#s783A13070AACF6C0F53147765B706D7A)] [added: Registrant](#sF3A22437AB3E8EA288C974E41EC98473)] | [removed: [24](#s783A13070AACF6C0F53147765B706D7A)] [added: [24](#sF3A22437AB3E8EA288C974E41EC98473)] |
| [Item [removed: 5.](#sD55805CF0D3BF0C714FB47765BC47304)] [added: 5.](#s603C516F7DE0EE7CA91C74E41F1D95C3)] | [Market for Registrant’s Common Equity, Related Stockholder Matters, and Issuer Purchases of Equity [removed: Securities](#sD55805CF0D3BF0C714FB47765BC47304)] [added: Securities](#s603C516F7DE0EE7CA91C74E41F1D95C3)] | [removed: [25](#sD55805CF0D3BF0C714FB47765BC47304)] [added: [25](#s603C516F7DE0EE7CA91C74E41F1D95C3)] |
| [Item [removed: 6.](#s90A7CB026071F467CF9947765BF85313)] [added: 6.](#s0B1B354902D942BE01CD74E41F3F99EA)] | [Selected Financial [removed: Data](#s90A7CB026071F467CF9947765BF85313)] [added: Data](#s0B1B354902D942BE01CD74E41F3F99EA)] | [removed: [28](#s90A7CB026071F467CF9947765BF85313)] [added: [28](#s0B1B354902D942BE01CD74E41F3F99EA)] |
| [Item [removed: 7.](#s8057BA765B086C97DF5D477654EE706A)] [added: 7.](#s72AFB55BDF8BB44545F374E413DAE711)] | [Management’s Discussion and Analysis of Financial Condition and Results of [removed: Operations](#s8057BA765B086C97DF5D477654EE706A)] [added: Operations](#s72AFB55BDF8BB44545F374E413DAE711)] | [removed: [29](#s8057BA765B086C97DF5D477654EE706A)] [added: [29](#s72AFB55BDF8BB44545F374E413DAE711)] |
| [Item [removed: 7A.](#s012F8A808555914B984447765CC6FFA6)] [added: 7A.](#sEE78FAFFA50F39A39D7D74E42018A7F0)] | [Quantitative and Qualitative Disclosures about Market [removed: Risk](#s012F8A808555914B984447765CC6FFA6)] [added: Risk](#sEE78FAFFA50F39A39D7D74E42018A7F0)] | [removed: [45](#s012F8A808555914B984447765CC6FFA6)] [added: [44](#sEE78FAFFA50F39A39D7D74E42018A7F0)] |
| [Item [removed: 8.](#sC2293F28C3728AD1986147765CC61261)] [added: 8.](#s5550678A76D15294967374E4201EF48E)] | [Financial Statements and Supplementary [removed: Data](#sC2293F28C3728AD1986147765CC61261)] [added: Data](#s5550678A76D15294967374E4201EF48E)] | [removed: [45](#sC2293F28C3728AD1986147765CC61261)] [added: [44](#s5550678A76D15294967374E4201EF48E)] |
| [Item [removed: 9.](#sA14065512C2D5AE054AF47765CC65214)] [added: 9.](#sBB385BD7E4F5D2916AF874E42022C30A)] | [Changes in and Disagreements with Accountants on Accounting and Financial [removed: Disclosure](#sA14065512C2D5AE054AF47765CC65214)] [added: Disclosure](#sBB385BD7E4F5D2916AF874E42022C30A)] | [removed: [45](#sA14065512C2D5AE054AF47765CC65214)] [added: [44](#sBB385BD7E4F5D2916AF874E42022C30A)] |
| [Item [removed: 9A.](#s6A3ED98EC86D6CEE54E047765CC7339D)] [added: 9A.](#sF2844D9276B5670A970274E4202614B3)] | [Controls and [removed: Procedures](#s6A3ED98EC86D6CEE54E047765CC7339D)] [added: Procedures](#sF2844D9276B5670A970274E4202614B3)] | [removed: [45](#s6A3ED98EC86D6CEE54E047765CC7339D)] [added: [44](#sF2844D9276B5670A970274E4202614B3)] |
| [Item [removed: 9B.](#s08723DBDB925FF4398B747765CEA8C40)] [added: 9B.](#s413D188462D5E5009BCC74E4203ADC39)] | [Other [removed: Information](#s08723DBDB925FF4398B747765CEA8C40)] [added: Information](#s413D188462D5E5009BCC74E4203ADC39)] | [removed: [46](#s08723DBDB925FF4398B747765CEA8C40)] [added: [45](#s413D188462D5E5009BCC74E4203ADC39)] |
| [PART [removed: III](#s79467046C9266C32EF7F47765D0DE850)] [added: III](#s7697790D37CB548F450674E4206AB9E0)] | | |
| [Item [removed: 10.](#sDD468E89D4E5582D7B3B47765D3EB5F7)] [added: 10.](#s2A84239DB1098937378574E4208BDBA7)] | [Directors, Executive Officers, and Corporate [removed: Governance](#sDD468E89D4E5582D7B3B47765D3EB5F7)] [added: Governance](#s2A84239DB1098937378574E4208BDBA7)] | [removed: [47](#sDD468E89D4E5582D7B3B47765D3EB5F7)] [added: [46](#s2A84239DB1098937378574E4208BDBA7)] |
| [Item [removed: 11.](#s5E3EF23F0F5C1B2D5B6D47765D601DA3)] [added: 11.](#sD22B297870FA0BD0806174E420BE5D21)] | [Executive [removed: Compensation](#s5E3EF23F0F5C1B2D5B6D47765D601DA3)] [added: Compensation](#sD22B297870FA0BD0806174E420BE5D21)] | [removed: [48](#s5E3EF23F0F5C1B2D5B6D47765D601DA3)] [added: [47](#sD22B297870FA0BD0806174E420BE5D21)] |
| [Item [removed: 12.](#s26EB4A7548C3A00DCA2547765D9178FC)] [added: 12.](#s66E50609C54A83F8578274E420DFBCA9)] | [Security Ownership of Certain Beneficial Owners and Management and Related Stockholder [removed: Matters](#s26EB4A7548C3A00DCA2547765D9178FC)] [added: Matters](#s66E50609C54A83F8578274E420DFBCA9)] | [removed: [48](#s26EB4A7548C3A00DCA2547765D9178FC)] [added: [47](#s66E50609C54A83F8578274E420DFBCA9)] |
| [Item [removed: 13.](#s4E10330A1F4D1096C8A347765DB994F3)] [added: 13.](#sA5CDD338299C545E11C874E42111495F)] | [Certain Relationships and Related Transactions and Director [removed: Independence](#s4E10330A1F4D1096C8A347765DB994F3)] [added: Independence](#sA5CDD338299C545E11C874E42111495F)] | [removed: [49](#s4E10330A1F4D1096C8A347765DB994F3)] [added: [48](#sA5CDD338299C545E11C874E42111495F)] |
| [Item [removed: 14.](#s053FF021454FDA21960747765E093B25)] [added: 14.](#s26AD1A12F6910CA8960B74E421329B2B)] | [Principal Accounting Fees and [removed: Services](#s053FF021454FDA21960747765E093B25)] [added: Services](#s26AD1A12F6910CA8960B74E421329B2B)] | [removed: [49](#s053FF021454FDA21960747765E093B25)] [added: [48](#s26AD1A12F6910CA8960B74E421329B2B)] |
| [Item [removed: 15.](#s5A01D3BE5F6FEE5F33AE47765E5C8412)] [added: 15.](#s02285DE729D1199DBF2074E42186B23F)] | [Exhibits and Financial Statement [removed: Schedules](#s5A01D3BE5F6FEE5F33AE47765E5C8412)] [added: Schedules](#s02285DE729D1199DBF2074E42186B23F)] | [removed: [49](#s5A01D3BE5F6FEE5F33AE47765E5C8412)] [added: [48](#s02285DE729D1199DBF2074E42186B23F)] |
10-K 1 mtd_10kx12312016.htm FORM 10-K 2016 ANNUAL REPORT
| [PART I](#s67F60A9ECF1F878E819874E41DF07B24) | | |
| [PART II](#s2AFC35CEA5DC8DEB557574E41EEAF772) | | |
| [PART IV](#s792CF474CD2A254F6FD174E42165B504) | | |
| [SIGNATURES](#sAA81545434622CD4FFA374E421B75B8E) | | [49](#sAA81545434622CD4FFA374E421B75B8E) |
10-K 1 mtd_10kx12312015.htm FORM 10-K
| [PART I](#sC1D3483577AE8A0C183247765AA5C61D) | | |
| [PART II](#sE1BFF2599225E8F85C5947765BC2AC38) | | |
| [PART IV](#s292CBB1526DAC16ABB2847765E0C7F9E) | | |
| [SIGNATURES](#s332D6F083A2596C6D6DE47765E5F08C2) | | [50](#s332D6F083A2596C6D6DE47765E5F08C2) |
Item 2. Properties
3 rewritten, 1 added, 0 removed, 38 unchanged
| Warsaw, Poland | | [removed: Building] Leased | | Other Operations |
| Oakland, California | | [removed: Leased] [added: Owned] | | U.S. Operations |
| Mumbai, India [removed: (two] [added: (three] facilities) | | [removed: Buildings] Leased | | Other Operations |
| Thorofare, New Jersey | | Owned | | U.S. Operations |
Item 5. Market for Registrant’s Common Equity, Related Stockholder Matters, and Issuer Purchases of Equity Securities
9 rewritten, 14 added, 14 removed, 31 unchanged
At January [removed: 29, 2016,] [added: 30, 2017,] there were [removed: 58] [added: 56] holders of record of common stock and [removed: 26,980,942] [added: 25,940,008] shares of common stock outstanding.
We estimate we have approximately [removed: 39,794] [added: 58,068] beneficial owners of common stock.
The following graph compares the cumulative total returns (assuming reinvestment of dividends) on $100 invested on December 31, [removed: 2010] [added: 2011] through December 31, [removed: 2015] [added: 2016] in our common stock, the Standard & Poor’s 500 Composite Stock Index (S&P 500 Index), and the SIC Code 3826 Index — Laboratory Analytical Instruments.
[removed: 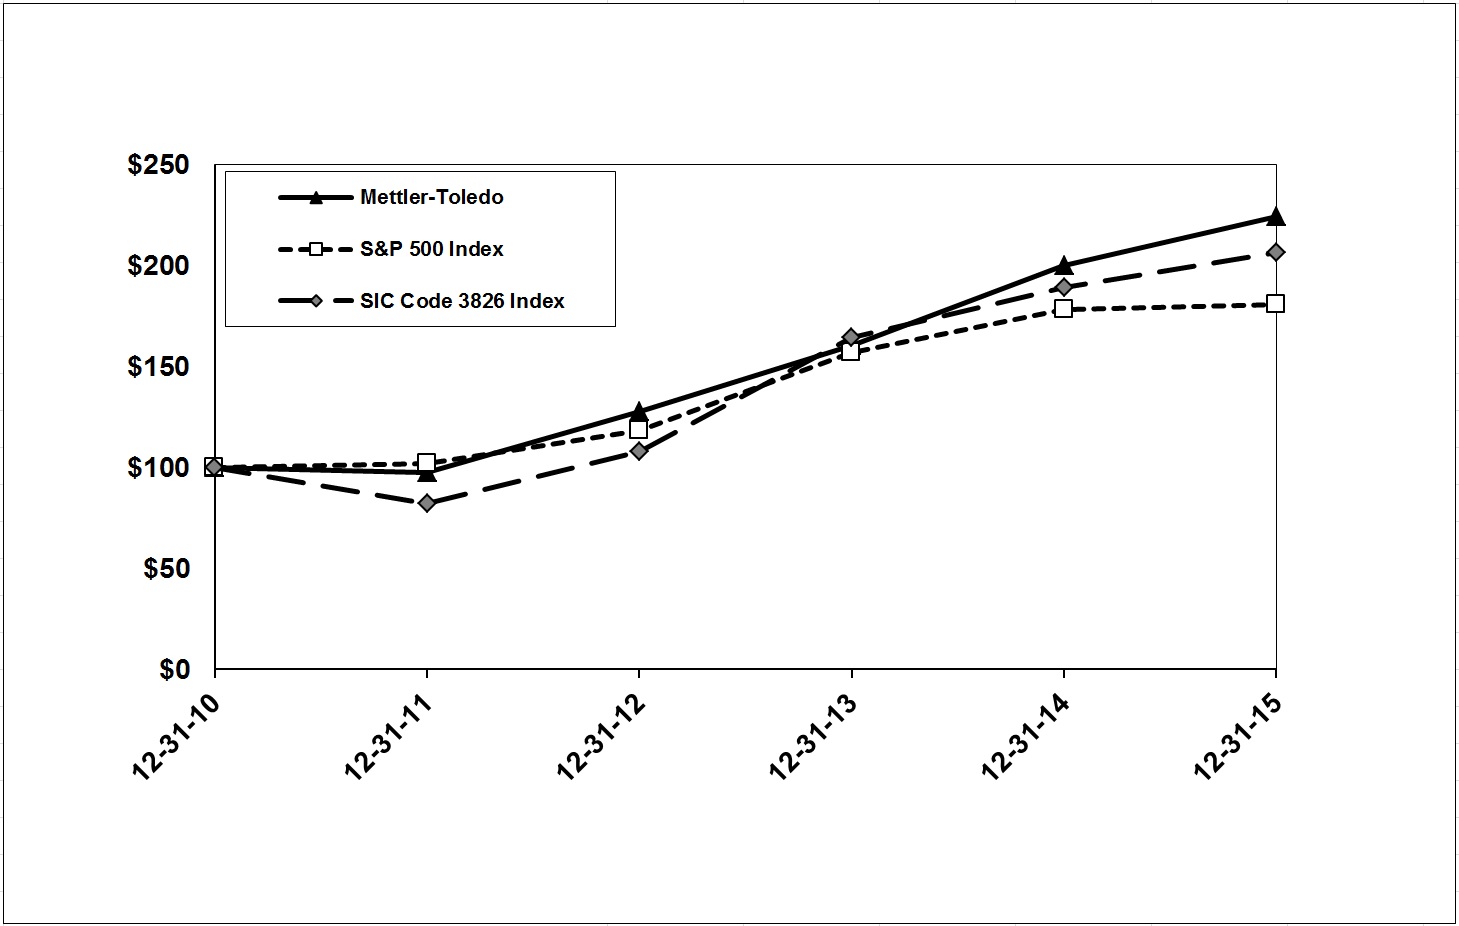][added: ]
[removed: The Company has] [added: We have] a share repurchase program of which there was [removed: $1.5 billion of remaining] [added: $983.4 million] common shares [removed: authorized] [added: remaining] to be repurchased under the program as of December 31, [removed: 2015.][added: 2016.]
The share repurchases are expected to be funded from [removed: existing] cash balances, borrowings, and cash generated from operating activities.
Repurchases will be made through open market transactions, and the amount and timing of [removed: repurchases] [added: purchases] will depend on business and market conditions, [added: the] stock price, trading restrictions, the level of acquisition activity, and other factors.
We have purchased [removed: 24.6] [added: 26.0] million common shares since the inception of the program [added: in 2004] through December 31, [removed: 2015,] [added: 2016,] at a total cost of [removed: $3.0] [added: $3.5] billion.
During the years ended December 31, [removed: 2015] [added: 2016] and [removed: 2014,] [added: 2015,] we spent [removed: $495.0] [added: $500] million and [removed: $414.0] [added: $495] million on the repurchase of [removed: 1,556,797] [added: 1,348,507] shares and [removed: 1,617,499] [added: 1,556,797] shares at an average price per share of [removed: $317.92] [added: $370.75] and [removed: $255.93,] [added: $317.92,] respectively.
| 2016 | | | | | | | |
| Fourth Quarter | $ | 429.91 | | | $ | 397.73 | |
| Third Quarter | $ | 419.83 | | | $ | 363.19 | |
| Second Quarter | $ | 385.50 | | | $ | 347.76 | |
| First Quarter | $ | 347.09 | | | $ | 298.14 | |
| | 12/31/11 | 12/31/12 | 12/31/13 | 12/31/14 | 12/31/15 | 12/31/16 |
| Mettler-Toledo | $100 | $131 | $164 | $205 | $230 | $283 |
| S&P 500 Index | $100 | $116 | $154 | $175 | $177 | $198 |
| SIC Code 3826 Index | $100 | $128 | $188 | $215 | $237 | $240 |
| October 1 to October 31, 2016 | | 91,077 | | | $ | 411.75 | | | 91,077 | | | $ | 1,070,914 | |
| November 1 to November 30, 2016 | | 105,291 | | | 415.47 | | | | 105,291 | | | 1,027,167 | | |
| December 1 to December 31, 2016 | | 104,064 | | | 420.37 | | | | 104,064 | | | 983,419 | | |
| Total | | 300,432 | | | $ | 416.04 | | | 300,432 | | | $ | 983,419 | |
We reissued 278,623 shares and 403,908 shares held in treasury for the exercise of stock options and restricted stock units during 2016 and 2015, respectively.
| 2014 | | | | | | | |
| Fourth Quarter | $ | 305.89 | | | $ | 233.85 | |
| Third Quarter | $ | 272.84 | | | $ | 249.99 | |
| Second Quarter | $ | 253.18 | | | $ | 223.80 | |
| First Quarter | $ | 255.85 | | | $ | 231.19 | |
| | 12/31/10 | 12/31/11 | 12/31/12 | 12/31/13 | 12/31/14 | 12/31/15 |
| Mettler-Toledo | $100 | $98 | $128 | $160 | $200 | $224 |
| S&P 500 Index | $100 | $102 | $118 | $157 | $178 | $181 |
| SIC Code 3826 Index | $100 | $82 | $108 | $164 | $189 | $207 |
| October 1 to October 31, 2015 | | 131,928 | | | $ | 292.13 | | | 131,928 | | | $ | 68,610 | |
| November 1 to November 30, 2015 | | 124,660 | | | 325.43 | | | | 124,660 | | | 1,528,039 | | |
| December 1 to December 31, 2015 | | 132,413 | | | 337.02 | | | | 132,413 | | | 1,483,411 | | |
| Total | | 389,001 | | | $ | 318.08 | | | 389,001 | | | $ | 1,483,411 | |
This includes the Board of Directors authorization of an additional $1.5 billion to the program in November 2015.
Item 6. Selected Financial Data
22 rewritten, 5 added, 5 removed, 26 unchanged
| | [removed: 2015] [added: 2016] | | | | [removed: 2014] [added: 2015] | | | | [removed: 2013] [added: 2014] | | | | [removed: 2012] [added: 2013] | | | | [removed: 2011] [added: 2012] | | |
| Net sales | $ | [removed: 2,395,447] [added: 2,508,257] | | | $ | [removed: 2,485,983] [added: 2,395,447] | | | $ | [removed: 2,378,972] [added: 2,485,983] | | | $ | [removed: 2,341,528] [added: 2,378,972] | | | $ | [removed: 2,309,328] [added: 2,341,528] | |
| Cost of sales | [removed: 1,043,454] [added: 1,072,670] | | | | [removed: 1,127,233] [added: 1,043,454] | | | | [removed: 1,097,041] [added: 1,127,233] | | | | [removed: 1,100,473] [added: 1,097,041] | | | | [removed: 1,091,054] [added: 1,100,473] | | |
| Gross profit | [removed: 1,351,993] [added: 1,435,587] | | | | [removed: 1,358,750] [added: 1,351,993] | | | | [removed: 1,281,931] [added: 1,358,750] | | | | [removed: 1,241,055] [added: 1,281,931] | | | | [removed: 1,218,274] [added: 1,241,055] | | |
| Research and development | [removed: 119,076] [added: 119,968] | | | | [removed: 123,297] [added: 119,076] | | | | [removed: 116,346] [added: 123,297] | | | | [removed: 112,530] [added: 116,346] | | | | [removed: 116,139] [added: 112,530] | | |
| Selling, general, and administrative | [removed: 700,810] [added: 732,622] | | | | [removed: 728,582] [added: 700,810] | | | | [removed: 692,693] [added: 728,582] | | | | [removed: 684,026] [added: 692,693] | | | | [removed: 703,632] [added: 684,026] | | |
| Amortization | [removed: 30,951] [added: 36,052] | | | | [removed: 29,185] [added: 30,951] | | | | [removed: 24,539] [added: 29,185] | | | | [removed: 21,357] [added: 24,539] | | | | [removed: 17,808] [added: 21,357] | | |
| Interest expense | [removed: 27,451] [added: 28,026] | | | | [removed: 24,537] [added: 27,451] | | | | [removed: 22,711] [added: 24,537] | | | | [removed: 22,764] [added: 22,711] | | | | [removed: 23,226] [added: 22,764] | | |
| Restructuring charges(a) | [removed: 11,148] [added: 6,235] | | | | [removed: 5,915] [added: 11,148] | | | | [removed: 19,830] [added: 5,915] | | | | [removed: 16,687] [added: 19,830] | | | | [removed: 5,912] [added: 16,687] | | |
| Other charges (income), net(b) | [added: 8,491 | | | |] (867 | | ) | | 2,230 | | | | 3,103 | | | | 1,090 | | | [removed: | 2,380 | | |]
| Earnings before taxes | [removed: 463,424] [added: 504,193] | | | | [removed: 445,004] [added: 463,424] | | | | [removed: 402,709] [added: 445,004] | | | | [removed: 382,601] [added: 402,709] | | | | [removed: 349,177] [added: 382,601] | | |
| Provision for [removed: taxes(c)] [added: taxes] | [removed: 110,604] [added: 119,823] | | | | [removed: 106,763] [added: 110,604] | | | | [removed: 96,615] [added: 106,763] | | | | [removed: 91,754] [added: 96,615] | | | | [removed: 79,684] [added: 91,754] | | |
| Net earnings | $ | [removed: 352,820] [added: 384,370] | | | $ | [removed: 338,241] [added: 352,820] | | | $ | [removed: 306,094] [added: 338,241] | | | $ | [removed: 290,847] [added: 306,094] | | | $ | [removed: 269,493] [added: 290,847] | |
| Net earnings | $ | [removed: 12.75] [added: 14.49] | | | $ | [removed: 11.71] [added: 12.75] | | | $ | [removed: 10.22] [added: 11.71] | | | $ | [removed: 9.37] [added: 10.22] | | | $ | [removed: 8.45] [added: 9.37] | |
| Weighted average number of common shares | [removed: 27,680,918] [added: 26,517,768] | | | | [removed: 28,890,771] [added: 27,680,918] | | | | [removed: 29,945,954] [added: 28,890,771] | | | | [removed: 31,044,532] [added: 29,945,954] | | | | [removed: 31,897,779] [added: 31,044,532] | | |
| Net earnings | $ | [removed: 12.48] [added: 14.22] | | | $ | [removed: 11.44] [added: 12.48] | | | $ | [removed: 9.96] [added: 11.44] | | | $ | [removed: 9.14] [added: 9.96] | | | $ | [removed: 8.21] [added: 9.14] | |
| Weighted average number of common and common equivalent shares | [removed: 28,269,615] [added: 27,023,905] | | | | [removed: 29,571,308] [added: 28,269,615] | | | | [removed: 30,728,482] [added: 29,571,308] | | | | [removed: 31,824,077] [added: 30,728,482] | | | | [removed: 32,839,365] [added: 31,824,077] | | |
| Cash and cash equivalents | $ | [removed: 98,887] [added: 158,674] | | | $ | [removed: 85,263] [added: 98,887] | | | $ | [removed: 111,874] [added: 85,263] | | | $ | [removed: 101,702] [added: 111,874] | | | $ | [removed: 235,601] [added: 101,702] | |
| Other non-current liabilities(e) | [removed: 194,552] [added: 204,957] | | | | [removed: 218,108] [added: 194,552] | | | | [removed: 193,170] [added: 218,108] | | | | [removed: 240,886] [added: 193,170] | | | | [removed: 209,945] [added: 240,886] | | |
| Shareholders’ equity(f) | [removed: 580,457] [added: 434,943] | | | | [removed: 719,595] [added: 580,457] | | | | [removed: 935,052] [added: 719,595] | | | | [removed: 827,219] [added: 935,052] | | | | [removed: 781,137] [added: 827,219] | | |
| [removed: (d)] [added: (c)] | Working capital represents total current assets net of cash, less total current liabilities net of short-term borrowings and current maturities of long-term debt. |
| (f) | No dividends were paid during the five-year period ended December 31, [removed: 2015.] [added: 2016.] |
| Working capital(c)(d) | 169,569 | | | | 152,721 | | | | 172,380 | | | | 225,551 | | | | 211,768 | | |
| Total assets(d) | 2,166,777 | | | | 1,959,335 | | | | 1,973,532 | | | | 2,120,755 | | | | 2,006,009 | | |
| Long-term debt(d) | 875,056 | | | | 575,138 | | | | 334,134 | | | | 395,102 | | | | 346,503 | | |
| (b) | Other charges (income), net consists primarily of interest income, (gains) losses from foreign currency transactions and hedging activity, interest income, and other items. Other charges (income), net for 2016 also includes a one-time non-cash pension settlement charge of $8.2 million related to a lump sum offering to former employees of our U.S. pension plan, and acquisition transaction costs of $1.1 million. |
| (d) | Certain reclassifications have been made to prior year amounts to conform to the current year presentation. |
| Working capital(d) | 183,289 | | | | 201,441 | | | | 254,992 | | | | 242,141 | | | | 201,718 | | |
| Total assets | 2,018,485 | | | | 2,009,110 | | | | 2,152,819 | | | | 2,022,288 | | | | 2,114,910 | | |
| Long-term debt | 576,984 | | | | 335,790 | | | | 395,960 | | | | 347,131 | | | | 476,715 | | |
| (b) | Other charges (income), net consists primarily of interest income, (gains) losses from foreign currency transactions and hedging activity, and other items. |
| (c) | The provision for taxes for 2011 includes discrete tax items resulting in a net tax benefit of $3.8 million, primarily related to the favorable resolution of certain prior year tax matters. |
Item 9A. Controls and Procedures
4 rewritten, 1 added, 0 removed, 11 unchanged
Conclusions Regarding the Effectiveness of Disclosure Controls and Procedures [removed: and Changes in Internal Control over Financial Reporting]
There were no changes in our internal control over financial reporting during the quarter ended December 31, [removed: 2015] [added: 2016] that have materially affected, or are reasonably likely to materially affect, our internal control over financial reporting.
Management assessed the effectiveness of the Company’s internal control over financial reporting as of December 31, [removed: 2015.][added: 2016.]
Based on our assessment, we concluded that, as of December 31, [removed: 2015,] [added: 2016,] the Company’s internal control over financial reporting is effective.
Changes in Internal Control over Financial Reporting
Item 10. Directors, Executive Officers, and Corporate Governance
9 rewritten, 6 added, 0 removed, 41 unchanged
| Olivier A. Filliol | | [removed: 49] [added: 50] | | President and Chief Executive Officer |
| William P. Donnelly | | [removed: 54] [added: 55] | | Executive Vice President |
| Thomas Caratsch | | [removed: 57] [added: 58] | | Head of Laboratory |
| Christian Magloth | | [removed: 50] [added: 51] | | Head of Human Resources |
| Michael Heidingsfelder | | [removed: 55] [added: 56] | | Head of Industrial |
| Simon Kirk | | [removed: 56] [added: 57] | | Head of Product Inspection |
| Marc de La Guéronnière | | [removed: 52] [added: 53] | | Head of European and North American Market Organizations |
| Waldemar Rauch | | [removed: 53] [added: 54] | | Head of Process Analytics |
The remaining information called for by this item is incorporated by reference from the discussion in the sections “Proposal One: Election of Directors,” “Board of Directors — General Information,” “Board of Directors — Operation,” and “Additional Information — Section 16(a) Beneficial Ownership Reporting Compliance” in the [removed: 2016] [added: 2017] Proxy Statement.
| Shawn P. Vadala | | 48 | | Chief Financial Officer |
Shawn P.
Vadala joined the Company in 1997 and has been Chief Financial Officer since January 2014.
He is also responsible for the Company's Pricing and Business Intelligence programs.
Mr. Vadala previously held various senior financial positions at the Company's Columbus, Ohio and Greifensee, Switzerland offices.
Prior to joining the Company, he worked in the Boston and Zurich, Switzerland offices of PricewaterhouseCoopers.
Item 11. Executive Compensation
1 rewritten, 0 added, 0 removed, 2 unchanged
The information appearing in the sections captioned “Board of Directors — General Information — Director Compensation,” “Compensation Discussion and Analysis,” “Compensation Committee Report,” and “Additional Information — Compensation Committee Interlocks and Insider Participation” in the [removed: 2016] [added: 2017] Proxy Statement is incorporated by reference herein.
Item 12. Security Ownership of Certain Beneficial Owners and Management and Related Stockholder Matters
2 rewritten, 1 added, 0 removed, 2 unchanged
The information appearing in the section “Share Ownership” in the [removed: 2016] [added: 2017] Proxy Statement is incorporated by reference herein.
[removed: Information appearing in “Securities Authorized for Issuance under] Equity Compensation Plans as of December 31, [removed: 2015”] [added: 2016”] is included within Note 11 to the financial statements.
Information appearing in “Securities Authorized for Issuance under
Item 13. Certain Relationships and Related Transactions and Director Independence
1 rewritten, 0 added, 0 removed, 3 unchanged
Director Independence — The information in the section “Board of Directors — General Information — Independence of the Board” in the [removed: 2016] [added: 2017] Proxy Statement is incorporated by reference herein.
Item 14. Principal Accounting Fees and Services
1 rewritten, 0 added, 0 removed, 3 unchanged
Information appearing in the section “Audit Committee Report” in the [removed: 2016] [added: 2017] Proxy Statement is hereby incorporated by reference.
Item 15. Exhibits and Financial Statement Schedules
401 rewritten, 237 added, 155 removed, 931 unchanged
Date: February [removed: 4, 2016][added: 2, 2017]
| 3.2 | Amended By-laws of the Company, effective as of [removed: May 7, 2015(2)] [added: November 3, 2016(2)] |
| [removed: 10.59] [added: 10.60] | Form of Tax Equalization Agreement between Messrs. Caratsch, Filliol, Kirk, Magloth, and Spoerry, and Mettler-Toledo International Inc., dated October 10, 2007(9) |
| 31.1* | [removed: Certification] [added: [Certification] of the Chief Executive Officer Pursuant to Section 302 of the Sarbanes-Oxley Act of [removed: 2002] [added: 2002](https://www.sec.gov/Archives/edgar/data/1037646/000103764617000004/mtd_exhibit311x12312016.htm)] |
| 31.2* | [removed: Certification] [added: [Certification] of the Executive Vice President Pursuant to Section 302 of the Sarbanes-Oxley Act of [removed: 2002] [added: 2002](https://www.sec.gov/Archives/edgar/data/1037646/000103764617000004/mtd_exhibit31212312016.htm)] |
| 31.3* | [removed: Certification] [added: [Certification] of the Chief Financial Officer Pursuant to Section 302 of the Sarbanes-Oxley Act of [removed: 2002] [added: 2002](https://www.sec.gov/Archives/edgar/data/1037646/000103764617000004/mtd_exhibit31312312016.htm)] |
| 32* | [removed: Certification] [added: [Certification] Pursuant to Section 906 of the Sarbanes-Oxley Act of [removed: 2002] [added: 2002](https://www.sec.gov/Archives/edgar/data/1037646/000103764617000004/mtd_exhibit3212312016.htm)] |
| (2) | Incorporated by reference to the Company’s Report on Form 8-K dated [removed: May 11, 2015] [added: November 8, 2016] |
| [Report of Independent Registered Public Accounting [removed: Firm](#s31E862868FA59CFD63A147765EDE7229)] [added: Firm](#sC68913092835331D174274E4222D0AED)] | [removed: F-2] [added: [F-2](#sC68913092835331D174274E4222D0AED)] |
| [Consolidated Statements of Operations for the years ended December 31, [added: 2016,] 2015, [removed: 2014,] and [removed: 2013](#s137DD009AD41D326B18947764FB79A48)] [added: 2014](#s9B1EBB4E78FA427162C974E40DC29697)] | [removed: F-3] [added: [F-3](#s9B1EBB4E78FA427162C974E40DC29697)] |
| [Consolidated Statements of Comprehensive Income for the years ended December 31, [added: 2016,] 2015, [removed: 2014,] and [removed: 2013](#sB72FF42FD81CB725919F47764FC762C8)] [added: 2014](#s6032B62984656579972474E40EECAADB)] | [removed: F-4] [added: [F-4](#s6032B62984656579972474E40EECAADB)] |
| [Consolidated Balance Sheets as of December 31, [removed: 2015] [added: 2016] and [removed: 2014](#s968013054656C3D5106847764FD604A1)] [added: 2015](#s3DC12E0CEABEEF2A57EB74E40E7D5FDC)] | [removed: F-5] [added: [F-5](#s3DC12E0CEABEEF2A57EB74E40E7D5FDC)] |
| [Consolidated Statements of Shareholders’ Equity for the years ended December 31, [added: 2016,] 2015, [removed: 2014,] and [removed: 2013](#s27459617480BAE7BFCE447764FE6CDE2)] [added: 2014](#sCBD59256306C2E742B2D74E40D58C265)] | [removed: F-6] [added: [F-6](#sCBD59256306C2E742B2D74E40D58C265)] |
| [Consolidated Statements of Cash Flows for the years ended December 31, [added: 2016,] 2015, [removed: 2014,] and [removed: 2013](#s7A4A55CE3B7E2724CDF447764FF562D0)] [added: 2014](#sF752507252733ADA5C8074E40D9133C5)] | [removed: F-7] [added: [F-7](#sF752507252733ADA5C8074E40D9133C5)] |
| [Notes to the Consolidated Financial [removed: Statements](#s692A79E874A3AA7441CD4776601FB977)] [added: Statements](#s0B19C4CA6616BC266A2574E42358E390)] | [removed: F-8] [added: [F-8](#s0B19C4CA6616BC266A2574E42358E390)] |
To the Board of Directors and Shareholders [added: of Mettler-Toledo International Inc.]
[removed: of Mettler-Toledo International Inc.][added: METTLER-TOLEDO INTERNATIONAL INC.]
In our opinion, the consolidated financial statements listed in the index appearing on page F-1 present fairly, in all material respects, the financial position of Mettler-Toledo International Inc. and its subsidiaries at December 31, [removed: 2015] [added: 2016] and December 31, [removed: 2014,] [added: 2015,] and the results of their operations and their cash flows for each of the three years in the period ended December 31, [removed: 2015] [added: 2016] in conformity with accounting principles generally accepted in the United States of America.
Also in our opinion, the Company maintained, in all material respects, effective internal control over financial reporting as of December 31, [removed: 2015,] [added: 2016,] based on criteria established in Internal Control — Integrated Framework (2013) issued by the Committee of Sponsoring Organizations of the Treadway Commission (COSO).
The Company’s management is responsible for these financial statements and financial statement [removed: schedules,] [added: schedule,] for maintaining effective internal control over financial reporting and for its assessment of the effectiveness of internal control over financial reporting, included in Management’s Report on Internal Control over Financial Reporting appearing under Item 9A.
| | [removed: 2015] [added: 2016] | | | | [removed: 2014] [added: 2015] | | | | [removed: 2013] [added: 2014] | | |
| Products | $ | [removed: 1,865,884] [added: 1,957,879] | | | $ | [removed: 1,930,497] [added: 1,865,884] | | | $ | [removed: 1,860,893] [added: 1,930,497] | |
| Service | [removed: 529,563] [added: 550,378] | | | | [removed: 555,486] [added: 529,563] | | | | [removed: 518,079] [added: 555,486] | | |
| Total net sales | [removed: 2,395,447] [added: 2,508,257] | | | | [removed: 2,485,983] [added: 2,395,447] | | | | [removed: 2,378,972] [added: 2,485,983] | | |
| Products | [removed: 744,867] [added: 767,753] | | | | [removed: 810,547] [added: 744,867] | | | | [removed: 795,225] [added: 810,547] | | |
| Service | [removed: 298,587] [added: 304,917] | | | | [removed: 316,686] [added: 298,587] | | | | [removed: 301,816] [added: 316,686] | | |
| Gross profit | [removed: 1,351,993] [added: 1,435,587] | | | | [removed: 1,358,750] [added: 1,351,993] | | | | [removed: 1,281,931] [added: 1,358,750] | | |
| Research and development | [removed: 119,076] [added: 119,968] | | | | [removed: 123,297] [added: 119,076] | | | | [removed: 116,346] [added: 123,297] | | |
| Selling, general, and administrative | [removed: 700,810] [added: 732,622] | | | | [removed: 728,582] [added: 700,810] | | | | [removed: 692,693] [added: 728,582] | | |
| Amortization | [removed: 30,951] [added: 36,052] | | | | [removed: 29,185] [added: 30,951] | | | | [removed: 24,539] [added: 29,185] | | |
| Interest expense | [removed: 27,451] [added: 28,026] | | | | [removed: 24,537] [added: 27,451] | | | | [removed: 22,711] [added: 24,537] | | |
| Restructuring charges | [removed: 11,148] [added: 6,235] | | | | [removed: 5,915] [added: 11,148] | | | | [removed: 19,830] [added: 5,915] | | |
| Other charges (income), net | [removed: (867] [added: 8,491] | | [removed: )] | | [removed: 2,230] [added: (867] | | [added: )] | | [removed: 3,103] [added: 2,230] | | |
| Earnings before taxes | [removed: 463,424] [added: 504,193] | | | | [removed: 445,004] [added: 463,424] | | | | [removed: 402,709] [added: 445,004] | | |
| Provision for taxes | [removed: 110,604] [added: 119,823] | | | | [removed: 106,763] [added: 110,604] | | | | [removed: 96,615] [added: 106,763] | | |
| Net earnings | $ | [removed: 352,820] [added: 384,370] | | | $ | [removed: 338,241] [added: 352,820] | | | $ | [removed: 306,094] [added: 338,241] | |
| Net earnings | $ | [removed: 12.75] [added: 14.49] | | | $ | [removed: 11.71] [added: 12.75] | | | $ | [removed: 10.22] [added: 11.71] | |
| Weighted average number of common shares | [removed: 27,680,918] [added: 26,517,768] | | | | [removed: 28,890,771] [added: 27,680,918] | | | | [removed: 29,945,954] [added: 28,890,771] | | |
| Net earnings | $ | [removed: 12.48] [added: 14.22] | | | $ | [removed: 11.44] [added: 12.48] | | | $ | [removed: 9.96] [added: 11.44] | |
| Weighted average number of common and common equivalent shares | [removed: 28,269,615] [added: 27,023,905] | | | | [removed: 29,571,308] [added: 28,269,615] | | | | [removed: 30,728,482] [added: 29,571,308] | | |
| /s/ Richard Francis | | Director |
| Richard Francis | | |
| 10.23* | [Form of Restricted Stock Unit Agreement](https://www.sec.gov/Archives/edgar/data/1037646/000103764617000004/mtd_exhibit1023formofrestr.htm) |
| 10.24* | [Form of Performance Share Unit Agreement](https://www.sec.gov/Archives/edgar/data/1037646/000103764617000004/mtd_exhibit1024formofperfo.htm) |
| 10.25* | [Performance Stock Option Agreement](https://www.sec.gov/Archives/edgar/data/1037646/000103764617000004/mtd_exhibit1025performance.htm) |
| 10.26* | [Form of Stock Option Agreement Directors](https://www.sec.gov/Archives/edgar/data/1037646/000103764617000004/mtd_exhibit1026formofstock.htm) |
| 10.27* | [Form of Stock Option Agreement CEO](https://www.sec.gov/Archives/edgar/data/1037646/000103764617000004/mtd_exhibit1027formofstock.htm) |
| 10.28* | [Form of Stock Option Agreement NEOs](https://www.sec.gov/Archives/edgar/data/1037646/000103764617000004/mtd_exhibit1028formofstock.htm) |
| 10.59* | [Employment Agreement between Shawn P. Vadala and Mettler-Toledo International Inc., dated as of October 24, 2016](https://www.sec.gov/Archives/edgar/data/1037646/000103764617000004/mtd_exhibit1059employmenta.htm) |
| 10.61 | Amendment to Employment Agreement between William Donnelly and Mettler-Toledo International, Inc. dated November 3, 2016 (2) |
| 21* | [Subsidiaries of the Company](https://www.sec.gov/Archives/edgar/data/1037646/000103764617000004/mtd_exhibit2112312016.htm) |
| 23.1* | [Consent of PricewaterhouseCoopers LLP](https://www.sec.gov/Archives/edgar/data/1037646/000103764617000004/mtd_exhibit23112312016.htm) |
As described in note 2 to the consolidated financial statements, the Company changed the manner in which it presents deferred tax assets and liabilities.
February 2, 2017
| Net earnings | $ | 384,370 | | | $ | 352,820 | | | $ | 338,241 | |
| | 2016 | | | | 2015 | | |
| Total current assets | 896,784 | | | | 795,332 | | |
| Goodwill | 476,378 | | | | 446,284 | | |
| Total assets | $ | 2,166,777 | | | $ | 1,959,335 | |
| Taxes payable | 47,990 | | | | 48,759 | | |
| Total current liabilities | 587,515 | | | | 558,212 | | |
| Long-term debt | 875,056 | | | | 575,138 | | |
| Total liabilities | 1,731,834 | | | | 1,378,878 | | |
| Total liabilities and shareholders’ equity | $ | 2,166,777 | | | $ | 1,959,335 | |
| Exercise of stock options and restricted stock units | 278,623 | | | — | | | | — | | | | 36,450 | | | | (10,979 | | ) | | — | | | | 25,471 | | |
| Repurchases of common stock | (1,348,507 | ) | | — | | | | — | | | | (499,992 | | ) | | — | | | | — | | | | (499,992 | | ) |
| Net earnings | — | | | — | | | | — | | | | — | | | | 384,370 | | | | — | | | | 384,370 | | |
| Balance at December 31, 2016 | 26,020,234 | | | $ | 448 | | | $ | 730,556 | | | $ | (3,006,771 | ) | | $ | 3,065,708 | | | $ | (354,998 | ) | | $ | 434,943 | |
| Net earnings | $ | 384,370 | | | $ | 352,820 | | | $ | 338,241 | |
| Amortization | 36,052 | | | | 30,951 | | | | 29,185 | | |
| Deferred tax provision | 1,878 | | | | 7,137 | | | | 15,362 | | |
| Non-cash pension settlement charge | 8,189 | | | | — | | | | — | | |
| Taxes payable | (3,072 | | ) | | 2,879 | | | | (461 | | ) |
If the Company is unable to conclude that goodwill asset is not impaired after considering the totality of events and circumstances during its qualitative assessment, the Company performs the first step of the two-step impairment test by estimating the fair value of the goodwill asset and comparing the fair value to the carrying amount of the goodwill asset.
If the carrying amount of the goodwill asset exceeds its fair value, then the Company performs the second step of the impairment test to measure the amount of the impairment loss, if any.
If the Company is unable to conclude that the indefinite-lived intangible asset is not impaired after considering the totality of events and circumstances, the Company performs an impairment test to measure the amount of the impairment loss, if any.
periods presented.
shares for the years ended December 31, 2016, 2015, and 2014, respectively, relating to outstanding stock options and restricted stock units.
ASU 2016-10 provides guidance for identifying performance obligations as they pertain to immaterial promised goods or services, shipping and handling activities, and identifying when promises represent performance obligations.
ASU 2016-12 provides guidance for assessing collectability, presentation of sales taxes, noncash considerations, and completed contract modifications at transition.
| /s/ George M. Milne | | Director |
| George M. Milne | | |
| 21* | Subsidiaries of the Company |
| 23.1* | Consent of PricewaterhouseCoopers LLP |
February 4, 2016
| Total current assets | 862,815 | | | | 849,430 | | |
| Non-current deferred tax assets, net | 22,873 | | | | 30,273 | | |
| Total assets | $ | 2,018,485 | | | $ | 2,009,110 | |
| Taxes payable | 63,241 | | | | 59,297 | | |
| Total current liabilities | 595,127 | | | | 678,890 | | |
| Long-term debt | 576,984 | | | | 335,790 | | |
| Non-current deferred tax liabilities, net | 71,365 | | | | 56,727 | | |
| Total liabilities | 1,438,028 | | | | 1,289,515 | | |
| Total liabilities and shareholders’ equity | $ | 2,018,485 | | | $ | 2,009,110 | |
| Balance at December 31, 2012 | 30,410,006 | | | $ | 448 | | | $ | 638,705 | | | $ | (1,463,924 | ) | | $ | 1,749,451 | | | $ | (97,461 | ) | | $ | 827,219 | |
| Exercise of stock options and restricted stock units | 398,646 | | | — | | | | — | | | | 37,870 | | | | (18,125 | | ) | | — | | | | 19,745 | | |
| Repurchases of common stock | (1,321,577 | ) | | — | | | | — | | | | (294,976 | | ) | | — | | | | — | | | | (294,976 | | ) |
| Net earnings | — | | | — | | | | — | | | | — | | | | 306,094 | | | | — | | | | 306,094 | | |
| Deferred tax provision | 7,258 | | | | 13,033 | | | | 8,816 | | |
| Taxes payable | 2,758 | | | | 1,868 | | | | (3,540 | | ) |
respective jurisdictions in which the Company operates.
This change, which can be early adopted, conforms U.S. GAAP to IFRS.
The adoption of this guidance would have reduced current and increased non-current assets by $67.5 million and reduced current and increased non-current liabilities by $22.4 million on the Company's consolidated balance sheet at December 31, 2015.
This change, which can be early adopted, becomes effective for the Company for the
year beginning January 1, 2016.
We are currently evaluating the impact this guidance will have on the Company's pension assets fair value hierarchy table in Note 12 of the financial statements.
The recognition and measurement guidance for debt issuance costs are not affected by the amendments in this update.
In August 2015, the FASB issued ASU 2015-15 and update to ASU 2015-03, which addresses the accounting for debt issuance costs related to line-of-credit arrangements as an asset and subsequently amortized over the term of the arrangements.
In July 2014, the Company adopted ASU 2013-11 "Income Taxes." The amendment provided further guidance to the balance sheet presentation of unrecognized tax benefits when an net operating loss or similar tax loss carryforward or a tax credit carryforward exists.
ACQUISITIONS AND DIVESTITURES
In 2015, the Company consummated acquisitions totaling $16.6 million, including the
acquisition of a real-time monitoring water purity technology for an estimated aggregate purchase price of
$14.7 million that will be integrated into the Company's process analytics product offering.
may be required to pay additional cash consideration related to an earn-out period.
Goodwill recorded in
segment.
The Company also recorded $6.8 million of identified intangibles primarily pertaining to
In June 2013, the Company entered into a forward-starting interest rate swap agreement, designated as a cash flow hedge.
The agreement changes the floating rate LIBOR-based interest payments associated with $50 million in forecasted borrowings under the Company's credit agreement to a fixed obligation of 2.52% beginning in October 2015 and matures in October 2020.
| Balance at beginning of year | $ | 444,085 | | | $ | 455,842 | |
An excerpt. Shown here: 40 of 401 rewritten, 40 of 237 added and 40 of 155 removed. The counts are complete. For every sentence, read Item 15. Exhibits and Financial Statement Schedules in the FY2016 filing and the FY2015 filing.