 filings.tools
Mettler-Toledo 10-K 2018-12-31
Filed 2019-02-08. 21 sections, 343K characters. Original on sec.gov · Markdown · JSON
Cover and table of contents
10-K 1 mtd_10kx12312018.htm FORM 10-K 2018 ANNUAL REPORT
UNITED STATES SECURITIES AND EXCHANGE COMMISSION
Washington, D.C. 20549
Form 10-K
| (Mark One) | ||
| þ | ANNUAL REPORT PURSUANT TO SECTION 13 OR 15(d) OF THE SECURITIES EXCHANGE ACT OF 1934 | |
| For the fiscal year ended December 31, 2018 | ||
| OR | ||
| o | TRANSITION REPORT PURSUANT TO SECTION 13 OR 15(d) OF THE SECURITIES EXCHANGE ACT OF 1934 | |
| For the transition period from to |
Commission file number 001-13595
Mettler-Toledo International Inc.
(Exact name of registrant as specified in its charter)
| Delaware | 13-3668641 |
| (State or other jurisdiction of incorporation or organization) | (I.R.S. Employer Identification No.) |
1900 Polaris Parkway
Columbus, OH 43240
and
Im Langacher 44
CH 8606 Greifensee, Switzerland
(Address of principal executive offices) (Zip Code)
1-614-438-4511 and +41-44-944-22-11
(Registrant’s telephone number, including area code)
Securities registered pursuant to Section 12(b) of the Act:
| Title of Each Class | Name of Each Exchange on Which Registered | |
| Common Stock, $0.01 par value | New York Stock Exchange |
Securities registered pursuant to Section 12(g) of the Act: NONE
Indicate by check mark if the registrant is a well-known seasoned issuer, as defined in Rule 405 of the Securities Act. Yes þ No o
Indicate by check mark if the registrant is not required to file reports pursuant to Section 13 or Section 15(d) of the Act. Yes o No þ
Indicate by check mark whether the registrant (1) has filed all reports required to be filed by Section 13 or 15(d) of the Securities Exchange Act of 1934 during the preceding 12 months (or for such shorter period that the registrant was required to file such reports), and (2) has been subject to such filing requirements for the past 90 days. Yes þ No o
Indicate by check mark whether the registrant has submitted electronically every Interactive Data File required to be submitted pursuant to Rule 405 of Regulation S-T (§ 232.405 of this chapter) during the preceding 12 months (or for such shorter period that the registrant was required to submit such files). Yes þ No o
Indicate by check mark if disclosure of delinquent filers pursuant to Item 405 of Regulation S-K (§ 229.405 of this chapter) is not contained herein, and will not be contained, to the best of registrant’s knowledge, in definitive proxy or information statements incorporated by reference in Part III of this Form 10-K or any amendment to this Form 10-K. Yes o No þ
Indicate by check mark whether the registrant is a large accelerated filer, an accelerated filer, a non-accelerated filer, a smaller reporting company, or an emerging growth company. See the definitions of “large accelerated filer”, “accelerated filer”, “smaller reporting company” and "emerging growth company" in Rule 12b-2 of the Exchange Act. (Check one):
| Large accelerated filer þ | Accelerated filer o | Non-accelerated filer o | Smaller reporting company o | Emerging growth company o |
If an emerging growth company, indicate by check mark if the registrant has elected not to use the extended transition period for complying with any new or revised financial accounting standards provided pursuant to Section 13(a) of the Exchange Act. o
Indicate by check mark whether the registrant is a shell company (as defined in Rule 12b-2 of the Act). Yes o No þ
As of February 1, 2019 there were 24,795,237 shares of the registrant’s Common Stock, $0.01 par value per share, outstanding. The aggregate market value of the shares of Common Stock held by non-affiliates of the registrant on June 30, 2018 (based on the closing price for the Common Stock on the New York Stock Exchange as of the last business day of the registrant’s most recently completed second fiscal quarter, June 30, 2018) was approximately $14.6 billion. For purposes of this computation, shares held by affiliates and by directors of the registrant have been excluded. Such exclusion of shares held by directors is not intended, nor shall it be deemed, to be an admission that such persons are affiliates of the registrant.
Documents Incorporated by Reference
| Document | Part of Form 10-K Into Which Incorporated | |
| Certain Sections of the Proxy Statement for 2019 | Part III | |
| Annual Meeting of Shareholders |
METTLER-TOLEDO INTERNATIONAL INC.
ANNUAL REPORT ON FORM 10-K
FOR THE FISCAL YEAR ENDED DECEMBER 31, 2018
FORWARD-LOOKING STATEMENTS DISCLAIMER
You should not rely on forward-looking statements to predict our actual results. Our actual results or performance may be materially different than reflected in forward-looking statements because of various risks and uncertainties. You can identify forward-looking statements by terminology such as “may,” “will,” “could,” “would,” “should,” “expect,” “plan,” “anticipate,” “intend,” “believe,” “estimate,” “predict,” “potential,” or “continue.”
We make forward-looking statements about future events or our future financial performance, including earnings and sales growth, earnings per share, strategic plans and contingency plans, growth opportunities or economic downturns, our ability to respond to changes in market conditions, planned research and development efforts and product introductions, adequacy of facilities, access to and the costs of raw materials, shipping and supplier costs, gross margins, customer demand, our competitive position, pricing, capital expenditures, cash flow, tax-related matters, the impact of foreign currencies, compliance with laws, and effects of acquisitions.
Our forward-looking statements may not be accurate or complete, and we do not intend to update or revise them in light of actual results. New risks also periodically arise. Please consider the risks and factors that could cause our results to differ materially from what is described in our forward-looking statements. See in particular “Factors Affecting Our Future Operating Results” and “Management’s Discussion and Analysis of Financial Condition and Results of Operations.”
PART I
Item 1. Business
We are a leading global supplier of precision instruments and services. We have strong leadership positions in all of our businesses and believe we hold global number-one market positions in most of them. We are recognized as an innovation leader and our solutions are critical in key research and development, quality control, and manufacturing processes for customers in a wide range of industries including life sciences, food, and chemicals. Our sales and service network is one of the most extensive in the industry. Our products are sold in more than 140 countries and we have a direct presence in approximately 40 countries. With proven growth strategies and a focus on execution, we have achieved a long term track record of strong financial performance.
Our business is geographically diversified, with net sales in 2018 derived 31% from Europe, 38% from North and South America, and 31% from Asia and other countries. Our customer base is also diversified by industry and by individual customer.
Mettler-Toledo International Inc. was incorporated as a Delaware corporation in 1991 and became a publicly traded company with its initial public offering in 1997.
Business Segments
We have five reportable segments: U.S. Operations, Swiss Operations, Western European Operations, Chinese Operations, and Other. See Note 17 to the audited consolidated financial statements and Item 7. Management’s Discussion and Analysis of Financial Condition and Results of Operations under “Results of Operations by Reportable Segment” for detailed results by segment and geographic region.
We manufacture a wide variety of precision instruments and provide value-added services to our customers. Our principal products and services are described below. We also describe our customers and distribution, sales and service, research and development, manufacturing, and certain other matters. These descriptions apply to substantially all of our products and related reportable segments.
Laboratory Instruments
We make a wide variety of precision laboratory instruments for sample preparation, synthesis, analytical bench top, and material characterization. Our portfolio includes laboratory balances, liquid pipetting solutions, automated laboratory reactors including real-time analytics, titrators, pH meters and sensors, physical value analyzers (including density and refractometry instruments), thermal analysis systems, and other analytical instruments, such as UV/VIS spectrophotometers, and moisture analyzers. Our laboratory instruments have leading-edge embedded software and we also offer LabX, our PC-based laboratory software platform, to manage and analyze data generated from our instruments. The laboratory instruments and related service business accounted for approximately 51% of our net sales in 2018, 50% in 2017, and 49% in 2016.
Laboratory Balances
Our laboratory balances have weighing ranges from one ten-millionth of a gram up to 64 kilograms. To respond to a wide range of customer needs and value/price points, we market our balances in a range of product tiers offering different levels of functionality. We also provide filter weighing and powder and liquid dosing automated systems. Based on the same weighing technology platform, we manufacture mass comparators, which are used by weights and measures officials as well as National Measurement Institute laboratories to ensure the accuracy of reference weights. Laboratory balances are primarily used in the pharmaceutical, biotechnology, testing labs, food, chemical, cosmetics, academia, and other industries.
Pipettes
Pipettes are used in life science research laboratories for dispensing small volumes of liquids. We operate our pipette business with the Rainin and Biotix brand names. We develop, manufacture, and distribute advanced pipettes, including single- and multi-channel manual and electronic pipettes. We also develop and produce high-value consumables such as pipette tips and tubes. We maintain service centers in the key markets where customers periodically send their pipettes for certified recalibrations. These service centers, combined with our advanced asset management solutions, provide our customers with innovative solutions to maintain their instruments and meet regulatory compliance. Our principal end markets are pharmaceutical, biotech, and academia.
Analytical Instruments
Titrators measure the chemical composition of samples and are used in environmental and research laboratories as well as in quality control labs in the pharmaceutical, testing labs, food and beverage, and other industries. Our high-end titrators are multi-tasking models, which can perform two determinations simultaneously on multiple vessels. Our offering includes robotics to automate routine work in quality control applications.
Thermal analysis systems measure material properties as a function of temperature, such as weight, dimension, energy flow, and viscoelastic properties. Thermal analysis systems are used in nearly every industry, but primarily in the plastics and polymer industries, academia, and increasingly in the pharmaceutical industry.
pH meters measure acidity in laboratory samples. We also sell density and refractometry instruments, which measure chemical concentrations in solutions. In addition, we manufacture and sell moisture analyzers, which precisely determine the moisture content of a sample by utilizing the loss on drying method, and UV/VIS spectrophotometers that optimize spectroscopic workflows.
Laboratory Software
LabX, our PC-based laboratory software platform, manages and analyzes data generated by our balances, titrators, pH meters, physical value analyzers, and other analytical instruments like UV/VIS spectrophotometers. LabX provides full network capability; assists with workflow automation; has efficient, intuitive protocols; and enables customers to collect and archive data in compliance with the U.S. Food and Drug Administration’s traceability and data integrity requirements for electronically stored data (also known as 21 CFR Part 11).
Automated Chemistry Solutions
Our automated chemistry solutions focus on selected applications in the chemical and drug discovery process. Our automated lab reactors and in situ analysis systems are considered integral to the process development and scale-up activities of our customers. Our on-line measurement technologies, based on infrared and laser light scattering, enable customers to monitor chemical reactions and crystallization processes in real time in the lab and plant. In situ samples allow overnight sampling and testing. Additionally, we provide industry-leading embedded software solutions that enable our customers to manage, optimize, and improve experiments as well as production scale-up. We believe that our portfolio of integrated technologies can bring significant efficiencies to the development process, enabling our customers to bring new chemicals and drugs to market faster.
Process Analytics
Our process analytics business provides instruments for the in-line measurement of liquid and gas parameters used primarily in the production process of pharmaceutical, biotech, beverage, microelectronics, chemical, and refining companies, as well as power plants. Close to half of our process
analytics sales are to the pharmaceutical and biotech markets, where our customers need fast and secure scale-up and production that meet the validation processes required for GMP (Good Manufacturing Processes) and other regulatory standards like the USP (US Pharmacopoeia) regulations for ultrapure water quality. We are a leading solution provider for liquid analytical measurement to control and optimize production processes. Our solutions include sensor and analyzer technology for measuring pH, dissolved oxygen, carbon dioxide, conductivity, turbidity, ozone, total organic carbons, bioburden, sodium, and silica, as well as laser analyzers for gas measurement. Intelligent sensor diagnostics capabilities enable improved asset management solutions for our customers to reduce process downtime and maintenance costs. Our instruments offer leading multi-parameter capabilities and plant-wide control system integration, which are key for integrated measurement of multiple parameters to secure production quality and efficiency. With a worldwide network of specialists, we support customers in critical process applications, compliance, and systems integration questions.
Industrial Instruments
We manufacture numerous industrial weighing instruments and related terminals and offer dedicated software solutions for the pharmaceutical, chemical, food, discrete manufacturing, and other industries. In addition, we manufacture metal detection, x-ray, and other end-of-line product inspection systems used in production and packaging. We supply automatic identification and data capture solutions, which integrate in-motion weighing, dimensioning, and identification technologies for transport, shipping, and logistics customers. We also offer heavy industrial scales and related software. The industrial instruments and related service business accounted for approximately 41% of our net sales in 2018 and 42% in 2017 and 2016.
Industrial Weighing Instruments
We offer a comprehensive line of industrial scales and weighing devices, such as bench scales, floor scales, and weigh modules for weighing loads from a few grams to several thousand kilograms in applications ranging from measuring materials in chemical production to quality completeness control in discrete manufacturing to weighing packages at the end of the line. Our products are used in a wide range of industrial applications, such as counting, formulating and mixing ingredients, and quality control.
Industrial Terminals
Our industrial scale terminals collect data and integrate it into manufacturing processes, helping to automate them. Our terminals allow users to remotely download formulation recipes or access setup data and can minimize downtime through predictive rather than reactive maintenance.
Transportation and Logistics
We supply automatic dimensional measurement and data capture solutions, which integrate in-motion weighing, dimensioning, and identification technologies. With these solutions, customers can measure the weight and cubic volume of packages for appropriate billing, load management, and quality control. Our solutions also integrate into customers’ information systems.
Vehicle Scale Systems
Our primary heavy industrial products are scales for weighing trucks or railcars (i.e., weighing bulk goods as they enter or leave a factory or at a toll station). Heavy industrial scales are capable of measuring weights up to 500 tons and permit accurate weighing under extreme environmental conditions. We also offer advanced computer software that can be used with our heavy industrial scales to facilitate a broad range of customer solutions and provides a complete system for managing vehicle transaction processing.
Industrial Software
We offer software that can be used with our industrial instruments. Examples include FreeWeigh.Net, statistical quality control software; FormWeigh.Net, our formulation/batching software; and DataBridge, which supports the operation of vehicle scales. FreeWeigh.Net and FormWeigh.Net provide full network capability and enable customers to collect and archive data in compliance with U.S. Food and Drug Administration's requirements, 21 CFR Part 11.
Product Inspection
Increasing safety and consumer protection requirements are driving the need for more sophisticated end-of-line product inspection systems (e.g., for use in food processing and packaging, pharmaceutical, packaged consumer goods, and other industries). We are a leading global provider of metal detectors, x-ray and camera-based imaging equipment, checkweighers, and track-and-trace solutions that are used in these industries. Metal detectors are most commonly used to detect fine particles of metal that may be contained in raw materials or may be generated by the manufacturing process itself. X-ray inspection is used to detect metallic contamination in applications unsuited to metal detectors and many types of non-metallic contamination, such as glass, calcified bone, stones, and pits. Our x-ray systems are also used for mass control and for determining and controlling the fat content in meat. Our camera-based vision inspection solutions provide in-line inspection of package quality, labels, and content, which are needs for food and beverage, consumer goods, and pharmaceutical companies. Vision inspection systems with associated specialist software enable our pharmaceutical customers to implement traceability and serialization tracking, as required by regulation. Checkweighers are used to control the filled weight of packaged goods such as food, pharmaceuticals, and cosmetics. All of our technologies are integrated with material handling systems to ensure the correct presentation of the customer’s product to the device and the secure rejection of non-conforming product, and are frequently designed to comply with stringent hygiene standards. Our technologies may also be used together as components of integrated packaging lines. ProdX Inspect is our quality and productivity control software for helping customers comply with regulations and optimize process efficiency, either as a stand-alone solution or through integration with the customer’s manufacturing and enterprise systems.
Retail Weighing Solutions
Supermarkets, hypermarkets, and other food retail businesses make use of multiple weighing and food labeling solutions for handling fresh goods (such as meats, vegetables, fruits, or cheeses). We offer networked scales and software, which can integrate backroom, counter, self-service, and checkout functions and can incorporate fresh goods item data into a supermarket’s overall food item and inventory management system. The scale screen display allows for in-store marketing and can help encourage consumers in the store to make more purchase decisions at the point of sale. In addition, we offer stand-alone scales for basic counter weighing and pricing, price finding, and printing. The customer benefits of our retail solutions are in the areas of enterprise-wide article and price management, merchandising, and regulatory compliance. In North America and select other markets, our offering also includes automated packaging and labeling solutions for the meat backroom, which are fully integrated with the scales in the store. The retail business accounted for approximately 8% of our net sales in 2018, 8% in 2017, and 9% in 2016.
Customers and Distribution
Our principal customers include companies in the following key end markets: the life science industry (pharmaceutical and biotech companies, as well as independent research organizations); food and beverage producers; chemical, specialty chemicals, and cosmetics companies; food retailers; the
transportation and logistics industry; the metals industry; the electronics industry; and the academic community.
Our products are sold through a variety of distribution channels. Generally, more technically sophisticated products are sold through our direct sales force, while less complicated products are sold through indirect channels. Our sales through direct channels exceed our sales through indirect channels. A significant portion of our sales in the Americas is generated through indirect channels, including sales of our Ohaus-branded products. Ohaus-branded products target markets, such as the educational market, in which customers are interested in lower cost, a more limited set of features, and less comprehensive support and service.
We have a diversified customer base, with no single end-customer accounting for more than 1% of 2018 net sales.
Sales and Service
Market Organizations
We maintain geographically focused market organizations around the world that are responsible for all aspects of our sales and service. The market organizations are customer-focused, with an emphasis on building and maintaining value-added relationships with customers in our target market segments. Each market organization has the ability to leverage best practices from other units while maintaining the flexibility to adapt its marketing and service efforts to account for different cultural and economic conditions. Market organizations also work closely with our producing organizations (described below) by providing feedback on manufacturing and product development initiatives, new product and application ideas, and information about key market segments.
We have one of the largest and broadest global sales and service organizations among precision instrument manufacturers we compete against. At December 31, 2018, our sales and service group consisted of approximately 7,900 employees in sales, marketing and customer service (including related administration), and post-sales technical service, located in approximately 40 countries. This field organization has the capability to provide service and support to our customers and distributors in major markets across the globe. This is important because our customers increasingly seek to do business with a consistent global approach.
Service
Our service business continues to be successful with a focus on providing uptime and calibration services, as well as further expansion of our offerings to provide value-added services for a range of market needs, including regulatory compliance, performance enhancements, application expertise and training, and remote services. We have a unique offering to our pharmaceutical customers in promoting the use of our instruments in compliance with FDA and other international regulations, and we can provide these services to most customers' locations around the world. Our global service network is also an important factor in our ability to expand in emerging markets. We estimate that we have the largest installed base of weighing instruments in the world. Service (representing service contracts, on demand services, and replacement parts) accounted for approximately 22% of our net sales in 2018, 2017, and 2016.
Beyond revenue opportunities, we believe service is a key part of our solution offering and helps significantly in customer retention. The close relationships and frequent contact with our large customer base allow us to be the trusted advisor of our customers, which provides us with high-quality sales opportunities as well as innovative product and application ideas.
Research and Development and Manufacturing
Producing Organizations
Our research, product development, and manufacturing efforts are organized into a number of producing organizations. Our focused producing organizations help reduce product development time and costs, improve customer focus, and maintain technological leadership. The producing organizations work together to share ideas and best practices, and there is a close interface and coordinated customer interaction among marketing organizations and producing organizations.
Research and Development
We continue to invest in product innovation to provide technologically advanced products to our customers for existing and new applications. Over the last three years, we have invested $389 million in research and development ($141.1 million in 2018, $128.3 million in 2017, and $119.2 million in 2016), which is approximately 5% of net sales for each year. Our research and development efforts fall into two categories:
| • | technology advancements, which generate new products or features and increase the value of our products. These advancements may be in the form of enhanced or new functionality, new applications for our technologies, more accurate or reliable measurement, additional software capability, or automation through robotics or other means. |
| • | cost reductions, which reduce the manufacturing cost of our products through better overall design and/or improve the ease of serviceability. |
We devote a substantial proportion of our research and development budget to software development. This includes software to process the signals captured by the sensors of our instruments, application-specific software, and software that connects our solutions into customers’ existing IT systems. We closely integrate research and development with marketing, manufacturing, and product engineering. We have approximately 1,300 employees in research and development and product engineering in countries around the globe.
Manufacturing
We are a worldwide manufacturer, with facilities principally located in China, Switzerland, the United States, Germany, the United Kingdom, and Mexico. We emphasize product quality in our manufacturing operations, and most of our products require very strict tolerances and exact specifications. We use an extensive quality control system that is integrated into each step of the manufacturing process. All major manufacturing facilities have achieved ISO 9001 certification. We believe that our manufacturing capacity is sufficient to meet our present and currently anticipated demand. We expect to make net investments in a new manufacturing facility of approximately $15 million over the next two years.
We generally manufacture critical components, which are components that contain proprietary technology. When outside manufacturing is more efficient, we contract with other manufacturers for certain nonproprietary components. We use a wide range of suppliers. We believe our supply arrangements are adequate and that there are no material constraints on the sources and availability of materials. From time to time, we may rely on a single supplier for all of our requirements of a particular component. Supply arrangements for electronic components are generally made globally.
Backlog; Seasonality
Our manufacturing turnaround time is generally short, which permits us to manufacture orders to fill for most of our products. Backlog is generally a function of requested customer delivery dates and is typically no longer than one to two months.
Our business has historically experienced a slight amount of seasonal variation, particularly the high-end laboratory instruments business. Traditionally, sales in the first quarter are slightly lower than, and sales in the fourth quarter are slightly higher than, sales in the second and third quarters. Fourth quarter sales have historically generated approximately 28% to 30% of our net sales. This trend has a somewhat greater effect on income from operations than on net sales because fixed costs are generally incurred evenly across all quarters.
Employees
Our total global workforce was 16,000, including 14,200 employees and 1,800 temporary personnel, as of December 31, 2018, and includes approximately 6,000 in Europe, 4,700 in North and South America, and 5,300 in Asia and other countries.
We believe our employee relations are good, and we have not suffered any material employee work stoppage or strike during the last five years. Labor unions do not represent a substantial number of our employees. Approximately 600 employees in Germany and France are represented by unions.
Sustainability
Sustainability touches all aspects of our business, from designing and producing our products, to selling and delivering them to our customers, to handling them at the end of their lifecycle. Sustainability helps guide us to make the right decisions for our customers, employees, suppliers, shareholders, and the communities in which we operate our business. We want to manage our business sustainably to position the Company for long-term growth. Our GreenMT program is designed to help save energy and resources. We do this in four key areas: (1) developing products using our Design for Environment criteria that allow us and our customers to reduce energy usage, material, and product waste, (2) implementing energy efficiency projects to reduce energy usage at our sites, (3) managing our sales and service fleets to reduce our fuel consumption, and (4) reducing the environmental impact of our resource consumption, especially in processes related to cooling and packaging. Our goal is to reduce our carbon footprint by the end of 2025 by 30% (relative CO2 emissions per net sales compared with 2010) and at the same time realize financial benefits.
Blue Ocean Program
“Blue Ocean” refers to our program to establish a global operating model with standardized, automated, and integrated processes and high levels of global data transparency. It encompasses an enterprise architecture, with a global, single-instance ERP system. Within our IT systems, we are moving toward integrated, homogeneous applications and common data structures. We will also largely standardize our key business processes. The implementation of the systems and processes has been proceeding on a staggered basis over a multi-year period with the initial go-live rollout having occurred in 2010. We have implemented the Blue Ocean program in our Swiss, Chinese, U.K., Benelux, German, and certain U.S. and Southeast Asia operations. We estimate that we have more than 80% of the program completed as measured in users. We will continue to implement the program in additional locations over the coming years.
Intellectual Property
We hold over 5,000 patents and trademarks (including pending applications), primarily in the United States, Switzerland, the European Union, Germany, the United Kingdom, Italy, France, Japan, China, South Korea, Brazil, and India. Our products generally incorporate a wide variety of technological innovations, some of which are protected by patents of various durations. Products are generally not protected as a whole by individual patents, and as a result, no one patent or group of related patents is material to our business. We have numerous trademarks, including the Mettler-Toledo name and logo, which are material to our business. We regularly protect against infringement of our intellectual property.
Regulation
Our products are subject to various regulatory standards and approvals by weights and measures regulatory authorities. All of our electrical components are subject to electrical safety standards. We believe that we are in compliance in all material respects with applicable regulations.
Approvals are required to ensure our instruments do not impermissibly influence other instruments and are themselves not affected by other instruments. In addition, some of our products are used in “legal for trade” applications, in which prices based on weight are calculated and for which specific weights and measures approvals are required. Although there are a large number of regulatory agencies across our markets, there is an increasing trend toward harmonization of standards, and weights and measures regulation is harmonized across the European Union.
Our products may also be subject to special requirements depending on the end-user and market. For example, laboratory customers are typically subject to Good Laboratory Practices (GLP), industrial customers to Good Manufacturing Practices (GMP), pharmaceutical customers to U.S. Food and Drug Administration (FDA) regulations, and customers in food processing industries may be subject to Hazard Analysis and Critical Control Point (HACCP) regulations. Products used in hazardous environments may also be subject to special requirements.
Environmental Matters
We are subject to environmental laws and regulations in the jurisdictions in which we operate. We own or lease a number of properties and manufacturing facilities around the world. Like many of our competitors, we have incurred, and will continue to incur, capital and operating expenditures and other costs in complying with such laws and regulations.
We are currently involved in, or have potential liability with respect to, the remediation of past contamination in certain of our facilities. A former subsidiary of Mettler-Toledo, LLC known as Hi-Speed Checkweigher Co., Inc. was one of two private parties ordered by the New Jersey Department of Environmental Protection, in an administrative consent order signed on June 13, 1988, to investigate and remediate certain ground water contamination at a property in Landing, New Jersey. After the other party under this order failed to fulfill its obligations, Hi-Speed became solely responsible for compliance with the order. Residual ground water contamination at this site is now within a Classification Exception Area which the Department of Environmental Protection has approved and within which the Company oversees monitoring of the decay of contaminants of concern. A concurrent Well Restriction Area also exists for the site. The Department of Environmental Protection does not view these vehicles as remedial measures, but rather as “institutional controls” that must be adequately maintained and periodically evaluated. We estimate that the costs of compliance associated with the site over the next several years will approximate a total of $0.4 million.
In addition, certain of our present and former facilities have or had been in operation for many decades and, over such time, some of these facilities may have used substances or generated and disposed of wastes that are or may be considered hazardous. It is possible that these sites, as well as disposal sites owned by third parties to which we have sent wastes, may in the future be identified and become the subject of remediation. Although we believe that we are in substantial compliance with applicable environmental requirements and, to date, we have not incurred material expenditures in connection with environmental matters, it is possible that we could become subject to additional environmental liabilities in the future that could have a material adverse effect on our financial condition, results of operations, or cash flows.
Competition
Our markets are highly competitive. Many of the markets in which we compete are fragmented both geographically and by application, particularly the industrial and food retailing markets. As a result, we face numerous regional or specialized competitors, many of which are well established in their markets. For example, some of our competitors are divisions of larger companies with potentially greater financial and other resources than our own. In addition, some of our competitors are domiciled in emerging markets and may have a lower cost structure than ours. We are confronted with new competitors in emerging markets which, although relatively small in size today, could become larger companies in their home markets. Given the sometimes significant growth rates of these emerging markets, and in light of their cost advantage over developed markets, emerging market competitors could become more significant global competitors. Taken together, the competitive forces present in our markets can impair our operating margins in certain product lines and geographic markets.
We expect our competitors to continue to improve the design and performance of their products and to introduce new products with competitive prices. Although we believe that we have technological and other competitive advantages over many of our competitors, we may not be able to realize and maintain these advantages. These advantages include our worldwide market leadership positions; our global brand and reputation; our track record of technological innovation; our comprehensive, high-quality solution offering; our global sales and service offering; our large installed base of weighing instruments; and the diversification of our revenue base by geographic region, product range, and customer. To remain competitive, we must continue to invest in research and development, sales and marketing, and customer service and support. We cannot be sure that we will have sufficient resources to continue to make these investments or that we will be successful in identifying, developing, and maintaining any competitive advantages.
We believe the principal competitive factors in developed markets for purchasing decisions are the product itself, application support, service support, and price. In emerging markets, where there is greater demand for less sophisticated products, price is a more important factor than in developed markets. Competition in the U.S. laboratory market is also influenced by the presence of large distributors that sell not only our products but those of our competitors as well.
Company Website and Information
You can find our website on the Internet at www.mt.com. The website contains information about us and our operations. The information contained on our website is not included in, or incorporated by reference into, this annual report on Form 10-K. You can view and download free of charge copies of each of our filings with the SEC on Form 10-K, Form 10-Q, Form 8-K, and Schedule 14A and all amendments to those reports by accessing www.mt.com, clicking on About Us, Investor Relations, and then clicking on SEC Filings. The SEC maintains a website at http://www.sec.gov that contains reports, proxy and information statements, and other information regarding issuers that file electronically with the SEC.
Our website also contains copies of the following documents that you can download free of charge:
| • | Corporate Governance Guidelines |
| • | Audit Committee Charter |
| • | Compensation Committee Charter |
| • | Nominating and Corporate Governance Committee Charter |
| • | Code of Conduct |
| • | Equal Employment Opportunity Policy |
| • | Business Partner Code of Conduct |
| • | Ethical, Social, and Quality Standards |
| • | Sustainability Report |
| • | Environmental Policy |
| • | Political Participation Policy |
| • | Conflict Mineral Report |
| • | Statement on Slavery, Human Trafficking, and Transparency in the Supply Chain |
You can also obtain in print, free of charge, any of the above documents and any of our reports on Form 10-K, Form 10-Q, Form 8-K, and Schedule 14A and all amendments to those reports by sending a written request to our Investor Relations Department:
Investor Relations
Mettler-Toledo International Inc.
1900 Polaris Parkway
Columbus, OH 43240 U.S.A.
Phone: +1 614 438 4748
E-mail: mary.finnegan@mt.com
Item 1A. Risk Factors
Factors Affecting Our Future Operating Results
We are subject to certain risks associated with our international operations and have a significant concentration of business in China.
We conduct business in many countries, including emerging markets in Asia, Latin America, and Eastern Europe, and these operations represent a significant portion of our sales and earnings. For example, our Chinese operations accounted for 18% of sales to external customers, approximately 30% of our global production, and 37% of total segment profit during 2018. In addition to the currency risks discussed below, international operations pose other substantial risks and problems for us, including the following:
| • | local tariffs and trade barriers; |
| • | countries may revise or alter their respective legal and regulatory requirements; |
| • | difficulties in staffing and managing local operations and/or mandatory salary increases; |
| • | credit risks arising from financial difficulties facing local customers and distributors; |
| • | difficulties in protecting intellectual property; |
| • | nationalization of private enterprises which may result in the confiscation of assets, as we hold significant assets around the world in the form of property, plant, and equipment, inventory, and accounts receivable, as well as $145 million of cash at December 31, 2018 in our Chinese subsidiaries; |
| • | restrictions on investments and/or limitations regarding foreign ownership; |
| • | adverse tax consequences, including tax disputes, imposition or increase of withholding and other taxes on remittances and other payments by subsidiaries; |
| • | other uncertain local economic, political, and social conditions, including hyper-inflationary conditions or periods of low or no productivity growth; and |
| • | credit tightening or reduction in credit availability for local customers. |
We must also comply with regulations regarding the conversion and repatriation of funds earned in local currencies. For example, we need government approval to convert earnings from our operations in China into other currencies and to repatriate these funds. If we cannot comply with these or other applicable regulations, we may face increased difficulties in using cash generated in China.
We are required to comply with various import, export control, and economic sanctions laws, which may affect our transactions with certain customers, business partners, and other persons, including in certain cases dealings with or between our employees and subsidiaries. In certain circumstances, export control and economic sanctions regulations may prohibit the export of certain products, services, and technologies, and in other circumstances, we may be required to obtain an export license before exporting a controlled item. We follow all relevant laws and continue to do business in Russia. Sanctions imposed on business in Russia may affect the economy and our business in Russia. In addition, failure to comply with any of these regulations could result in civil and criminal, monetary and non-monetary penalties, disruptions to our business, limitations on our ability to import and export products and services, and damage to our reputation.
Growth in emerging markets, especially China, can be volatile and change quickly. While we experienced strong growth in China in 2018, we have also experienced sales declines in recent years and we may see volatility in the future. There is also currently economic uncertainty, including the potential impact of international trade/tariff disputes.
We sell primarily to companies in developed countries. An economic downturn in these countries could hurt our operating results.
Most of our business is derived from companies in developed countries. Economic uncertainty in many parts of the world, including international trade disputes and sovereign debt levels in the European Union and the United States, are situations that we are monitoring closely. If developed countries were to experience slow growth or recession, we could see the following effects:
| • | a drop in demand for our products; |
| • | companies being unable to finance their businesses; |
| • | difficulty in obtaining materials and supplies; |
| • | potential devaluation and/or impairment of assets; |
| • | difficulty in collecting accounts receivables; |
| • | an increase in accounts receivable write-offs; and |
| • | greater foreign exchange rate volatility affecting our profitability and cash flow. |
Economic downturns or recessions adversely affect our operating results because our customers often decrease or delay capital expenditures. Customers may also purchase lower-cost products made by competitors and not resume purchasing our products even after economic conditions improve. These conditions would reduce our revenues and profitability.
In addition, a potential financial crisis on financial institutions globally would likely have an adverse effect on the global capital markets and our business.
Currency fluctuations affect our operating profits.
Our earnings are affected by changing exchange rates. We are most sensitive to changes in the exchange rates between the Swiss franc, euro, and U.S. dollar. We have more Swiss franc expenses than we do Swiss franc sales because we develop and manufacture products in Switzerland that we sell globally and have a number of corporate functions located in Switzerland. When the Swiss franc strengthens against our other trading currencies, particularly the U.S. dollar and euro, our earnings go down. We also have significantly more sales in the euro than we do expenses. When the euro weakens against the U.S. dollar and Swiss franc, our earnings also go down. We estimate a 1% strengthening of the Swiss franc against the euro would reduce our earnings before tax by approximately $1.6 million to $1.8 million annually.
We also conduct business throughout the world, including Asia Pacific, the United Kingdom, Eastern Europe, Latin America, and Canada. Fluctuations in these currency exchange rates against the U.S. dollar can also affect our operating results. The most significant of these currency exposures is the Chinese renminbi. The impact on our earnings before tax of the Chinese renminbi weakening 1% against the U.S. dollar is a reduction of approximately $1.5 million to $1.7 million annually.
In addition to the effects of exchange rate movements on operating profits, our debt levels can fluctuate due to changes in exchange rates, particularly between the U.S. dollar, the Swiss franc, and euro. Based on our outstanding debt at December 31, 2018, we estimate that a 10% weakening of the U.S. dollar against the currencies in which our debt is denominated would result in an increase of approximately $30.1 million in the reported U.S. dollar value of our debt.
Concerns regarding the Eurozone debt levels and market perception related to the instability of the euro could affect our operating profits.
We conduct business in many countries that use the euro as their currency (the Eurozone). Concerns persist regarding the debt burden of certain Eurozone countries and their ability to meet future financial obligations. In addition, concerns in recent years have existed regarding the overall stability of the euro and the suitability of the euro as a single currency given the diverse economic and political circumstances in individual Eurozone countries.
These concerns could lead to the re-introduction of individual currencies in one or more Eurozone countries or, in more extreme circumstances, the possible dissolution of the euro currency entirely. Should the euro dissolve entirely, the legal and contractual consequences for holders of euro-denominated obligations would be determined by laws in effect at such time. These potential developments, or market perceptions concerning these and related issues, could adversely affect the value of our euro-denominated assets and obligations. In addition, concerns over the effect of this financial crisis on financial institutions in Europe and globally could have an adverse effect on the global capital markets and, more specifically, on the ability of our Company, our customers, suppliers, and lenders to finance their respective businesses, to access liquidity at acceptable financing costs, if at all, on the availability of supplies and materials, and on the demand for our products.
We are vulnerable to system failures and data loss risks, which could harm our business.
We rely on our technology infrastructure to interact with suppliers, sell our products and services, support our customers, fulfill orders, and bill, collect, and make payments. Our systems are vulnerable to damage or interruption from natural disasters, power loss, telecommunication failures, malicious employees or employee negligence, computer viruses, and other events. When we upgrade or change systems, we may suffer interruptions in service, loss of data, or reduced functionality. A significant number of our systems are not redundant, and our disaster recovery planning is not sufficient for every eventuality. Despite any precautions we may take, such problems could result in interruptions in our services, fraudulent or negligent loss of assets, or unauthorized disclosure of confidential information, which could harm our reputation and financial condition. Our business interruption insurance may not be sufficient to compensate us for losses that may result from interruptions in our services or data loss as a result of system failures.
Customers may use our products and/or software to generate or manage confidential information. Though we take steps to ensure our products and/or software are secure, it is possible customers could lose confidential information stored on our products. If a customer alleges system failures in our products and/or software cause or contribute to a loss, we could face harm to our reputation and financial condition and legal liability.
We also are in the process of implementing a program to globalize our business processes and information technology systems that includes the implementation of a Company-wide enterprise resource planning system. This has been proceeding on a staggered basis over several years with the initial go-live rollout having occurred in 2010. We have implemented the program in our Swiss, Chinese, U.K., Benelux, German, and certain U.S. and Southeast Asia operations. We estimate that we have more than 80% of the program implemented, as measured in users. If the implementation is flawed, we could suffer interruptions in operations and customer-facing activities that could harm our reputation and financial condition or cause us to lose data, experience reduced functionality, or have delays in reporting financial information. It may take us longer to implement the program than we have planned, and the project may cost us more than we have estimated, either of which would negatively impact our ability to generate cost savings or other efficiencies. In addition, the implementation will increase our reliance on a single
information technology system, which would have greater consequences should we experience a system disruption.
Our business and financial performance may be adversely affected by a cybersecurity attack.
As described in the above section, we rely on our technology infrastructure to interact with suppliers, sell our products and services, fulfill orders, support our customers, and bill, collect and make payments. Our system and processes may be susceptible to damage or interruption from cybersecurity incidents, such as terrorist or hacker attacks, the introduction of malicious computer viruses, ransomware, falsification of banking and other information, insider risk, or other security breaches. If there is a cybersecurity incident, we may suffer interruptions in service, loss of assets or data, or reduced functionality. Many of our systems are not redundant, and our disaster recovery planning is not sufficient for every eventuality a cybersecurity incident could cause. Security breaches of our systems which allow inappropriate access to or inadvertent transfer of information and misappropriation or unauthorized disclosure of confidential information belonging to us or to our employees, customers, or suppliers could result in our suffering significant financial and reputational damage.
Customer may use our products and/or software to generate or manage critical information. Though we take steps to ensure our products and/or software are secure, it is possible that a cyber attack could result in the loss or compromise of critical information. If a customer alleges that a cyber attack causes or contributes to a loss or compromise of critical information, we could face harm to our reputation and financial condition.
While we attempt to mitigate cybersecurity risks by employing a number of proactive measures, including employee training and awareness, technical security controls, enhanced data protection, and maintenance of backup and protective systems, our systems remain potentially vulnerable to cybersecurity threats, any of which could have a material adverse effect on our business. We believe our mitigation measures reduce, but cannot eliminate, the risk of a cybersecurity incident. Despite any precautions we may take, a cybersecurity incident could harm our reputation and financial condition and cause us to incur legal liability and increased costs to respond to such events. Our cyber liability insurance may not be sufficient to compensate us for losses that may result from interruptions in our services or asset or data loss as a result of cybersecurity incidents.
We operate in highly competitive markets, and it may be difficult for us to preserve operating margins, gain market share, and maintain a technological advantage.
Our markets are highly competitive. Many are fragmented both geographically and by application, particularly the industrial and food retailing markets. As a result, we face numerous regional or specialized competitors, many of which are well established in their markets. In addition, some of our competitors are divisions of larger companies with potentially greater financial and other resources than our own. There has also been an increase in the consolidation of precision instrument companies in recent years. Any consolidation within our market could result in competitors becoming larger and having greater financial and other resources than our own. Some of our competitors are domiciled or operate in emerging markets and may have a lower cost structure than ours. We are confronted with new competitors in emerging markets which, although relatively small in size today, could become larger companies in their home markets. Given the sometimes significant growth rates of these emerging markets, and in light of their cost advantage over developed markets, emerging market competitors could become more significant global competitors. Taken together, the competitive forces present in our markets could harm our operating margins. We expect our competitors to continue to improve the design and performance of their products and to introduce new products with competitive prices. Although we believe that our products and services have advantages over our competitors, we may not be able to realize and maintain these advantages.
Our ability to manufacture and deliver products and services may be disrupted.
We have key manufacturing facilities located in China, Europe, and the United States. Many of our products are developed and manufactured at single locations, with limited alternate facilities. In addition, a large portion of our products and spare parts are distributed through regional logistics centers, in which certain logistics activities are outsourced to third parties. If we experience any significant disruption in these facilities for any reason, such as strikes or other labor unrest, power interruptions, cyber attacks, fire, earthquakes, hurricanes, or other events beyond our control, we may be unable to satisfy customer demand for our products or services and lose sales. It may be expensive to resolve these issues, even though some of these risks are covered by insurance policies. More importantly, customers may switch to competitors and may not return to us even if we resolve the interruption.
Our business would suffer if we were unable to obtain supplies of material.
We purchase most of our raw materials, components, and supplies from multiple suppliers. Some items are purchased from a limited or single source of supply, however, and disruption of these sources could affect our ability to manufacture products. Even where multiple sources of materials and components are available, the quality of the alternative materials, regulatory and contractual requirements to qualify materials for use in manufacturing, and the time required to establish new relationships with reliable suppliers could result in manufacturing delays and possible loss of sales. If we are unable to obtain materials or components for an extended time, this could damage our customer relationships and harm our financial condition or results of operations.
Our product development efforts may not produce commercially viable products in a timely manner.
If we do not introduce new products and enhancements, our products could become technologically obsolete over time, which would harm our operating results. To remain competitive, we must continue to make significant investments in research and development, sales and marketing, and customer service and support. We cannot be sure that we will have sufficient resources to continue to make these investments. In developing new products, we may be required to make substantial investments before we can determine their commercial viability. As a result, we may not be successful in developing new products and we may never realize the benefits of our research and development activities.
A prolonged downturn or additional consolidation in the pharmaceutical, food and beverage, and chemical industries could adversely affect our operating results. A reduction in the capital resources or government funding of our customers could reduce our sales.
Our products are used extensively in the pharmaceutical, food and beverage, and chemical industries. Consolidation in these industries hurt our sales in prior years. In recent years, there has been an increase in consolidation within these industries. A prolonged economic downturn or additional consolidation in any of these industries could adversely affect our operating results. In addition, the capital spending policies of our customers in these and other industries are based on a variety of factors we cannot control, including the resources available for purchasing equipment, the spending priorities among various types of equipment, and policies regarding capital expenditures. Any decrease or delay in capital spending by our customers would cause our revenues to decline and could harm our profitability. A decline in government funding of research or education could reduce some customers' ability to purchase our products.
Unanticipated changes in our tax rates or additional income tax liabilities could impact our profitability.
We are subject to income taxes in the United States and various other jurisdictions, and our domestic and international tax liabilities are subject to allocation of expenses among different jurisdictions. Our
effective tax rates and tax obligations could be adversely affected by changes in tax laws or rates, changes in the mix of earnings by jurisdiction, changes in the valuation of deferred tax assets and liabilities, and material adjustments from tax audits.
In particular, the carrying value of deferred tax assets, which are predominantly in the U.S., is dependent upon our ability to generate future taxable income in the U.S. In addition, the amount of income taxes we pay is subject to ongoing audits in various jurisdictions, and a material assessment by a governing tax authority could affect our profitability.
Our tax expense and tax obligations could increase as a result of a changing application of tax law.
Governments are facing greater pressure on public finances, which could lead to their more aggressively applying existing tax laws and regulations. Governments also periodically change tax laws and regulations. Any changes in corporate income tax rates or regulations, on repatriation of dividends, earnings or capital, or on transfer pricing, as well as changes in the interpretation of existing tax laws and regulations in the jurisdictions in which we operate, could adversely affect our cash flow and increase our overall tax burden, which would negatively affect our profitability.
We face risks related to sales through distributors and other third parties that we do not control, which could harm our business.
We sell some products through third parties, including distributors and value-added resellers. This exposes us to various risks, including competitive pressure, concentration of sales volumes, credit risks, and compliance risks. We may rely on one or a few key distributors for a product or market, and the loss of these distributors could reduce our revenue and net earnings. Distributors may also face financial difficulties, including bankruptcy, which could harm our collection of accounts receivables. Violations of the FCPA or similar anti-bribery laws by distributors or other third-party intermediaries could materially impact our business. Risks related to our use of distributors may reduce sales, increase expenses, and weaken our competitive position.
A terrorism attack, other geopolitical crisis, or widespread outbreak of an illness or other health issue could negatively affect our business, making it more difficult and expensive to meet our obligations to our customers, and could result in reduced demand from our customers.
Our global operations are susceptible to global events, including acts or threats of war or terrorism, international conflicts, political instability, and natural disasters. Also, in past years a number of countries have experienced outbreaks of the H1N1 influenza (swine flu) or, in the Asia Pacific region, outbreaks of SARS and/or avian influenza (bird flu), and more recently, Ebola outbreaks in parts of Africa. Despite the implementation of certain precautions, we are susceptible to such outbreaks. As a result of such events, businesses can be shut down and individuals can become ill, quarantined, or otherwise unable to work. These events, particularly in North America, Europe, China, or other locations significant to our operations, could adversely affect general commercial activity, which could have a material adverse effect on our financial condition, results of operations, business, or prospects. If our operations are curtailed, we may need to seek alternate sources of supply for services and staff and these alternate sources may be more expensive. Alternate sources may not be available or may result in delays in shipments to our customers, each of which would affect our results of operations. In addition, a curtailment of our product design operations could result in delays in the development of new products. Further, if our customers’ businesses are similarly affected, they might delay or reduce purchases from us, which could adversely affect our results of operations.
If we cannot protect our intellectual property rights, or if we infringe or misappropriate the proprietary rights of others, our operating results could be harmed.
Our success depends on our ability to obtain, maintain, and enforce patents on our technology, maintain our trademarks, and protect our trade secrets. Our patents may not provide complete protection or may expire, and competitors may develop similar products that are not covered by our patents. Our patents may also be challenged by third parties and invalidated or narrowed. We may experience a decline in sales and/or profitability if any of these things occur. Competitors sometimes seek to take advantage of our trademarks or brands in ways that may create customer confusion or weaken our brand. Improper use or disclosure of our trade secrets may still occur.
We may be sued for infringing on the intellectual property rights of others. The cost of any litigation could affect our profitability regardless of the outcome, and management attention could be diverted. If we are unsuccessful in such litigation, we may have to pay damages, stop the infringing activity, and/or obtain a license. If we fail to obtain a required license, we may be unable to sell some of our products, which could result in a decline in our revenues.
Departures of key employees could impair our operations.
Key employees could leave the Company. If any key employees stopped working for us, our operations could be harmed. Important R&D personnel may leave and join competitors, which could substantially delay or hinder ongoing development projects. We have no key man life insurance policies with respect to any of our senior executives.
We may be adversely affected by environmental laws and regulations.
We are subject to various environmental laws and regulations and incur expenditures in complying with environmental laws and regulations. We are currently involved in, or have potential liability with respect to, the remediation of past contamination in various facilities. In addition, some of our facilities are or have been in operation for many decades and may have used substances or generated and disposed of wastes that are hazardous or may be considered hazardous in the future. These sites and disposal sites owned by others to which we sent waste may in the future be identified as contaminated and require remediation. Accordingly, it is possible that we could become subject to additional environmental liabilities in the future that may harm our results of operations or financial condition.
We may be adversely affected by regulations and market expectations related to sourcing and our supply chain, including conflict minerals.
The SEC has adopted disclosures and reporting requirements for companies whose products contain certain minerals and their derivatives, namely tin, tantalum, tungsten, or gold, known as conflict minerals. Companies must report annually whether or not such minerals originate from the Democratic Republic of Congo (DRC) and adjoining countries and in some cases perform extensive due diligence on their supply chains for such minerals. These requirements could adversely affect the sourcing, availability, and pricing of materials used in the manufacturing of our products. In addition, we have incurred additional costs to comply with the disclosure requirements, including cost related to determining the source of any of the relevant minerals used in our products. Since our supply chain is complex, the due diligence procedures that we have implemented may not enable us to ascertain with sufficient certainty the origins for these minerals or determine that these minerals are DRC conflict free, which may harm our reputation. We may also face difficulties in satisfying customers who may require that our products be certified as DRC conflict free, which could harm our relationships with these customers and/or lead to a loss of revenue. These requirements also could have the effect of limiting the pool of suppliers from which we source these minerals, and we may be unable to obtain conflict-free minerals at prices similar to the past, which could increase our costs and adversely affect our manufacturing operations and our profitability.
Future laws, regulations, or customers may make additional demands on supply chain transparency. These demands can include more transparency into the activities of our suppliers with regard to human rights and sustainable sourcing. We have significant protections in place to ensure we partner with responsible suppliers, but increased demands may cause us to incur increased supply chain costs. If we can't satisfy customers' demands, we may lose business, and if we can't meet new regulatory requirements, we may have to alter our sourcing at increased expense.
We may be adversely affected by failure to comply with regulations of governmental agencies or by the adoption of new regulations. Changes in United States trade policy, including the imposition of tariffs and the resulting consequences, as well as other changes in political policy in the United States, China, the U.K., and certain European countries, may also impact global trade or create uncertainty impacting our business.
Our products are subject to regulation by governmental agencies. These regulations govern a wide variety of activities relating to our products, including design and development, product safety, labeling, manufacturing, promotion, sales, and distribution. We also operate a global business and are subject to various laws and regulations in the many markets we do business, including those relating to competition, employment and labor practices, international trade, and corruption. If we fail to comply with these regulations, or if new regulations are adopted that substantially change existing practice or impose new burdens, we may have to recall products and cease their manufacture and distribution. In addition, we could be subject to investigation costs, reputational harm, fines, criminal prosecution, and other damages that could impact our profitability.
Changes in political policy in the United States, China, the U.K., and certain European countries may impact global trade or create uncertainty. The United States government has announced its intent to adopt a new approach to trade policy and in certain cases to renegotiate, or possibly terminate, certain existing trade agreements. The United States government has also initiated tariffs on certain foreign goods, particularly those produced in China, and has raised the possibility of imposing further tariff increases or expanding the scope of the tariffs. As a result, certain foreign governments, including the Chinese government, have imposed retaliatory tariffs on goods that their countries import from the United States.
These actions may restrict our access to lower-cost countries or otherwise create uncertainty in global markets and make it more difficult or costly for us to import our products into certain countries. The adoption and expansion of trade restrictions or other government action related to tariffs or trade agreements or policies could also lead to an economic downturn and/or could create unfavorable fluctuations in currency exchange rates (see above description "currency fluctuations affect our operating profits"). In times of uncertainty, some customers delay investments or defer normal replacement cycles, which could have an adverse impact on our sales. The adoption and expansion of trade restrictions or other governmental action related to tariffs or trade agreements or policies have the potential to adversely impact our business and financial performance.
In June 2016, voters in the U.K. approved an advisory referendum to withdraw from the European Union, commonly referred to as "Brexit". The timing of the proposed exit is currently scheduled for March 2019, with a transition period running through December 2020. Brexit has created political and economic uncertainty that may have a negative impact on U.K., European and global economic conditions, international trade flows, and foreign currency translation. At this time, we cannot predict the potential impact of Brexit on our business. However, Brexit could adversely effect our operating results and financial condition.
We may face risks associated with future acquisitions.
We may pursue acquisitions of complementary product lines, technologies, or businesses. Acquisitions involve numerous risks, including difficulties in integrating the acquired operations, technologies, and products; diversion of management’s attention from other business concerns; and potential departures of key employees of the acquired company. If we successfully identify acquisitions in the future, completing such acquisitions may result in new issuances of our stock that may be dilutive to current owners, increases in our debt and contingent liabilities, and additional amortization expense related to intangible assets. Any of these acquisition-related risks could have a material adverse effect on our profitability.
Larger companies have identified life sciences and instruments as businesses they will consider entering, which could change the competitive dynamics of these markets. In addition, we may not be able to identify, successfully complete, or integrate potential acquisitions in the future. Even if we can do so, we cannot be sure that these acquisitions will have a positive impact on our business or operating results. We are also required to estimate the fair value of certain assets acquired or liabilities assumed. Such fair values may be based on valuation models which are subject to inherent uncertainties and our judgments regarding certain assumptions.
We may experience impairments of goodwill or other intangible assets.
As of December 31, 2018, our consolidated balance sheet included goodwill of $534.8 million and other intangible assets of $217.3 million.
Our business acquisitions typically result in goodwill and other intangible assets, which affect the amount of future period amortization expense and possible impairment expense. We make estimates and assumptions in valuing such intangible assets that affect our consolidated financial statements.
In accordance with U.S. GAAP, our goodwill and indefinite-lived intangible assets are not amortized, but are evaluated for impairment annually in the fourth quarter, or more frequently if events or changes in circumstances indicate that an asset might be impaired. The evaluation may be based on valuation models that estimate fair value. In preparing the valuation models, we consider a number of factors, including operating results, business plans, economic conditions, future cash flows, and transactions and market data. There are inherent uncertainties related to these factors and our judgment in applying them to the impairment analyses. The significant estimates and assumptions within our fair value models include sales growth, controllable cost growth, perpetual growth, effective tax rates, and discount rates. Our assessments to date have indicated that there has been no impairment of these assets.
Should any of these estimates or assumptions change, or should we incur lower-than-expected operating performance or cash flows, including from a prolonged economic slowdown, we may experience a triggering event that requires a new fair value assessment for our reporting units, possibly prior to the required annual assessment. These types of events and resulting analysis could result in impairment charges for goodwill and other indefinite-lived intangible assets if the fair value estimate declines below the carrying value.
Our amortization expense related to intangible assets with finite lives may materially change should our estimates of their useful lives change.
We have debt and we may incur substantially more debt, which could affect our ability to meet our debt obligations and may otherwise restrict our activities.
We have debt and we may incur substantial additional debt in the future. As of December 31, 2018, we had total indebtedness of approximately $856.6 million, net of cash of $178.1 million. Our debt instruments allow us to incur substantial additional indebtedness.
The existence and magnitude of our debt could have important consequences. For example, it could make it more difficult for us to satisfy our obligations under our debt instruments; require us to dedicate a substantial portion of our cash flow to payments on our indebtedness, which would reduce the amount of cash flow available to fund working capital, capital expenditures, product development, and other corporate requirements; increase our vulnerability to general adverse economic and industry conditions, including changes in raw material costs; limit our ability to respond to business opportunities; limit our ability to borrow additional funds, which may be necessary; and subject us to financial and other restrictive covenants, which, if we fail to comply with these covenants and our failure is not waived or cured, could result in an event of default under our debt instruments.
The agreements governing our debt impose restrictions on our business.
The note purchase agreements governing our notes and the agreements governing our credit facility contain covenants imposing various restrictions on our business. These restrictions may affect our ability to operate our business and may limit our ability to take advantage of potential business opportunities. The restrictions these covenants place on us include limitations on our ability to incur liens and consolidate, merge, sell, or lease all or substantially all of our assets. Our credit facility and the note purchase agreements governing our senior notes also require us to meet certain financial ratios.
Our ability to comply with these agreements may be affected by events beyond our control, including economic, financial, and industry conditions. The breach of any covenants or restrictions could result in a default under the note purchase agreements governing the senior notes and/or under our credit facility. An event of default under the agreements governing our debt would permit holders of our debt to declare all amounts owed to them under such agreements to be immediately due and payable. Acceleration of our other indebtedness may cause us to be unable to make interest payments on the senior notes and repay the principal amount of the senior notes.
The lenders under our credit agreement may be unable to meet their funding commitments, reducing the amount of our borrowing capacity.
We have a revolving credit facility outstanding under which the Company and certain of its subsidiaries may borrow up to $1.1 billion. Our credit facility is provided by a group of 15 financial institutions, which individually have between 1% and 11% of the total funding commitment. At December 31, 2018, we had borrowings of $493.2 million outstanding under our credit facility. Our ability to borrow further funds under our credit facility is subject to the various lenders’ financial condition and ability to make funds available. Even though the financial institutions are contractually obligated to lend funds, if one or more of the lenders encounters financial difficulties or goes bankrupt, such lenders may be unable to meet their obligations. This could result in us being unable to borrow the full $1.1 billion amount available.
We make forward-looking statements, and actual events or results may differ materially from these statements because assumptions we have made prove incorrect due to market conditions in our industries or other factors.
We provide forward-looking statements both in our filings with the SEC and orally in connection with our quarterly earnings calls, including guidance on anticipated earnings per share. You should not rely on forward-looking statements to predict our actual results. Our actual results or performance may be materially different than reflected in forward-looking statements because of various risks and uncertainties.
Our forward-looking statements may not be accurate or complete, and we do not intend to update or revise them in light of actual results. New risks also periodically arise. Please consider the risks and factors that could cause our results to differ materially from what is described in our forward-looking
statements. See in particular “Factors Affecting Our Future Operating Results” and “Management’s Discussion and Analysis of Financial Condition and Results of Operations.”
In providing guidance on our future earnings, we evaluate our budgets, strategic plans, and other factors relating to our business. We make assumptions about external factors, including the following:
| • | the outlook for our end markets and the global economy; |
| • | the impact of external factors on our competition; |
| • | the financial position of our customers and their willingness to pay for our products and services; |
| • | the estimated costs of purchasing materials; |
| • | developments in personnel costs; |
| • | our estimated income tax expense; and |
| • | rates for currency exchange, particularly between the Swiss franc and the euro. |
Some of these assumptions may prove to be incorrect over time. For example, although no single end-customer accounts for more than 1% of our revenues, if a number of our customers experienced significant deteriorations in their financial positions concurrently, it could have an impact on our results of operations.
Some of our key internal assumptions include the following:
| • | our ability to implement our business strategy; |
| • | our ability to implement price increases as forecasted; |
| • | the effectiveness of our sales and marketing programs such as our Spinnaker and market penetration, and Field Turbo initiatives; |
| • | the effectiveness of our programs to improve our service business, including growth, globalization, and productivity initiatives; |
| • | our ability to develop and deliver innovative products and services; |
| • | the continued growth of our sales in emerging markets; and |
| • | the effectiveness of productivity and cost saving initiatives. |
These internal assumptions may also prove to be incorrect over time. For example, with respect to our ability to realize our planned price increases without disturbing our customer base in core markets, in certain markets, such as emerging markets, price tends to be a more significant factor in customers’ decisions to purchase our products and services. Furthermore, we can have no assurance that our cost reduction programs will generate adequate cost savings. Additionally, it may become necessary to take additional restructuring actions resulting in additional restructuring costs.
We believe our current assumptions are reasonable and prudent for planning purposes. However, should any of these assumptions prove to be incorrect, or should we incur lower-than-expected operating performance or cash flows, we may experience results different than our projections.
Our ability to generate and repatriate cash depends in part on factors beyond our control.
Our ability to make payments on our debt and to fund our share repurchase program, planned capital expenditures, and research and development efforts depends on our ability to generate and repatriate cash in the future. This is subject to factors beyond our control, including general economic, financial, competitive, legislative, regulatory, governmental, and other factors described in this section.
We cannot ensure that our business will generate sufficient cash flows from operations or that future borrowings will be available to us under our credit facility in an amount sufficient to enable us to pay our debt or to fund our other liquidity needs. We may need to refinance all or a portion of our indebtedness on or before maturity. We cannot ensure that we will be able to refinance any of our debt, including our credit facility and the senior notes, on commercially reasonable terms or at all.
Our ability to fund our share repurchase program is also dependent on our ability to repatriate our international cash flows. Changes in governmental cash repatriation policies, restrictions, or tax laws could impair our ability to continue our share repurchase program.
Item 1B. Unresolved Staff Comments
None.
Item 2. Properties
Our principal executive offices are located in Columbus, Ohio and Greifensee, Switzerland. The following table lists our principal facilities, indicating the location and whether the facility is owned or leased. The properties listed below serve primarily as manufacturing facilities or shared service centers and also typically have a certain amount of space for service, sales and marketing, and administrative activities. The facilities in Giessen, Germany and Viroflay, France are used primarily for sales and marketing. We believe our facilities are adequate for our current and reasonably anticipated future needs.
| Location | Owned/Leased | Business Segment | ||
| Europe: | ||||
| Greifensee/Nänikon, Switzerland | Owned | Swiss Operations | ||
| Urdorf, Switzerland | Owned | Swiss Operations | ||
| Manchester, England | Leased | Western European Operations | ||
| Royston, United Kingdom | Owned | Western European Operations | ||
| Salford, United Kingdom | Leased | Western European Operations | ||
| Viroflay, France (two facilities) | Owned; Leased | Western European Operations | ||
| Albstadt, Germany | Owned | Western European Operations | ||
| Giessen, (Hesse) Germany | Owned | Western European Operations | ||
| Giesen, (Lower Saxony) Germany | Owned | Western European Operations | ||
| Warsaw, Poland | Leased | Other Operations | ||
| Americas: | ||||
| Columbus, Ohio | Leased | U.S. Operations | ||
| Worthington, Ohio (two facilities) | Owned | U.S. Operations | ||
| Oakland, California | Owned | U.S. Operations | ||
| Billerica, Massachusetts | Owned | U.S. Operations | ||
| Tampa, Florida | Owned | U.S. Operations | ||
| Tijuana, Mexico | Leased | U.S. Operations | ||
| Thorofare, New Jersey | Owned | U.S. Operations | ||
| Other: | ||||
| Shanghai, China (two facilities) | Buildings Owned; | Chinese Operations | ||
| Land Leased | ||||
| Changzhou, China (two facilities) | Buildings Owned; | Chinese Operations | ||
| Land Leased | ||||
| ChengDu, China | Buildings Owned; | Chinese Operations | ||
| Land Leased | ||||
| Mumbai, India (three facilities) | Leased | Other Operations |
Item 3. Legal Proceedings
We are not currently involved in any legal proceeding that we believe could have a material adverse effect upon our financial condition, results of operations, or cash flows. See the disclosure in Item 1 above under “Environmental Matters.”
Executive Officers of the Registrant
See Part III, Item 10 of this annual report for information about our executive officers.
PART II
Item 5. Market for Registrant’s Common Equity, Related Stockholder Matters, and Issuer Purchases of Equity Securities
Market Information for Common Stock
Our common stock is traded on the New York Stock Exchange under the symbol “MTD.”
Holders
At February 1, 2019, there were 49 holders of record of common stock and 24,795,237 shares of common stock outstanding. We estimate we have approximately 90,609 beneficial owners of common stock.
Dividend Policy
Historically, we have not paid dividends on our common stock. However, we will evaluate this policy on a periodic basis taking into account our results of operations, financial condition, capital requirements, including potential acquisitions, our share repurchase program, the taxation of dividends to our shareholders, and other factors deemed relevant by our Board of Directors.
Share Performance Graph
The following graph compares the cumulative total returns (assuming reinvestment of dividends) on $100 invested on December 31, 2013 through December 31, 2018 in our common stock, the Standard & Poor’s 500 Composite Stock Index (S&P 500 Index), and the SIC Code 3826 Index — Laboratory Analytical Instruments.
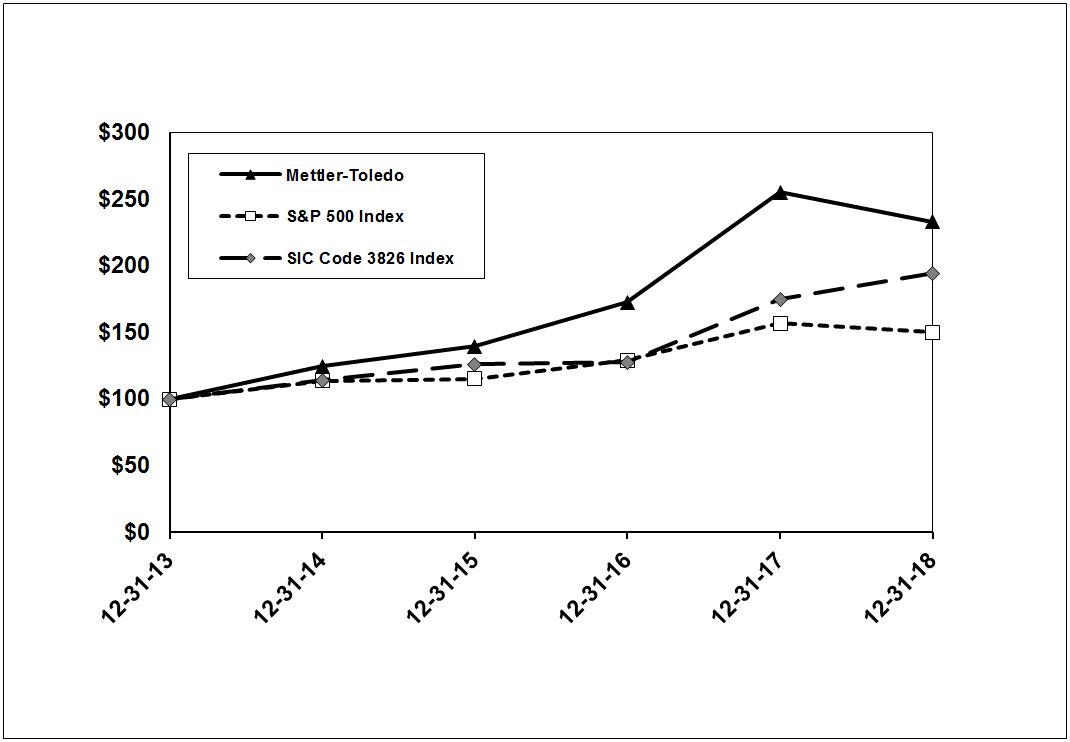
Comparison of Cumulative Total Return Among Mettler-Toledo International Inc., the S&P 500 Index, and SIC Code 3826 Index — Laboratory Analytical Instruments
| 12/31/13 | 12/31/14 | 12/31/15 | 12/31/16 | 12/31/17 | 12/31/18 | |
| Mettler-Toledo | $100 | $125 | $140 | $173 | $255 | $233 |
| S&P 500 Index | $100 | $114 | $115 | $129 | $157 | $150 |
| SIC Code 3826 Index | $100 | $114 | $126 | $128 | $175 | $194 |
Purchases of Equity Securities by the Issuer and Affiliated Purchasers
Issuer Purchases of Equity Securities
| Total Number of Shares Purchased | Average Price Paid per Share | Total Number of Shares Purchased as Part of Publicly Announced Program | Approximate Dollar Value (in thousands) of Shares that may yet be Purchased under the Program | |||||||||||
| Period | ||||||||||||||
| October 1 to October 31, 2018 | 71,514 | $ | 571.57 | 71,514 | $ | 186,296 | ||||||||
| November 1 to November 30, 2018 | 69,849 | 585.17 | 69,849 | 2,145,421 | ||||||||||
| December 1 to December 31, 2018 | 62,907 | 588.12 | 62,907 | 2,108,423 | ||||||||||
| Total | 204,270 | $ | 581.32 | 204,270 | $ | 2,108,423 |
In November 2018, the Company's Board of Directors authorized an additional $2.0 billion to the share repurchase program which has $2.1 billion of remaining availability as of December 31, 2018. The share repurchases are expected to be funded from cash generated from operating activities, borrowings, and cash balances. Repurchases will be made through open market transactions, and the amount and timing of purchases will depend on business and market conditions, the stock price, trading restrictions, the level of acquisition activity, and other factors.
We have purchased 27.5 million common shares since the inception of the program in 2004 through December 31, 2018, at a total cost of $4.4 billion. During the years ended December 31, 2018 and 2017, we spent $475 million and $400 million on the repurchase of 802,809 shares and 749,254 shares at an average price per share of $591.65 and $533.84, respectively. We reissued 183,379 shares and 270,413 shares held in treasury for the exercise of stock options and restricted stock units during 2018 and 2017, respectively.
Item 6. Selected Financial Data
The selected historical financial information set forth below as of and for the years then ended December 31 is derived from our audited consolidated financial statements. The financial information presented below, in thousands except share data, was prepared in accordance with accounting principles generally accepted in the United States of America (“U.S. GAAP”).
| 2018 | 2017 | 2016 | 2015 | 2014 | |||||||||||||||
| Statement of Operations Data: | |||||||||||||||||||
| Net sales | $ | 2,935,586 | $ | 2,725,053 | $ | 2,508,257 | $ | 2,395,447 | $ | 2,485,983 | |||||||||
| Cost of sales(a) | 1,251,208 | 1,149,302 | 1,070,525 | 1,040,510 | 1,123,780 | ||||||||||||||
| Gross profit | 1,684,378 | 1,575,751 | 1,437,732 | 1,354,937 | 1,362,203 | ||||||||||||||
| Research and development(a) | 141,071 | 128,308 | 119,196 | 118,557 | 122,688 | ||||||||||||||
| Selling, general, and administrative(a) | 812,802 | 794,861 | 745,358 | 717,022 | 747,597 | ||||||||||||||
| Amortization | 47,524 | 42,671 | 36,052 | 30,951 | 29,185 | ||||||||||||||
| Interest expense | 34,511 | 32,785 | 28,026 | 27,451 | 24,537 | ||||||||||||||
| Restructuring charges(b) | 18,420 | 12,772 | 6,235 | 11,148 | 5,915 | ||||||||||||||
| Other charges (income), net(a)(c) | (21,808 | ) | (9,868 | ) | (1,328 | ) | (13,616 | ) | (12,723 | ) | |||||||||
| Earnings before taxes | 651,858 | 574,222 | 504,193 | 463,424 | 445,004 | ||||||||||||||
| Provision for taxes(d) | 139,247 | 198,250 | 119,823 | 110,604 | 106,763 | ||||||||||||||
| Net earnings | $ | 512,611 | $ | 375,972 | $ | 384,370 | $ | 352,820 | $ | 338,241 | |||||||||
| Basic earnings per common share: | |||||||||||||||||||
| Net earnings | $ | 20.33 | $ | 14.62 | $ | 14.49 | $ | 12.75 | $ | 11.71 | |||||||||
| Weighted average number of common shares | 25,215,674 | 25,713,575 | 26,517,768 | 27,680,918 | 28,890,771 | ||||||||||||||
| Diluted earnings per common share: | |||||||||||||||||||
| Net earnings | $ | 19.88 | $ | 14.24 | $ | 14.22 | $ | 12.48 | $ | 11.44 | |||||||||
| Weighted average number of common and common equivalent shares | 25,781,324 | 26,393,783 | 27,023,905 | 28,269,615 | 29,571,308 | ||||||||||||||
| Balance Sheet Data: | |||||||||||||||||||
| Cash and cash equivalents | $ | 178,110 | $ | 148,687 | $ | 158,674 | $ | 98,887 | $ | 85,263 | |||||||||
| Working capital(e) | 182,987 | 188,040 | 169,569 | 152,721 | 172,380 | ||||||||||||||
| Total assets | 2,618,847 | 2,549,805 | 2,166,777 | 1,959,335 | 1,973,532 | ||||||||||||||
| Long-term debt(e) | 985,021 | 960,170 | 875,056 | 575,138 | 334,134 | ||||||||||||||
| Other non-current liabilities(f) | 260,511 | 301,452 | 204,957 | 194,552 | 218,108 | ||||||||||||||
| Shareholders’ equity(g) | 590,063 | 547,280 | 434,943 | 580,457 | 719,595 |
| (a) | In accordance with the new accounting rules that went into effect on January 1, 2018, we reclassified a net pension benefit of $6.2 million, $4.0 million, $9.8 million, $12.7 million, and $15.0 million into other charges (income) from other income statement categories for the years ended December 31, 2018, 2017, 2016, 2015, and 2014, respectively, to be consistent with 2018 presentation. |
| (b) | Restructuring charges primarily relate to our global cost reduction programs. See Note 15 and Note 18 to the audited consolidated financial statements. |
| (c) | Other charges (income), net includes (gains) losses from foreign currency transactions and hedging activities, interest income, and other items. Other charges (income), net for 2018 includes a one-time gain of $18.7 million associated with the settlement of the Biotix acquisition contingent consideration, as well as a one-time legal charge of $3 million. Other charges (income), net includes $1.7 million and $1.1 million of acquisition costs for 2017 and 2016, respectively. Other charges (income), net for 2017 also includes a one-time gain of $3.4 million relating to the sale of a facility in Switzerland in connection with our initiative to consolidate certain Swiss operations into a new facility, while 2016 includes a one-time non-cash pension settlement charge of $8.2 million related to a lump sum offering to former employees of our U.S. pension plan. |
| (d) | Provision for taxes for 2018 and 2017 includes charges of $3.6 million and $72 million, respectively, for the implementation of the Tax Cuts and Jobs Act. Of this aggregate amount, $62 million is expected to be paid over a period of up to eight years beginning in 2018. See Note 14 to the audited consolidated financial statements. |
| (e) | Working capital represents total current assets net of cash, less total current liabilities net of short-term borrowings and current maturities of long-term debt. |
| (f) | Other non-current liabilities consist of pension and other post-retirement liabilities, the long-term taxes payable of $45 million and $48 million as of December 31, 2018 and 2017 related to the Tax Cuts and Jobs Act, plus certain other non-current liabilities. See Note 13 to the audited consolidated financial statements for pension and other post-retirement disclosures. |
| (g) | No dividends were paid during the five-year period ended December 31, 2018. |
Item 7. Management’s Discussion and Analysis of Financial Condition and Results of Operations
The following discussion and analysis of our financial condition and results of operations should be read together with our audited consolidated financial statements.
Changes in local currencies exclude the effect of currency exchange rate fluctuations. Local currency amounts are determined by translating current and previous year consolidated financial information at an index utilizing historical currency exchange rates. We believe local currency information provides a helpful assessment of business performance and a useful measure of results between periods. We do not, nor do we suggest that investors should, consider such non-GAAP financial measures in isolation from, or as a substitute for, financial information prepared in accordance with GAAP. We present non-GAAP financial measures in reporting our financial results to provide investors with an additional analytical tool to evaluate our operating results.
We also include in the discussion below disclosures of immaterial qualitative factors that are not quantified. Although the impact of such factors is not considered material, we believe these disclosures can be useful in evaluating our operating results.
Overview
We operate a global business with sales that are diversified by geographic region, product range, and customer. We hold leading positions worldwide in many of our markets and attribute this leadership to several factors, including the strength of our brand name and reputation, our comprehensive offering of innovative instruments and solutions, and the breadth and quality of our global sales and service network.
Net sales in U.S. dollars increased 8% in 2018 and 9% in 2017. Excluding the effect of currency exchange rate fluctuations, or in local currencies, net sales increased 6% in 2018 and 8% in 2017. Net sales growth in local currencies during 2018 reflected strong execution of our growth initiatives and favorable global market conditions. We expect to continue to benefit from our strong global leadership positions, diversified customer base, innovative product offering, investment in emerging markets, significant installed base, and the impact of our global sales and marketing programs. Examples of these programs include identifying and investing in growth and market penetration opportunities, more effectively pricing our products and services, increasing our sales force effectiveness through improved guidance, and continuing to optimize our lead generation and lead nurturing processes. However, economic conditions can also change quickly, particularly in emerging markets, and it is uncertain that favorable market conditions will continue. We also remain cautious as economic uncertainties exist in certain regions of the world, especially the potential impact of international trade/tariff disputes.
With respect to our end-user markets, we experienced increased results during 2018 versus the prior year in our laboratory-related markets, such as pharmaceutical and biotech customers, as well as the laboratories of chemical companies and food and beverage companies. Demand from these markets was
favorable during 2018. The local currency increase in net sales of our laboratory-related products during 2018 was driven by strong growth in most product categories.
Our industrial markets experienced favorable market conditions in China with strong growth despite challenging prior period comparisons. Emerging market economies have historically been an important source of growth based upon the expansion of their domestic economies, as well as increased exports as companies have moved production to low-cost countries. However, our core industrial-related products are especially sensitive to changes in economic growth. We also expect our industrial markets to continue to benefit from our customers' focus on brand protection and food safety within our product inspection end-market.
Our food retailing sales increased during 2018 with strong project activity in the Americas. Traditionally the spending levels in this sector have experienced more volatility than our other customer sectors due to the timing of customer project activity and new regulations.
In 2019, we expect to continue to pursue the overall business growth strategies which we have followed in recent years:
Gaining Market Share. Our global sales and marketing initiative, “Spinnaker,” continues to be an important growth strategy. For example, over the past few years, we have added field sales and service resources to pursue under-penetrated market opportunities and will look to continue to make investments to front-end resources in 2019. We also aim to gain market share by implementing sophisticated sales and marketing programs, leveraging our extensive customer databases, and leveraging our product offering to larger customers through key account management. While this initiative is broad-based, efforts to improve these processes include leveraging big data analytics to identify, prioritize, and pursue growth opportunities, the implementation of more effective pricing and value-based selling strategies and processes, improved sales force guidance, training and effectiveness, cross-selling, increased segment marketing, and leads generation and nurturing activities. Our comprehensive service offerings, and our initiatives to globalize and harmonize these offerings, help us further penetrate developed markets. We estimate that we have the largest installed base of weighing instruments in the world, and we continue to leverage big data analytics and invest in sales and marketing activities aimed at increasing the proportion of our installed base that is under service contract, or selling new products that replace old products in our installed base. In addition to traditional repair and maintenance, our service offerings continue to expand into value-added services for a range of market needs, including regulatory compliance.
Expanding Emerging Markets. Emerging markets, comprising Asia (excluding Japan), Eastern Europe, Latin America, the Middle East, and Africa, account for approximately 35% of our total net sales. We have a two-pronged strategy in emerging markets: first, to capitalize on long-term growth opportunities in these markets, and second, to leverage our low-cost manufacturing operations in China. We have approximately a 30-year track record in China, and our sales in Asia have grown more than 14% on a compound annual growth basis in local currencies since 1999. Over the years, we have also broadened our product offering to the Asian markets. India has also been a source of emerging market sales growth in past years due to increased life science research activities. Overall, market conditions in emerging markets were favorable during 2018. We experienced a 10% increase in emerging market local currency sales during 2018 versus the prior year, which included 13% local currency sales growth in China. Within China, we continue to redeploy resources and sales and marketing efforts to the faster-growing segments of pharma, food safety, chemical, and environment. We believe the long-term growth of these segments will be favorably impacted by the Chinese government's emphasis on science, high-value industries, and product quality. We expect our laboratory and product inspection businesses will particularly benefit from these segments. We also continue to invest and add sales and marketing resources to pursue growth in under-penetrated emerging markets. However, emerging market sales can
be volatile. While Chinese market conditions are currently favorable, there is uncertainty, including the potential impact of international trade disputes. The Chinese economy has historically been volatile and market conditions may change unfavorably due to various factors.
Extending Our Technology Lead. We continue to focus on product innovation. In the last three years, we spent approximately 5% of net sales on research and developme
Showing the first 8K of 62K characters. Open the full section
Item 7A. Quantitative and Qualitative Disclosures about Market Risk
Discussion of this item is included in Management’s Discussion and Analysis of Financial Condition and Results of Operations.
Item 8. Financial Statements and Supplementary Data
The financial statements required by this item are set forth starting on page F-1 and the related financial schedule is set forth on page S-1.
Item 9. Changes in and Disagreements with Accountants on Accounting and Financial Disclosure
None.
Item 9A. Controls and Procedures
Conclusions Regarding the Effectiveness of Disclosure Controls and Procedures
Under the supervision and with the participation of our management, including the Chief Executive Officer and the Chief Financial Officer, we have evaluated the effectiveness of our disclosure controls and procedures as required by Exchange Act Rule 13a-15(b) as of the end of the period covered by this report. Based upon that evaluation, the Chief Executive Officer and the Chief Financial Officer have concluded that these disclosure controls and procedures are effective.
Management’s Report on Internal Control over Financial Reporting
Our management is responsible for establishing and maintaining adequate internal control over financial reporting. Our internal control over financial reporting is a process designed to provide reasonable assurance regarding the reliability of financial reporting and the preparation of the Company’s financial statements for external reporting purposes in accordance with accounting principles generally accepted in the United States of America.
Because of its inherent limitations, internal control over financial reporting may not prevent or detect misstatements. Also, projections of any evaluation of effectiveness to future periods are subject to the risk that controls may become inadequate because of changes in conditions or that the degree of compliance with the policies or procedures may deteriorate.
Management assessed the effectiveness of the Company’s internal control over financial reporting as of December 31, 2018. In making this assessment, we used the criteria set forth by the Committee of Sponsoring Organizations of the Treadway Commission (COSO) in Internal Control — Integrated Framework (2013). Based on our assessment, we concluded that, as of December 31, 2018, the Company’s internal control over financial reporting is effective.
PricewaterhouseCoopers LLP, an independent registered public accounting firm that audited the financial statements included in this Report on Form 10-K, has issued their integrated audit report, which covers our internal control over financial reporting, which appears on page F-2.
Changes in Internal Control over Financial Reporting
There were no changes in our internal control over financial reporting during the quarter ended December 31, 2018 that have materially affected, or are reasonably likely to materially affect, our internal control over financial reporting.
Item 9B. Other Information
None.
PART III
Item 10. Directors, Executive Officers, and Corporate Governance
The executive officers of the Company are set forth below. Officers are appointed by the Board of Directors and serve at the discretion of the Board.
| Name | Age | Position | ||
| Olivier A. Filliol | 52 | President and Chief Executive Officer | ||
| Peter Aggersbjerg | 50 | Head of Laboratory | ||
| Marc de La Guéronnière | 55 | Head of European and North American Market Organizations | ||
| Michael Heidingsfelder | 58 | Head of Industrial | ||
| Gerhard Keller | 51 | Head of Process Analytics | ||
| Simon Kirk | 59 | Head of Product Inspection | ||
| Christian Magloth | 53 | Head of Human Resources | ||
| Shawn P. Vadala | 50 | Chief Financial Officer |
Olivier A. Filliol has been a director since January 2009. He has been President and Chief Executive Officer of the Company since January 1, 2008. Mr. Filliol served as Head of Global Sales, Service, and Marketing of the Company from April 2004 to December 2007 and Head of Process Analytics of the Company from June 1999 to December 2007. From June 1998 to June 1999, he served as General Manager of the Company’s U.S. checkweighing operations. Prior to joining the Company, he was a Strategy Consultant with the international consulting firm Bain & Company, working in the Geneva, Paris, and Sydney offices.
Peter Aggersbjerg has been Head of Laboratory of the Company since January 2018. From February 2016 to December 2017, he served as the Head of our Laboratory Weighing strategic business unit. He served as the Global BU Head for Medela's Neonatal Care business and a member of its Group management from February 2011 until joining the Company in February 2016. Prior to Medela, Mr. Aggersbjerg was CEO for Swissimplant from July 2010 to February 2011, Vernal from October 2006 to December 2008, and Tytex from October 2001 to October 2006.
Marc de La Guéronnière has been Head of European Market Organizations of the Company since January 2008 and Head of North American Market Organizations since April 2014. He was Head of Region South and General Manager of the Company’s market organization in Spain from January 2006 to January 2008. He joined the Company in 2001 as the Industrial Business Area Manager for our market organization in France. Prior to joining the Company, Mr. de La Guéronnière held various management positions in Europe and the United States with ABB-Elsag Bailey and Danaher-Zellweger.
Michael Heidingsfelder joined the Company in April 2012 as Head of Industrial Division. Prior to joining the Company, Mr. Heidingsfelder held various management positions within the Freudenberg Group from 2004 to March 2012 in Europe, Asia, and the Americas, including Chief Operating Officer, Americas, and General Manager, China. Previously, he was a Partner of Roland Berger Strategy Consultants in the U.S. and Europe.
Gerhard Keller joined the Company in 1991 and has been Head of Process Analytics since July 2018 and Head of Pipettes since July 2013. He previously was Head of Region East Asia/Pacific and has also served in various Sales and Marketing leadership functions in Europe and Asia Pacific. Prior to joining the Company, he worked in Quality Control at Sandoz, now Novartis, in Switzerland.
Simon Kirk joined the Company in January 2012 as Head of Product Inspection. Previously, he worked at Schindler where he served since 2008 as Chief Executive Officer of Jardine Schindler Group, a
joint venture responsible for all of Schindler's operations in Southeast Asia. From 2004 until 2008, he was Vice President responsible for Eastern Europe at Schindler. He has also held various management positions at Eaton Corporation, Owens Corning, Imperial Chemical Industries, and British Railways Board.
Christian Magloth joined the Company in October 2010 and has been Head of Human Resources since December 2010. Prior to joining the Company, he served as Head of Human Resources of Straumann, a leading global medical devices company listed on the Swiss stock exchange, from April 2006 to September 2010. He previously served as Head of Human Resources at Hero Group, an international consumer foods company, and in various management positions at Hilti, a leading global construction supply company.
Shawn P. Vadala joined the Company in 1997 and has been Chief Financial Officer since January 2014, and also responsible for the Company's Pricing program since 2008. Mr. Vadala previously held various senior financial positions at the Company's Columbus, Ohio and Greifensee, Switzerland offices and was also responsible for Business Intelligence from 2010 to 2018. Prior to joining the Company, he worked in the Boston and Zurich, Switzerland offices of PricewaterhouseCoopers.
Certifications
Our Chief Executive Officer and Chief Financial Officer provide certifications pursuant to Section 302 of the Sarbanes-Oxley Act of 2002 in connection with our quarterly and annual financial statement filings with the Securities and Exchange Commission. The certifications relating to this annual report are attached as Exhibits 31.1 and 31.2.
The remaining information called for by this item is incorporated by reference from the discussion in the sections “Proposal One: Election of Directors,” “Board of Directors — General Information,” “Board of Directors — Operation,” and “Additional Information — Section 16(a) Beneficial Ownership Reporting Compliance” in the 2019 Proxy Statement.
Item 11. Executive Compensation
The information appearing in the sections captioned “Board of Directors — General Information —Director Compensation,” “Compensation Discussion and Analysis,” “Compensation Committee Report,” and “Additional Information — Compensation Committee Interlocks and Insider Participation” in the 2019 Proxy Statement is incorporated by reference herein.
Item 12. Security Ownership of Certain Beneficial Owners and Management and Related Stockholder Matters
The information appearing in the section “Share Ownership” in the 2019 Proxy Statement is incorporated by reference herein. Information appearing in “Securities Authorized for Issuance under Equity Compensation Plans as of December 31, 2018” is included within Note 12 to the financial statements.
Item 13. Certain Relationships and Related Transactions and Director Independence
Certain Relationships and Related Transactions — None.
Director Independence — The information in the section “Board of Directors — General Information — Independence of the Board” in the 2019 Proxy Statement is incorporated by reference herein.
Item 14. Principal Accounting Fees and Services
Information appearing in the section “Audit Committee Report” in the 2019 Proxy Statement is hereby incorporated by reference.
PART IV
Item 15. Exhibits and Financial Statement Schedules
(a) Exhibits, Financial Statements, and Schedules:
-
Financial Statements. See Index to Consolidated Financial Statements included on page F-1.
-
Financial Statement Schedule. See Schedule II, which is included on page S-1.
-
List of Exhibits. See Exhibit Index included on page E-1.
Item 16. Form 10-K Summary
None.
EXHIBIT INDEX
Showing the first 8K of 167K characters. Open the full section