 filings.tools
Item 5. MARKET FOR REGISTRANT’S COMMON EQUITY, RELATED STOCKHOLDER MATTERS, AND ISSUER PURCHASES OF EQUITY SECURITIES
6K characters. Original on sec.gov · Markdown
Item 5. MARKET FOR REGISTRANT’S COMMON EQUITY, RELATED STOCKHOLDER MATTERS, AND ISSUER PURCHASES OF EQUITY SECURITIES
Market Information
Our common stock is listed on The Nasdaq Global Select Market under the trading symbol “MU.”
Holders of Record
As of September 30, 2022, there were approximately 1,768 shareholders of record of our common stock. A substantially greater number of holders of our common stock are "street name" or beneficial holders, whose shares are held of record by banks, brokers, and other financial institutions.
Dividends
On September 29, 2022, we announced that our Board of Directors had declared a quarterly dividend of $0.115 per share, payable in cash on October 26, 2022, to shareholders of record as of the close of business on October 11, 2022.
We currently expect quarterly dividends to continue in future periods and aim to grow our dividend payments over time. However, the declaration and payment of any future cash dividends are at the discretion and subject to the approval of our Board of Directors. Our Board of Directors' decisions regarding the amount and payment of dividends will depend on many factors, such as our financial condition, results of operations, capital requirements, business conditions, debt service obligations, contractual restrictions, industry practice, legal requirements, regulatory constraints, and other factors that our Board of Directors may deem relevant. We cannot guarantee that we will continue to pay a dividend in any future period.
Equity Compensation Plan Information
The information required by this item is incorporated by reference from the information to be included in our 2022 Proxy Statement under the section entitled “Equity Compensation Plan Information,” which will be filed with the SEC within 120 days after September 1, 2022.
41 | 2022 10-K
Issuer Purchase of Equity Securities
Common Stock Repurchase Authorization
In May 2018, we announced that our Board of Directors authorized the discretionary repurchase of up to $10 billion of our outstanding common stock through open-market purchases, block trades, privately-negotiated transactions, derivative transactions, and/or pursuant to Rule 10b5-1 trading plans. The repurchase authorization has no expiration date, does not obligate us to acquire any common stock, and is subject to market conditions and our ongoing determination of the best use of available cash.
| Period | Total number of shares purchased | Average price paid per share | Total number of shares purchased as part of publicly announced plans or programs | Approximate dollar value of shares that may yet be purchased under publicly announced plans or programs (in millions) | ||||||||||||||||
| June 3, 2022 | – | July 7, 2022 | 4,038,489 | $ | 58.69 | 4,038,489 | ||||||||||||||
| July 8, 2022 | – | August 4, 2022 | 8,643,182 | 59.15 | 8,643,182 | |||||||||||||||
| August 5, 2022 | – | September 1, 2022 | 575,794 | 62.53 | 575,794 | |||||||||||||||
| 13,257,465 | $ | 59.16 | 13,257,465 | $3,531 |
Shares of common stock withheld as payment of withholding taxes and exercise prices in connection with the vesting or exercise of equity awards are also treated as common stock repurchases. Those withheld shares of common stock are not required to be disclosed under Item 703 of Regulation S-K and accordingly are excluded from the amounts in the table above.
Performance Graph
The following graph illustrates a five-year comparison of cumulative total returns for our common stock, the S&P 500 Composite Index, and the Philadelphia Semiconductor Index (SOX) from August 31, 2017, through August 31, 2022. We operate on a 52 or 53-week fiscal year which ends on the Thursday closest to August 31. Accordingly, the last day of our fiscal year varies. For consistent presentation and comparison to the industry indices shown herein, we have calculated our stock performance graph assuming an August 31 year end.
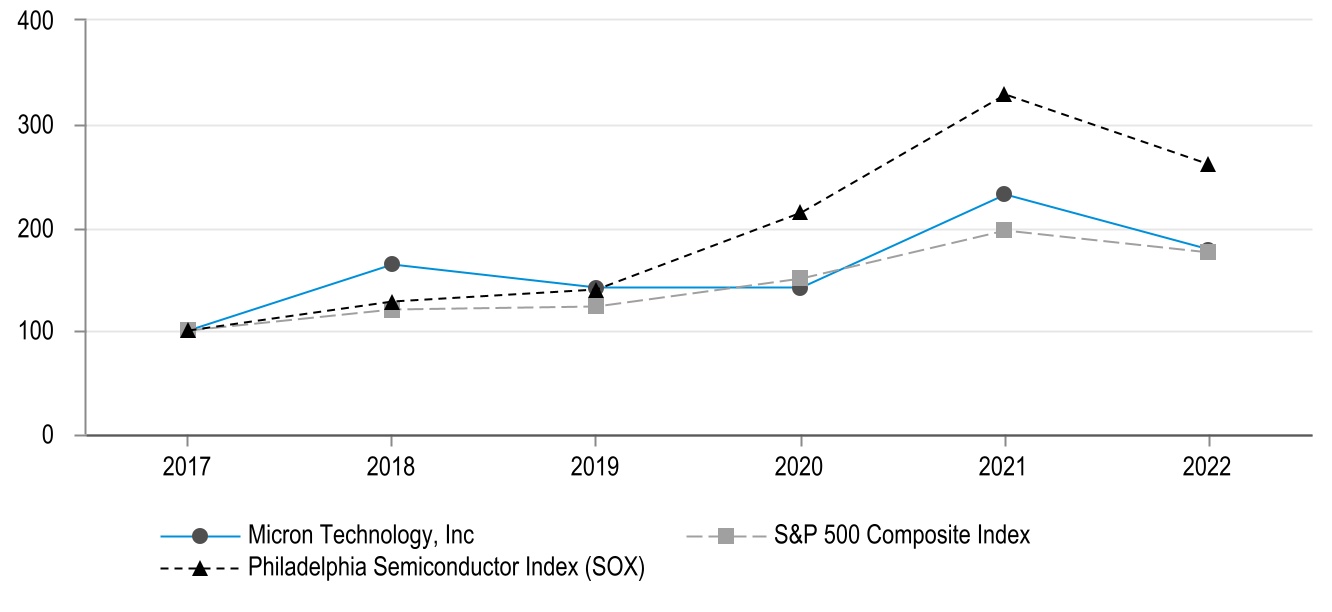
Note: Management cautions that the stock price performance information shown in the graph above may not be indicative of current stock price levels or future stock price performance.
 42
42
The performance graph above assumes $100 was invested on August 31, 2017 in common stock of Micron Technology, Inc., the S&P 500 Composite Index, and the Philadelphia Semiconductor Index (SOX). Any dividends paid during the period presented were assumed to be reinvested. The performance was plotted using the following data:
| 2017 | 2018 | 2019 | 2020 | 2021 | 2022 | |||||||||||||||
| Micron Technology, Inc. | $ | 100 | $ | 164 | $ | 142 | $ | 142 | $ | 231 | $ | 178 | ||||||||
| S&P 500 Composite Index | 100 | 120 | 123 | 150 | 197 | 175 | ||||||||||||||
| Philadelphia Semiconductor Index (SOX) | 100 | 128 | 140 | 214 | 328 | 260 |
Previous: Item 4. MINE SAFETY DISCLOSURES · Next: Item 6. [RESERVED]