 filings.tools
Item 5. Market for Registrant’s Common Equity, Related Stockholder Matters and Issuer Purchases of Equity Securities
5K characters. Original on sec.gov ·
Item 5. Market for Registrant’s Common Equity, Related Stockholder Matters and Issuer Purchases of Equity Securities
Market Information
NCLH’s ordinary shares are listed on the Nasdaq Global Select Market under the symbol “NCLH.” The table below sets forth the high and low sales prices of our ordinary shares as reported by the Nasdaq Global Select Market for the two most recent years by quarter:
2015
| High | Low | |||||||
|---|---|---|---|---|---|---|---|---|
| Fourth Quarter | $ | 64.27 | $ | 53.46 | ||||
| Third Quarter | 63.22 | 50.00 | ||||||
| Second Quarter | 57.55 | 48.03 | ||||||
| First Quarter | 55.35 | 42.55 |
2014
| High | Low | |||||||
|---|---|---|---|---|---|---|---|---|
| Fourth Quarter | $ | 48.16 | $ | 30.44 | ||||
| Third Quarter | 38.05 | 31.38 | ||||||
| Second Quarter | 34.18 | 29.08 | ||||||
| First Quarter | 37.30 | 31.61 |
Holders
As of February 24, 2016 there were 302 record holders of NCLH’s ordinary shares. Since certain of NCLH’s ordinary shares are held by brokers and other institutions on behalf of shareholders, the foregoing number is not representative of the number of beneficial owners.
Dividends
We intend to retain all currently available funds and as much as necessary of future earnings in order to fund the continued development and growth of our business. Our debt agreements also impose restrictions on the ability of our subsidiaries to pay distributions to NCLH and NCLH’s ability to pay dividends to its shareholders. Any determination to pay dividends in the future will be at the discretion of our Board of Directors and will depend upon our results of operations, financial condition, restrictions imposed by applicable law and our financing agreements and other factors that our Board of Directors deem relevant.
Purchases of Equity Securities by the Issuer
On April 29, 2014, NCLH’s Board of Directors authorized, and NCLH announced, a three-year share repurchase program for up to $500.0 million. NCLH may make repurchases in the open market, in privately negotiated transactions, or pursuant to accelerated share repurchase programs or structured share repurchase programs, and any repurchases may be made pursuant to Rule 10b5-1 plans.
Share repurchase activity during the three months ended December 31, 2015 was as follows:
| Period | Total Number of Shares Purchased as Part of a Publicly Announced Program (1) | Average Price Paid per Share | Approximate Dollar Value of Shares that May Yet be Purchased Under the Program (in thousands) | |||||||||
|---|---|---|---|---|---|---|---|---|---|---|---|---|
| October 1, 2015 - October 31, 2015 | — | $ | — | $ | 413,335 | |||||||
| November 1, 2015 - November 30, 2015 | 757,056 | $ | 56.70 | $ | 370,410 | |||||||
| December 1, 2015 – December 31, 2015 | 991,458 | $ | 57.40 | $ | 313,504 | |||||||
| Total for the three months ended December 31, 2015 | 1,748,514 | $ | 57.09 | $ | 313,504 |
| (1) | On December 17, 2015, we repurchased 348,553 ordinary shares under NCLH’s repurchase program as a part of a Secondary Equity Offering by the Apollo Holders and Genting HK for approximately $20.0 million. |
|---|
| 30 |
|---|
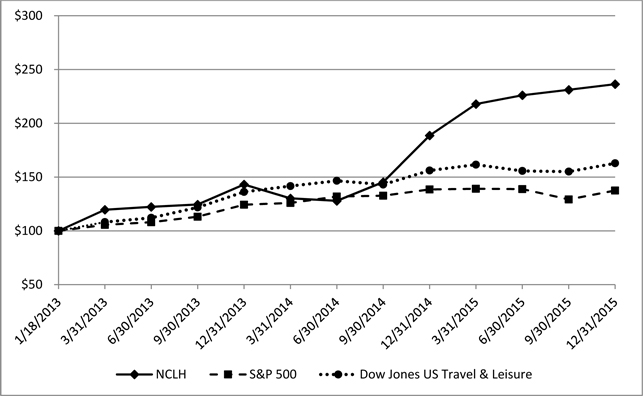
Stock Performance Graph
This performance graph shall not be deemed “soliciting material” or to be “filed” with the SEC for purposes of Section 18 of the Securities Exchange Act of 1934, as amended (the “Exchange Act”), or otherwise subject to the liabilities under that Section, and shall not be deemed to be incorporated by reference into any filing of NCLH under the Securities Act of 1933, as amended, or the Exchange Act.
The following graph shows a comparison (from January 18, 2013, the date our ordinary shares commenced trading on the Nasdaq Global Select Market, through December 31, 2015) of the cumulative total return for our ordinary shares, the Standard & Poor’s 500 Composite Stock Index and the Dow Jones United States Travel and Leisure index. The Stock Performance Graph assumes for comparison that the value of our ordinary shares and of each index was $100 prior to the commencement of trading on January 18, 2013. Past performance is not necessarily an indicator of future results. The stock prices used were as of the close of business on the respective dates.
Previous: Item 4. Mine Safety Disclosures · Next: Item 6. Selected Financial Data