 filings.tools
Norwegian Cruise Line Holdings 10-K 2019-12-31
Filed 2020-02-27. 22 sections, 413K characters. Original on sec.gov · Markdown · JSON
Cover and table of contents
UNITED STATES
SECURITIES AND EXCHANGE COMMISSION
Washington, D.C. 20549
FORM 10-K
(Mark One)
| ☒ | ANNUAL REPORT PURSUANT TO SECTION 13 OR 15(d) OF THE SECURITIES EXCHANGE ACT OF 1934 |
For the fiscal year ended December 31, 2019
OR
| ☐ | TRANSITION REPORT PURSUANT TO SECTION 13 OR 15(d) OF THE SECURITIES EXCHANGE ACT OF 1934 |
For the transition period from to
Commission file number: 001-35784
NORWEGIAN CRUISE LINE HOLDINGS LTD.
(Exact name of registrant as specified in its charter)
| Bermuda | 98-0691007 |
| (State or other jurisdiction of incorporation or organization) | (I.R.S. Employer Identification No.) |
7665 Corporate Center Drive**,** Miami**,** Florida 33126
(Address of principal executive offices) (zip code)
(305) 436-4000
(Registrant’s telephone number, including area code)
Securities registered pursuant to Section 12(b) of the Act:
| Title of each class | Trading Symbol(s) | Name of each exchange on which registered | ||
| Ordinary shares, par value $0.001 per share | NCLH | The New York Stock Exchange |
Securities registered pursuant to Section 12(g) of the Act: None
Indicate by check mark if the registrant is a well-known seasoned issuer, as defined in Rule 405 of the Securities Act. Yes ⌧ No ◻
Indicate by check mark if the registrant is not required to file reports pursuant to Section 13 or Section 15(d) of the Act. Yes ◻ No ⌧
Indicate by check mark whether the registrant (1) has filed all reports required to be filed by Section 13 or 15(d) of the Securities Exchange Act of 1934 during the preceding 12 months (or for such shorter period that the registrant was required to file such reports), and (2) has been subject to such filing requirements for the past 90 days. Yes ⌧ No ◻
Indicate by check mark whether the registrant has submitted electronically every Interactive Data File required to be submitted pursuant to Rule 405 of Regulation S-T (§ 232.405 of this chapter) during the preceding 12 months (or for such shorter period that the registrant was required to submit such files). Yes ⌧ No ◻
Indicate by check mark whether the registrant is a large accelerated filer, an accelerated filer, a non-accelerated filer, a smaller reporting company, or an emerging growth company. See the definitions of “large accelerated filer,” “accelerated filer,” “smaller reporting company” and “emerging growth company” in Rule 12b-2 of the Exchange Act.
| | |
|---|---|
| Large accelerated filer ☒ | Accelerated filer ◻ |
| Non-accelerated filer ◻ | Smaller reporting company ☐ |
| Emerging growth company ☐ |
If an emerging growth company, indicate by check mark if the registrant has elected not to use the extended transition period for complying with any new or revised financial accounting standards provided pursuant to Section 13(a) of the Exchange Act. ◻
Indicate by check mark whether the registrant is a shell company (as defined in Rule 12b-2 of the Act). Yes ☐ No ☒
As of June 28, 2019, the last business day of the registrant’s most recently completed second fiscal quarter, the aggregate market value of voting stock held by non-affiliates of the registrant based upon the closing sales price for the registrant’s ordinary shares as reported on The New York Stock Exchange was $11.5 billion.
There were 213,202,541 ordinary shares outstanding as of February 14, 2020.
Documents Incorporated by Reference
Portions of the Proxy Statement for the registrant’s 2020 Annual General Meeting of Shareholders, to be filed with the Securities and Exchange Commission not later than 120 days after December 31, 2019, are incorporated by reference in Part III herein.
NORWEGIAN CRUISE LINE HOLDINGS LTD.
TABLE OF CONTENTS
Terms Used in this Annual Report
Unless otherwise indicated or the context otherwise requires, references in this annual report to (i) the “Company,” “we,” “our” and “us” refer to NCLH (as defined below) and its subsidiaries, (ii) “NCLC” refers to NCL Corporation Ltd., (iii) “NCLH” refers to Norwegian Cruise Line Holdings Ltd., (iv) “Norwegian Cruise Line” or “Norwegian” refers to the Norwegian Cruise Line brand and its predecessors, (v) “Prestige” refers to Prestige Cruises International S. de R.L. (formerly Prestige Cruises International, Inc.), together with its consolidated subsidiaries, including Oceania Cruises S. de R.L. (formerly Oceania Cruises, Inc.) (“Oceania Cruises”) and Seven Seas Cruises S. de R.L. (“Regent”) (Oceania Cruises also refers to the brand by the same name and Regent also refers to the brand Regent Seven Seas Cruises), (vi) “Apollo” refers to Apollo Global Management, LLC, its subsidiaries and the affiliated funds it manages, (vii) “Genting HK” refers to Genting Hong Kong Limited and/or its affiliates, and (viii) “Sponsors” refers to Apollo, certain affiliates of TPG Global, LLC and/or Genting HK.
References to the “U.S.” are to the United States of America, and “dollars” or “$” are to U.S. dollars, the “U.K.” are to the United Kingdom and “euros” or “€” are to the official currency of the Eurozone.
This annual report includes certain non-GAAP financial measures, such as Net Revenue, Net Yield, Net Cruise Cost, Adjusted Net Cruise Cost Excluding Fuel, Adjusted EBITDA, Adjusted Net Income and Adjusted EPS. Definitions of these non-GAAP financial measures are included below. For further information about our non-GAAP financial measures including detailed adjustments made in calculating our non-GAAP financial measures and a reconciliation to the most directly comparable GAAP financial measure, we refer you to “Item 7—Management’s Discussion and Analysis of Financial Condition and Results of Operations.”
Unless otherwise indicated in this annual report, the following terms have the meanings set forth below:
| ● | Acquisition of Prestige. In November 2014, we acquired Prestige in a cash and stock transaction for total consideration of $3.025 billion, including the assumption of debt. |
|---|
| ● | Adjusted EBITDA. EBITDA adjusted for other income (expense), net and other supplemental adjustments. |
|---|
| ● | Adjusted EPS. Adjusted Net Income divided by the number of diluted weighted-average shares outstanding. |
|---|
| ● | Adjusted Net Cruise Cost Excluding Fuel. Net Cruise Cost Excluding Fuel adjusted for supplemental adjustments. |
|---|
| ● | Adjusted Net Income. Net income adjusted for supplemental adjustments. |
|---|
| ● | Allura Class Ships. Oceania Cruises’ two ships on order. |
|---|
| ● | Berths. Double occupancy capacity per cabin (single occupancy per studio cabin) even though many cabins can accommodate three or more passengers. |
|---|
| ● | Breakaway Class Ships. Norwegian Breakaway and Norwegian Getaway. |
|---|
| ● | Breakaway Plus Class Ships. Norwegian Escape, Norwegian Joy, Norwegian Bliss and Norwegian Encore. |
|---|
| ● | Capacity Days. Available Berths multiplied by the number of cruise days for the period. |
|---|
| ● | Constant Currency. A calculation whereby foreign currency-denominated revenue and expenses in a period are converted at the U.S. dollar exchange rate of a comparable period to eliminate the effects of foreign exchange fluctuations. |
|---|
| ● | Dry-dock. A process whereby a ship is positioned in a large basin where all of the fresh/sea water is pumped out in order to carry out cleaning and repairs of those parts of a ship which are below the water line. |
|---|
| ● | EBITDA. Earnings before interest, taxes, and depreciation and amortization. |
|---|
| ● | EPS. Earnings per share. |
|---|
| ● | Explorer Class Ships. Regent’s Seven Seas Explorer, Seven Seas Splendor, and an additional ship on order. |
|---|
| ● | GAAP. Generally accepted accounting principles in the U.S. |
|---|
| ● | Gross Cruise Cost. The sum of total cruise operating expense and marketing, general and administrative expense. |
|---|
| ● | Gross Tons. A unit of enclosed passenger space on a cruise ship, such that one gross ton equals 100 cubic feet or 2.831 cubic meters. |
|---|
| ● | Gross Yield. Total revenue per Capacity Day. |
|---|
| ● | IMO. International Maritime Organization, a United Nations agency that sets international standards for shipping. |
|---|
| ● | IPO. The initial public offering of 27,058,824 ordinary shares, par value $0.001 per share, of NCLH, which was consummated on January 24, 2013. |
|---|
| ● | Net Cruise Cost. Gross Cruise Cost less commissions, transportation and other expense and onboard and other expense. |
|---|
| ● | Net Cruise Cost Excluding Fuel. Net Cruise Cost less fuel expense. |
|---|
| ● | Net Revenue. Total revenue less commissions, transportation and other expense and onboard and other expense. |
|---|
| ● | Net Yield. Net Revenue per Capacity Day. |
|---|
| ● | Occupancy Percentage. The ratio of Passenger Cruise Days to Capacity Days. A percentage greater than 100% indicates that three or more passengers occupied some cabins. |
|---|
| ● | Passenger Cruise Days. The number of passengers carried for the period, multiplied by the number of days in their respective cruises. |
|---|
| ● | Project Leonardo. The next generation of ships for our Norwegian brand. |
|---|
| ● | Revolving Loan Facility. $875.0 million senior secured revolving credit facility. |
|---|
| ● | SEC. U.S. Securities and Exchange Commission. |
|---|
| ● | Secondary Equity Offering(s). Secondary public offering(s) of NCLH’s ordinary shares in December 2018, March 2018, November 2017, August 2017, December 2015, August 2015, May 2015, March 2015, March 2014, December 2013 and August 2013. |
|---|
| ● | Shipboard Retirement Plan. An unfunded defined benefit pension plan for certain crew members which computes benefits based on years of service, subject to certain requirements. |
|---|
Cautionary Statement Concerning Forward-Looking Statements
Certain statements in this annual report constitute forward-looking statements within the meaning of the U.S. federal securities laws intended to qualify for the safe harbor from liability established by the Private Securities Litigation Reform Act of 1995. All statements other than statements of historical facts contained, or incorporated by reference, in this annual report, including, without limitation, those regarding our business strategy, financial position, results of operations, plans, prospects and objectives of management for future operations (including expected fleet additions, development plans, objectives relating to our activities and expected performance in new markets), are forward-looking statements. Many, but not all, of these statements can be found by looking for words like “expect,” “anticipate,” “goal,” “project,” “plan,” “believe,” “seek,” “will,” “may,” “forecast,” “estimate,” “intend,” “future” and similar words. Forward-looking statements do not guarantee future performance and may involve risks, uncertainties and other factors which could cause our actual results, performance or achievements to differ materially from the future results, performance or achievements expressed or implied in those forward-looking statements. Examples of these risks, uncertainties and other factors include, but are not limited to the impact of:
| • | adverse events impacting the security of travel, such as terrorist acts, armed conflict and threats thereof, acts of piracy, and other international events; |
|---|
| • | adverse incidents involving cruise ships; |
|---|
| • | adverse general economic and related factors, such as fluctuating or increasing levels of unemployment, underemployment and the volatility of fuel prices, declines in the securities and real estate markets, and perceptions of these conditions that decrease the level of disposable income of consumers or consumer confidence; |
|---|
| • | the spread of epidemics and viral outbreaks; |
|---|
| • | breaches in data security or other disturbances to our information technology and other networks or our actual or perceived failure to comply with requirements regarding data privacy and protection; |
|---|
| • | changes in fuel prices and the type of fuel we are permitted to use and/or other cruise operating costs; |
|---|
| • | mechanical malfunctions and repairs, delays in our shipbuilding program, maintenance and refurbishments and the consolidation of qualified shipyard facilities; |
|---|
| • | the risks and increased costs associated with operating internationally; |
|---|
| • | fluctuations in foreign currency exchange rates; |
|---|
| • | the unavailability of ports of call; |
|---|
| • | overcapacity in key markets or globally; |
|---|
| • | our expansion into and investments in new markets; |
|---|
| • | our inability to obtain adequate insurance coverage; |
|---|
| • | our indebtedness and restrictions in the agreements governing our indebtedness that limit our flexibility in operating our business, including the significant portion of assets that are collateral under these agreements; |
|---|
| • | pending or threatened litigation, investigations and enforcement actions; |
|---|
| • | volatility and disruptions in the global credit and financial markets, which may adversely affect our ability to borrow and could increase our counterparty credit risks, including those under our credit facilities, derivatives, contingent obligations, insurance contracts and new ship progress payment guarantees; |
|---|
| • | our inability to recruit or retain qualified personnel or the loss of key personnel or employee relations issues; |
|---|
| • | our reliance on third parties to provide hotel management services for certain ships and certain other services; |
|---|
| • | future increases in the price of, or major changes or reduction in, commercial airline services; |
|---|
| • | our inability to keep pace with developments in technology; |
|---|
| • | changes involving the tax and environmental regulatory regimes in which we operate; and |
|---|
| • | other factors set forth under “Risk Factors.” |
|---|
The above examples are not exhaustive and new risks emerge from time to time. Such forward-looking statements are based on our current beliefs, assumptions, expectations, estimates and projections regarding our present and future business strategies and the environment in which we expect to operate in the future. These forward-looking statements speak only as of the date made. We expressly disclaim any obligation or undertaking to release publicly any updates or revisions to any forward-looking statement to reflect any change in our expectations with regard thereto or any change of events, conditions or circumstances on which any such statement was based, except as required by law.
PART I
Item 1. Business
History and Development of the Company
Norwegian commenced operations from Miami in 1966, launching the modern cruise industry by offering weekly departures from Miami to the Caribbean. In February 2011, NCLH, a Bermuda limited company, was formed with the issuance to the Sponsors of, in aggregate, 10,000 ordinary shares, with a par value of $0.001 per share. In January 2013, NCLH completed its IPO and the ordinary shares of NCLC, which were owned entirely by the Sponsors, were exchanged for the ordinary shares of NCLH, and NCLH became the owner of 100% of the ordinary shares and parent company of NCLC (the “Corporate Reorganization”). At the same time, NCLH contributed $460.0 million to NCLC and the historical financial statements of NCLC became those of NCLH. The Corporate Reorganization was affected solely for the purpose of reorganizing our corporate structure. As a result of the Secondary Equity Offerings, as of December 2018, the Sponsors no longer owned the ordinary shares they held in NCLH.
In November 2014, we completed the Acquisition of Prestige. We believe that the combination of Norwegian and Prestige creates a cruise operating company with a rich product portfolio and strong market presence.
Additional Information
Our registered offices are located at Walkers Corporate (Bermuda) Limited, Park Place, 3rd Floor, 55 Par-la-Ville Road, Hamilton HM 11, Bermuda. Our principal executive offices are located at 7665 Corporate Center Drive, Miami, Florida 33126. Daniel S. Farkas, the Company’s Executive Vice President, General Counsel and Assistant Secretary, is our agent for service of process at our principal executive offices.
Our Company
Business Overview
We are a leading global cruise company which operates the Norwegian Cruise Line, Oceania Cruises and Regent Seven Seas Cruises brands. As of December 31, 2019, we had 27 ships with approximately 58,400 Berths and had orders for 10 additional ships through 2027, subject to certain conditions.
Seven Seas Splendor was delivered in January 2020. We have one additional Explorer Class Ship on order for delivery in the fall of 2023. We have two Allura Class Ships on order for delivery in the winter of 2022 and spring of 2025. Project Leonardo will introduce an additional six ships with expected delivery dates from 2022 through 2027. These additions to our fleet will increase our total Berths to approximately 82,000.
Our brands offer itineraries to worldwide destinations including Europe, Asia, Australia, New Zealand, South America, Africa, Canada, Bermuda, Caribbean, Alaska and Hawaii. Norwegian’s U.S.-flagged ship, Pride of America, provides the industry’s only entirely inter-island itinerary in Hawaii.
All of our brands offer an assortment of features, amenities and activities, including a variety of accommodations, multiple dining venues, bars and lounges, spa, casino and retail shopping areas and numerous entertainment choices. All brands also offer a selection of shore excursions at each port of call as well as hotel packages for stays before or after a voyage.
Our Fleet
The following table presents information about our ships and their primary areas of operation based on current and future itineraries, which are subject to change.
| | ||||||
|---|---|---|---|---|---|---|
| Ship (1) | Year Built | Primary Areas of Operation | ||||
| | | | | | | |
| Norwegian | | | | |||
| Norwegian Encore | | 2019 | | Alaska, Bermuda, Canada & New England, Caribbean | | |
| Norwegian Bliss | | 2018 | | Alaska, Bahamas, Caribbean, Mexico-Pacific | | |
| Norwegian Joy | | 2017 | | Alaska, Bermuda, Canada & New England, Caribbean, Central America, Mexico-Pacific | | |
| Norwegian Escape | | 2015 | | Caribbean, Europe | | |
| Norwegian Getaway | | 2014 | | Bahamas, Caribbean, Europe | | |
| Norwegian Breakaway | | 2013 | | Bahamas, Bermuda, Canada & New England, Caribbean | | |
| Norwegian Epic | | 2010 | | Caribbean, Europe | | |
| Norwegian Gem | | 2007 | | Bermuda, Canada & New England, Caribbean, Mexico-Pacific | | |
| Norwegian Jade | | 2006 | | Africa, Asia, Caribbean, Europe | | |
| Norwegian Pearl | | 2006 | | Bahamas, Canada & New England, Caribbean, Europe, | | |
| Norwegian Jewel | | 2005 | | Alaska, Australia & New Zealand, Hawaii, South Pacific | | |
| Pride of America | | 2005 | | Hawaii | | |
| Norwegian Dawn | | 2002 | | Asia, Bahamas, Bermuda, Caribbean, Europe | | |
| Norwegian Star | | 2001 | | Europe, South America | | |
| Norwegian Sun | | 2001 | | Alaska, Bahamas, Caribbean, Central America | | |
| Norwegian Sky | | 1999 | | Bahamas, Caribbean | | |
| Norwegian Spirit | | 1998 | | Africa, Asia, Europe | | |
| | | | | | | |
| Oceania Cruises | | | | | ||
| Oceania Riviera | | 2012 | | Caribbean, Europe | | |
| Oceania Marina | | 2011 | | Europe, South America | | |
| Oceania Nautica | | 2000 | | Africa, Asia, Europe | | |
| Oceania Sirena | | 1999 | | Africa, Asia, Caribbean, Europe | | |
| Oceania Regatta | | 1998 | | Alaska, Asia, Australia & New Zealand, Central America, South Pacific | | |
| Oceania Insignia | | 1998 | | Africa, Alaska, Asia, Bermuda, Canada & New England, Caribbean, Europe, Hawaii, Mexico-Pacific, South America, South Pacific | | |
| Regent | ||||||
| Seven Seas Splendor (2) | | 2020 | | Caribbean, Central America, Europe | | |
| Seven Seas Explorer | | 2016 | | Alaska, Asia, Australia & New Zealand, Caribbean, Europe | | |
| Seven Seas Voyager | | 2003 | | Africa, Asia, Australia & New Zealand, Europe, South America | | |
| Seven Seas Mariner | | 2001 | | Alaska, Asia, Australia & New Zealand, Caribbean, Europe, South America | | |
| Seven Seas Navigator | | 1999 | | Australia & New Zealand, Canada & New England, Caribbean, Central America, Europe, Hawaii, South America, South Pacific | |
| (1) | The table above does not include an additional 9 ships on order. |
|---|
| (2) | Seven Seas Splendor was delivered in January 2020. |
|---|
Our Mission and Competitive Strengths
Our core mission is to provide exceptional vacation experiences delivered by passionate team members committed to world-class hospitality and innovation. We believe that the following business strengths support our overall strategy to deliver on our mission:
Rich Stateroom Mix
The Norwegian, Oceania Cruises and Regent fleets offer an attractive mix of staterooms, suites and villas. Norwegian’s accommodations include the groundbreaking Studio staterooms designed for solo travelers centered around the Studio Lounge, a private lounge area solely for Studio guests, as well as ocean views, balconies and connecting accommodations to meet the needs of all types of cruisers. Norwegian’s suites range from two-bedroom family suites to penthouses and owner suites, as well as three-bedroom Garden Villas measuring up to 6,694 square feet. In addition, 11 of Norwegian’s ships offer The Haven, a key-card access enclave on the upper decks with luxurious suite accommodations, exclusive amenities, and 24/7 butler and concierge service. The Haven suites surround a private courtyard with pool, hot tubs, sundeck, fitness center and steam rooms. On board Norwegian Epic, the Breakaway Class Ships and the Breakaway Plus Class Ships, The Haven also includes a private lounge and fine dining restaurant.
The spacious and elegant accommodations on Oceania Cruises’ six award-winning ships, the 684-Berth Regatta, Insignia, Sirena and Nautica, and the 1,250-Berth Marina and Riviera, range from 143-square foot inside staterooms to opulent 2,030-square foot owner suites. The Regent fleet is comprised of five ships. Seven Seas Voyager, Seven Seas Mariner, Sev
Showing the first 8K of 78K characters. Open the full section
Item 1A. Risk Factors
In addition to the other information contained in this annual report, you should carefully consider the following risk factors in evaluating us and our business. If any of the risks discussed in this annual report actually occur, our business, financial condition and results of operations could be materially adversely affected. Additional risks and uncertainties not currently known to us or that we currently deem to be immaterial may also materially adversely affect our business, financial condition and results of operations. The ordering of the risk factors set forth below is not intended to reflect an indication of priority or likelihood. In connection with the forward-looking statements that appear in this annual report, you should also carefully review the cautionary statement referred to under “Cautionary Statement Concerning Forward–Looking Statements.”
Risks Related to the Company
Terrorist acts, armed conflict and threats thereof, acts of piracy, and other international events impacting the security of travel could adversely affect the demand for cruises.
The threat or possibility of future terrorist acts, an outbreak of hostilities or armed conflict abroad or the possibility or fear of such events, political unrest and instability, the issuance of travel advisories or elevated national threat warnings by national governments, an increase in the activity of pirates, and other geo-political uncertainties have had in the past and may again in the future have an adverse impact on the demand for cruises, and consequently, the pricing for cruises. Decreases in demand and reduced pricing in response to such decreased demand would adversely affect our business by reducing our profitability.
Adverse incidents involving cruise ships may adversely affect our business, financial condition and results of operations.
The operation of cruise ships carries an inherent risk of loss caused by adverse weather conditions and maritime disasters, including, but not limited to, oil spills and other environmental mishaps, extreme weather conditions such as hurricanes, floods and typhoons, fire, mechanical failure, collisions, human error, war, terrorism, piracy, political action, civil unrest and insurrection in various countries and other circumstances or events. Any such event may result in loss of life or property, loss of revenue or increased costs and the frequency and severity of natural disasters may increase due to climate change. The operation of cruise ships also involves the risk of other incidents at sea or while in port, including missing guests, inappropriate crew or passenger behavior and onboard crimes, which may bring into question passenger safety, may adversely affect future industry performance and may lead to litigation against us. Although we place passenger safety as the highest priority in the design and operation of our fleet, we have experienced accidents and other incidents involving our cruise ships and there can be no assurance that similar events will not occur in the future. It is possible that we could be forced to cancel a cruise or a series of cruises due to these factors or incur increased port-related and other costs resulting from such adverse events. Any such event involving our cruise ships or other passenger cruise ships may adversely affect guests’ perceptions of safety or result in increased governmental or other regulatory oversight. An adverse judgment or settlement in respect of any of the ongoing claims against us may also lead to negative publicity about us. The expanded use of social media has increased the speed that negative publicity spreads and makes it more difficult to mitigate reputational damage. Anything that damages our reputation (whether or not justified), including adverse publicity about passenger safety, could have an adverse impact on demand, which could lead to price discounting and a reduction in our sales and could adversely affect our business, financial condition and
results of operations. If there is a significant accident, mechanical failure or similar problem involving a ship, we may have to place a ship in an extended Dry-dock period for repairs. This could result in material lost revenue and/or increased expenditures.
The adverse impact of general economic and related factors, such as fluctuating or increasing levels of unemployment, underemployment and the volatility of fuel prices, declines in the securities and real estate markets and perceptions of these conditions can decrease the level of disposable income of consumers or consumer confidence. The demand for cruises is affected by international, national and local economic conditions.
The demand for cruises is affected by international, national and local economic conditions. Adverse changes in the perceived or actual economic climate in North America or globally, such as the volatility of fuel prices, higher interest rates, stock and real estate market declines and/or volatility, more restrictive credit markets, higher unemployment or underemployment rates, higher taxes, changes in governmental policies and political developments impacting international trade, trade disputes and increased tariffs, could reduce the level of discretionary income or consumer confidence in the countries from which we source our guests. Consequently, this may negatively affect demand for cruise vacations in these countries, which are a discretionary purchase. Decreases in demand for cruise vacations could result in price discounting, which, in turn, could reduce the profitability of our business. In addition, these conditions could also impact our suppliers, which could result in disruptions in our suppliers’ services and financial losses for us.
Epidemics and viral outbreaks could have an adverse effect on our business, financial condition and results of operations.
Public perception about the safety of travel and adverse publicity related to passenger or crew illness, such as incidents of viral illnesses, stomach flu or other contagious diseases may impact demand for cruises and result in cruise cancellations and employee absenteeism. For example, the recent outbreak of the COVID-19 coronavirus has resulted in costs and lost revenue related to customer compensation, itinerary modifications, travel restrictions and advisories, the unavailability of ports and/or destinations, cancellations and redeployments and has impacted consumer sentiment regarding cruise travel. The spread of the COVID-19 coronavirus, particularly in North America, could exacerbate its effect on us. Any future wide-ranging health scares would also likely adversely affect our business, financial condition and results of operations.
Breaches in data security or other disturbances to our information technology and other networks or our actual or perceived failure to comply with requirements regarding data privacy and protection could impair our operations, subject us to significant fines, penalties and damages, and have a material adverse impact on our business, financial condition and results of operations.
The integrity and reliability of our information technology systems and networks are crucial to our business operations and disruptions to these systems or networks could impair our operations, have an adverse impact on our financial results and negatively affect our reputation and customer demand. In addition, certain networks are dependent on third-party technologies, systems and service providers for which there is no certainty of uninterrupted availability. Among other things, actual or threatened natural disasters, information systems failures, computer viruses, denial of service attacks and other cyber-attacks may cause disruptions to our information technology, telecommunications and other networks. Our business continuity, disaster recovery, data restoration plans and data and information technology security may not prevent disruptions that could result in adverse effects on our operations and financial results. We carry limited business interruption insurance for certain shoreside operations, subject to limitations, exclusions and deductibles.
As part of our ordinary business operations, we and certain of our third-party service providers collect, process, transmit and store a large volume of personally identifiable information. The security of the systems and networks where we and our service providers store this data is a critical element of our business. Our systems and networks may be vulnerable to computer viruses, malware, worms, hackers and other security issues, including physical and electronic break-ins, router disruption, sabotage or espionage, disruptions from unauthorized access and tampering (including through social engineering such as phishing attacks), impersonation of authorized users and coordinated denial-of-service attacks. For example, in October 2018, we discovered limited instances of unauthorized access to certain employee e-mail communications, some of which contained proprietary business and personally identifiable information. We have
implemented additional safeguards, and we do not believe that we experienced any material losses related to this incident; however, there can be no assurance that this or any other breach or incident will not have a material impact on our operations and financial results in the future. In addition, we may not be in a position to promptly address security breaches, unauthorized access or other cyber-attacks or incidents or to implement adequate preventative measures if we are unable to immediately detect such incidents. Our failure to successfully prevent, mitigate or timely respond to such incidents could impair our ability to conduct business and damage our reputation.
We are also subject to laws in multiple jurisdictions relating to the privacy and protection of personal data, including the European Union’s General Data Protection Regulation and the California Consumer Privacy Act. Noncompliance with these and other privacy laws or the compromise of information systems used by us or our service providers resulting in the loss, disclosure, misappropriation of or access to the personally identifiable information of our guests, prospective guests, employees or vendors could result in governmental investigation, civil liability or regulatory penalties under laws protecting the privacy of personal information, any or all of which could disrupt our operations and materially adversely affect our business. Additionally, any material failure by us or our service providers to maintain compliance with the Payment Card Industry security requirements or to rectify a data security issue may result in fines and restrictions on our ability to accept credit cards as a form of payment. The regulatory framework for data privacy and protection is uncertain for the foreseeable future, and it is possible that legal and regulatory obligations may continue to increase and may be interpreted and applied in a manner that is inconsistent or possibly conflicting from one jurisdiction to another.
In the event of a data security breach of our systems and/or third-party systems or a cyber-attack or other cyber incident, we may incur costs associated with the following: response, notification, forensics, regulatory investigations, public relations, consultants, credit identity monitoring, credit freezes, fraud alert, credit identity restoration, credit card cancellation, credit card reissuance or replacement, data restoration, regulatory fines and penalties, vendor fines and penalties, legal fees, damages and settlements. In addition, data security breaches, a cyber-attack or other cyber incident may cause business interruption, information technology disruption, disruptions as a result of regulatory investigation or litigation, digital asset loss related to corrupted or destroyed data, loss of company assets, damage to our reputation, damages to intangible property and other intangible damages, such as loss of consumer confidence, all of which could impair our operations and have an adverse impact on our financial results.
Changes in fuel prices and the type of fuel we are permitted to use and/or other cruise operating costs would impact the cost of our cruise ship operations and our hedging strategies may not protect us from increased costs related to fuel prices.
Fuel expense is a significant cost for our Company. Future increases in the cost of fuel globally or regulatory requirements which require us to use more expensive types of fuel would increase the cost of our cruise ship operations. For example, as of January 2020, the IMO’s convention entitled Prevention of Pollution from Ships (MARPOL) set a global limit on fuel sulfur content of 0.5% (reduced from the previous 3.5% global limit). Various compliance methods, such as the use of low-sulfur fuels or exhaust gas cleaning systems that reduce an equivalent amount of sulfur emissions, may be utilized. We have elected to install exhaust gas cleaning systems on some ships in our fleet, which will allow us to continue to use high-sulfur fuel on those ships in certain areas. However, if exhaust gas cleaning systems are not widely used in the industry, low demand for high-sulfur fuel may increase the price for such fuel. Ships in our fleet that do not have exhaust gas cleaning systems, and in specified areas even ships with exhaust gas cleaning systems, will be required to use low-sulfur fuels. Low-sulfur fuels may be costly due to increased demand and scarcity if suppliers are not able to produce sufficient quantities. In addition, we could experience increases in other cruise operating costs due to market forces and economic or political instability resulting from increases or volatility in fuel expense. Our hedging program may not be successful in mitigating higher fuel costs, and any price protection provided may be limited due to market conditions, including choice of hedging instruments, breakdown of correlation between hedging instrument and market price of fuel and failure of hedge counterparties. To the extent that we use hedge contracts that have the potential to create an obligation to pay upon settlement if fuel prices decline significantly, such hedge contracts may limit our ability to benefit fully from lower fuel costs in the future. There can be no assurance that our hedging arrangements will be cost-effective or that our counterparties will be able to perform under our hedging arrangements. Additionally, deterioration in our financial condition could negatively affect our ability to enter into new hedge contracts in the future.
Mechanical malfunctions and repairs, delays in our shipbuilding program, maintenance and refurbishments and the consolidation of qualified shipyard facilities could adversely affect our results of operations and financial condition.
The new construction, refurbishment, repair and maintenance of our ships are complex processes and involve risks similar to those encountered in other large and sophisticated equipment construction, refurbishment and repair projects. Our ships are subject to the risk of mechanical failure or accident, which we have occasionally experienced and have had to repair. For example, in the past we have had to delay or cancel cruises due to mechanical issues on our ships. There can be no assurance that we will not experience similar events in the future. If there is a mechanical failure or accident in the future, we may be unable to procure spare parts when needed or make repairs without incurring material expense or suspension of service, especially if a problem affects certain specialized maritime equipment, such as the radar, a pod propulsion unit, the electrical/power management system, the steering gear or the gyro system.
In addition, availability, work stoppages, insolvency or financial problems in the shipyards’ construction, refurbishment or repair of our ships, or other “force majeure” events that are beyond our control and the control of shipyards or subcontractors, could also delay or prevent the newbuild delivery, refurbishment and repair and maintenance of our ships. Any termination or breach of contract following such an event may result in, among other things, the forfeiture of prior deposits or payments made by us, potential claims and impairment of losses. A significant delay in the delivery of a new ship, or a significant performance deficiency or mechanical failure of a new ship could also have an adverse effect on our business. The consolidation of the control of certain European cruise shipyards could result in higher prices for the construction of new ships and refurbishments and could limit the availability of qualified shipyards to construct new ships. Also, the lack of qualified shipyard repair facilities could result in the inability to repair and maintain our ships on a timely basis. These potential events and the associated losses, to the extent that they are not adequately covered by contractual remedies or insurance, could adversely affect our results of operations and financial condition.
Conducting business internationally may result in increased costs and risks.
We operate our business internationally and plan to continue to develop our international presence. Operating internationally exposes us to a number of risks, including political risks, risks of increases in duties and taxes, risks relating to anti-bribery laws, as well as risks that laws and policies affecting cruising, vacation or maritime businesses, or governing the operations of foreign-based companies may change. Additional risks include imposition of trade barriers, withholding and other taxes on remittances and other payments by subsidiaries and changes in and application of foreign taxation structures, including value added taxes. If we are unable to address these risks adequately, our business, financial condition and results of operations could be materially and adversely affected.
Operating internationally also exposes us to numerous and sometimes conflicting legal and regulatory requirements. In many parts of the world, including countries in which we operate, practices in the local business communities might not conform to international business standards. We have implemented safeguards and policies to prevent violations of various anti-corruption laws that prohibit improper payments or offers of payments to foreign governments and their officials for the purpose of obtaining or retaining business by our employees and agents. However, our existing safeguards and policies and any future improvements may prove to be less than effective and our employees or agents may engage in conduct prohibited by our policies, but for which we nevertheless may be held responsible. If our employees or agents violate our policies, if we fail to maintain adequate record-keeping and internal accounting practices to accurately record our transactions or if we fail to implement or maintain other adequate safeguards, we may be subject to regulatory sanctions or severe criminal or civil sanctions and penalties.
We have operations in and source passengers from the U.K. and member countries of the European Union. Effective as of January 31, 2020, the U.K. withdrew from the European Union, commonly referred to as “Brexit.” During a transition period (set to expire on December 31, 2020), it will remain in the single market and be subject to the European Union’s rules and regulations while the British government continues to negotiate the terms of the U.K.’s future relationship with the European Union. The outcome of these negotiations is uncertain, and we do not know to what extent Brexit will ultimately impact the business environment in the U.K., the rest of the European Union, or other countries. The withdrawal could also adversely affect tax, legal and regulatory regimes to which our business in the region is subject and disrupt the free movement of goods, services and people between the U.K. and the European
Union, which could make it more difficult to source passengers from these regions. These events could have a material adverse effect on our business, financial condition and results of operations.
Fluctuations in foreign currency exchange rates could adversely affect our financial results.
We earn revenues, pay expenses, purchase and own assets and incur liabilities in currencies other than the U.S. dollar; most significantly a portion of our revenue and expenses are denominated in foreign currencies, particularly British pound, Canadian dollar, euro and Australian dollar. Because our consolidated financial statements are presented in U.S. dollars, we must translate revenues and expenses, as well as assets and liabilities, into U.S. dollars at exchange rates in effect during or at the end of each reporting period. The strengthening of the U.S. dollar against our other major currencies may adversely affect our U.S. dollar financial results and will reduce the U.S. dollar amount received upon conversion of these currencies into U.S. dollars.
We have historically and may in the future enter into ship construction contracts denominated in euros or other foreign currencies. While we have entered into foreign currency derivatives to manage a portion of the currency risk associated with such contracts, we are exposed to fluctuations in the euro exchange rate for the portions of the ship construction contracts that have not been hedged. Additionally, if the shipyard is unable to perform under the related ship construction contract, any foreign currency hedges that were entered into to manage the currency risk would need to be terminated.
Unavailability of ports of call may materially adversely affect our business, financial condition and results of operations.
We believe that attractive port destinations are a major reason why guests choose to go on a particular cruise or on a cruise vacation. The availability of ports, including the specific port facility at which our guests will embark and disembark, is affected by a number of factors, including, but not limited to, existing capacity constraints, security, safety, health and environmental concerns, adverse weather conditions and natural disasters such as hurricanes, floods, typhoons and earthquakes, financial limitations on port development, political instability, exclusivity arrangements that ports may have with our competitors, local governmental regulations and fees, local community concerns about port development and other adverse impacts on their communities from additional tourists and sanctions programs implemented by the Office of Foreign Assets Control of the United States Treasury Department or other regulatory bodies. For example, we had to temporarily change certain itineraries in the Caribbean due to damage some ports sustained during an active hurricane season in 2017. There can be no assurance that our ports of call will not be similarly affected in the future. Additionally, in June 2019, the Office of Foreign Assets Control of the United States Department of the Treasury removed the authorization for group people-to-people educational travel by U.S. persons to Cuba. Concurrently, the United States Department of Commerce’s Bureau of Industry and Security removed the authorization to travel for most non-commercial aircraft and all passenger and recreational vessels, including cruise ships, on temporary sojourn in Cuba. Combined, these rulings effectively eliminated the ability of cruise lines to offer cruise travel to Cuba. Due to environmental and over-crowding concerns, some local governments have begun to take measures to limit the number of cruise ships and passengers allowed at certain destinations. For example, Dubrovnik, Venice and Barcelona have either implemented or considered implementing such limitations on cruise ships and passengers. Limitations on the availability of ports of call or on the availability of shore excursions and other service providers at such ports have adversely affected our business, financial condition and results of operations in the past and could do so in the future.
Overcapacity in key markets or globally could adversely affect our operating results.
We continue to expand our fleet through our newbuild program and expect to add nine additional ships to our fleet through 2027. Our competitors have also announced similar expansions to their fleets. These increases in capacity in the cruise industry globally and potential overcapacity in certain key markets may cause us to lower pricing, which would reduce profitability and adversely affect our results of operations. Additionally, older ships in our fleet may not be as competitive as new ships enter the market and we may not be able to sell such older ships at optimal prices.
Our expansion into and investments in new markets may not be successful.
We believe there remains significant opportunity to expand our passenger sourcing into major markets, such as Europe and Australia, as well as into emerging markets and to expand our itineraries in new markets, and we are in the process of such expansion efforts. Expansion into new markets requires significant levels of investment and attention from management. There can be no assurance that these markets will develop as anticipated or that we will have success in these markets, and if we do not, we may be unable to recover our investment spent to expand our business into these markets and may forgo opportunities in more lucrative markets, which could adversely impact our business, financial condition and results of operations.
Our inability to obtain adequate insurance coverage may adversely affect our business, financial condition and results of operations.
There can be no assurance that our risks are fully insured against or that any particular claim will be fully paid by our insurance. Such losses, to the extent they are not adequately covered by contractual remedies or insurance, could affect our financial results. In addition, we have been and continue to be subject to calls, or premiums, in amounts based not only on our own claim records, but also the claim records of all other members of the protection and indemnity associations through which we receive indemnity coverage for tort liability. Our payment of these calls and increased premiums could result in significant expenses to us. If we, or other members of our protection and indemnity associations, were to sustain significant losses in the future, our ability to obtain insurance coverage at commercially reasonable rates or at all could be materially adversely affected. For example, in the past our protection and indemnity associations have increased certain deductibles and determined not to cover certain categories of claims. Moreover, irrespective of the occurrence of such events, there can still be no assurance that we will be able to obtain adequate insurance coverage at commercially reasonable rates or at all.
Our indebtedness, and the agreements governing our indebtedness, may limit our flexibility in operating our business and a significant portion of our assets, including many of our ships, are collateral under our debt agreements.
A substantial portion of our cash flow from operations is dedicated to the repayment of our indebtedness, which may limit our available funds for other business functions and strategic opportunities and may make us more vulnerable to downturns in our business, the economy and the industry in which we operate. We may not be able to generate sufficient cash to service our indebtedness, and may be forced to take other actions to satisfy our obligations under our indebtedness, including refinancing our indebtedness, which may not be successful. Any refinancing of our debt could be at higher interest rates and may require us to comply with more onerous covenants, which could further restrict our business operations.
In addition, the agreements governing our indebtedness contain, and any instruments governing future indebtedness of ours may contain, covenants that impose significant operating and financial restrictions on us, including restrictions or prohibitions on our ability to, among other things: incur or guarantee additional debt or issue certain preference shares; pay dividends on or make distributions in respect of our share capital or make other restricted payments, including the ability of NCLH’s subsidiaries, including NCLC, to pay dividends or make distributions to NCLH; repurchase or redeem capital stock or subordinated indebtedness; make certain investments or acquisitions; transfer, sell or create liens on certain assets; and consolidate or merge with, or sell or otherwise dispose of all or substantially all of our assets to other companies. As a result of these covenants, we are limited in the manner in which we conduct our business, and we may be unable to engage in favorable business activities or finance future operations or capital needs.
Our existing debt agreements also require us, and any instruments governing future indebtedness of ours may require us, to maintain minimum level of liquidity, as well as limit our net funded debt-to-capital ratio and maintain certain other financial ratios. Our ability to meet those financial ratios can be affected by events beyond our control, and there can be no assurance that we will meet those ratios. A failure to comply with the covenants contained in our debt agreements could result in an event of default under such agreements, which, if not cured or waived, could have a material adverse
effect on our business, financial condition and results of operations. In the event of any default under our debt agreements, the holders of our indebtedness thereunder:
| ● | could elect to declare all indebtedness outstanding, together with accrued and unpaid interest and fees, to be due and payable and terminate all commitments to extend further credit, if applicable; and/or |
|---|
| ● | could require us to apply all of our available cash to repay such indebtedness. |
|---|
Such actions by the holders of our indebtedness could cause cross defaults under our other indebtedness, and there is no assurance that we would have sufficient current assets to repay such indebtedness in full. If we were unable to repay those amounts, the holders of our secured indebtedness could proceed against the collateral granted to them to secure that indebtedness, which includes a significant portion of our assets including many of our ships. Any such action would have an adverse impact on our business, financial condition and results of operations.
Litigation, enforcement actions, fines or penalties could adversely impact our financial condition or results of operations and damage our reputation.
Our business is subject to various U.S. and international laws and regulations that could lead to enforcement actions, fines, civil or criminal penalties or the assertion of litigation claims and damages. In addition, improper conduct by our employees or agents could damage our reputation and/or lead to litigation or legal proceedings that could result in civil or criminal penalties, including substantial monetary fines. In certain circumstances, it may not be economical to defend against such matters, and a legal strategy may not ultimately result in us prevailing in a matter. Such events could lead to an adverse impact on our financial condition or results of operations.
As a result of any ship-related or other incidents, litigation claims, enforcement actions and regulatory actions and investigations, including, but not limited to, those arising from personal injury, loss of life, loss of or damage to personal property, business interruption losses or environmental damage to any affected coastal waters and the surrounding area, may be asserted or brought against various parties, including us and/or our cruise brands. The time and attention of our management may also be diverted in defending such claims, actions and investigations. Subject to applicable insurance coverage, we may also incur costs both in defending against any claims, actions and investigations and for any judgments, fines, civil or criminal penalties if such claims, actions or investigations are adversely determined.
The U.S. Government announced that, effective May 2, 2019, it will no longer suspend the right of private parties to bring litigation under Title III of the Cuban Liberty and Solidarity (Libertad) Act of 1996, popularly known as the Helms-Burton Act, allowing certain individuals whose property was confiscated by the Cuban government beginning in 1959 to sue anyone who "traffics" in the property in question in U.S. courts. Claims have now been brought against us and other companies who have done business in Cuba. If these suits are successful, they could result in substantial monetary damages against the Company.
The impact of volatility and disruptions in the global credit and financial markets may adversely affect our ability to borrow and could increase our counterparty credit risks, including those under our credit facilities, derivatives, contingent obligations, insurance contracts and new ship progress payment guarantees.
There can be no assurance that we will be able to borrow additional money on terms as favorable as our current debt, on commercially acceptable terms, or at all. Economic downturns, including failures of financial institutions and any related liquidity crisis, can disrupt the capital and credit markets. Such disruptions could cause counterparties under our credit facilities, derivatives, contingent obligations, insurance contracts and new ship progress payment guarantees to be unable to perform their obligations or to breach their obligations to us under our contracts with them, which could include failures of financial institutions to fund required borrowings under our loan agreements and to pay us amounts that may become due under our derivative contracts and other agreements. Also, we may be limited in obtaining funds to pay amounts due to our counterparties under our derivative contracts and to pay amounts that may become due under other agreements. If we were to elect to replace any counterparty for their failure to perform their obligations under such instruments, we would likely incur significant costs to replace the counterparty. Any failure to replace any counterparties under these circumstances may result in additional costs to us or an ineffective instrument.
Certain of our debt agreements use LIBOR as a reference rate for interest rate calculations. In July 2017, the U.K.’s Financial Conduct Authority, which regulates LIBOR, announced that it intends to phase out LIBOR by the end of 2021. The U.S. Federal Reserve has begun publishing a Secured Overnight Funding Rate, which is intended to replace U.S. dollar LIBOR. Plans for alternative reference rates for other currencies have also been announced. At this time, we cannot predict how markets will respond to these proposed alternative rates or the effect of any changes to LIBOR or the discontinuation of LIBOR. If LIBOR is no longer available or if our lenders have increased costs due to changes in LIBOR, we may experience potential increases in interest rates on our variable rate debt, which could adversely impact our results of operations. In addition, some of our debt agreements which use LIBOR as a reference rate do not contain fallback reference rates. If LIBOR is discontinued, we may incur additional costs related to contract renegotiation for such agreements.
Our inability to recruit or retain qualified personnel or the loss of key personnel or employee relations issues may materially adversely affect our business, financial condition and results of operations.
Our success is dependent upon our personnel and our ability to recruit and retain high quality employees. We must continue to recruit, retain and motivate management and other employees in order to maintain our current business and support our projected growth. We need to hire and train a considerable number of qualified crew members to staff the ships that will be joining our fleet in the coming years. This may require significant efforts on the part of our management team, and our inability to hire a sufficient number of qualified crew members would adversely affect our business.
Our executive officers and other members of senior management have substantial experience and expertise in our business and have made significant contributions to our growth and success. The unexpected loss of services of one or more of these individuals could materially adversely affect us.
Currently, we are a party to collective bargaining agreements with certain crew members. Any future amendments to such collective bargaining agreements or inability to satisfactorily renegotiate such agreements may increase our labor costs and have a negative impact on our financial condition. In addition, although our collective bargaining agreements have a no-strike provision, they may not prevent a disruption in work on our ships in the future. Any such disruptions in work could have a material adverse effect on our financial results.
We rely on third parties to provide hotel management services for certain ships and certain other services, and we are exposed to risks facing such providers. In certain circumstances, we may not be able to replace such third parties or we may be forced to replace them at an increased cost to us.
We rely on external third parties to provide hotel management services for certain ships and certain other services that are vital to our business. If these service providers suffer financial hardship or are otherwise unable to continue providing such services, we cannot guarantee that we will be able to replace such service providers in a timely manner, which may cause an interruption in our operations. To the extent that we are able to replace such service providers, we may be forced to pay an increased cost for equivalent services. Both the interruption of operations and the replacement of the third-party service providers at an increased cost could adversely impact our financial condition and results of operations.
We rely on scheduled commercial airline services for passenger and crew connections. Increases in the price of, or major changes or reduction in, commercial airline services could undermine our customer base or disrupt our operations.
A number of our passengers and crew depend on scheduled commercial airline services to transport them to ports of embarkation for our cruises. Increases in the price of airfare due to increases in fuel prices, fuel surcharges, changes in commercial airline services as a result of strikes, weather or other events, or the lack of availability due to schedule changes or a high level of airline bookings could adversely affect our ability to deliver guests and crew to or from our ships and thereby increase our cruise operating expenses which would, in turn, have an adverse effect on our financial condition and results of operations.
A failure to keep pace with developments in technology could impair our operations or competitive position.
Our business continues to demand the use of sophisticated systems and technology. These systems and technologies must be refined, updated and replaced with more advanced systems on a regular basis in order for us to meet our customers’ demands and expectations. If we are unable to do so on a timely basis or within reasonable cost parameters, or if we are unable to appropriately and timely train our employees to operate any of these new systems, our business could suffer. We also may not achieve the benefits that we anticipate from any new system or technology, such as fuel abatement technologies, and a failure to do so could result in higher than anticipated costs or could impair our operating results.
Risks Related to the Regulatory Environment in Which We Operate
Future changes in applicable tax laws, or our inability to take advantage of favorable tax regimes, could increase the amount of taxes we must pay.
We believe and have taken the position that our income that is considered to be derived from the international operation of ships as well as certain income that is considered to be incidental to such income (“shipping income”), is exempt from U.S. federal income taxes under Section 883, based upon certain assumptions as to shareholdings and other information as more fully described in “Item 1—Business—Taxation.” The provisions of Section 883 are subject to change at any time, possibly with retroactive effect.
We believe and have taken the position that substantially all of our income derived from the international operation of ships is properly categorized as shipping income and that we do not have a material amount of non-qualifying income. It is possible, however, that a much larger percentage of our income does not qualify (or will not qualify) as shipping income. Moreover, the exemption for shipping income is only available for years in which NCLH will satisfy complex stock ownership tests or the publicly traded test under Section 883 as described in “Item 1—Business— Taxation—Exemption of International Shipping Income under Section 883 of the Code.” There are factual circumstances beyond our control, including changes in the direct and indirect owners of NCLH’s ordinary shares, which could cause us or our subsidiaries to lose the benefit of this tax exemption. Finally, any changes in our operations could significantly increase our exposure to either the Net Tax Regime or the 4% Regime (each as defined in “Item 1—Business—Taxation”), and we can give no assurances on this matter.
If we or any of our subsidiaries were not to qualify for the exemption under Section 883, our or such subsidiary’s U.S.-source income would be subject to either the Net Tax Regime or the 4% Regime (each as defined in “Item 1— Business— Taxation”). As of the date of this filing, we believe that NCLH and its subsidiaries will satisfy the publicly traded test imposed under Section 883 and therefore believe that NCLH will qualify for the exemption under Section 883. However, as discussed above, there are factual circumstances beyond our control that could cause NCLH to not meet the stock ownership or publicly traded tests. Therefore, we can give no assurances on this matter. We refer you to “Item 1—Business—Taxation.”
We may be subject to state, local and non-U.S. income or non-income taxes in various jurisdictions, including those in which we transact business, own property or reside. We may be required to file tax returns in some or all of those jurisdictions. Our state, local or non-U.S. tax treatment may not conform to the U.S. federal income tax treatment discussed above. We may be required to pay non-U.S. taxes on dispositions of foreign property or operations involving foreign property that may give rise to non-U.S. income or other tax liabilities in amounts that could be substantial.
The various tax regimes to which we are currently subject result in a relatively low effective tax rate on our worldwide income. These tax regimes, however, are subject to change, possibly with retroactive effect. For example, legislation has been proposed in the past that would eliminate the benefits of the exemption from U.S. federal income tax under Section 883 and subject all or a portion of our shipping income to taxation in the U.S. Moreover, we may become subject to new tax regimes and may be unable to take advantage of favorable tax provisions afforded by current or future law, including exemption of branch profits and dividend withholding taxes under the U.S. – U.K. Income Tax Treaty on income derived in respect of our U.S.–flagged operation.
The government of Bermuda recently enacted the Economic Substance Act 2018 which sets forth minimum economic substance requirements for entities established in Bermuda. The Company is currently analyzing these rules in anticipation of further guidance from Bermuda authorities on the application of the Economic Substance Act 2018. If the Company is unable to comply with such requirements, the Company may consider alternate jurisdictions or otherwise become subject to tax regimes which may be less favorable.
We are subject to complex laws and regulations, including environmental, health and safety, labor, data privacy and protection and maritime laws and regulations, which could adversely affect our operations and any changes in the current laws and regulations could lead to increased costs or decreased revenue.
Increasingly stringent and complex international, federal, state, and local laws and regulations addressing environmental protection and health and safety of workers could affect our operations. The IMO, a United Nations agency with responsibility for the safety and security of shipping and the prevention of marine pollution by ships, the Council of the European Union, individual countries, the United States, and individual states have implemented and are considering, new laws and rules to manage cruise ship operations. Many aspects of the cruise industry are subject to international treaties such as SOLAS, an international safety regulation, MARPOL, IMO’s requirements governing environmental protection, and STCW, an IMO regulation governing ship manning. In the United States, the Environmental Protection Agency and the U.S. Coast Guard both have regulations addressing cruise ship operations.
The U.S. and various state and foreign government and regulatory agencies have enacted or are considering new environmental regulations and policies aimed at reducing the threat of invasive species in ballast water, requiring the use of low-sulfur fuels, increasing fuel efficiency requirements and further restricting emissions, including those of green-house gases, and improving sewage and greywater-handling capabilities. Compliance with such laws and regulations may entail significant expenses for ship modification and changes in operating procedures which could adversely impact our operations as well as our competitors’ operations.
The International Labor Organization’s Maritime Labor Convention, 2006 regulates many aspects of maritime crew labor and impacts the worldwide sourcing of new crew members. MARPOL regulations have established special Emission Control Areas (“ECAs”) with stringent limitations on sulfur and nitrogen oxide emissions from fuel burning aboard ships. Ships operating in designated ECAs (which include the Baltic Sea, the North Sea/English Channel, and many of the waters within 200 nautical miles of the U.S. and Canadian coasts including the Hawaiian Islands and waters surrounding Puerto Rico and the U.S. Virgin Islands) are generally expected to meet the new sulfur oxide emissions limits through the use of low-sulfur fuels or installation of exhaust gas cleaning systems.
These issues are, and we believe will continue to be, areas of focus by the relevant authorities throughout the world. This could result in the enactment of more stringent regulation of cruise ships that would subject us to increasing compliance costs in the future. Some environmental groups continue to lobby for more extensive oversight of cruise ships and have generated negative publicity about the cruise industry and its environmental impact.
In the past, states have implemented taxes that impact the cruise industry. It is possible that other states, countries or ports of call that our ships regularly visit may also decide to assess new taxes or fees or change existing taxes or fees specifically applicable to the cruise industry and its employees and/or guests, which could increase our operating costs and/or could decrease the demand for cruises.
Existing and future legal and regulatory restrictions on our ability to collect and use data could also negatively affect our ability to market our business, result in increased compliance costs, and otherwise affect our business processes, all of which could have an adverse effect on our financial results.
Risks Related to NCLH’s Ordinary Shares
Shareholders of NCLH may have greater difficulties in protecting their interests than shareholders of a U.S. corporation.
We are a Bermuda exempted company. The Companies Act 1981 of Bermuda (the “Companies Act”), which applies to NCLH, differs in material respects from laws generally applicable to U.S. corporations and their shareholders. Taken together with the provisions of NCLH’s bye-laws, some of these differences may result in you having greater difficulties in protecting your interests as a shareholder of NCLH than you would have as a shareholder of a U.S. corporation. This affects, among other things, the circumstances under which transactions involving an interested director are voidable, whether an interested director can be held accountable for any benefit realized in a transaction with our Company, what approvals are required for business combinations by our Company with a large shareholder or a wholly-owned subsidiary, what rights you may have as a shareholder to enforce specified provisions of the Companies Act or NCLH’s bye-laws, and the circumstances under which we may indemnify our directors and officers.
NCLH does not currently pay dividends on its ordinary shares.
NCLH does not currently pay dividends to its shareholders and NCLH’s Board of Directors may never declare a dividend. Our existing debt agreements restrict, and any of our future debt arrangements may restrict, among other things, the ability of NCLH’s subsidiaries, including NCLC, to pay distributions to NCLH and NCLH’s ability to pay cash dividends to its shareholders. In addition, any determination to pay dividends in the future will be entirely at the discretion of NCLH’s Board of Directors and will depend upon our results of operations, cash requirements, financial condition, business opportunities, contractual restrictions, restrictions imposed by applicable law and other factors that NCLH’s Board of Directors deems relevant. We are not legally or contractually required to pay dividends. In addition, NCLH is a holding company and would depend upon its subsidiaries for their ability to pay distributions to NCLH to finance any dividend or pay any other obligations of NCLH. Investors seeking dividends should not purchase NCLH’s ordinary shares.
Provisions in NCLH’s constitutional documents may prevent or discourage takeovers and business combinations that NCLH’s shareholders might consider to be in their best interests.
NCLH’s bye-laws contain provisions that may delay, defer, prevent or render more difficult a takeover attempt that its shareholders consider to be in their best interests. As a result, these provisions may prevent NCLH’s shareholders from receiving a premium to the market price of NCLH’s shares offered by a bidder in a takeover context. Even in the absence of a takeover attempt, the existence of these provisions may adversely affect the prevailing market price of NCLH’s shares if they are viewed as discouraging takeover attempts in the future. These provisions include:
| ● | the ability of NCLH’s Board of Directors to designate one or more series of preference shares and issue preference shares without shareholder approval; |
|---|
| ● | a classified board of directors; |
|---|
| ● | the sole power of a majority of NCLH’s Board of Directors to fix the number of directors; |
|---|
| ● | the power of NCLH’s Board of Directors to fill any vacancy on NCLH’s Board of Directors in most circumstances, including when such vacancy occurs as a result of an increase in the number of directors or otherwise; and |
|---|
| ● | advance notice requirements for nominating directors or introducing other business to be conducted at shareholder meetings. |
|---|
Additionally, NCLH’s bye-laws contain provisions that prevent third parties from acquiring beneficial ownership of more than 4.9% of its outstanding shares without the consent of NCLH’s Board of Directors and provide for the lapse of
rights, and sale, of any shares acquired in excess of that limit. The effect of these provisions may preclude third parties from seeking to acquire a controlling interest in NCLH in transactions that shareholders might consider to be in their best interests and may prevent them from receiving a premium above market price for their shares.
Item 1B. Unresolved Staff Comments
Not applicable.
Item 2. Properties
Information about our cruise ships may be found under “Item 1. Business—Our Fleet” and “Item. 7. Management’s Discussion and Analysis of Financial Condition and Results of Operations—Liquidity and Capital Resources.”
NCLH’s principal executive offices are located in Miami, Florida where we lease approximately 335,900 square feet of facilities.
We lease a number of domestic and international offices throughout Europe, Asia, South America and Australia to administer our brand operations globally. Norwegian owns a private island in the Bahamas, Great Stirrup Cay, which we utilize as a port-of-call on some of our itineraries. We operate a cruise destination in Belize, Harvest Caye.
We believe that our facilities are adequate for our current needs, and that we are capable of obtaining additional facilities as necessary.
Item 3. Legal Proceedings
Booksafe Travel Protection Plan
As previously disclosed in our Quarterly Reports on Form 10-Q for the quarters ended March 31, 2019, June 30, 2019, and September 30, 2019, on September 21, 2018, a proposed class-action lawsuit was filed by Marta and Jerry Phillips and others against NCL Corporation Ltd. in the United States District Court for the Southern District of Florida relating to the marketing and sales of our Booksafe Travel Protection Plan. The plaintiffs purport to represent an alleged class of passengers who purchased Booksafe Travel Protection Plans. The complaint alleged that the Company concealed that it received proceeds on the sale of the travel insurance portion of the plan. The complaint sought an unspecified amount of damages, fees and costs. The Company moved to invoke the arbitration clause of the ticket contract to move the case out of Federal Court. On May 29, 2019, the Court granted the motion and compelled the plaintiffs to submit their claims to arbitration on an individual basis, dismissing the claims before the Court with prejudice. The plaintiffs filed an appeal on October 28, 2019. We believe we have meritorious defenses to the claim and that any liability which may arise as a result of this action will not have a material impact on our consolidated financial statements.
Helms-Burton Act
On August 27, 2019, two lawsuits were filed against Norwegian Cruise Line Holdings Ltd. in the United States District Court for the Southern District of Florida under Title III of the Cuban Liberty and Solidarity (Libertad) Act of 1996, also known as the Helms-Burton Act. The complaint filed by Havana Docks Corporation alleges it holds an interest in the Havana Cruise Port Terminal and the complaint filed by Javier Garcia-Bengochea alleges that he holds an interest in the Port of Santiago, Cuba, both of which were expropriated by the Cuban Government. The complaints further allege that the Company “trafficked” in those properties by embarking and disembarking passengers at these facilities. The plaintiffs seek all available statutory remedies, including the value of the expropriated property, plus interest, treble damages, attorneys’ fees and costs. On January 7, 2020, the United States District Court for the Southern District of Florida dismissed the claim by Havana Docks Corporation. We believe that the plaintiff plans to appeal the order. We believe we have meritorious defenses to the claims and intend to vigorously defend these matters.
Other
In the normal course of our business, various claims and lawsuits have been filed or are pending against us. Most of these claims and lawsuits are covered by insurance and, accordingly, the maximum amount of our liability is typically limited to our deductible amount.
Nonetheless, the ultimate outcome of these claims and lawsuits that are not covered by insurance cannot be determined at this time. We have evaluated our overall exposure with respect to all of our threatened and pending litigation and, to the extent required, we have accrued amounts for all estimable probable losses associated with our deemed exposure. We are currently unable to estimate any other potential contingent losses beyond those accrued, as discovery is not complete nor is adequate information available to estimate such range of loss or potential recovery. However, based on our current knowledge, we do not believe that the aggregate amount or range of reasonably possible losses with respect to these matters will be material to our consolidated results of operations, financial condition or cash flows. We intend to vigorously defend our legal position on all claims and, to the extent necessary, seek recovery.
Item 4. Mine Safety Disclosures
None.
PART II
Item 5. Market for Registrant’s Common Equity, Related Stockholder Matters and Issuer Purchases of Equity Securities
Market Information
Since December 19, 2017, NCLH’s ordinary shares have been listed on the NYSE under the symbol “NCLH.” Prior to December 19, 2017, NCLH’s ordinary shares were listed on the Nasdaq Stock Market LLC (Nasdaq Global Select Market) under the symbol “NCLH.”
Holders
As of February 14, 2020, there were 248 record holders of NCLH’s ordinary shares. Since certain of NCLH’s ordinary shares are held by brokers and other institutions on behalf of shareholders, the foregoing number is not representative of the number of beneficial owners.
Dividends
NCLH does not currently pay dividends to its shareholders. Any determination to pay dividends in the future will be at the discretion of our Board of Directors and will depend upon our results of operations, financial condition, restrictions imposed by applicable law and our financing agreements and other factors that our Board of Directors deems relevant.
Purchases of Equity Securities by the Issuer
On April 17, 2018, the Board of Directors of NCLH approved a three-year share repurchase program under which NCLH may purchase up to $1.0 billion of its ordinary shares (the “Repurchase Program”). Pursuant to the Repurchase Program, NCLH may repurchase its ordinary shares from time to time, in amounts, at prices and at such times as it deems appropriate, subject to market conditions and other considerations. Repurchases under the Repurchase Program may take place in the open market or in privately negotiated transactions, including structured and derivative transactions such as accelerated share repurchase transactions and may be made under a Rule 10b5-1 plan. There was no share repurchase activity during the three months ended December 31, 2019 and approximately $248.8 million remained available under the Repurchase Program.
Stock Performance Graph
This performance graph shall not be deemed “soliciting material” or to be “filed” with the SEC for purposes of Section 18 of the Securities Exchange Act of 1934, as amended (the “Exchange Act”), or otherwise subject to the liabilities under that Section, and shall not be deemed to be incorporated by reference into any filing of NCLH under the Securities Act of 1933, as amended, or the Exchange Act.
The following graph shows a comparison of the cumulative total return for our ordinary shares, the Standard & Poor’s 500 Composite Stock Index and the Dow Jones United States Travel and Leisure index. The Stock Performance Graph assumes that $100 was invested at the closing price of our ordinary shares on the Nasdaq and in each index on the last
trading day of fiscal 2014. Past performance is not necessarily an indicator of future results. The stock prices used were as of the close of business on the respective dates.
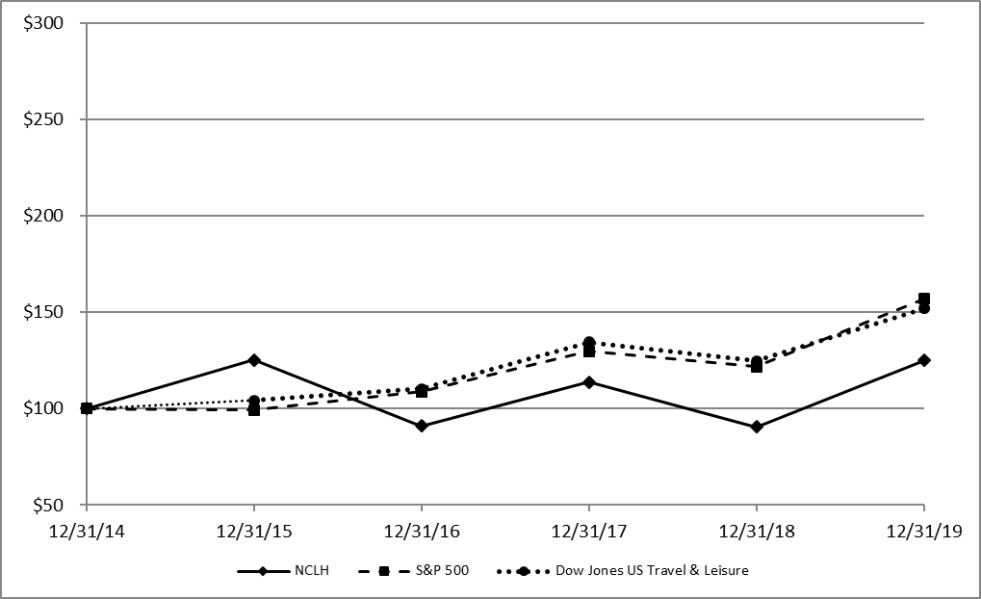
Item 6. Selected Financial Data
The following selected financial data should be read in conjunction with the consolidated financial statements and notes thereto and “Management’s Discussion and Analysis of Financial Condition and Results of Operations” appearing elsewhere in this annual report.
The consolidated financial statements as of December 31, 2019 include the impact of a change in accounting policy related the adoption of Accounting Standards Codification 842 – Leases on January 1, 2019. See Note 5, Leases, to the Notes to the Consolidated Financial Statements included herein for additional information about these changes in accounting policy.
| | | | | | | | | | | | | | | | | |
|---|---|---|---|---|---|---|---|---|---|---|---|---|---|---|---|---|
| | | As of or for the Year Ended December 31, | ||||||||||||||
| (in thousands, except share data, per | | | | | | | | | | | | |||||
| share data and operating data) | | 2019 | | 2018 | | 2017 | | 2016 | | 2015 | | |||||
| Statement of operations data: | | | | | | | | | | | | | | | | |
| Total revenue | | $ | 6,462,376 | | $ | 6,055,126 | | $ | 5,396,175 | | $ | 4,874,340 | | $ | 4,345,048 | |
| Operating income | | $ | 1,178,077 | | $ | 1,219,061 | | $ | 1,048,819 | | $ | 925,464 | | $ | 702,486 | |
| Net income | | $ | 930,228 | | $ | 954,843 | | $ | 759,872 | | $ | 633,085 | | $ | 427,137 | |
| EPS: | | | | | | | ||||||||||
| Basic | | $ | 4.33 | | $ | 4.28 | | $ | 3.33 | | $ | 2.79 | | $ | 1.89 | |
| Diluted | | $ | 4.30 | | $ | 4.25 | | $ | 3.31 | | $ | 2.78 | | $ | 1.86 | |
| Weighted-average shares outstanding: | | | | | | | ||||||||||
| Basic | | 214,929,977 | | 223,001,739 | | 228,040,825 | | 227,121,875 | | 226,591,437 | | |||||
| Diluted | | 216,475,076 | | 224,419,205 | | 229,418,326 | | 227,850,286 | | 230,040,132 | | |||||
| Balance sheet data: | | | | | | | ||||||||||
| Total assets | | $ | 16,684,599 | | $ | 15,205,970 | | $ | 14,094,869 | | $ | 12,973,911 | | $ | 12,264,757 | |
| Property and equipment, net | | $ | 13,135,337 | | $ | 12,119,253 | | $ | 11,040,488 | | $ | 10,117,689 | | $ | 9,458,805 | |
| Long-term debt, including current portion | | $ | 6,801,693 | | $ | 6,492,091 | | $ | 6,307,765 | | $ | 6,398,687 | | $ | 6,397,537 | |
| Total shareholders’ equity | | $ | 6,515,579 | | $ | 5,963,001 | | $ | 5,749,766 | | $ | 4,537,726 | | $ | 3,780,880 | |
| Operating data: | | | | | | | | |||||||||
| Passengers carried | | 2,695,718 | | 2,795,101 | | 2,519,324 | | 2,337,311 | | 2,164,404 | | |||||
| Passenger Cruise Days | | 20,637,949 | | 20,276,568 | | 18,523,030 | | 17,588,707 | | 16,027,743 | | |||||
| Capacity Days | | 19,233,459 | | 18,841,678 | | 17,363,422 | | 16,376,063 | | 14,700,990 | | |||||
| Occupancy Percentage | | 107.3 | % | 107.6 | % | 106.7 | % | 107.4 | % | 109.0 | % |
Item 7. Management’s Discussion and Analysis of Financial Condition and Results of Operations
Financial Presentation
The following discussion and analysis contains forward-looking statements within the meaning of the federal securities laws, and should be read in conjunction with the disclosures we make concerning risks and other factors that may affect our business and operating results. You should read this information in conjunction with the consolidated financial statements and the notes thereto included in this annual report. See also “Cautionary Statement Concerning Forward-Looking Statements” immediately prior to Part I, Item 1 in this annual report.
We categorize revenue from our cruise and cruise-related activities as either “passenger ticket” revenue or “onboard and other” revenue. Passenger ticket revenue and onboard and other revenue vary according to product offering, the size of the ship in operation, the length of cruises operated and the markets in which the ship operates. Our revenue is seasonal based on demand for cruises, which has historically been strongest during the Northern Hemisphere’s summer months. Passenger ticket revenue primarily consists of revenue for accommodations, meals in certain restaurants on the ship, certain onboard entertainment, port fees and taxes and includes revenue for service charges and air and land transportation to and from the ship to the extent guests purchase these items from us. Onboard and other revenue primarily consists of revenue from casino, beverage sales, shore excursions, specialty dining, retail sales, spa services and photo services. Our onboard revenue is derived from onboard activities we perform directly or that are performed by independent concessionaires, from which we receive a share of their revenue.
Our cruise operating expense is classified as follows:
| ● | Commissions, transportation and other primarily consists of direct costs associated with passenger ticket revenue. These costs include travel advisor commissions, air and land transportation expenses, related credit card fees, certain port fees and taxes and the costs associated with shore excursions and hotel accommodations included as part of the overall cruise purchase price. |
|---|
| ● | Onboard and other primarily consists of direct costs incurred in connection with onboard and other revenue, including casino, beverage sales and shore excursions. |
|---|
| ● | Payroll and related consists of the cost of wages and benefits for shipboard employees and costs of certain inventory items, including food, for a third party that provides crew and other hotel services for certain ships. |
|---|
| ● | Fuel includes fuel costs, the impact of certain fuel hedges and fuel delivery costs. |
|---|
| ● | Food consists of food costs for passengers and crew on certain ships. |
|---|
| ● | Other consists of repairs and maintenance (including Dry-dock costs), ship insurance and other ship expenses. |
|---|
Critical Accounting Policies
Our consolidated financial statements have been prepared in accordance with U.S. GAAP. The preparation of these consolidated financial statements requires us to make estimates, judgments and assumptions that affect the reported amounts of assets and liabilities and disclosure of contingent assets and liabilities at the date of our consolidated financial statements and the reported amounts of revenue and expenses during the periods presented. We rely on historical experience and on various other assumptions that we believe to be reasonable under the circumstances to make these estimates and judgments. Actual results could differ materially from these estimates. We believe that the following critical accounting policies reflect the significant estimates and assumptions used in the preparation of our consolidated financial statements. These critical accounting policies, which are presented in detail in our notes to our audited consolidated financial statements, relate to ship accounting and asset impairment.
Ship Accounting
Ships represent our most significant assets, and we record them at cost less accumulated depreciation. Depreciation of ships is computed on a straight-line basis over the weighted average useful lives of primarily 30 years after a 15% reduction for the estimated residual value of the ship. Ship improvement costs that we believe add value to our ships are capitalized to the ship and depreciated over the shorter of the improvements’ estimated useful lives or the remaining useful life of the ship. When we record the retirement of a ship component included within the ship’s cost basis, we estimate the net book value of the component being retired and remove it from the ship’s cost basis. Repairs and maintenance activities are charged to expense as incurred. We account for Dry-dock costs under the direct expense method which requires us to expense all Dry-dock costs as incurred.
We determine the weighted average useful lives of our ships based primarily on our estimates of the useful lives of the ships’ major component systems on the date of acquisition, such as cabins, main diesels, main electric, superstructure and hull. The useful lives of ship improvements are estimated based on the economic lives of the new components. In addition, to determine the useful lives of the ship or ship components, we consider the impact of the historical useful lives of similar assets, manufacturer recommended lives and anticipated changes in technological conditions. Given the large and complex nature of our ships, our accounting estimates related to ships and determinations of ship improvement costs to be capitalized require judgment and are uncertain. Should certain factors or circumstances cause us to revise our estimate of ship service lives or projected residual values, depreciation expense could be materially lower or higher. If circumstances cause us to change our assumptions in making determinations as to whether ship improvements should be capitalized, the amounts we expense each year as repairs and maintenance costs could increase, partially offset by a decrease in depreciation expense. If we reduced our estimated weighted average 30-year ship service life by one year, depreciation expense for the year ended December 31, 2019 would have increased by $12.9 million. In addition, if our ships were estimated to have no residual value, depreciation expense for the same period would have increased by $66.4 million. We believe our estimates for ship accounting are reasonable and our methods are consistently applied. We believe that depreciation expense is based on a rational and systematic method to allocate our ships’ costs to the periods that benefit from the ships’ usage.
Asset Impairment
We review our long-lived assets, principally ships, for impairment whenever events or changes in circumstances indicate that the carrying amount of an asset may not be recoverable. Assets are grouped and evaluated at the lowest level for which there are identifiable cash flows that are largely independent of the cash flows of other groups of assets. We consider historical performance and future estimated results in our evaluation of potential impairment and then compare the carrying amount of the asset to the estimated future cash flows expected to result from the use of the asset. If the carrying amount of the asset exceeds the estimated expected undiscounted future cash flows, we measure the amount of the impairment by comparing the carrying amount of the asset to its fair value. We estimate fair value based on the best information available utilizing estimates, judgments and projections as necessary. Our estimate of fair value is generally measured by discounting expected future cash flows at discount rates commensurate with the associated risk.
We evaluate goodwill and tradenames for impairment annually or more frequently when an event occurs or circumstances change that indicates the carrying value of a reporting unit may not be recoverable. For our evaluation of goodwill we use the Step 0 Test which allows us to first assess qualitative factors to determine whether it is more likely than not (i.e., more than 50%) that the fair value of a reporting unit is less than its carrying value. For tradenames we also provide a qualitative assessment to determine if there is any indication of impairment.
In order to make this evaluation, we consider whether any of the following factors or conditions exist:
| ● | Changes in general macroeconomic conditions such as a deterioration in general economic conditions; limitations on accessing capital; fluctuations in foreign exchange rates; or other developments in equity and credit markets; |
|---|
| ● | Changes in industry and market conditions such as a deterioration in the environment in which an entity operates; an increased competitive environment; a decline in market-dependent multiples or metrics (in both |
|---|
| absolute terms and relative to peers); a change in the market for an entity’s products or services; or a regulatory or political development; |
|---|
| ● | Changes in cost factors that have a negative effect on earnings and cash flows; |
|---|
| ● | Decline in overall financial performance (for both actual and expected performance); |
|---|
| ● | Entity and reporting unit specific negative events such as changes in management, key personnel, strategy, or customers; litigation; or a change in the composition or carrying amount of net assets; and |
|---|
| ● | Decline in share price (in both absolute terms and relative to peers). |
|---|
We also may conduct a quantitative assessment comparing the fair value of each reporting unit to its carrying value, including goodwill. This is called the Step I Test which consists of a combined approach using discounted future cash flows and market multiples to determine the fair value of the reporting units. The market approach considers revenue and EBITDA multiples from an appropriate peer group. Our discounted cash flow valuation reflects our principal assumptions of 1) forecasted future operating results and growth rates, 2) forecasted capital expenditures for fleet growth and ship improvements and 3) a weighted average cost of capital of market participants, adjusted for an optimal capital structure.We believe that the combined approach is the most representative method to assess fair value as it utilizes expectations of long-term growth as well as current market conditions. For the tradenames, we may also use a quantitative assessment, which utilizes the relief from royalty method and includes the same forecasts and discount rates from the discounted cash flow valuation in the goodwill assessment along with a tradename royalty rate assumption.
We have concluded that our business has three reporting units. Each brand, Oceania Cruises, Regent Seven Seas and Norwegian, constitutes a business for which discrete financial information is available and management regularly reviews the operating results and, therefore, each brand is considered an operating segment.
As of December 31, 2019, there was $523.0 million, $462.1 million and $403.8 million of goodwill for the Oceania Cruises, Regent Seven Seas and Norwegian reporting units, respectively. For our 2019 annual goodwill impairment evaluation, we elected to perform quantitative tests for the each of the reporting units. Based on the results of the Step 1 Tests, we determined there was no impairment of goodwill because the fair value of the Regent Seven Seas and Norwegian reporting units substantially exceeded their carrying values. The fair value of the Oceania Cruises reporting unit exceeded the carrying value by 24%. However, a change in the conditions of any reporting unit may result in a decline in fair value in future periods. As of December 31, 2019, our tests supported the carrying values of these assets and we believe that we have made reasonable estimates and judgments.
Non-GAAP Financial Measures
We use certain non-GAAP financial measures, such as Net Revenue, Net Yield, Net Cruise Cost, Adjusted Net Cruise Cost Excluding Fuel, Adjusted EBITDA, Adjusted Net Income and Adjusted EPS, to enable us to analyze our performance. See “Terms Used in this Annual Report” for the definitions of these and other non-GAAP financial measures. We utilize Net Revenue and Net Yield to manage our business on a day-to-day basis and believe that they are the most relevant measures of our revenue performance because they reflect the revenue earned by us net of significant variable costs. In measuring our ability to control costs in a manner that positively impacts net income, we believe changes in Net Cruise Cost and Adjusted Net Cruise Cost Excluding Fuel to be the most relevant indicators of our performance.
As our business includes the sourcing of passengers and deployment of vessels outside of the U.S., a portion of our revenue and expenses are denominated in foreign currencies, particularly British pound, Canadian dollar, euro and Australian dollar which are subject to fluctuations in currency exchange rates versus our reporting currency, the U.S. dollar. In order to monitor results excluding these fluctuations, we calculate certain non-GAAP measures on a Constant Currency basis, whereby current period revenue and expenses denominated in foreign currencies are converted to U.S. dollars using currency exchange rates of the comparable period. We believe that presenting these non-GAAP measures
on both a reported and Constant Currency basis is useful in providing a more comprehensive view of trends in our business.
We believe that Adjusted EBITDA is appropriate as a supplemental financial measure as it is used by management to assess operating performance. We also believe that Adjusted EBITDA is a useful measure in determining our performance as it reflects certain operating drivers of our business, such as sales growth, operating costs, marketing, general and administrative expense and other operating income and expense. Adjusted EBITDA is not a defined term under GAAP nor is it intended to be a measure of liquidity or cash flows from operations or a measure comparable to net income, as it does not take into account certain requirements such as capital expenditures and related depreciation, principal and interest payments and tax payments and it includes other supplemental adjustments.
In addition, Adjusted Net Income and Adjusted EPS are non-GAAP financial measures that exclude certain amounts and are used to supplement GAAP net income and EPS. We use Adjusted Net Income and Adjusted EPS as key performance measures of our earnings performance. We believe that both management and investors benefit from referring to these non-GAAP financial measures in assessing our performance and when planning, forecasting and analyzing future periods. These non-GAAP financial measures also facilitate management’s internal comparison to our historical performance. In addition, management uses Adjusted EPS as a performance measure for our incentive compensation. The amounts excluded in the presentation of these non-GAAP financial measures may vary from period to period; accordingly, our presentation of Adjusted Net Income and Adjusted EPS may not be indicative of future adjustments or results. For example, for the year ended December 31, 2018, we incurred Secondary Equity Offering expenses of $0.9 million. Similar expenses were not incurred in the year ended December 31, 2019. We included this as an adjustment in the reconciliation of Adjusted Net Income since these expenses were not representative of our day-to-day operations and we have included similar non-representative adjustments in prior periods.
You are encouraged to evaluate each adjustment used in calculating our non-GAAP financial measures and the reasons we consider our non-GAAP financial measures appropriate for supplemental analysis. In evaluating our non-GAAP financial measures, you should be aware that in the future we may incur expenses similar to the adjustments in our presentation. Our non-GAAP financial measures have limitations as analytical tools, and you should not consider these measures in isolation or as a substitute for analysis of our results as reported under GAAP. Our presentation of our non-GAAP financial measures should not be construed as an inference that our future results will be unaffected by unusual or non-recurring items. Our non-GAAP financial measures may not be comparable to other companies. Please see a historical reconciliation of these measures to the most comparable GAAP measure presented in our consolidated financial statements below in the “Results of Operations” section.
Summary of Significant 2019 Events
In January 2019, we (a) reduced the pricing of our existing $875 million Revolving Loan Facility, (b) reduced the pricing and increased the approximately $1.3 billion principal amount outstanding under the term loan A facility to $1.6 billion, and (c) extended the maturity dates for our Revolving Loan Facility and our term loan A facility to 2024, subject to certain conditions.
In June 2019, the Office of Foreign Assets Control of the United States Department of the Treasury removed the authorization for group people-to-people educational travel by U.S. persons to Cuba. As a result, we have stopped sailings to Cuba effective June 5, 2019 and revised the affected itineraries. The estimated negative impact resulting from this regulatory change was approximately $0.45 to both diluted EPS and Adjusted EPS for the year ended December 31, 2019. We expect the negative impact to diluted EPS and Adjusted EPS to continue into 2020 as a result of the cessation of cruises to Cuba.
In October 2019, Norwegian Encore was delivered.
In December 2019, we redeemed $565.0 million principal amount of the outstanding 4.75% Senior Notes due 2021 and issued $565.0 million of 3.625% Senior Notes due 2024.
Throughout 2019, we repurchased approximately $349.9 million of NCLH’s outstanding ordinary shares under our previously authorized three-year, $1.0 billion share repurchase program. As of December 31, 2019, $248.8 million of authorized repurchases remained.
Executive Overview
Total revenue increased 6.7% to $6.5 billion for the year ended December 31, 2019 compared to $6.1 billion for the year ended December 31, 2018. Gross Yield increased 4.6%. Net Revenue for the year ended December 31, 2019 increased 5.1% to $4.9 billion from $4.7 billion in the same period in 2018 with an increase in Net Yield of 2.9% and an increase in Capacity Days of 2.1%.
For the year ended December 31, 2019, we had net income and diluted EPS of $930.2 million and $4.30, respectively. For the year ended December 31, 2018, we had net income and diluted EPS of $954.8 million and $4.25, respectively. Operating income decreased 3.4% to slightly below $1.2 billion for the year ended December 31, 2019 from slightly above $1.2 billion for the year ended December 31, 2018.
We had Adjusted Net Income and Adjusted EPS of $1.1 billion and $5.09, respectively, for the year ended December 31, 2019, including $170.8 million of adjustments primarily consisting of expenses related to non-cash share-based compensation, amortization of intangible assets, losses on the extinguishment and modification of debt and the redeployment of Norwegian Joy, compared to Adjusted Net Income and Adjusted EPS of $1.1 billion and $4.92, respectively, for the year ended December 31, 2018. A 2.0% improvement in Adjusted EBITDA was achieved for the same period. We refer you to our “Results of Operations” below for a calculation of Net Revenue, Net Yield, Adjusted Net Income, Adjusted EPS and Adjusted EBITDA.
In late January 2020, the COVID-19 coronavirus outbreak began impacting the Company’s financial performance and operations. The Company has experienced costs and lost revenue related to itinerary modifications, travel restrictions and advisories, the unavailability of ports and/or destinations, cancellations and redeployments. The COVID-19 coronavirus is also impacting consumer sentiment regarding cruise travel generally, and the full impact of this indirect effect cannot be quantified at this time. See “Epidemics and viral outbreaks could have an adverse effect on our business, financial condition and results of operations” in Part I Item 1A-Risk Factors for further information related to this risk.
Results of Operations
The discussion below compares the results of operations for the year ended December 31, 2019 to the year ended December 31, 2018. For a comparison of the Company’s results of operations for the fiscal years ended December 31, 2017 to the year ended December 31, 2018, see “Item 7, Management’s Discussion and Analysis of Financial Condition and Results of Operations” in the Company’s Annual Report on Form 10-K for the year ended December 31, 2018, which was filed with the U.S. Securities and Exchange Commission on February 27, 2019.
We reported total revenue, total cruise operating expense, operating income and net income as follows (in thousands, except per share data):
| | | | | | | |
|---|---|---|---|---|---|---|
| | | Year Ended December 31, | ||||
| | 2019 | 2018 | ||||
| Total revenue | | $ | 6,462,376 | | $ | 6,055,126 |
| Total cruise operating expense | | $ | 3,663,261 | | $ | 3,377,076 |
| Operating income | | $ | 1,178,077 | | $ | 1,219,061 |
| Net income | | $ | 930,228 | | $ | 954,843 |
| EPS: | | | ||||
| Basic | | $ | 4.33 | | $ | 4.28 |
| Diluted | | $ | 4.30 | | $ | 4.25 |
The following table sets forth operating data as a percentage of total revenue:
| | | | | | |
|---|---|---|---|---|---|
| | | Year Ended December 31, | | ||
| | 2019 | 2018 | |||
| Revenue | | | | | |
| Passenger ticket | 69.9 | % | 70.4 | % | |
| Onboard and other | 30.1 | % | 29.6 | % | |
| Total revenue | 100.0 | % | 100.0 | % | |
| Cruise operating expense | |||||
| Commissions, transportation and other | 17.4 | % | 16.5 | % | |
| Onboard and other | 6.1 | % | 5.8 | % | |
| Payroll and related | 14.3 | % | 14.6 | % | |
| Fuel | 6.3 | % | 6.5 | % | |
| Food | 3.4 | % | 3.5 | % | |
| Other | 9.2 | % | 8.9 | % | |
| Total cruise operating expense | 56.7 | % | 55.8 | % | |
| Other operating expense | |||||
| Marketing, general and administrative | 15.1 | % | 14.8 | % | |
| Depreciation and amortization | 10.0 | % | 9.3 | % | |
| Total other operating expense | 25.1 | % | 24.1 | % | |
| Operating income | 18.2 | % | 20.1 | % | |
| Non-operating income (expense) | |||||
| Interest expense, net | (4.2) | % | (4.4) | % | |
| Other income (expense), net | 0.1 | % | 0.3 | % | |
| Total non-operating income (expense) | (4.1) | % | (4.1) | % | |
| Net income before income taxes | 14.1 | % | 16.0 | % | |
| Income tax benefit (expense) | 0.3 | % | (0.2) | % | |
| Net income | 14.4 | % | 15.8 | % |
The following table sets forth selected statistical information:
| | | | | |
|---|---|---|---|---|
| | Year Ended December 31, | | ||
| | 2019 | 2018 | | |
| Passengers carried | 2,695,718 | 2,795,101 | | |
| Passenger Cruise Days | 20,637,949 | 20,276,568 | | |
| Capacity Days | 19,233,459 | 18,841,678 | | |
| Occupancy Percentage | 107.3 | % | 107.6 | % |
Net Revenue, Gross Yield and Net Yield were calculated as follows (in thousands, except Capacity Days and Yield data):
| | | | | | | | | | |
|---|---|---|---|---|---|---|---|---|---|
| | | Year Ended December 31, | |||||||
| | | | 2019 | | | ||||
| | | | | Constant | | | | ||
| | | | 2019 | Currency | | 2018 | |||
| Passenger ticket revenue | | $ | 4,517,393 | | $ | 4,559,023 | | $ | 4,259,815 |
| Onboard and other revenue | | 1,944,983 | | 1,944,983 | | 1,795,311 | |||
| Total revenue | | 6,462,376 | | 6,504,006 | | 6,055,126 | |||
| Less: | | | | ||||||
| Commissions, transportation and other expense | | 1,120,886 | | 1,129,491 | | 998,948 | |||
| Onboard and other expense | | 394,673 | | 394,673 | | 348,656 | |||
| Net Revenue | | $ | 4,946,817 | | $ | 4,979,842 | | $ | 4,707,522 |
| Capacity Days | | 19,233,459 | | 19,233,459 | | 18,841,678 | |||
| Gross Yield | | $ | 336.00 | | $ | 338.16 | | $ | 321.37 |
| Net Yield | | $ | 257.20 | | $ | 258.92 | | $ | 249.85 |
Gross Cruise Cost, Net Cruise Cost, Net Cruise Cost Excluding Fuel and Adjusted Net Cruise Cost Excluding Fuel were calculated as follows (in thousands, except Capacity Days and per Capacity Day data):
| | | | | | | | | | |
|---|---|---|---|---|---|---|---|---|---|
| | | Year Ended December 31, | |||||||
| | | | | 2019 | | | | ||
| | | | Constant | | | ||||
| | | 2019 | Currency | | 2018 | ||||
| Total cruise operating expense | | $ | 3,663,261 | | $ | 3,684,318 | | $ | 3,377,076 |
| Marketing, general and administrative expense | | 974,850 | | 980,047 | | 897,929 | |||
| Gross Cruise Cost | | 4,638,111 | | 4,664,365 | | 4,275,005 | |||
| Less: | | | | ||||||
| Commissions, transportation and other expense | | 1,120,886 | | 1,129,491 | | 998,948 | |||
| Onboard and other expense | | 394,673 | | 394,673 | | 348,656 | |||
| Net Cruise Cost | | 3,122,552 | | 3,140,201 | | 2,927,401 | |||
| Less: Fuel expense | | 409,602 | | 409,602 | | 392,685 | |||
| Net Cruise Cost Excluding Fuel | | 2,712,950 | | 2,730,599 | | 2,534,716 | |||
| Less Non-GAAP Adjustments: | | | | ||||||
| Non-cash deferred compensation (1) | | 2,135 | | 2,135 | | 2,167 | |||
| Non-cash share-based compensation (2) | | 95,055 | | 95,055 | | 115,983 | |||
| Secondary Equity Offering expenses (3) | | — | | — | | 883 | |||
| Severance payments and other fees (4) | | | 6,514 | | | 6,514 | | | — |
| Redeployment of Norwegian Joy (5) | | | 7,051 | | | 7,051 | | | — |
| Other (6) | | — | | — | | (1,412) | |||
| Adjusted Net Cruise Cost Excluding Fuel | | $ | 2,602,195 | | $ | 2,619,844 | | $ | 2,417,095 |
| Capacity Days | | 19,233,459 | | 19,233,459 | | 18,841,678 | |||
| Gross Cruise Cost per Capacity Day | | $ | 241.15 | | $ | 242.51 | | $ | 226.89 |
| Net Cruise Cost per Capacity Day | | $ | 162.35 | | $ | 163.27 | | $ | 155.37 |
| Net Cruise Cost Excluding Fuel per Capacity Day | | $ | 141.05 | | $ | 141.97 | | $ | 134.53 |
| Adjusted Net Cruise Cost Excluding Fuel per Capacity Day | | $ | 135.30 | | $ | 136.21 | | $ | 128.28 |
| (1) | Non-cash deferred compensation expenses related to the crew pension plan and other crew expenses, which are included in payroll and related expense. |
|---|
| (2) | Non-cash share-based compensation expense related to equity awards, which are included in marketing, general and administrative expense and payroll and related expense. |
|---|
| (3) | Secondary Equity Offering expenses are included in marketing, general and administrative expense. |
|---|
| (4) | Severance payments related to restructuring costs are included in marketing, general and administrative expense. |
|---|
| (5) | Expenses related to the redeployment of Norwegian Joy from Asia to the U.S. and the closing of the Shanghai office, which are included in other cruise operating expense and marketing, general and administrative expense. |
|---|
| (6) | Other primarily related to expenses and reimbursements for certain legal costs included in marketing, general and administrative expense. |
|---|
Adjusted Net Income and Adjusted EPS were calculated as follows (in thousands, except share and per share data):
| | | | | | | |
|---|---|---|---|---|---|---|
| | | Year Ended December 31, | ||||
| | 2019 | 2018 | ||||
| Net income | | $ | 930,228 | | $ | 954,843 |
| Non-GAAP Adjustments: | | | ||||
| Non-cash deferred compensation (1) | | 3,514 | | 3,453 | ||
| Non-cash share-based compensation (2) | | 95,055 | | 115,983 | ||
| Secondary Equity Offering expenses (3) | | — | | 883 | ||
| Severance payments and other fees (4) | | 6,514 | | — | ||
| Extinguishment and modification of debt (5) | | 16,676 | | 6,346 | ||
| Amortization of intangible assets (6) | | 18,414 | | 24,890 | ||
| Redeployment of Norwegian Joy (7) | | | 30,629 | | | — |
| Other (8) | | — | | (1,412) | ||
| Adjusted Net Income | | $ | 1,101,030 | | $ | 1,104,986 |
| Diluted weighted-average shares outstanding - Net income and Adjusted Net Income | | 216,475,076 | | 224,419,205 | ||
| Diluted earnings per share | | $ | 4.30 | | $ | 4.25 |
| Adjusted EPS | | $ | 5.09 | | $ | 4.92 |
| (1) | Non-cash deferred compensation expenses related to the crew pension plan and other crew expenses are included in payroll and related expense and other income (expense), net. |
|---|
| (2) | Non-cash share-based compensation expenses related to equity awards are included in marketing, general and administrative expense and payroll and related expense. |
|---|
| (3) | Secondary Equity Offering expenses are included in marketing, general and administrative expense. |
|---|
| (4) | Severance payments related to restructuring costs are included in marketing, general and administrative expense. |
|---|
| (5) | Losses on extinguishments and modifications of debt are included in interest expense, net. |
|---|
| (6) | Amortization of intangible assets related to the Acquisition of Prestige are included in depreciation and amortization expense. |
|---|
| (7) | Expenses related to the redeployment of Norwegian Joy from Asia to the U.S. and the closing of the Shanghai office, which are included in other cruise operating expense, marketing, general and administrative expense and depreciation and amortization expense. |
|---|
| (8) | Other primarily related to expenses and reimbursements for certain legal costs included in marketing, general and administrative expense. |
|---|
EBITDA and Adjusted EBITDA were calculated as follows (in thousands):
| | | | | | | |
|---|---|---|---|---|---|---|
| | | Year Ended December 31, | ||||
| | 2019 | 2018 | ||||
| Net income | | $ | 930,228 | | $ | 954,843 |
| Interest expense, net | | 272,867 | | 270,404 | ||
| Income tax (benefit) expense | | (18,863) | | 14,467 | ||
| Depreciation and amortization expense | | 646,188 | | 561,060 | ||
| EBITDA | | 1,830,420 | | 1,800,774 | ||
| Other (income) expense, net (1) | | (6,155) | | (20,653) | ||
| Non-GAAP Adjustments: | | | ||||
| Non-cash deferred compensation (2) | | 2,135 | | 2,167 | ||
| Non-cash share-based compensation (3) | | 95,055 | | 115,983 | ||
| Secondary Equity Offering expenses (4) | | — | | 883 | ||
| Severance payments and other fees (5) | | | 6,514 | | | — |
| Redeployment of Norwegian Joy (6) | | | 7,051 | | | — |
| Other (7) | | — | | (1,412) | ||
| Adjusted EBITDA | | $ | 1,935,020 | | $ | 1,897,742 |
| (1) | Primarily consists of gains and losses, net for forward currency exchanges and proceeds from insurance and litigation settlements. |
|---|
| (2) | Non-cash deferred compensation expenses related to the crew pension plan and other crew expenses are included in payroll and related expense. |
|---|
| (3) | Non-cash share-based compensation expense related to equity awards are included in marketing, general and administrative expense and payroll and related expense. |
|---|
| (4) | Secondary Equity Offering expenses are included in marketing, general and administrative expense. |
|---|
| (5) | Severance payments related to restructuring costs are included in marketing, general and administrative expense. |
|---|
| (6) | Expenses related to the redeployment of Norwegian Joy from Asia to the U.S. and the closing of the Shanghai office, which are included in other cruise operating expense and marketing, general and administrative expense. |
|---|
| (7) | Other primarily related to expenses and reimbursement for certain legal costs included in marketing, general and administrative expense. |
|---|
Year Ended December 31, 2019 (“2019”) Compared to Year Ended December 31, 2018 (“2018”)
Revenue
Total revenue increased 6.7% to $6.5 billion in 2019 compared to $6.1 billion in 2018 primarily due to an increase in Capacity Days and improved pricing. Gross Yield increased 4.6%. Net Revenue increased 5.1% to $4.9 billion in 2019, from $4.7 billion in 2018, due to an increase in Capacity Days of 2.1% and an increase in Net Yield of 2.9%. The increase in Capacity Days was primarily due to a full year of Norwegian Bliss in 2019 and the introduction of Norwegian Encore to the fleet during the fourth quarter of 2019, partially offset by a reduction in Capacity Days while Norwegian Joy was undergoing revitalization and other repairs and maintenance for our fleet including scheduled Dry-docks. The increase in Gross Yield and Net Yield was primarily due to an increase in passenger ticket pricing and onboard spending. On a Constant Currency basis, Net Yield increased 3.6%.
Expense
Total cruise operating expense increased 8.5% in 2019 compared to 2018, primarily due to the increase in Capacity Days, the redeployment of Norwegian Joy during the second quarter of 2019 and incremental direct costs related to air promotions. Gross Cruise Cost increased 8.5% in 2019 compared to 2018, due to an increase in total cruise operating expense and marketing, general and administrative expenses. Total other operating expense increased 11.1% in 2019 compared to 2018. Marketing, general and administrative expenses increased primarily due to higher advertising expenses. Depreciation and amortization expense increased primarily due to the additions of Norwegian Encore and Norwegian Bliss and ship improvement projects. Net Cruise Cost per Capacity Day increased 4.5% (5.1% on a Constant
Currency basis) due to an increase in marketing, general and administrative expenses, costs associated with the cessation of cruises to Cuba and other ship operating costs. Adjusted Net Cruise Cost Excluding Fuel per Capacity Day increased 5.5% (6.2% on a Constant Currency basis). We refer you to the “Results of Operations” above for a reconciliation of total cruise operating expense to Adjusted Net Cruise Cost Excluding Fuel.
Interest expense, net was $272.9 million in 2019 compared to $270.4 million in 2018. The increase in 2019 includes $16.7 million of losses on extinguishment of debt and debt modification costs. In 2019, interest expense also reflects lower outstanding debt balances and lower margins associated with recent refinancings, partially offset by newbuild financings and an increase in LIBOR. 2018 included losses on extinguishment of debt and debt modification costs of $6.3 million.
Other income (expense), net was income of $6.2 million in 2019 compared to income of $20.7 million in 2018. Other income in 2019 was primarily due to gains from insurance proceeds and a litigation settlement partially offset by losses on foreign currency exchange. Other income in 2018 was primarily due to gains on foreign currency exchange.
Income tax benefit (expense) was a benefit of $18.9 million in 2019 compared to an expense of $14.5 million in 2018. During 2018, we implemented certain tax restructuring strategies that created our ability to utilize the net operating loss carryforwards of Prestige, for which we had previously provided a full valuation allowance. As a result, in 2019 we recorded a tax benefit of $35.7 million in connection with the reversal of substantially all of the valuation allowance.
Liquidity and Capital Resources
General
As of December 31, 2019, our liquidity was $1.1 billion consisting of $252.9 million in cash and cash equivalents and $875.0 million available under our Revolving Loan Facility. Our primary ongoing liquidity requirements are to finance working capital, capital expenditures and debt service.
As of December 31, 2019, we had a working capital deficit of $2.9 billion. This deficit included $2.0 billion of advance ticket sales, which represents the total revenue we collect in advance of sailing dates and accordingly are substantially more like deferred revenue balances rather than actual current cash liabilities. Our business model, along with our Revolving Loan Facility, allows us to operate with a working capital deficit and still meet our operating, investing and financing needs.
We evaluate potential sources of additional liquidity, including the capital markets, in the ordinary course of business. We will continue to evaluate opportunities to optimize our capital structure, taking into consideration our current and expected capital requirements, our assessment of prevailing market conditions and expectations regarding future conditions, and the contractual and other restrictions to which we are subject.
Our existing debt agreements restrict, and any of our future debt arrangements may restrict, among other things, the ability of our subsidiaries to make distributions and/or to pay dividends to NCLC and NCLH’s ability to pay cash dividends to its shareholders. NCLH is a holding company and depends upon its subsidiaries for their ability to pay distributions to NCLH to finance any dividend or pay any other obligations of NCLH. However, we do not believe that these restrictions have had or are expected to have an impact on our ability to meet any cash obligations.
In January 2019, we (a) reduced the pricing of our existing $875.0 million Revolving Loan Facility, (b) reduced the pricing and increased the approximately $1.3 billion principal amount outstanding under the term loan A facility to $1.6 billion, and (c) extended the maturity dates for our Revolving Loan Facility and our term loan A facility to 2024, subject to certain conditions. We used the proceeds from the increase in our term loan A facility to prepay all of the then outstanding amounts under the term loan B facility. In addition, in December 2019, we redeemed $565.0 million principal amount of the then outstanding 4.75% Senior Notes due 2021 and issued $565.0 million of 3.625% Senior Notes due 2024. See Note 8, Long-Term Debt, to the Notes to the Consolidated Financial Statements included herein for additional information about these refinancing activities as well as our other debt agreements.
Sources and Uses of Cash
In this section, references to 2019 refer to the year ended December 31, 2019 and references to 2018 refer to the year ended December 31, 2018.
Net cash provided by operating activities was $1.8 billion in 2019 compared to $2.1 billion in 2018. The net cash provided by operating activities in 2019 included net income of $930.2 million, an increase in advance ticket sales of $347.4 million and timing differences in cash receipts and payments relating to various operating assets and liabilities. The change in net cash provided by operating activities in 2018 includes net income of $954.8 million as well as timing differences in cash receipts and payments relating to various operating assets and liabilities, including an increase in advance ticket sales of $262.6 million.
Net cash used in investing activities was $1.7 billion in 2019, primarily related to payments for the delivery of Norwegian Encore, ships under construction, ship improvement projects and shoreside projects. Net cash used in investing activities was $1.5 billion in 2018, primarily related to payments for the delivery of Norwegian Bliss, ship improvements, ships under construction and shoreside projects.
Net cash used in financing activities was $53.4 million in 2019, primarily due to the repurchase of $349.9 million of NCLH’s ordinary shares, net repayments of our Revolving Loan Facility and the net refinancing of term loans partially offset by the issuance of new debt. Net cash used in financing activities was $584.8 million in 2018, reflecting the net repayment of our Revolving Loan Facility, repayments on other loan facilities, the repurchase of NCLH’s ordinary shares and deferred financing fees and other, partially offset by the proceeds from borrowings on newbuild loan facilities.
For the Company’s cash flow activities for the fiscal year ended December 31, 2017, see “Item 7, Management’s Discussion and Analysis of Financial Condition and Results of Operations” in the Company’s Annual Report on Form 10-K for the year ended December 31, 2018, which was filed with the U.S. Securities and Exchange Commission on February 27, 2019.
Future Capital Commitments
Future capital commitments consist of contracted commitments, including ship construction contracts, and future expected capital expenditures necessary for operations as well as our ship refurbishment projects. As of December 31, 2019, anticipated capital expenditures were $1.4 billion, $1.2 billion and $2.6 billion for the years ending December 31, 2020, 2021 and 2022, respectively. We have export credit financing in place for the anticipated expenditures related to ship construction contracts of $0.5 billion, $0.2 billion and $1.3 billion for the years ending December 31, 2020, 2021 and 2022, respectively. These future expected capital expenditures will significantly increase our depreciation and amortization expense as we take delivery of the ships.
For the Norwegian Brand, Project Leonardo will introduce an additional six ships, each approximately 140,000 Gross Tons with approximately 3,300 Berths, with expected delivery dates from 2022 through 2027, subject to certain conditions. For the Regent brand, Seven Seas Splendor was delivered in January 2020. We have an order for one additional Explorer Class Ship to be delivered in 2023. Each of the Explorer Class Ships will be approximately 55,000 Gross Tons and 750 Berths. For the Oceania Cruises brand, we have orders for two Allura Class Ships to be delivered in 2022 and 2025. Each of the Allura Class Ships will be approximately 67,000 Gross Tons and 1,200 Berths.
The combined contract prices of the 10 ships on order for delivery as of December 31, 2019, including Seven Seas Splendor, which was delivered in January 2020, was approximately €7.4 billion, or $8.3 billion based on the euro/U.S. dollar exchange rate as of December 31, 2019. We have obtained export credit financing which is expected to fund approximately 80% of the contract price of each ship, subject to certain conditions. We do not anticipate any contractual breaches or cancellations to occur. However, if any such events were to occur, it could result in, among other things, the forfeiture of prior deposits or payments made by us and potential claims and impairment losses which may materially impact our business, financial condition and results of operations.
Capitalized interest for the years ended December 31, 2019 and 2018 was $32.9 million and $30.4 million, respectively, primarily associated with the construction of our newbuild ships.
Off-Balance Sheet Transactions
None.
Contractual Obligations
As of December 31, 2019, our contractual obligations with initial or remaining terms in excess of one year, including interest payments on long-term debt obligations, were as follows (in thousands):
| | | | | | | | | | | | | | | | |
|---|---|---|---|---|---|---|---|---|---|---|---|---|---|---|---|
| | | | Less than | | | | | More than | |||||||
| | | Total | 1 year | | 1-3 years | | 3-5 years | 5 years | |||||||
| Long-term debt (1) | | $ | 6,926,677 | | $ | 746,358 | | $ | 1,566,662 | | $ | 2,834,787 | | $ | 1,778,870 |
| Operating leases (2) | | 287,995 | | 47,796 | | | 63,988 | | | 63,493 | | | 112,718 | ||
| Ship construction contracts (3) | | 5,588,490 | | 556,784 | | 1,874,516 | | 2,327,887 | | 829,303 | |||||
| Port facilities (4) | | 2,086,925 | | 79,418 | | 135,720 | | 145,212 | | 1,726,575 | |||||
| Interest (5) | | 1,008,378 | | 218,243 | | | 361,982 | | 244,247 | | 183,906 | ||||
| Other (6) | | 1,362,172 | | 311,047 | | 456,938 | | 395,599 | | 198,588 | |||||
| Total (7) | | $ | 17,260,637 | | $ | 1,959,646 | | $ | 4,459,806 | | $ | 6,011,225 | | $ | 4,829,960 |
| (1) | Long-term debt includes premiums aggregating $0.2 million and capital leases. Long-term debt excludes deferred financing fees which are a direct deduction from the carrying value of the related debt liability in the consolidated balance sheets. |
|---|
| (2) | Operating leases are primarily for offices, motor vehicles and office equipment. |
|---|
| (3) | Ship construction contracts are for our newbuild ships based on the euro/U.S. dollar exchange rate as of December 31, 2019. Export credit financing is in place from syndicates of banks. The amount does not include the two Project Leonardo ships and one Allura Class Ship which were still subject to financing and certain Italian government approvals as of December 31, 2019. |
|---|
| (4) | Port facilities are for our usage of certain port facilities. |
|---|
| (5) | Interest includes fixed and variable rates with LIBOR held constant as of December 31, 2019. |
|---|
| (6) | Other includes future commitments for service, maintenance and other business enhancement capital expenditure contracts. |
|---|
| (7) | Total excludes $0.7 million of unrecognized tax benefits as of December 31, 2019, because an estimate of the timing of future tax settlements cannot be reasonably determined. |
|---|
Other
Certain service providers may require collateral in the normal course of our business. The amount of collateral may change based on certain terms and conditions.
As a routine part of our business, depending on market conditions, exchange rates, pricing and our strategy for growth, we regularly consider opportunities to enter into contracts for the building of additional ships. We may also consider the sale of ships, potential acquisitions and strategic alliances. If any of these transactions were to occur, they may be financed through the incurrence of additional permitted indebtedness, through cash flows from operations, or through the issuance of debt, equity or equity-related securities.
Funding Sources
Certain of our debt agreements contain covenants that, among other things, require us to maintain a minimum level of liquidity, as well as limit our net funded debt-to-capital ratio, and maintain certain other ratios and restrict our ability to pay dividends. Substantially all of our ships and other property and equipment are pledged as collateral for certain of our debt. We believe we were in compliance with these covenants as of December 31, 2019.
In addition, our existing debt agreements restrict, and any of our future debt arrangements may restrict, among other things, the ability of our subsidiaries, including NCLC, to make distributions and/or pay dividends to NCLH and NCLH’s ability to pay cash dividends to its shareholders. NCLH is a holding company and depends upon its subsidiaries for their ability to pay distributions to it to finance any dividend or pay any other obligations of NCLH. However, we do not believe that these restrictions have had or are expected to have an impact on our ability to meet any cash obligations.
The impact of changes in world economies and especially the global credit markets can create a challenging environment and may reduce future consumer demand for cruises and adversely affect our counterparty credit risks. In the event this environment deteriorates, our business, financial condition and results of operations could be adversely impacted.
We believe our cash on hand, expected future operating cash inflows, additional available borrowings under our Revolving Loan Facility and our ability to issue debt securities or additional equity securities, will be sufficient to fund operations, debt payment requirements, capital expenditures and maintain compliance with covenants under our debt agreements over the next 12-month period. There is no assurance that cash flows from operations and additional financings will be available in the future to fund our future obligations.
Item 7A. Quantitative and Qualitative Disclosures about Market Risk
General
We are exposed to market risk attributable to changes in interest rates, foreign currency exchange rates and fuel prices. We attempt to minimize these risks through a combination of our normal operating and financing activities and through the use of derivatives. The financial impacts of these derivative instruments are primarily offset by corresponding changes in the underlying exposures being hedged. We achieve this by closely matching the notional, term and conditions of the derivatives with the underlying risk being hedged. We do not hold or issue derivatives for trading or other speculative purposes. Derivative positions are monitored using techniques including market valuations and sensitivity analyses.
Interest Rate Risk
As of December 31, 2019, we had interest rate swap and collar agreements to hedge our exposure to interest rate movements and to manage our interest expense. As of December 31, 2019, 78% of our debt was fixed and 22% was variable, which includes the effects of the interest rate swaps and collars. The notional amount of outstanding debt associated with the interest rate swaps and collars was $1.7 billion as of December 31, 2019. As of December 31, 2018, 72% of our debt was fixed and 28% was variable, which includes the effects of the interest rate swaps. The notional amount of outstanding debt associated with the interest rate swap agreements was $1.0 billion as of December 31, 2018. The change in our fixed rate percentage from December 31, 2018 to December 31, 2019 was primarily due to higher outstanding fixed rate debt and additional interest rate swaps and collars executed.
Based on our December 31, 2019 outstanding variable rate debt balance, and adding as variable debt the principle amount of debt associated with interest rate swap agreements that matured on January 2, 2020, a one percentage point increase in annual LIBOR interest rates would increase our annual interest expense by approximately $20.9 million excluding the effects of capitalization of interest.
Foreign Currency Exchange Rate Risk
As of December 31, 2019, we had foreign currency derivatives to hedge the exposure to volatility in foreign currency exchange rates related to our ship construction contracts denominated in euros. These derivatives hedge the foreign currency exchange rate risk on a portion of the payments on our ship construction contracts. The payments not hedged aggregate €3.0 billion, or $3.4 billion based on the euro/U.S. dollar exchange rate as of December 31, 2019. As of December 31, 2018, the payments not hedged aggregated €2.2 billion, or $2.5 billion, based on the euro/U.S. dollar exchange rate as of December 31, 2018. The change from December 31, 2018 to December 31, 2019 was due to the delivery of a ship in October 2019 and additional foreign exchange derivatives executed. We estimate that a 10% change
in the euro as of December 31, 2019 would result in a $0.3 billion change in the U.S. dollar value of the foreign currency denominated remaining payments.
Fuel Price Risk
Our exposure to market risk for changes in fuel prices relates to the forecasted purchases of fuel on our ships. Fuel expense, as a percentage of our total cruise operating expense, was 11.2% for the year ended December 31, 2019 and 11.6% for the year ended December 31, 2018. We use fuel derivative agreements to mitigate the financial impact of fluctuations in fuel prices and as of December 31, 2019, we had hedged approximately 56%, 50% and 18% of our 2020, 2021 and 2022 projected metric tons of fuel purchases, respectively. As of December 31, 2018, we had hedged approximately 57%, 53% and 33% of our 2019, 2020 and 2021 projected metric tons of fuel purchases, respectively. The change in fuel price risk from December 31, 2018 to December 31, 2019 was due to additional fuel hedges executed.
We estimate that a 10% increase in our weighted-average fuel price would increase our anticipated 2020 fuel expense by $50.0 million. This increase would be partially offset by an increase in the fair value of our fuel swap agreements of $23.0 million. Fair value of our derivative contracts is derived using valuation models that utilize the income valuation approach. These valuation models take into account the contract terms such as maturity, as well as other inputs such as fuel types, fuel curves, creditworthiness of the counterparty and the Company, as well as other data points.
Item 8. Financial Statements and Supplementary Data
Our Consolidated Financial Statements and Quarterly Selected Financial Data are included beginning on page F-1 of this report.
Item 9. Changes In and Disagreements With Accountants on Accounting and Financial Disclosure
None.
Item 9A. Controls and Procedures
Evaluation of Disclosure Controls and Procedures
Our management has evaluated, with the participation of our Chief Executive Officer and Chief Financial Officer, the effectiveness of our disclosure controls and procedures, as such term is defined in Exchange Act Rule 13a-15(e), as of December 31, 2019. There are inherent limitations to the effectiveness of any system of disclosure controls and procedures, including the possibility of human error and the circumvention or overriding of the controls and procedures. Accordingly, even effective disclosure controls and procedures can only provide reasonable assurance of achieving their control objectives. Based upon management’s evaluation, our Chief Executive Officer and Chief Financial Officer concluded that our disclosure controls and procedures were effective as of December 31, 2019, to provide reasonable assurance that the information required to be disclosed by us in the reports we file or submit under the Exchange Act is recorded, processed, summarized and reported within the time periods specified in the rules and forms of the SEC, and that it is accumulated and communicated to our management, including our Chief Executive Officer and Chief Financial Officer, as appropriate to allow timely decisions regarding required disclosure.
Management’s Annual Report on Internal Control over Financial Reporting
Our management is responsible for establishing and maintaining adequate internal control over financial reporting, as such term is defined in Exchange Act Rule 13a-15(f). Under the supervision and with the participation of our management, including our Chief Executive Officer and Chief Financial Officer, we conducted an evaluation of the effectiveness of our internal control over financial reporting based on the 2013 Internal Control-Integrated Framework issued by the Committee of Sponsoring Organizations of the Treadway Commission (“COSO Framework”). Based on this evaluation under the COSO Framework, management concluded that our internal control over financial reporting was effective as of December 31, 2019.
The effectiveness of the Company’s internal control over financial reporting as of December 31, 2019 has been audited by PricewaterhouseCoopers LLP, an independent registered public accounting firm, as stated in their report, which is included on page F-1.
Changes in Internal Control Over Financial Reporting
There have been no changes in our internal control over financial reporting during the quarter ended December 31, 2019 that have materially affected, or are reasonably likely to materially affect, our internal control over financial reporting.
Limitations on the Effectiveness of Controls
It should be noted that any system of controls, however well designed and operated, can provide only reasonable, and not absolute, assurance that the objectives of the system will be met. In addition, the design of any control system is based in part upon certain assumptions about the likelihood of future events. Because of these and other inherent limitations of control systems, there is only the reasonable assurance that our controls will succeed in achieving their goals under all potential future conditions.
Item 9B. Other Information
None.
PART III
Item 10. Directors, Executive Officers and Corporate Governance
Except for information concerning executive officers (called for by Item 401(b) of Regulation S-K), which is included in Part I of this Annual Report and except as disclosed below with respect to our Code of Ethical Business Conduct, the information required under Item 10 is incorporated herein by reference to our definitive proxy statement to be filed with the SEC within 120 days after the end of our fiscal year ended December 31, 2019 in connection with our 2020 Annual General Meeting of Shareholders.
Code of Ethical Business Conduct
We have adopted a Code of Ethical Business Conduct that applies to all of our employees, including our principal executive officer, principal financial officer, principal accounting officer or controller and persons performing similar functions, and our directors. This document is posted on our website at www.nclhltdinvestor.com. We intend to disclose waivers from, and amendments to, our Code of Ethical Business Conduct that apply to our directors and executive officers, including our principal executive officer, principal financial officer, principal accounting officers or controller and persons performing similar functions, by posting such information on our website www.nclhltdinvestor.com to the extent required by applicable rules of the SEC and the NYSE. None of the websites referenced in this Annual Report or the information contained therein is incorporated herein by reference.
Item 11. Executive Compensation
The information required under Item 11 is incorporated herein by reference to our definitive proxy statement to be filed with the SEC within 120 days after the end of our fiscal year ended December 31, 2019 in connection with our 2020 Annual General Meeting of Shareholders.
Item 12. Security Ownership of Certain Beneficial Owners and Management and Related Stockholder Matters
The information required under Item 12 is incorporated herein by reference to our definitive proxy statement to be filed with the SEC within 120 days after the end of our fiscal year ended December 31, 2019 in connection with our 2020 Annual General Meeting of Shareholders.
Item 13. Certain Relationships and Related Transactions, and Director Independence
The information required under Item 13 is incorporated herein by reference to our definitive proxy statement to be filed with the SEC within 120 days after the end of our fiscal year ended December 31, 2019 in connection with our 2020 Annual General Meeting of Shareholders.
Item 14. Principal Accounting Fees and Services
The information required under Item 14 is incorporated herein by reference to our definitive proxy statement to be filed with the SEC within 120 days after the end of our fiscal year ended December 31, 2019 in connection with our 2020 Annual General Meeting of Shareholders.
PART IV
Item 15. Exhibits, Financial Statement Schedules
(1) Financial Statements
Our Consolidated Financial Statements have been prepared in accordance with Item 8. Financial Statements and Supplementary Data and are included beginning on page F-1 of this report.
(2) Financial Statement Schedules
Schedule II: Valuation and Qualifying Accounts for the three years ended December 31, 2019 are included on page 68.
(3) Exhibits
The exhibits listed below are filed or incorporated by reference as part of this annual report on Form 10-K.
INDEX TO EXHIBITS
| | | |
|---|---|---|
| 101** | | The following materials from Norwegian Cruise Line Holdings Ltd.’s Annual Report on Form 10‑K formatted in Inline XBRL: |
| | | |
| | | (i) the Consolidated Statements of Operations of NCLH for the years ended December 31, 2019, 2018 and 2017; |
| | | |
| | | (ii) the Consolidated Statements of Comprehensive Income of NCLH for the years ended December 31, 2019, 2018 and 2017; |
| | | |
| | | (iii) the Consolidated Balance Sheets of NCLH as of December 31, 2019 and 2018; |
| | | |
| | | (iv) the Consolidated Statements of Cash Flows of NCLH for the years ended December 31, 2019, 2018 and 2017; |
| | | |
| | | (v) the Consolidated Statements of Changes in Shareholders’ Equity of NCLH for the years ended December 31, 2019, 2018 and 2017; |
| | | |
| | | (vi) the Notes to the Consolidated Financial Statements; and |
| | | |
| | | (vii) Schedule II Valuation and Qualifying Accounts. |
| | | |
| 104** | | The cover page from Norwegian Cruise Line Holdings Ltd.’s Annual Report on Form 10-K for the year ended December 31, 2019, formatted in Inline XBRL and included in the interactive data files submitted as Exhibit 101. |
+ Confidential treatment has been granted with respect to certain portions of this exhibit. Omitted portions have been filed separately with the SEC.
Certain portions of this document that constitute confidential information have been redacted in accordance with Regulation S-K Item 601(b)(10).
- Management contract or compensatory plan.
** Filed herewith.
*** Furnished herewith.
Item 16. Form 10-K Summary
None.
SIGNATURES
Pursuant to the requirements of Section 13 or 15(d) of the Securities Exchange Act of 1934, as amended, the registrant has duly caused this annual report on Form 10-K to be signed on its behalf by the undersigned, thereunto duly authorized, in Miami, Florida, on February 27, 2020.
| NORWEGIAN CRUISE LINE HOLDINGS LTD. | ||
| By: | /s/ Frank J. Del Rio | |
| Name: | Frank J. Del Rio | |
| Title: | Director, President and Chief Executive Officer |
POWER OF ATTORNEY
Each person whose signature appears below constitutes and appoints Frank J. Del Rio, Mark A. Kempa, Daniel S. Farkas and Faye L. Ashby, and each of them, his or her true and lawful attorneys-in-fact and agents, each with full power of substitution and resubstitution, for him or her and in his or her name, place and stead, in any and all capacities, to sign any and all amendments to this annual report on Form 10-K, and to file the same, with exhibits thereto and other documents in connection therewith, with the SEC, granting unto said attorneys-in-fact and agents, and each of them, full power and authority to do and perform each and every act and thing requisite and necessary to be done, as fully to all intents and purposes as he or she might or could do in person, hereby ratifying and confirming all that each of said attorneys-in-fact and agents or their substitute or substitutes may lawfully so or cause to be done by virtue hereof.
Pursuant to the requirements of the Securities Exchange Act of 1934, as amended, this annual report on Form 10-K has been signed below by the following persons in the capacities and on the date indicated.
| Signature | Title | Date | ||
|---|---|---|---|---|
| /s/ Frank J. Del Rio | Director, President and Chief Executive Officer | February 27, 2020 | ||
| Frank J. Del Rio | (Principal Executive Officer) | |||
| /s/ Mark A. Kempa | Executive Vice President and Chief Financial Officer | February 27, 2020 | ||
| Mark A. Kempa | (Principal Financial Officer) | |||
| /s/ Faye L. Ashby | Senior Vice President and Chief Accounting Officer | February 27, 2020 | ||
| Faye L. Ashby | (Principal Accounting Officer) | |||
| /s/ Adam M. Aron | Director | February 27, 2020 | ||
| Adam M. Aron | ||||
| /s/ John Chidsey | Director | February 27, 2020 | ||
| John Chidsey | ||||
| /s/ Chad A. Leat | Director | February 27, 2020 | ||
| Chad A. Leat | ||||
| /s/ Steve Martinez | Director | February 27, 2020 | ||
| Steve Martinez | ||||
| /s/ David M. Abrams | Director | February 27, 2020 | ||
| David M. Abrams | ||||
| /s/ Stella David | Director | February 27, 2020 | ||
| Stella David | ||||
| /s/ Russell W. Galbut | Director | February 27, 2020 | ||
| Russell W. Galbut | ||||
| /s/ Pamela Thomas-Graham | Director | February 27, 2020 | ||
| Pamela Thomas-Graham | ||||
| /s/ Mary E. Landry | Director | February 27, 2020 | ||
| Mary E. Landry |
Norwegian Cruise Line Holdings Ltd.
Schedule II Valuation and Qualifying Accounts (in thousands)
| | | | | | | | | | | | | | | | |
|---|---|---|---|---|---|---|---|---|---|---|---|---|---|---|---|
| | | | | | Additions | | | | | | | ||||
| | | | Charged to | | | | | | | ||||||
| | Balance | costs and | Charged to | | | | Balance | ||||||||
| Description | | 12/31/16 | expenses | | other accounts | | Deductions (a) | | 12/31/17 | ||||||
| | | | | | | | | | | | | | | | |
| Valuation allowance on deferred tax assets | | $ | 64,573 | | $ | — | | $ | — | | $ | (22,419) | | $ | 42,154 |
| | | | | | | | | | | | | | | | |
|---|---|---|---|---|---|---|---|---|---|---|---|---|---|---|---|
| | | | Charged to | | | | | | | ||||||
| | Balance | | costs and | | Charged to | | | | | Balance | |||||
| Description | | 12/31/17 | expenses | | other accounts | | Deductions (a) | 12/31/18 | |||||||
| | | | | | | | | | | | | | | | |
| Valuation allowance on deferred tax assets | | $ | 42,154 | | $ | — | | $ | 276 | | $ | (506) | | $ | 41,924 |
| | | | | | | | | | | | | | | | |
|---|---|---|---|---|---|---|---|---|---|---|---|---|---|---|---|
| | | | Charged to | | | | | | | ||||||
| | | Balance | | costs and | | Charged to | | | | | Balance | ||||
| Description | 12/31/18 | expenses | | other accounts | | Deductions (a) | 12/31/19 | ||||||||
| | | | | | | | | | | | | | | | |
| Valuation allowance on deferred tax assets | | $ | 41,924 | | $ | — | | $ | — | | $ | (36,077) | | $ | 5,847 |
| (a) | Amount relates to (i) utilization of deferred tax assets, (ii) revaluation of deferred tax assets from their functional currency to U.S. dollars and (iii) reversal of valuation allowances. |
|---|
Index to Consolidated Financial Statements
Report of Independent Registered Public Accounting Firm
To the Board of Directors and Shareholders of Norwegian Cruise Line Holdings Ltd.
Opinions on the Financial Statements and Internal Control over Financial Reporting
We have audited the accompanying consolidated balance sheets of Norwegian Cruise Line Holdings Ltd. and its subsidiaries (the “Company”) as of December 31, 2019 and 2018, and the related consolidated statements of operations, of comprehensive income, of changes in shareholders’ equity and of cash flows for each of the three years in the period ended December 31, 2019, including the related notes and financial statement schedule listed in the index appearing under Item 15(2) (collectively referred to as the “consolidated financial statements”). We also have audited the Company's internal control over financial reporting as of December 31, 2019, based on criteria established in Internal Control - Integrated Framework (2013) issued by the Committee of
Showing the first 8K of 149K characters. Open the full section