 filings.tools
Item 5. Market for the Company’s Common Equity, Related Stockholder Matters and Issuer Purchases of Equity Securities
6K characters. Original on sec.gov · Markdown
Item 5. Market for the Company’s Common Equity, Related Stockholder Matters and Issuer Purchases of Equity Securities
Market Information and Dividends
Our common shares are listed on the Nasdaq Global Select Market under the symbol NDSN. As of November 30, 2023, there were 1,132 record shareholders.
While we have historically paid dividends to holders of our common shares on a quarterly basis, the declaration and payment of future dividends will depend on many factors, including but not limited to, our earnings, financial condition, business development needs and regulatory considerations, and are at the discretion of our board of directors.
Performance Graph
The following graph compares the 10-year cumulative return, calculated on a dividend-reinvested basis, from investing $100 on November 1, 2013 in Nordson common shares, the S&P 500 Index, the S&P MidCap 400 Index, the S&P 500 Industrial Machinery Index, the S&P MidCap 400 Industrial Machinery Index and our New Peer Group, which includes: AME, B, DCI, ENTG, GGG, GTLS, ICUI, IEX, ITT, KEYS, LECO, MKSI, NATI, TER, TFX, TRMB, VNT, WTS and WWD. For 2023, the Company made changes to its peer group to add ICU Medical, Inc., Teleflex Incorporated and Vontier Corporation, because each had fallen inside of the parameters used to establish the peer group.
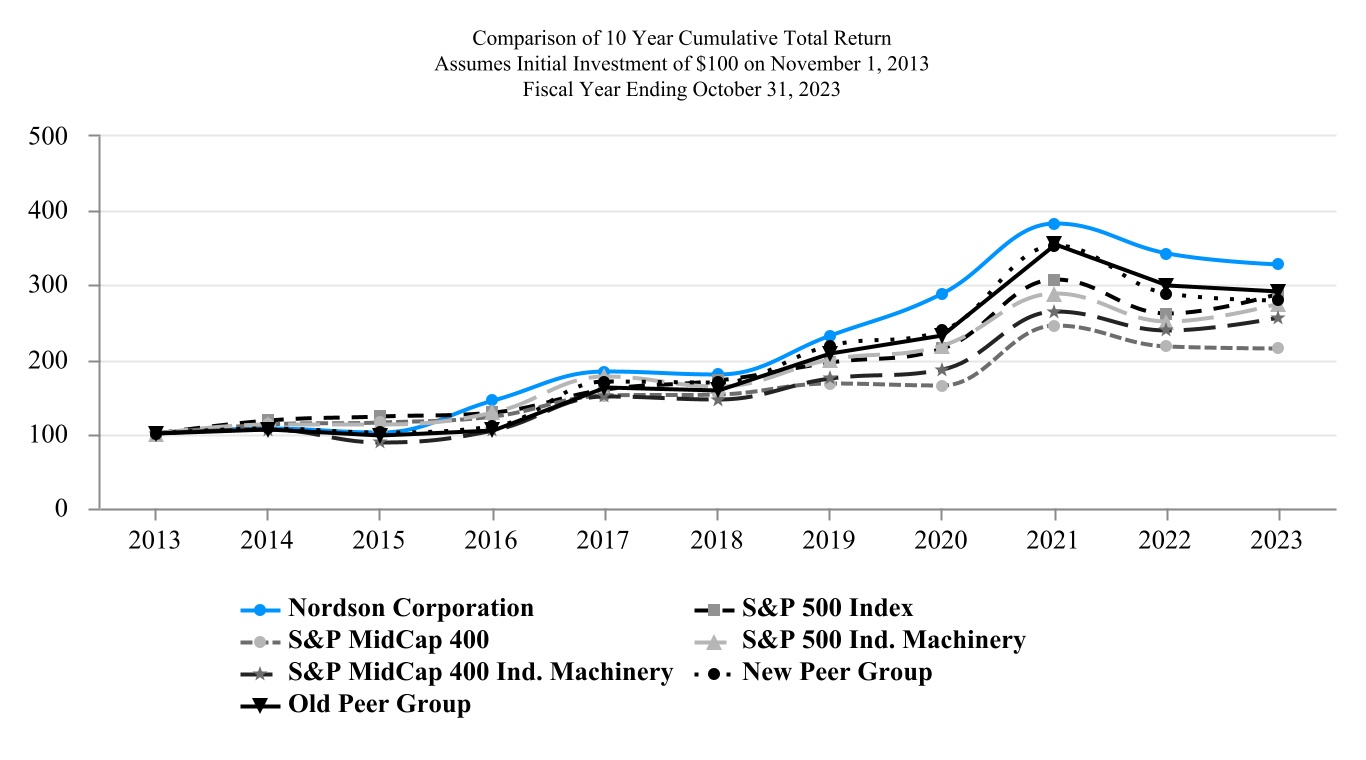
| Company/Market/Peer Group | 2013 | 2014 | 2015 | 2016 | 2017 | 2018 | 2019 | 2020 | 2021 | 2022 | 2023 | ||||||||||||||||||||||||
| Nordson Corporation | $ | 100.00 | $ | 107.27 | $ | 101.05 | $ | 143.92 | $ | 183.81 | $ | 179.62 | $ | 232.19 | $ | 288.97 | $ | 382.91 | $ | 342.16 | $ | 326.94 | |||||||||||||
| S&P 500 Index | $ | 100.00 | $ | 117.27 | $ | 123.37 | $ | 128.93 | $ | 159.40 | $ | 171.11 | $ | 195.62 | $ | 214.62 | $ | 306.72 | $ | 261.90 | $ | 288.47 | |||||||||||||
| S&P MidCap 400 | $ | 100.00 | $ | 111.65 | $ | 115.48 | $ | 122.70 | $ | 151.51 | $ | 153.05 | $ | 166.85 | $ | 164.93 | $ | 245.59 | $ | 217.25 | $ | 214.95 | |||||||||||||
| S&P 500 Ind. Machinery | $ | 100.00 | $ | 112.77 | $ | 112.60 | $ | 128.57 | $ | 177.25 | $ | 163.55 | $ | 199.45 | $ | 218.77 | $ | 288.76 | $ | 250.71 | $ | 274.53 | |||||||||||||
| S&P MidCap 400 Ind. Machinery | $ | 100.00 | $ | 105.97 | $ | 88.70 | $ | 104.10 | $ | 149.31 | $ | 146.17 | $ | 173.69 | $ | 185.60 | $ | 263.65 | $ | 238.86 | $ | 255.39 | |||||||||||||
| New Peer Group | $ | 100.00 | $ | 106.28 | $ | 101.89 | $ | 109.29 | $ | 169.60 | $ | 168.47 | $ | 218.26 | $ | 238.88 | $ | 352.61 | $ | 288.34 | $ | 279.39 | |||||||||||||
| Old Peer Group | $ | 100.00 | $ | 105.03 | $ | 98.04 | $ | 104.53 | $ | 161.72 | $ | 158.16 | $ | 207.66 | $ | 231.78 | $ | 353.85 | $ | 299.04 | $ | 290.36 |
Source: Zack’s Investment Research
Nordson Corporation 22
Common Share Repurchases
| (in whole shares) | Total Number of Shares Repurchased (1) | Average Price Paid per Share | Total Number of Shares Repurchased as Part of Publicly Announced Plans or Programs (2) | Maximum Value of Shares That May Yet Be Purchased Under the Plans or Programs (2) | |||||||||||||||||||
| August 1, 2023 to August 31, 2023 | 85 | $ | 248.26 | — | $ | 561,762 | |||||||||||||||||
| September 1, 2023 to September 30, 2023 | 8,171 | $ | 217.77 | 8,008 | $ | 560,018 | |||||||||||||||||
| October 1, 2023 to October 31, 2023 | 37,277 | $ | 215.18 | 37,277 | $ | 551,996 | |||||||||||||||||
| Total | 45,533 | 45,285 |
(1) Includes shares tendered for taxes related to stock option exercises and vesting of restricted stock.
(2) In December 2014, the board of directors authorized a $300,000 common share repurchase program. In August 2015, the board of directors authorized the repurchase of up to an additional $200,000 of the Company’s common shares. In August 2018, the board of directors authorized the repurchase of an additional $500,000 of the Company’s common shares. In September 2022, the board of directors authorized the repurchase of up to an additional $500,000 of the Company's common shares. Approximately $551,996 of the total $1,500,000 authorized remained available for share repurchases at October 31, 2023. Uses for repurchased shares include the funding of benefit programs including stock options and restricted stock. Shares purchased are treated as treasury shares until used for such purposes. The repurchase program will be funded using cash from operations and proceeds from borrowings under our credit facilities. The repurchase program does not have an expiration date.
Nordson Corporation 23
Previous: Item 4. Mine Safety Disclosures · Next: Item 7. Management's Discussion and Analysis of Financial Condition and Results of Operations