 filings.tools
Newmont 10-K 2020-12-31
Filed 2021-02-18. 18 sections, 1117K characters. Original on sec.gov · Markdown · JSON
Cover and table of contents
UNITED STATES
SECURITIES AND EXCHANGE COMMISSION
Washington, D. C. 20549
Form 10-K
(Mark One)
☒ ANNUAL REPORT PURSUANT TO SECTION 13 OR 15(d) OF THE SECURITIES EXCHANGE ACT OF 1934
For the Fiscal Year Ended December 31, 2020
or
☐ TRANSITION REPORT PURSUANT TO SECTION 13 OR 15(d) OF THE SECURITIES EXCHANGE ACT OF 1934
For the transition period from__________to__________
Commission File Number: 001-31240

NEWMONT CORPORATION
(Exact name of registrant as specified in its charter)
| Delaware | 84-1611629 | |||||||
| (State or Other Jurisdiction of Incorporation or Organization) | (I.R.S. Employer Identification No.) | |||||||
| 6900 E Layton Ave | ||||||||
| Denver, Colorado | 80237 | |||||||
| (Address of Principal Executive Offices) | (Zip Code) | |||||||
| Registrant’s telephone number, including area code (303) 863-7414 | ||||||||
Securities registered or to be registered pursuant to Section 12(b) of the Act.
| Title of each class | Trading Symbol | Name of each exchange on which registered | ||||||||||||
| Common stock, par value $1.60 per share | NEM | New York Stock Exchange |
Indicate by check mark if the registrant is a well-known seasoned issuer, as defined in Rule 405 of the Securities Act. ☒ Yes ☐ No
Indicate by check mark if the registrant is not required to file reports pursuant to Section 13 or Section 15(d) of the Exchange Act. ☐ Yes ☒ No
Indicate by check mark whether the registrant (1) has filed all reports required to be filed by Section 13 or 15(d) of the Securities Exchange Act of 1934 during the preceding 12 months (or for such shorter period that the registrant was required to file such reports), and (2) has been subject to such filing requirements for the past 90 days. ☒ Yes ☐ No
Indicate by check mark whether the registrant has submitted electronically every Interactive Data File required to be submitted pursuant to Rule 405 of Regulation S-T during the preceding 12 months (or for such shorter period that the registrant was required to submit such files). ☒ Yes ☐ No
Indicate by check mark whether the registrant is a large accelerated filer, an accelerated filer, a non-accelerated filer, a smaller reporting company, or an emerging growth company. See definitions of “large accelerated filer,” “accelerated filer,” “smaller reporting company,” and “emerging growth company” in Rule 12-b2 of the Exchange Act.
| Large accelerated filer | ☒ | Accelerated filer | ☐ | |||||||||||
| Non-accelerated filer | ☐ | Smaller reporting company | ☐ | |||||||||||
| Emerging growth company | ☐ |
If an emerging growth company, indicate by check mark if the registrant has elected not to use the extended transition period for complying with any new or revised financial accounting standards provided pursuant to Section 13(a) of the Exchange Act. ☐
Indicate by check mark whether the registrant is a shell company (as defined in Rule 12-b2 of the Exchange Act). ☐ Yes ☒ No
Indicate by check mark whether the Registrant has filed a report on and attestation to its management's assessment of the effectiveness of its internal control over financial reporting under Section 404(b) of the Sarbanes-Oxley Act (15 U.S.C. 7262(b)) by the registered public accounting firm that prepared or issued its audit report. ☒
At June 30, 2020, the aggregate market value of the registrant’s voting and non-voting common equity held by non-affiliates of the registrant was $49,521,911,826 based on the closing sale price as reported on the New York Stock Exchange. There were 800,314,223 shares of common stock outstanding on February 11, 2021.
DOCUMENTS INCORPORATED BY REFERENCE
Portions of Registrant’s definitive Proxy Statement submitted to the Registrant’s stockholders in connection with our 2021 Annual Stockholders Meeting to be held on April 28, 2021 are incorporated by reference into Part III of this report.
TABLE OF CONTENTS
NEWMONT CORPORATION
2020 RESULTS AND HIGHLIGHTS
(unaudited, in millions, except per share, per ounce and per pound)
| Years Ended December 31, | |||||||||||||||||||||||||||||
| 2020 | 2019 | 2018 | |||||||||||||||||||||||||||
| Financial Results: | |||||||||||||||||||||||||||||
| Sales | $ | 11,497 | $ | 9,740 | $ | 7,253 | |||||||||||||||||||||||
| Gold | $ | 10,350 | $ | 9,049 | $ | 6,950 | |||||||||||||||||||||||
| Copper | $ | 155 | $ | 210 | $ | 303 | |||||||||||||||||||||||
| Silver | $ | 510 | $ | 253 | $ | — | |||||||||||||||||||||||
| Lead | $ | 134 | $ | 85 | $ | — | |||||||||||||||||||||||
| Zinc | $ | 348 | $ | 143 | $ | — | |||||||||||||||||||||||
| Costs applicable to sales (1) | $ | 5,014 | $ | 5,195 | $ | 4,093 | |||||||||||||||||||||||
| Gold | $ | 4,408 | $ | 4,663 | $ | 3,906 | |||||||||||||||||||||||
| Copper | $ | 107 | $ | 145 | $ | 187 | |||||||||||||||||||||||
| Silver | $ | 201 | $ | 181 | $ | — | |||||||||||||||||||||||
| Lead | $ | 77 | $ | 77 | $ | — | |||||||||||||||||||||||
| Zinc | $ | 221 | $ | 129 | $ | — | |||||||||||||||||||||||
| Net income (loss) from continuing operations | $ | 2,628 | $ | 2,956 | $ | 319 | |||||||||||||||||||||||
| Net income (loss) | $ | 2,791 | $ | 2,884 | $ | 380 | |||||||||||||||||||||||
| Net income (loss) from continuing operations attributable to Newmont stockholders | $ | 2,666 | $ | 2,877 | $ | 280 | |||||||||||||||||||||||
| Per common share, diluted: | |||||||||||||||||||||||||||||
| Net income (loss) from continuing operations attributable to Newmont stockholders | $ | 3.31 | $ | 3.91 | $ | 0.53 | |||||||||||||||||||||||
| Net income (loss) attributable to Newmont stockholders | $ | 3.51 | $ | 3.81 | $ | 0.64 | |||||||||||||||||||||||
| Adjusted net income (loss) (2) | $ | 2,140 | $ | 970 | $ | 718 | |||||||||||||||||||||||
| Adjusted net income (loss) per share, diluted (2) | $ | 2.66 | $ | 1.32 | $ | 1.34 | |||||||||||||||||||||||
| Earnings before interest, taxes and depreciation and amortization (2) | $ | 5,751 | $ | 5,954 | $ | 2,160 | |||||||||||||||||||||||
| Adjusted earnings before interest, taxes and depreciation and amortization (2) | $ | 5,537 | $ | 3,734 | $ | 2,584 | |||||||||||||||||||||||
| Net cash provided by (used in) operating activities of continuing operations | $ | 4,890 | $ | 2,876 | $ | 1,837 | |||||||||||||||||||||||
| Free Cash Flow (2) | $ | 3,588 | $ | 1,413 | $ | 805 | |||||||||||||||||||||||
| Regular cash dividends paid per common share in the period ended December 31 | $ | 1.04 | $ | 0.56 | $ | 0.56 | |||||||||||||||||||||||
| Regular cash dividends declared per common share for the period ended December 31 | $ | 1.45 | $ | 0.56 | $ | 0.56 | |||||||||||||||||||||||
| Special dividend declared per common share in the period ended December 31 related to the 2019 Newmont Goldcorp transaction | $ | — | $ | 0.88 | $ | — |
____________________________
(1)Excludes Depreciation and amortization and Reclamation and remediation.
(2)See “Non-GAAP Financial Measures” within Part II, Item 7, Management's Discussion and Analysis.
NEWMONT CORPORATION
2020 RESULTS AND HIGHLIGHTS
(unaudited, in millions, except per share, per ounce and per pound)
| Years Ended December 31, | |||||||||||||||||||||||||||||
| 2020 | 2019 | 2018 | |||||||||||||||||||||||||||
| Operating Results: | |||||||||||||||||||||||||||||
| Consolidated gold ounces (thousands): | |||||||||||||||||||||||||||||
| Produced | 5,824 | 6,392 | 5,479 | ||||||||||||||||||||||||||
| Sold | 5,831 | 6,465 | 5,516 | ||||||||||||||||||||||||||
| Attributable gold ounces (thousands): | |||||||||||||||||||||||||||||
| Produced (1) | 5,905 | 6,291 | 5,101 | ||||||||||||||||||||||||||
| Sold (2) | 5,550 | 6,076 | 5,133 | ||||||||||||||||||||||||||
| Consolidated and attributable - other metals: | |||||||||||||||||||||||||||||
| Produced copper (million pounds) | 56 | 79 | 109 | ||||||||||||||||||||||||||
| Sold copper (million pounds) | 56 | 80 | 110 | ||||||||||||||||||||||||||
| Produced silver (thousand ounces) | 27,801 | 15,860 | — | ||||||||||||||||||||||||||
| Sold silver (thousand ounces) | 28,596 | 15,987 | — | ||||||||||||||||||||||||||
| Produced lead (million pounds) | 179 | 108 | — | ||||||||||||||||||||||||||
| Sold lead (million pounds) | 185 | 108 | — | ||||||||||||||||||||||||||
| Produced zinc (million pounds) | 381 | 187 | — | ||||||||||||||||||||||||||
| Sold zinc (million pounds) | 407 | 179 | — | ||||||||||||||||||||||||||
| Average realized price: | |||||||||||||||||||||||||||||
| Gold (per ounce) | $ | 1,775 | $ | 1,399 | $ | 1,260 | |||||||||||||||||||||||
| Copper (per pound) | $ | 2.78 | $ | 2.63 | $ | 2.74 | |||||||||||||||||||||||
| Silver (per ounce) | $ | 17.86 | $ | 15.79 | $ | — | |||||||||||||||||||||||
| Lead (per pound) | $ | 0.72 | $ | 0.79 | $ | — | |||||||||||||||||||||||
| Zinc (per pound) | $ | 0.86 | $ | 0.80 | $ | — | |||||||||||||||||||||||
| Consolidated costs applicable to sales: (3)(4) | |||||||||||||||||||||||||||||
| Gold (per ounce) | $ | 756 | $ | 721 | $ | 708 | |||||||||||||||||||||||
| Gold equivalent ounces - other metals (per ounce) (5) | $ | 571 | $ | 858 | $ | 782 | |||||||||||||||||||||||
| All-in sustaining costs: (4) | |||||||||||||||||||||||||||||
| Gold (per ounce) | $ | 1,045 | $ | 966 | $ | 909 | |||||||||||||||||||||||
| Gold equivalent ounces - other metals (per ounce) (5) | $ | 858 | $ | 1,222 | $ | 935 |
____________________________
(1)Attributable gold ounces produced includes 362, 287 and no ounces for the years ended December 31, 2020, 2019 and 2018, respectively, related to the Pueblo Viejo mine, which is 40 percent owned by Newmont and accounted for as an equity method investment.
(2)Attributable gold ounces sold excludes ounces related to the Pueblo Viejo mine, which is 40 percent owned by Newmont and accounted for as an equity method investment.
(3)Excludes Depreciation and amortization and Reclamation and remediation.
(4)See “Non-GAAP Financial Measures” within Part II, Item 7, Management's Discussion and Analysis.
(5)For the definition of gold equivalent ounces see “Results of Consolidated Operations" within Part II, Item 7, Management's Discussion and Analysis.
Highlights (dollars in millions, except per share, per ounce and per pound amounts)
-
Net income:** Delivered Net income (loss) from continuing operations attributable to Newmont stockholders of $2,666 or $3.31 per diluted share, a decrease of $211 from the prior year primarily due to the recognized gain on the formation of NGM in 2019, lower sales volumes from certain sites being placed in care and maintenance and the sale of Kalgoorlie and Red Lake, and higher costs in response to the COVID-19 pandemic; partially offset by higher average realized gold prices, gains related to sales of assets and investments, lower transaction and integration costs and lower General and administrative costs.
-
Adjusted net income:** Delivered Adjusted net income of $2,140 or $2.66 per diluted share, an increase of $1.34 from the prior year (see “Non-GAAP Financial Measures” within Part II, Item 7, Management's Discussion and Analysis).
-
Adjusted EBITDA:** Generated $5,537 in Adjusted EBITDA, an increase of 48% from the prior year (See “Non-GAAP Financial Measures” within Part II, Item 7, Management's Discussion and Analysis).
-
Cash Flow:** Reported Net cash provided by (used in) operating activities of continuing operations of $4,890 for the year ended December 31, 2020, an increase of 70% from the prior year, and free cash flow of $3,588 (See “Non-GAAP Financial Measures” within Part II, Item 7, Management's Discussion and Analysis).
-
Portfolio improvements:** Completed divestment of the Red Lake Complex in Canada, the Company’s 50 percent ownership interest in Kalgoorlie in Australia, investment holdings in Continental Gold, and a portfolio of eleven royalties; formed exploration joint ventures with Kirkland Lake Gold Inc. in Canada and Agnico Eagle Mines Limited in Colombia; completed materials handling projects at Musselwhite and Éléonore in Canada; progressed Autonomous Haulage System at Boddington in Australia, the Tanami Expansion 2 project in Australia, and a mining method change at Subika Underground in Ghana; advanced study work at Ahafo North and Yanacocha Sulfides with both projects expecting full funds approval in 2021.
-
Attributable gold production:** Produced 5.9 million ounces of gold, a decrease of 6% over the prior year.
-
Financial strength:** Ended the year with $5.5 billion of consolidated cash and approximately $8.5 billion of liquidity; increased total dividend declared for the period to $1.45 per share; completed the remaining $521 million of the 2020 share-repurchase program and announced a new $1 billion share-repurchase program to be completed over the next 18 months.
Our global project pipeline
Newmont’s capital-efficient project pipeline supports stable production with improving margins and mine life. Near-term development capital projects are presented below. Additional projects represent incremental improvements to production and cost guidance.
Tanami Expansion 2, Australia. This project secures Tanami’s future as a long-life, low cost producer with potential to extend mine life to 2040 through the addition of a hoisting shaft and supporting infrastructure to achieve higher production and provide a platform for future growth. The expansion is expected to increase average annual gold production by approximately 150,000 to 200,000 ounces per year for the first five years beginning in 2024, and is expected to reduce operating costs by approximately 10 percent. Development capital costs (excluding capitalized interest) since approval were $126, of which $112 related to 2020.
Musselwhite Materials Handling, North America. This project improves material movement from Musselwhite’s two main zones below Lake Opapimiskan. An underground shaft will hoist ore from the underground crushers, reducing haulage distances and ventilation costs. Commercial production was declared in December 2020.
We manage our wider project portfolio to maintain flexibility to address the development risks associated with our projects including permitting, local community and government support, engineering and procurement availability, technical issues, escalating costs and other associated risks that could adversely impact the timing and costs of certain opportunities.
COVID-19 Update
In December 2019, an outbreak of a novel strain of coronavirus originated in Wuhan, China (“COVID-19”) and was declared a pandemic by the World Health Organization in March 2020. COVID-19 has since spread worldwide, posing public health risks across the globe and has negatively impacted the global economy, disrupted global supply chains and workforce participation and created significant volatility and disruption of financial markets. The extent of the impact of the COVID-19 pandemic on our operational and financial performance will depend on future developments, including a widely available vaccine, the duration and severity of the pandemic and related restrictions, all of which are uncertain and cannot be predicted.
Impact on business and operations
Our operations have been affected by a range of external factors related to the COVID-19 pandemic that are not within our control. For example, during the first quarter and into April 2020, we placed five sites into care and maintenance including Musselwhite and Éléonore in Canada, Peñasquito in Mexico, Yanacocha in Peru and Cerro Negro in Argentina to protect nearby communities and align with country mandated travel restrictions or health considerations. During the second quarter of 2020, we worked closely with
local stakeholders to resume operations at all five mine sites. As of December 31, 2020, all sites were fully operational, with the exception of Cerro Negro that continues to progress its ramp up.
In April 2020, we established the Newmont Global Community Support Fund, a $20 fund to help host communities, governments and employees combat the COVID-19 pandemic, of which approximately $11 has been distributed through December 31, 2020. The fund is designed to focus on employee and community health, food security and local economic resilience through partnerships with local governments, medical institutions, charities and non-governmental organizations to address the greatest needs with long-term resiliency and future community development in mind.
Refer to "Health and Safety" within Part I, Item 1, Business and “Results of Consolidated Operations,” “Liquidity and Capital Resources,” “Non-GAAP Financial Measures” and “Accounting Developments” within Part II, Item 7, Management’s Discussion and Analysis for additional information about the impact of COVID-19 on our business and operations. For a discussion of COVID-19 related risks to the business, see Part I, Item 1A, Risk Factors.
PART I
Item 1. BUSINESS (dollars in millions, except per share, per ounce and per pound amounts)
Introduction
Newmont Corporation is primarily a gold producer with significant operations and/or assets in the United States, Canada, Mexico, Dominican Republic, Peru, Suriname, Argentina, Chile, Australia and Ghana. At December 31, 2020, Newmont had attributable proven and probable gold reserves of 94.2 million ounces and an aggregate land position of approximately 22,700 square miles (58,900 square kilometers). Newmont is also engaged in the production of copper, silver, lead and zinc. Newmont Corporation was incorporated in 1921 and is completing its 100th year as the world’s leading gold company.
Newmont’s corporate headquarters are in Denver, Colorado, USA. In this report, “Newmont,” the “Company,” “our” and “we” refer to Newmont Corporation together with our affiliates and subsidiaries, unless the context otherwise requires.
On April 18, 2019, we completed the acquisition of Goldcorp, Inc. (“Goldcorp”) (“the Newmont Goldcorp transaction”). Results of Goldcorp for the period April 18 to December 31, 2019 and the year ended December 31, 2020 are included in this report. For further information, see Note 3 to the Consolidated Financial Statements.
On July 1, 2019, we completed the formation of Nevada Gold Mines (“NGM”), in which we hold a 38.5% interest. As part of the formation of NGM, we contributed Carlin, Phoenix, Twin Creeks and Long Canyon (“existing Nevada mining operations”) in exchange for our 38.5% interest. Historically, our Phoenix operations in the United States produced copper as a co-product up until the formation of NGM, effective July 1, 2019 (the “effective date”), at which point copper became a by-product. Results of our existing Nevada mining operations for the six months ended June 30, 2019 and the year ended December 31, 2018 are included in this report. NGM is included for the period July 1 to December 31, 2019 and the year ended December 31, 2020, which is presented at our 38.5% proportionate share, unless otherwise indicated. For further information, see Note 32 to the Consolidated Financial Statements.
Segment Information
Our operations are organized in five geographic regions; North America, South America, Australia, Africa and Nevada. Our North America segment consists primarily of Cripple Creek & Victor (“CC&V”) in the United States of America (“U.S.” or “USA”), Musselwhite, Porcupine and Éléonore in Canada and Peñasquito in Mexico. Our South America segment consists primarily of Yanacocha in Peru, Merian in Suriname, Cerro Negro in Argentina and our 40% equity interest in the Pueblo Viejo mine. Our Australia segment consists primarily of Boddington and Tanami in Australia. Our Africa segment consists primarily of Ahafo and Akyem in Ghana. Our Nevada segment consists of NGM.
For the year ended December 31, 2019, our Nevada segment included Carlin, Phoenix, Twin Creeks and Long Canyon in the USA, which were contributed to NGM on July 1, 2019. See Note 32 to the Consolidated Financial Statements for further information.
At December 31, 2019, our Red Lake mine in our North America segment and Kalgoorlie mine in our Australia segment were held for sale and subsequently were sold in the first quarter of 2020. See Note 10 to the Consolidated Financial Statements for further information on our assets held for sale.
See Item 1A, Risk Factors, below, and Note 4 to the Consolidated Financial Statements for further information relating to our reportable segments. Refer to Note 5 to the Consolidated Financial Statements for information relating to domestic and export sales and lack of dependence on a limited number of customers.
Products
References in this report to “attributable” means that portion of gold, copper, silver, lead or zinc produced, sold or included in proven and probable reserves and mineralized material based on our proportionate ownership, unless otherwise noted.
Gold
General. We had consolidated gold production from continuing operations of 5.8 million ounces (5.5 million attributable gold ounces) in 2020, 6.4 million ounces (6.0 million attributable gold ounces) in 2019 and 5.5 million ounces (5.1 million attributable gold ounces) in 2018. Of our 2020 consolidated gold production, approximately 25% came from North America, 17% from South America, 20% from Australia, 15% from Africa and 23% from Nevada.
For 2020, 2019 and 2018, 90%, 93% and 96%, respectively, of our Sales were attributable to gold. Most of our Sales come from the sale of refined gold. The end product at our gold operations, however, is generally doré bars. Doré is an alloy consisting primarily of gold but also containing silver and other metals. Doré is sent to refiners to produce bullion that meets the required market standard of 99.95% gold. Under the terms of our refining agreements, the doré bars are refined for a fee, and our share of the refined gold and the separately-recovered silver is credited to our account or delivered to buyers. A portion of gold sold from Peñasquito in North America, Boddington in Australia and NGM and Phoenix (until the formation of NGM) in Nevada is sold in a concentrate containing other metals such as copper, silver, lead and/or zinc.
Gold Uses. Gold generally is used for fabrication or investment. Fabricated gold has a variety of end uses, including jewelry, electronics, dentistry, industrial and decorative uses, medals, medallions and official coins. Gold investors buy gold bullion, official coins and jewelry.
Gold Supply. A combination of mine production, recycling and draw-down of existing gold stocks held by governments, financial institutions, industrial organizations and private individuals make up the annual gold supply. Based on public information available, for the years 2018 through 2020, mine production has averaged approximately 70% of the annual gold supply.
Gold Price. The following table presents the annual high, low and average daily afternoon London Bullion Market Association (“LBMA”) Gold Price over the past ten years on the London Bullion Market ($/ounce):
| Year | High | Low | Average | |||||||||||||||||
| 2011 | $ | 1,895 | $ | 1,319 | $ | 1,572 | ||||||||||||||
| 2012 | $ | 1,792 | $ | 1,540 | $ | 1,669 | ||||||||||||||
| 2013 | $ | 1,694 | $ | 1,192 | $ | 1,411 | ||||||||||||||
| 2014 | $ | 1,385 | $ | 1,142 | $ | 1,266 | ||||||||||||||
| 2015 | $ | 1,296 | $ | 1,049 | $ | 1,160 | ||||||||||||||
| 2016 | $ | 1,366 | $ | 1,077 | $ | 1,251 | ||||||||||||||
| 2017 | $ | 1,346 | $ | 1,151 | $ | 1,257 | ||||||||||||||
| 2018 | $ | 1,355 | $ | 1,178 | $ | 1,268 | ||||||||||||||
| 2019 | $ | 1,546 | $ | 1,270 | $ | 1,393 | ||||||||||||||
| 2020 | $ | 2,067 | $ | 1,474 | $ | 1,770 | ||||||||||||||
| 2021 (through February 11, 2021) | $ | 1,943 | $ | 1,786 | $ | 1,856 |
On February 11, 2021, the afternoon LBMA gold price was $1,840 per ounce.
See Note 2 for information on how we recognize revenue for gold sales from doré production.
Other Co-product Metals
Generally, if a metal expected to be mined represents more than 10 to 20% of the life of mine sales value of all the metal expected to be mined, the metal is considered a co-product and recognized as Sales in the Consolidated Financial Statements.
In 2020, copper production at Boddington and silver, lead and zinc production at Peñasquito are considered co-products. In 2019, copper production at Boddington and Phoenix (until the formation of NGM) and silver, lead and zinc production at Peñasquito were considered co-products. In 2018, copper production at Boddington and Phoenix were considered co-products. Copper, silver, lead and zinc sales are generally in the form of concentrate that is sold to smelters for further treatment and refining.
Copper. We had consolidated co-product copper production of 56 million pounds in 2020, 79 million pounds in 2019 and 109 million pounds in 2018. For 2020, 2019 and 2018, 1%, 2% and 4%, respectively, of Sales were attributable to copper. All of our 2020 copper production came from Australia.
Silver. We had consolidated co-product silver production of 27.8 million ounces in 2020 and 15.9 million ounces in 2019. For 2020 and 2019, 5% and 3%, respectively, of Sales were attributable to silver. All of our 2020 silver production came from North America.
Lead. We had consolidated co-product lead production of 179 million pounds in 2020 and 108 million pounds in 2019. For 2020 and 2019, 1% and 1%, respectively, of Sales were attributable to lead. All of our 2020 lead production came from North America.
Zinc. We had consolidated co-product zinc production of 381 million pounds in 2020 and 187 million pounds in 2019. For 2020 and 2019, 3% and 1%, respectively, of Sales were attributable to zinc. All of our 2020 zinc production came from North America.
Gold and Other Metals Processing Methods
Doré. Gold is extracted from naturally-oxidized ores by either milling or heap leaching, depending on the amount of gold contained in the ore, the amenability of the ore to treatment and related capital and operating costs. Higher grade oxide ores are generally processed through mills, where the ore is ground into a fine powder and mixed with water into a slurry, which then passes through a carbon-in-leach circuit. Lower grade oxide ores are generally processed using heap leaching. Heap leaching consists of stacking crushed or run-of-mine ore on impermeable, synthetically lined pads where a weak cyanide solution is applied to the surface of the heap to dissolve the gold contained within the ore. In both cases, the gold-bearing solution is then collected and pumped to process facilities to remove the gold by collection on carbon or by zinc precipitation.
Gold contained in ores that are not naturally-oxidized can be directly milled if the gold is liberated and amenable to cyanidation, generally known as free milling ores. Ores that are not amenable to cyanidation, known as refractory ores, require more costly and complex processing techniques than oxide or free milling ore. Higher grade refractory ores are processed through either
roasters or autoclaves. Roasters heat finely ground ore to a high temperature, burn off the carbon and oxidize the sulfide minerals that prevent efficient leaching. Autoclaves use heat, oxygen and pressure to oxidize sulfide ores.
Some gold sulfide ores may be processed through a flotation plant. In flotation, ore is finely ground, turned into slurry, then placed in a tank known as a flotation cell. Chemicals are added to the slurry causing the gold-containing sulfides to attach to air bubbles and float to the top of the tank. The sulfides are removed from the cell and converted into a concentrate that can then be processed in an autoclave or roaster to recover the gold.
Concentrate. At Peñasquito, sulfide ore is delivered to a crushing and grinding plant which feeds a sulfide processing plant. The sulfide processing plant primarily comprises lead and zinc flotation stages. In the lead and zinc flotation, the slurry is conditioned with reagents to activate the desired minerals and produce lead and zinc concentrate. The lead concentrate is highly enriched in gold and silver, with a smaller fraction of the precious metal reporting to zinc concentrate. The resulting concentrate is sold to smelters or traders for further processing.
At Boddington and Phoenix (until the formation of NGM), ore containing copper and gold is crushed to a coarse size at the mine and then transported via conveyor to a process plant, where it is further crushed and then finely ground as a slurry. The ore is initially treated by successive stages of flotation resulting in a copper/gold concentrate containing approximately 15% to 20% copper. The flotation tailings have a residual gold content that is recovered in a carbon-in-leach circuit.
Competition
The top 10 producers of gold comprise approximately thirty percent of total worldwide mined gold production. We currently rank as the top gold producer with approximately six percent of estimated total worldwide mined gold production. Our competitive position is based on the size and grade of our ore bodies anchored in favorable mining jurisdictions and our ability to manage costs compared with other producers. We have a diverse portfolio of mining operations with varying ore grades and cost structures. Our costs are driven by the location, grade and nature of our ore bodies, and the level of input costs, including energy, labor and equipment. The metals markets are cyclical, and our ability to maintain our competitive position over the long term is based on our ability to acquire and develop quality deposits, hire and retain a skilled workforce, and to manage our costs.
Licenses and Concessions
Other than operating licenses for our mining and processing facilities, there are no third party patents, licenses or franchises material to our business. In many countries, however, we conduct our mining and exploration activities pursuant to concessions granted by, or under contracts with, the host government. These countries include, among others, the United States, Canada, Mexico, Peru, Suriname, Argentina, Australia and Ghana. The concessions and contracts are subject to the political risks associated with the host country. See Item 1A, Risk Factors, below for further information.
Condition of Physical Assets and Insurance
Our business is capital intensive and requires ongoing capital investment for the replacement, modernization or expansion of equipment and facilities. See “Results of Consolidated Operations" and "Liquidity and Capital Resources" within Part II, Item 7, Management’s Discussion and Analysis, for further information.
We maintain insurance policies against property loss and business interruption and insure against risks that are typical in the operation of our business, in amounts that we believe to be reasonable. Such insurance, however, contains exclusions and limitations on coverage, particularly with respect to environmental liability and political risk. There can be no assurance that claims would be paid under such insurance policies in connection with a particular event. See Item 1A, Risk Factors, below for further information.
Environmental, Social and Governance ("ESG")
Our sustainability strategy is a foundational element in achieving our purpose to create value and improve lives through sustainable and responsible mining. Sustainability and safety are integrated into the business at all levels of the organization through our global policies, standards, strategies, business plans and remuneration plans.
Mitigating and managing the inherent risks in our business is critical to our success and aligned with our stakeholders’ interests. We are committed to the responsible management of resources such as land, air quality, water and biodiversity, as well as putting the health and safety of our people first. Newmont's policies and standards support these efforts and guide our performance. In addition, we voluntarily participate in organizations and initiatives that provide a framework for action, a means for independently measuring and assuring our performance and a forum to learn and share best practices. We continue to develop complementary programs to guide our Company toward achieving environmental and social performance objectives in a transparent manner.
Our systems ensure effective health, safety, social responsibility and environmental performance is maintained at all of Newmont operations. Our Global Standards define the minimum expectations at all levels of the business and conformance is formally verified on a regular basis. Additionally, since 2007 we have assessed our environmental management systems against International Standards Organization ("ISO") 14001:2016 stipulations.
Our Combined Voluntary Commitments Assessment program, piloted in 2020, is designed to efficiently manage Newmont’s voluntary sustainability framework commitments, including asset and corporate level assurance and verification activities required for International Council on Mining and Metal’s ("ICMM") Performance Expectations, World Gold Council’s Responsible Gold Mining Principles and, where applicable, Towards Sustainable Mining. Performance against these sustainability frameworks will be publicly reported.
In 2020, we launched an integrated, global Compliance Audit program, which includes assessment of environment and social obligations such as those dictated in regulations, permits, community agreements and similar. Audits are completed at all Newmont's operations on a regular cadence by an independent, third-party audit team, and resulting actions are tracked to completion.
We accept the Intergovernmental Panel on Climate Change’s ("IPCC") assessment of climate science and acknowledge that human activities contribute to climate change and business has an important role in addressing this global challenge. We follow The Climate-related Financial Disclosures ("TCFD") guidelines to disclose climate-related governance, strategy, risk and metrics and targets designed to align with the Paris Agreement outcomes and the long-term goal to limit average temperature rise to well below 2 degrees Celsius. Newmont has participated in annual CDP (formerly "Carbon Disclosure Project") disclosures since 2004, and our greenhouse gas emissions are independently verified following the ISO 14064-3:2006 guidance for the validation and verification of greenhouse gas statements. In November 2020, we committed to industry leading climate targets of 30% reduction in greenhouse gas emissions by 2030, with an ultimate goal of achieving net zero carbon emissions by 2050. As part of this commitment, we will be investing $500 million in climate change initiatives over the next five years, from 2021 through 2025.
We actively participate in the ICMM and are committed to the ICMM’s Mining Principles and its commitment to implement the Ten Principles of the UN Global Compact on human rights, bribery and corruption, labor and the environment. Our compliance to the Mining Principles and any mandatory requirements set out in ICMM Position Statements is externally assured in line with the ICMM Sustainable Development Framework: Assurance Procedure.
We are the only gold producer listed in the S&P 500 Index and are widely recognized for our principled ESG practices. As the second-most transparent reporter in the S&P 500 (as measured by the Bloomberg ESG Disclosure score), we annually report on our sustainability performance in accordance with the Global Reporting Initiative ("GRI") Standards Core option, the GRI Mining and Metals Sector Supplement and the Sustainability Accounting Standards Board ("SASB") guidelines for the Extractives and Minerals Processing Sector (version 2018-10). Newmont was ranked the top miner in June 2020 in 3BL Media’s 100 Best Corporate Citizens list which ranks the 1,000 largest publicly traded U.S. companies on ESG transparency and performance. Additionally, in 2020, for the sixth year in a row, Newmont was ranked as the mining and metal sector’s top gold miner by the SAM S&P Corporate Sustainability Assessment, and we have been listed on the Dow Jones Sustainability World Index (“DJSI World”) since 2007.
Environmental Matters
Our operations span four continents in a range of ecosystems that include tropical, desert and arctic climates. We understand the impact our activities can have on the environment and are committed to protect and prevent – or otherwise minimize, mitigate and remediate – those impacts in the areas where we operate.
Our mining and exploration activities are subject to various laws and regulations in multiple jurisdictions governing the protection of the environment. These laws and regulations are continually changing and are generally becoming more restrictive. For a discussion of related risks, see Part I, Item 1A, Risk Factors.
We conduct our operations so as to protect public health and the environment and believe our operations are in compliance with applicable laws and regulations in all material respects. Each operating mine has a reclamation plan in place that meets, in all material respects, applicable legal and regulatory requirements. We are also involved in several matters concerning environmental obligations associated with former, primarily historic, mining activities. Generally, these matters concern developing and implementing remediation plans at the various sites.
For a discussion of the most significant reclamation and remediation activities, see Note 6 and Note 31 to the Consolidated Financial Statements.
Newmont's People
At Newmont, one of the strategic pillars is people, which forms the basis of our business planning and establishes objectives by which we measure our performance. The success of our business comes from the accomplishments and well-being of our employees and contractors. Our goal is to build a workplace culture that fosters leaders and allows every person to thrive, contribute, and grow.
Approximately 14,300 people were employed by Newmont and Newmont subsidiaries and approximately 13,500 people were working as contractors in support of Newmont’s operations at December 31, 2020. Additionally, at December 31, 2020, 39% of our workforce were members of a union or participate in a collective bargaining agreement. We are committed to fostering solid relationships with all members of our workforce based on trust, treating workers fairly and providing them with safe and healthy working conditions. For a discussion of related risks, see Part I, Item 1A, Risk Factors.
Inclusion and Diversity
The people who work on our behalf give us a competitive advantage. Through our global human capital strategy, we align our talent management efforts with the overall business strategy. The strategy’s focus areas include enhancing the employee experience and evolving for future workforce needs; building our bench strength and leadership capabilities; developing effective labor relations that align stakeholders with a shared future; and improving inclusion, including reaching gender parity. We believe that progressing an inclusive workplace culture is a critical part of tackling the challenge of attracting and retaining diverse employees.
Setting the tone at the top, the Company’s Board has been recognized as a leader in Board diversity and inclusive leadership. Our Board values diversity across a number of categories, including diversity of gender, race, ethnicity and nationality, as well as professional backgrounds, in order to insure that the mix of perspectives, expertise and skills necessary to oversee execution of the Company's strategy are present in our boardroom. During 2020, the Newmont Board achieved gender parity amongst independent Directors, with 50 percent female representation, and 70 percent of our independent Directors falling within either gender or ethnically diverse categories as of December 31, 2020. The diverse nature of our directors, with experiences across various industries and operating regions, enhance oversight of our global organization and strategy.
In 2020, we were also active participants in the Paradigm for Parity framework, a coalition of business leaders committed to a workplace where women and men have equal power, status and opportunity in senior leadership by 2030, and we are committed to advancing the UN Sustainable Development Goal to achieve gender equality. In our annual sustainability report, Newmont voluntarily reports workforce and labor information in accordance with GRI Sustainability Reporting Standards, including data on workforce demographics, compensation and equal remuneration, gender diversity, union representation, labor relations, employee turnover, hiring representation, and training and development.
Emphasis on health, safety and sustainability
The importance of ESG performance is emphasized with our workforce through our training and development programs and our compensation design. Employees eligible for our short-term incentive plan are held accountable for the Company’s health, safety and sustainability performance through Newmont’s performance based compensation structure. ESG will comprise 30% of the Company’s Short-term Incentive Plan payout for 2020, with 20% allocated to health & safety metrics and 10% to sustainability performance based upon key public indices. In 2020, Newmont generated strong results in our health and safety and our sustainability measures with all sites and regions having performed above target for their critical control verifications to support fatality risk management, and significant progress on fatigue and wellbeing risk reduction plans. Additional information regarding the Company’s compensation programs and performance will be provided in the 2020 Proxy Statement, expected to be filed with the SEC on or about March 12, 2021.
For a discussion of related risks, see Part I, Item 1A, Risk Factors.
Health and Safety
We believe that our operations are in compliance with applicable laws and regulations in all material respects. We continue to sustain robust controls at our operations and offices around the globe, including heightened levels of health screening and testing, in connection with COVID-19, to protect both our workforce and the local communities in which we operate. In addition, the Company has an established Health & Safety Management System and Health, Safety and Security Standards that in most cases exceed regulatory requirements in the jurisdictions in which we operate. The quality of our Health & Safety Management System is audited regularly as part of our assurance and governance process.
The safety of our people and the communities in which we operate is a priority core value; with the right to life and right to safe working conditions among our most salient human rights and key priorities. We strongly believe it is possible to effectively manage these risks, ensuring that everyone returns home safely at the end of the day. To drive a fatality, injury and illness free culture, Newmont has centered its health, safety and security activities on four key focus areas: leadership; fatality prevention; occupational health and wellness; and security threat management.
In 2020 we transformed our fatality risk management program resulting in over 70,000 in-field critical control verifications being undertaken, and a large proportion via our new mobile application. These verifications were undertaken by various levels of leadership who increased their visible field presence. A shift in focus to engineering controls and technology resulted in new Vehicles and Driving standards which includes minimum vehicle specifications. Similarly, the focus on eliminating "live work" has resulted in innovative redesigning of tasks to eliminate our teams exposure to this critical risk.
COVID-19 Impact
The outbreak of COVID-19 was declared a pandemic by the World Health Organization in March 2020. COVID-19 has since spread worldwide, posing public health risks across the globe and has negatively impacted the global economy, disrupted global supply chains and workforce participation and created significant volatility and disruption of financial markets. In response to the COVID-19 pandemic we fully mobilized our business continuity plans and rapid response crisis management teams and worked closely with host
and indigenous communities, regional and national governments and medical experts to protect our workforce and nearby communities, while also taking steps to preserve the long-term value of our business.
As a global business, we are committed to doing our part to combat this disease and protect people and their livelihoods. Newmont engaged its Rapid Response process early in connection with the on-going COVID-19 pandemic and proactively took conservative steps to prevent further transmission in 2020. These include, but are not limited to:
-
Strict social distancing protocols and suspension of large indoor gatherings;
-
Flexible and remote working plans for employees;
-
Enhancing temperature and questionnaire screening at entry to sites;
-
Screening stations established both pre-travel and on-entry incorporating the use of antibody and/or polymerase chain reaction (PCR) testing for sites in high risk locations;
-
Increased inventory of hand sanitizer, soap and hygiene supplies;
-
Providing logistical and healthcare support to nearby communities where needed;
-
Restricting all non-essential travel;
-
Restricting entrance to sites to business-critical visits, essential deliveries and critical contract workers;
-
Implementing strict physical distancing protocols in planes, buses, light vehicles, offices and dining facilities;
-
Increased frequency of deep cleaning and sanitization of surfaces; and
-
Mandatory self-quarantine for anyone who has traveled internationally, has flu-like symptoms or who has had direct contact with any person known to have COVID-19.
Additionally, in April 2020, we established the Newmont Global Community Support Fund, a $20 fund to help host communities, governments and employees combat the COVID-19 pandemic, of which approximately $11 has been distributed through December 31, 2020. The fund is designed to focus on employee and community health, food security and local economic resilience through partnerships with local governments, medical institutions, charities and non-governmental organizations to address the greatest needs with long-term resiliency and future community development in mind.
Refer to “Consolidated Financial Results,” “Results of Consolidated Operations” and “Liquidity and Capital Resources” within Part II, Item 7, Management’s Discussion and Analysis for additional information about the impact of COVID-19 on our business and operations. For a discussion of COVID-19 related risks to the business, see Part I, Item 1A, Risk Factors.
Risk Factor Summary
We are subject to a variety of risks and uncertainties, including risks related to our operations and business, financial risk, risks related to our industry, risks related to the jurisdictions in which we operate, risks related to our workforce, legal risks and risks related to our common stock, which could have a material adverse effect on our business, financial condition, results of operations and cash flows. Risks that we deem material are described under “Risk Factors” in Item 1A of this report. These risks include, but are not limited to, the following:
-
Our operations and business have been affected by the COVID-19 pandemic, and may be materially and adversely impacted in the future.
-
A substantial or extended decline in gold, silver, copper, zinc or lead prices would have a material adverse effect on us.
-
We may be unable to replace gold, silver, copper, zinc or lead reserves as they become depleted.
-
Estimates of proven and probable reserves and mineralized material are uncertain and actual recoveries may vary from our estimates.
-
Estimates relating to projects and mine plans of existing operations are uncertain and we may incur higher costs and lower economic returns than estimated.
-
Increased operating and capital costs could affect our profitability.
-
Mine closure, reclamation and remediation costs for environmental liabilities may exceed the provisions we have made.
-
Challenges in maintaining positive community relations and reputation can pose additional obstacles to our ability to develop our projects.
-
We are dependent upon information technology and operational technology systems, which are subject to disruption, damage, failure and risks associated with implementation, upgrade, operation and integration.
-
Our interests in joint ventures remains subject to risk.
-
Increased exposure to foreign exchange fluctuations and capital controls may adversely affect Newmont’s costs, earnings and the value of some of our assets.
-
Inflation may have a material adverse effect on results of operations.
-
Future funding requirements may affect our business, our ability to pay cash dividends or our ability to engage in share repurchase transactions.
-
Any downgrade in the credit ratings assigned to our debt securities could increase our future borrowing costs and adversely affect the availability of new financing.
-
Our goodwill could become impaired, which could have a material non-cash adverse effect on our results of operations.
-
Our ability to recognize the benefits of deferred tax assets is dependent on future cash flows and taxable income.
-
Illegal mining and artisanal mining occurs on or adjacent to certain of our properties exposing such sites to security risks, and civil disturbances and criminal activities can disrupt business and expose the Company to liability.
-
Competition from other natural resource companies may harm our business.
-
We may experience increased costs or losses resulting from the hazards and uncertainties associated with mining.
-
We may be unable to obtain or retain necessary permits, which could adversely affect our operations.
-
Mining companies are increasingly required to consider and provide benefits to the communities and countries in which they operate.
-
Our operations are subject to extensive health and safety and environmental laws and regulations.
-
Our operations are subject to a range of physical risks related to climate change and geotechnical challenges.
-
Our operations may be adversely affected by rising energy prices or energy shortages.
-
Continuation of our mining production is dependent on the availability of sufficient water supplies to support our mining operations.
-
Our operations are subject to risks of doing business in multiple jurisdictions, including political, economic and other risks.
-
Our business depends on good relations with our employees, and if we are unable to attract and retain additional highly skilled employees, our business and future operations may be adversely affected
-
We rely on contractors to conduct a significant portion of our operations and construction projects.
-
New legislation and tax risks in various operating jurisdictions could negatively affect us.
-
Our business is subject to changing regulations and laws, including, without limitation, extraterritorial and domestic anti-bribery laws and regulations, a breach or violation of which could lead to substantial sanctions and civil and criminal prosecution, as well as fines and penalties, litigation, loss of licenses or permits and other collateral consequences and reputational harm.
-
Title to some of our properties may be insufficient, defective, or subject to legal challenge in the future.
-
The price of our common stock may be volatile, and holders of our common stock may not receive dividends in the future.
Additional risks and uncertainties not presently known to us or that we currently deem immaterial also may impair our business, financial condition, results of operations and cash flows.
Forward-Looking Statements
Certain statements contained in this report (including information incorporated by reference herein) are “forward-looking statements” within the meaning of Section 27A of the Securities Act of 1933, as amended (the “Securities Act”), and Section 21E of the Securities Exchange Act of 1934, as amended (the “Exchange Act”), and are intended to be covered by the safe harbor provided for under these sections. Words such as “expect(s),” “feel(s),” “believe(s),” “will,” “may,” “anticipate(s),” “estimate(s),” “should,” “intend(s)” and similar expressions are intended to identify forward-looking statements. Our forward-looking statements may include, without limitation:
-
estimates regarding future earnings and the sensitivity of earnings to gold, copper, silver, lead, zinc and other metal prices;
-
estimates of future mineral production and sales;
-
estimates of future production costs, other expenses and taxes for specific operations and on a consolidated basis;
-
estimates of future cash flows and the sensitivity of cash flows to gold, copper, silver, lead, zinc and other metal prices;
-
estimates of future capital expenditures, construction, production or closure activities and other cash needs, for specific operations and on a consolidated basis, and expectations as to the funding or timing thereof;
-
estimates as to the projected development of certain ore deposits, including the timing of such development, the costs of such development and other capital costs, financing plans for these deposits and expected production commencement dates;
-
estimates of reserves and statements regarding future exploration results and reserve replacement and the sensitivity of reserves to metal price changes;
-
statements regarding the availability of, and terms and costs related to, future borrowing or financing and expectations regarding future share repurchase transactions, debt repayments or debt tender transactions;
-
statements regarding future dividends and return to shareholders;
-
estimates regarding future exploration expenditures, results and reserves and mineralized material;
-
statements regarding fluctuations in financial and currency markets;
-
estimates regarding potential cost savings, productivity, operating performance and ownership and cost structures;
-
expectations regarding statements regarding future transactions, including, without limitation, statements related to future acquisitions and projected benefits, synergies and costs associated with acquisitions and related matters;
-
expectations of future equity and enterprise value;
-
expectations regarding the start-up time, design, mine life, production and costs applicable to sales and exploration potential of our projects;
-
statements regarding future hedge and derivative positions or modifications thereto;
-
statements regarding local, community, political, economic or governmental conditions and environments;
-
statements and expectations regarding the impacts of COVID-19 and other health and safety conditions;
-
statements regarding the impacts of changes in the legal and regulatory environment in which we operate, including, without limitation, relating to regional, national, domestic and foreign laws;
-
statements regarding expected changes in the tax regimes in which we operate, including, without limitation, estimates of future tax rates and estimates of the impacts to income tax expense, valuation of deferred tax assets and liabilities, and other financial impacts;
-
estimates of income taxes and expectations relating to tax contingencies or tax audits;
-
estimates of future costs, accruals for reclamation costs and other liabilities for certain environmental matters;
-
statements relating to potential impairments, revisions or write-offs, including without limitation, the result of fluctuation in metal prices, unexpected production or capital costs, or unrealized reserve potential;
-
estimates of pension and other post-retirement costs;
-
statements regarding estimates of timing of voluntary early adoption of recent accounting pronouncements and expectations regarding future impacts to the financial statements resulting from accounting pronouncements;
-
statements regarding adoption of disclosure standards under new Regulation S-K Subpart 1300 and expectations of future adjustments to estimates of reserves or mineralized material;
-
estimates of future cost reductions, synergies, savings and efficiencies in connection with full potential programs and initiatives; and
-
expectations regarding future exploration and the development, growth and potential of operations, projects and investments.
Where we express an expectation or belief as to future events or results, such expectation or belief is expressed in good faith and believed to have a reasonable basis. However, our forward-looking statements are subject to risks, uncertainties and other factors, which could cause actual results to differ materially from future results expressed, projected or implied by those forward-looking statements. Such risks include, but are not limited to:
-
the price of gold, copper, silver, lead, zinc and other metal prices and commodities;
-
the cost of operations;
-
currency fluctuations;
-
geological and metallurgical assumptions;
-
operating performance of equipment, processes and facilities;
-
labor relations;
-
timing of receipt of necessary governmental permits or approvals;
-
domestic and foreign laws or regulations, particularly relating to the environment, mining and processing;
-
changes in tax laws;
-
domestic and international economic and political conditions;
-
our ability to obtain or maintain necessary financing; and
-
other risks and hazards associated with mining operations.
More detailed information regarding these factors is included in Item 1A, Risk Factors and elsewhere throughout this report. Many of these factors are beyond our ability to control or predict. Given these uncertainties, readers are cautioned not to place undue reliance on our forward-looking statements.
All subsequent written and oral forward-looking statements attributable to Newmont or to persons acting on its behalf are expressly qualified in their entirety by these cautionary statements. We disclaim any intention or obligation to update publicly any forward-looking statements, whether as a result of new information, future events or otherwise, except as may be required under applicable securities laws.
Available Information
Newmont maintains a website at www.newmont.com and makes available, through the Investor Relations section of the website, its Annual Reports on Form 10-K, Quarterly Reports on Form 10-Q, Current Reports on Form 8-K, Section 16 filings and all amendments to those reports, as soon as reasonably practicable after such material is electronically filed with the Securities and Exchange Commission (“SEC”). Certain other information, including Newmont’s Corporate Governance Guidelines, the charters of key committees of its Board of Directors and its Code of Conduct are also available on the website.
Item 1A. RISK FACTORS (dollars in millions, except per share, per ounce and per pound amounts)
Our business activities are subject to significant risks, including those described below. You should carefully consider these risks. If any of the described risks actually occurs, our business, financial position and results of operations could be materially adversely affected. Such risks are not the only ones we face and additional risks and uncertainties not presently known to us or that we currently deem immaterial may also affect our business. This report contains forward-looking statements that involve risks and uncertainties. Our actual results could differ materially from those anticipated in the forward-looking statements as a result of a number of factors, including the risks described below. See “Forward-Looking Statements.”
Risks Related to Our Operations and Business
Our operations and business have been affected by the COVID-19 pandemic, and may be materially and adversely impacted in the future.
The Company faces risks related to health epidemics and other outbreaks of communicable diseases, which could significantly disrupt operations and may materially and adversely affect its business and financial conditions. In March 2020, the World Health Organization declared COVID-19 a pandemic. The COVID-19 pandemic has had an ongoing material impact on the global economy, the duration of which remains uncertain. The COVID-19 pandemic has also disrupted global supply chains and workforce participation, including our own, and created significant volatility and disruption of financial markets.
While the medical community is progressing development of vaccines and other treatment options and governmental agencies, private agencies and the Company seek to mitigate the spread of COVID-19, the efficacy and timing of such measures remains uncertain. Efforts to slow the spread of COVID-19 have already impacted the operation of Newmont’s mines and the development of projects and led to the temporary cancellation of certain exploration activities. For companies, such as Newmont, that operate in multiple jurisdictions, disadvantage and risk of loss due to the limitations of certain local health systems and infrastructure to contain diseases and potential endemic health issues may occur. A number of governments declared states of emergency and implemented restrictive measures such as travel bans, quarantine and self-isolation. Whether additional isolation or restrictions on non-essential business will be put in place again in the future (such as a stay-in, shelter-in place or similar orders) as a COVID-19 mitigation initiative, whether mining will be considered an essential business (and therefore exempt and able to maintain its business operations as adjusted for COVID-19 risks) and the duration of any such orders will remain outside of the Company’s control and are subject to the regulations issued by the respective governments.
The Company carefully considers government restrictions and the needs of its employees and host communities. For example, in order to protect nearby communities and align with government travel restrictions or health considerations in Argentina, Canada, Peru and Mexico, five of Newmont’s operations were temporarily put into care and maintenance during March and April 2020. Although all such sites safely recommenced activities, if there is an increase in incidents of COVID-19 in those countries or regions or other
jurisdictions in which the Company operates, there may be further restrictions put in place by the governments or the Company which could result in an adverse impact to operations and productivity at those sites.
Additionally, the Company incurred, and will continue to incur costs as a result of actions taken to protect against the impacts of the COVID-19 pandemic and to comply with local mandates, including but not limited to contributions to the Newmont Global Community Support Fund, additional health screenings, incremental travel, security and employee related costs.
Based upon evolving contagion rates or occurrences at our operating sites, senior management or the Board may decide to reduce operational activities and limit activities to essential care and maintenance procedures including the management of critical environmental systems. Such reductions in our operational activities could have a material adverse impact on our business, or financial condition, results of operations and cash flows. The impact of this pandemic could include additional sites being placed into care and maintenance. If the majority of our sites are placed into care and maintenance, this could significantly reduce our cash flow and impact our ability to meet certain covenants related to our revolving credit facility and borrowing capacity.
Other impacts of changing government restriction could include prolonged travel restraints, more stringent shipment restraints, delays in product refining and smelting due to restrictions or temporary closures, other supply chain disruptions and workforce interruptions, including loss of life, and reputational damage in connection with challenges or reactions to action or perceived inaction by the Company related to the COVID-19 pandemic, which could have a material adverse effect on the Company’s cash flows, earnings, results of operations and financial position.
The full extent to which COVID-19 impacts the Company will depend on future developments, including the roll out and effectiveness of the COVID-19 vaccines, which remain uncertain.
A substantial or extended decline in gold, silver, copper, zinc or lead prices would have a material adverse effect on us.
Our business is dependent on the prices of gold, silver, copper, zinc and lead, which fluctuate on a daily basis and are affected by numerous factors beyond our control. Factors tending to influence prices include:
-
Gold sales, purchases or leasing by governments and central banks;
-
Speculative short positions taken by significant investors or traders in gold, copper, silver, lead, zinc or other metals;
-
The relative strength of the U.S. dollar;
-
The monetary policies employed by the world’s major Central Banks;
-
The fiscal policies employed by the world’s major industrialized economies;
-
Expectations of the future rate of inflation;
-
Interest rates;
-
Recession or reduced economic activity in the United States, China, India and other industrialized or developing countries;
-
Decreased industrial, jewelry, base metal or investment demand;
-
Increased import and export taxes;
-
Increased supply from production, disinvestment and scrap;
-
Forward sales by producers in hedging or similar transactions;
-
Availability of cheaper substitute materials; and
-
Changing investor or consumer sentiment, including in connection with transition to a low-carbon economy, investor interest in crypto currencies and other investment alternatives and other factors.
Average gold prices for 2020 were $1,770 per ounce (2019: $1,393; 2018: $1,268), average copper prices for 2020 were $2.80 per pound (2019: $2.72; 2018: $2.96), average silver prices for 2020 were $20.55 per ounce (2019: $16.21), average lead prices for 2020 were $0.83 per pound (2019: $0.91) and average zinc prices for 2020 were $1.03 per pound (2019: $1.16). Any decline in our realized prices adversely impacts our revenues, net income and operating cash flows, particularly in light of our strategy of not engaging in hedging transactions with respect to sales of gold, silver, copper, lead or zinc. We have recorded asset impairments in the past and may experience additional impairments as a result of lower gold, silver, copper, zinc or lead prices in the future.
In addition, sustained lower gold, silver, copper, zinc or lead prices can:
- Reduce revenues further through production declines due to cessation of the mining of deposits, or portions of deposits,
Showing the first 8K of 127K characters. Open the full section
Item 2. PROPERTIES (dollars in millions, except per share, per ounce and per pound amounts)
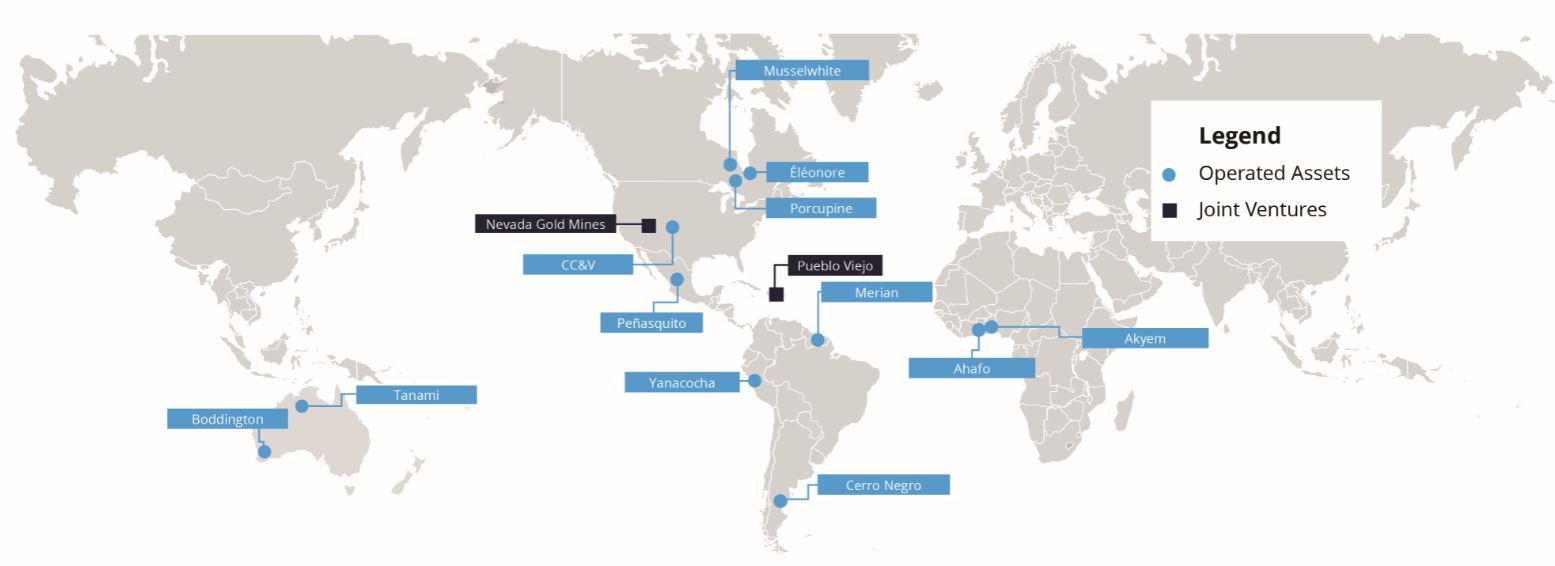
Production and Development Properties
Newmont’s material production and development properties are described below. Operating statistics for each region are presented in a table in the Operating Statistics section. In addition, Newmont holds investment interests in Canada, Mexico, Chile, Argentina and various other locations.
See Item 1A, Risk Factors, for risks related to our properties.
North America
The North America region maintains its headquarters in Vancouver, Canada and operates five sites, Cripple Creek & Victor (“CC&V”), Musselwhite, Porcupine, Éléonore and Peñasquito. On March 31, 2020, we completed the sale of the Red Lake complex in Ontario, Canada, included as part of the Company’s North America segment, to Evolution Mining Limited (“Evolution”).
Cripple Creek & Victor, Colorado, USA. (100% owned) Cripple Creek & Victor (“CC&V”), located next to the town of Victor, Colorado, is an open pit operation. CC&V is an epithermal alkalic deposit with heap leaching and milling processing facilities located on site. CC&V’s gross property, plant and mine development at December 31, 2020 was $893. CC&V produced 272,000 ounces of gold in 2020 and reported 2.5 million ounces of gold reserves at December 31, 2020.
Musselwhite, Canada. (100% owned) Musselwhite, located approximately 265 miles (430 kilometers) north of Thunder Bay, Ontario, is an underground operation. Process facilities include a conventional mill, which consists of a crushing and grinding circuit, carbon-in-pulp and carbon-in-leach plants, elution circuits and an electrowinning plant where the gold is recovered and smelted to produce doré. The conveyor system and the material handling project at Musselwhite reached commercial production in December 2020. Musselwhite is an iron formation hosted gold deposit. Musselwhite’s gross property, plant and mine development at December 31, 2020 was $1,084. Musselwhite produced 100,000 ounces of gold in 2020 and reported 1.8 million ounces of gold reserves at December 31, 2020.
Porcupine, Canada. (100% owned) Porcupine, consists of the Hollinger open pit and Hoyle Pond underground operations, located in the city of Timmins, Ontario, as well as the Borden underground operation, located near the town of Chapleau, Ontario. Process facilities, located in the city of Timmins, include a conventional mill, which consists of a crushing and grinding circuit, carbon-in-pulp and carbon-in-leach plants, Knelson concentrators, Acacia reactor, elution circuits and an electrowinning plant where the gold is recovered and smelted to produce doré. Mineralization at Hollinger and Hoyle, in Timmins, comprises multiple generations of quartz-carbonate-tourmaline albite veins, associated pyrite alteration envelopes, and disseminated pyrite mineralization. Mineralization at Borden consists of a shear zone containing quartz-vein hosted sulfides within a high-grade metamorphic greenstone package. Porcupine’s gross property, plant and mine development at December 31, 2020 was $1,340. Porcupine produced 319,000 ounces of gold in 2020 and reported 3.1 million ounces of gold reserves at December 31, 2020.
Éléonore, Canada. (100% owned) Éléonore, located approximately 510 miles (825 kilometers) north of Montreal in Eeyou Istchee/James Bay in Northern Quebec, is an underground operation. Process facilities include a conventional mill which consists of a crushing and grinding circuit, flotation circuit, carbon-in-pulp circuits and an electrowinning plant where the gold is recovered and smelted to produce doré. Éléonore is a clastic sediment-hosted stockwork-disseminated gold deposit. Éléonore’s gross property, plant
and mine development at December 31, 2020 was $985. Éléonore produced 202,000 ounces of gold in 2020 and reported 1.3 million ounces of gold reserves at December 31, 2020.
Peñasquito, Mexico. (100% owned) Peñasquito is an open pit operation located in the northeast corner of Zacatecas State, Mexico, approximately 125 miles (200 kilometers) northeast of the city of Zacatecas and is accessible by paved roads with a private airport close to the site. The property began production in 2009, with commercial production being achieved in 2010. Goldcorp acquired its ownership in the mine in 2006 when it acquired Glamis and Newmont acquired Peñasquito in 2019 in the Newmont Goldcorp transaction. Peñasquito consists of the Peñasco and Chile Colorado open pit mines. In addition, Peñasquito has one processing plant.
Peñasquito is comprised of 24 mining concessions encompassing 119,891 acres (48,518 hectares). Concessions were granted for durations of 50 years, and will expire between 2045 and 2060, and a second 50-year term can be granted if the applicant has abided by all appropriate regulations and makes the application within five years prior to the expiration date. In order to maintain these concessions, Peñasquito must pay periodic mining rights and file annual mining reports.
Surface rights in the vicinity of the Peñasco and Chile Colorado open pits are held by three ejidos: Ejido Cedros, Ejido Mazapil and Ejido Cerro Gordo. Peñasquito has signed land use agreements with each ejidos, valid through 2035 and 2036, and the relevant private owners. In August 2020, the Company and Cedros General Assembly ratified the definitive agreement that was reached on April 22, 2020 and resolved all outstanding disputes between Peñasquito and the San Juan de Cedros community (Cedros). In addition, easements have been granted in association with the La Pardita-Cedros Highway and the El Salero-Peñasquito powerline. All necessary permits have been granted.
In July 2007, Goldcorp and Wheaton Precious Metals Corp. (then Silver Wheaton Corp.) entered into a silver streaming agreement. The Company is obligated to sell 25% of silver production from the Peñasquito mine to Wheaton Precious Metals Corporation at the lesser of market price or a fixed contract price, subject to an annual inflation adjustment of up to 1.65%. Refer to Note 5 to the Consolidated Financial Statements for further information.
A 2% net smelter return royalty is owed to Royal Gold Inc. from both the Chile Colorado and Peñasco open pits of the Peñasquito Mine. Since January 1, 2014, the Mexican Government levies a 7.5% mining royalty that is imposed on earnings before interest, taxes, depreciation, and amortization. There is also a 0.5% environmental erosion fee payable on precious metal production, based on gross revenues. In December 2016, the State of Zacatecas in Mexico approved new environmental taxes that became effective January 1, 2017. Certain operations at the Peñasquito mine are subject to these taxes. See Item 1A, Risk Factors and Note 31 to the Consolidated Financial Statements for further information.
The mineralization at Peñasquito contains gold, silver, lead and zinc. Deposits currently mined within the Peñasquito operations are considered to be examples of breccia pipes developed as a result of intrusion-related hydrothermal activity.
Process facilities include a sulfide processing plant, comprising four stages of flotation; carbon, lead, zinc and pyrite. The carbon pre-flotation circuit was added in 2018 ahead of lead flotation to remove organic carbon associated with sedimentary ores. In the lead and zinc flotation, the slurry is conditioned with reagents to activate the desired minerals and produce lead and zinc concentrates. The pyrite circuit flotation was added at the end of 2018, which treats the zinc tailings in a pyrite flotation leach, and Merrill Crowe process to recover additional silver and gold in the form of doré. The tailings from the leach circuit undergoes cyanide destruction and combines with final flotation tailings for final deposition in the tai
Showing the first 8K of 197K characters. Open the full section
Item 3. LEGAL PROCEEDINGS
Information regarding legal proceedings is contained in Note 31 to the Consolidated Financial Statements contained in this Report and is incorporated herein by reference. The Company notes that in connection with the SEC’s recent modernization of legal proceedings disclosures, the Company has elected to apply the threshold of $1 million (with such amount being the lesser of $1 million or 1% of the current assets of the Company on a consolidated basis) pursuant to Item 103(c)(3)(iii) of Regulation S-K in connection with environmental proceedings to which a governmental authority is a party.
Item 4. MINE SAFETY DISCLOSURES
At Newmont, safety is a core value, and we strive for superior performance. Our health and safety management system, which includes detailed standards and procedures for safe production, addresses topics such as employee training, risk management, workplace inspection, emergency response, accident investigation and program auditing. In addition to strong leadership and involvement from all levels of the organization, these programs and procedures form the cornerstone of safety at Newmont, ensuring that employees are provided a safe and healthy environment and are intended to reduce workplace accidents, incidents and losses, comply with all mining-related regulations and provide support for both regulators and the industry to improve mine safety.
In addition, we have established our “Rapid Response” crisis management process to mitigate and prevent the escalation of adverse consequences if existing risk management controls fail, particularly if an incident may have the potential to seriously impact the safety of employees, the community or the environment. This process provides appropriate support to an affected site to complement their technical response to an incident, so as to reduce the impact by considering the environmental, strategic, legal, financial and public image aspects of the incident, to ensure communications are being carried out in accordance with legal and ethical requirements and to identify actions in addition to those addressing the immediate hazards.
The health and safety of our people and our host communities is paramount. This is why Newmont engaged its Rapid Response process early in connection with the on-going COVID-19 pandemic and proactively took conservative steps to prevent further transmission of the Coronavirus. For steps taken by the Company, see "COVID-19 Impact" within "Environmental, Social and Governance ("ESG")" in Part I, Item 1, Business.
The operation of our U.S. based mine is subject to regulation by the Federal Mine Safety and Health Administration (“MSHA”) under the Federal Mine Safety and Health Act of 1977 (the “Mine Act”). MSHA inspects our mine on a regular basis and issues various citations and orders when it believes a violation has occurred under the Mine Act. Following passage of The Mine Improvement and New Emergency Response Act of 2006, MSHA significantly increased the numbers of citations and orders charged against mining operations. The dollar penalties assessed for citations issued has also increased in recent years. As of the date of filing, Newmont has received no citations by MSHA in connection with COVID-19 related regulations or requirements.
Newmont is required to report certain mine safety violations or other regulatory matters required by Section 1503(a) of the Dodd-Frank Wall Street Reform and Consumer Protection Act and Item 104 of Regulation S-K, and that required information is included in Exhibit 95 and is incorporated by reference into this Quarterly Report. It is noted that the Nevada mines owned by Nevada Gold Mines LLC, a joint venture between the Company (38.5%) and Barrick Gold Corporation (“Barrick”) (61.5%), are not included in the Company’s Exhibit 95 mine safety disclosure reporting as such sites are operated by our joint venture partner, Barrick.
PART II
Item 5. MARKET FOR REGISTRANT'S COMMON EQUITY, RELATED STOCKHOLDER MATTERS AND ISSUER PURCHASE OF EQUITY SECURITIES
Our common stock is listed and principally traded on the New York Stock Exchange under the symbol “NEM.” On February 11, 2021, there were 800,314,223 shares of Newmont’s common stock outstanding, which were held by approximately 8,000 stockholders of record.
During the period from October 1, 2020 to December 31, 2020, 3,217,422 shares of Newmont's equity securities registered pursuant to Section 12 of the Exchange Act of 1934, as amended, were purchased by the Company, or an affiliated purchaser.
| (a) | (b) | (c) | (d) | ||||||||||||||||||||
| Period | Total Number of Shares Purchased**(1)** | Average Price Paid Per Share**(1)** | Total Number of Shares Purchased as Part of Publicly Announced Plans or Programs**(2)** | Maximum Dollar Value of Shares that may yet be Purchased under the Plans or Programs**(2)** | |||||||||||||||||||
| October 1, 2020 through October 31, 2020 | 63,041 | $ | 48.16 | — | $ | 199,429,824 | |||||||||||||||||
| November 1, 2020 through November 30, 2020 | 3,147,189 | $ | 63.64 | 3,133,513 | $ | — | |||||||||||||||||
| December 1, 2020 through December 31, 2020 | 7,192 | $ | 62.04 | — | $ | — |
____________________________
(1)The total number of shares purchased (and the average price paid per share) reflects (i) shares purchased pursuant to the repurchase program described in (2) below and (ii) shares delivered to the Company from stock awards held by employees upon vesting for the purpose of covering the recipients’ tax withholding obligations, totaling 63,041 shares, 13,676 shares and 7,192 shares for the fiscal months of October, November and December 2020, respectively.
(2)The Company’s Board of Directors previously authorized a stock repurchase program, under which the Company was authorized to repurchase shares of outstanding common stock, provided that the aggregate value of shares did not exceed $1 billion. Such program expired on December 31, 2020. The Company repurchased 11,790,190 shares in the fourth quarter of 2019 and 10,270,336 shares during 2020 under such program. In January 2021, the Company announced that the Board of Directors authorized a similar program to repurchase shares of outstanding common stock to offset the dilutive impact of employee stock award vesting and to provide leading returns to shareholders, provided that the aggregate value of shares of common stock repurchased under the new program does not exceed $1 billion, and such program will expire on July 15, 2022. The extent to which the Company repurchases its shares, and the timing of such repurchases, will depend upon a variety of factors, including trading volume, market conditions, legal requirements, business conditions and other factors. The repurchase program may be discontinued at any time, and the program does not obligate the Company to acquire any specific number of shares of its common stock.
ITEM 7. MANAGEMENT’S DISCUSSION AND ANALYSIS OF CONSOLIDATED FINANCIAL CONDITION AND RESULTS OF OPERATIONS (dollars in millions, except per share, per ounce and per pound amounts)
The following Management’s Discussion and Analysis (“MD&A”) provides information that management believes is relevant to an assessment and understanding of the consolidated financial condition and results of operations of Newmont Corporation, a Delaware corporation, and its subsidiaries (collectively, “Newmont,” the “Company,” “our” and “we”). We use certain non-GAAP financial measures in our MD&A. For a detailed description of each of the non-GAAP measures used in this MD&A, please see the discussion under “Non-GAAP Financial Measures” within Part II, Item 7, Management's Discussion and Analysis. This item should be read in conjunction with our Consolidated Financial Statements and the notes thereto included in this annual report.
The following MD&A generally discusses our consolidated financial condition and results of operations for 2020 and 2019 and year-to-year comparisons between 2020 and 2019. Discussions of our consolidated financial condition and results of operations for 2018 and year-to-year comparisons between 2019 and 2018 are included in Item 7, Management’s Discussion and Analysis of Consolidated Financial Condition and Results of Operations, in the Company’s Annual Report on Form 10-K for the fiscal year ended December 31, 2019, filed with the Securities and Exchange Commission on February 20, 2020, are incorporated by reference into this MD&A.
Overview
Newmont is the world’s leading gold company and is the only gold company included in the S&P 500 Index and the Fortune 500 list of companies. We have been included in the Dow Jones Sustainability Index-World since 2007 and have adopted the World Gold Council’s Conflict-Free Gold Policy. In 2020, for the sixth year in a row, Newmont was ranked as the mining and metal sector’s top gold miner by the SAM S&P Corporate Sustainability Assessment. Newmont was ranked the top miner in June 2020 in 3BL Media’s 100 Best Corporate Citizens list which ranks the 1,000 largest publicly traded U.S. companies on environmental, social and governance ("ESG") transparency and performance. We are primarily engaged in the exploration for and acquisition of gold properties, some of which may contain copper, silver, lead, zinc or other metals. We have significant operations and/or assets in the United States (“U.S.”), Canada, Mexico, Dominican Republic, Peru, Suriname, Argentina, Chile, Australia and Ghana. Our goal is to create value and improve lives through sustainable and responsible mining.
During the first half of 2020, the COVID-19 outbreak escalated to a global pandemic, which has had varying impacts in the jurisdictions in which we operate. In response, the Company temporarily placed five sites into care and maintenance, including Musselwhite, Éléonore, Yanacocha and Cerro Negro in March 2020 and Peñasquito in April 2020. During the second quarter of 2020, we worked closely with local stakeholders to resume operations at all five mine sites. As of December 31, 2020, all sites were fully operational, with the exception of Cerro Negro that continues to progress its ramp up.
Refer to “2020 Results and Highlights,” "Health and Safety" within Part I, Item 1, Business and “Results of Consolidated Operations,” “Liquidity and Capital Resources,” “Non-GAAP Financial Measures” and “Accounting Developments” within Part II, Item 7, Management’s Discussion and Analysis for additional information about the impact of COVID-19 on our business and operations. For a discussion of COVID-19 related risks to the business, see Part I, Item 1A, Risk Factors.
On April 18, 2019 (the “acquisition date”), Newmont complet
Showing the first 8K of 277K characters. Open the full section
Item 7A. QUANTITATIVE AND QUALITATIVE DISCLOSURES ABOUT MARKET RISK (dollars in millions, except per ounce and per pound amounts).
Metal Prices
Changes in the market price of gold significantly affect our profitability and cash flow. Gold prices can fluctuate widely due to numerous factors, such as demand; forward selling by producers; central bank sales, purchases and lending; investor sentiment; the strength of the U.S. dollar; inflation, deflation, or other general price instability; and global mine production levels. Changes in the
market price of copper, silver, lead and zinc also affect our profitability and cash flow. These metals are traded on established international exchanges and prices generally reflect market supply and demand, but can also be influenced by speculative trading in the commodity or by currency exchange rates.
Decreases in the market price of metals can significantly affect the value of our product inventory, stockpiles and leach pads, and it may be necessary to record a write-down to the net realizable value. Net realizable value represents the estimated future sales price based on short-term and long-term metals prices, less estimated costs to complete production and bring the product to sale. The primary factors that influence the need to record write-downs of our stockpiles, leach pads and product inventory include short-term and long-term metals prices and costs for production inputs such as labor, fuel and energy, materials and supplies as well as realized ore grades and recovery rates. As part of our regular review of economic assumptions management determined to increase the long-term gold price assumption from $1,300 to $1,500 during the third quarter of 2020. The significant assumptions in determining the stockpile, leach pad and product inventory adjustments for each mine site reporting unit at December 31, 2020 included production cost and capitalized expenditure assumptions unique to each operation, a short-term and long-term gold price of $1,874 and $1,500 per ounce, respectively, a short-term and long-term copper price of $3.25 and $3.00 per pound, respectively, a short-term and long-term silver price of $24.39 and $18.00 per ounce, respectively, a short-term and long-term lead price of $0.86 and $1.05 per pound, respectively, a short-term and long-term zinc price of $1.19 and $1.30 per pound, respectively, a short-term and long-term U.S. to Australian dollar exchange rate of $0.73 and $0.77, respectively, a short-term and long-term U.S. to Canadian dollar exchange rate of $0.77 and $0.80, respectively, a short-term and long-term U.S. dollar to Mexican Peso exchange rate of $0.05 and $0.05, respectively and a short-term and long-term U.S. dollar to Argentinian Peso exchange rate of $0.01 and $0.02, respectively.
The net realizable value measurement involves the use of estimates and assumptions unique to each mining operation regarding current and future operating and capital costs, metal recoveries, production levels, commodity prices, proven and probable reserve quantities, engineering data and other factors. A high degree of judgment is involved in determining such assumptions and estimates and no assurance can be given that actual results will not differ significantly from those estimates and assumptions. For information concerning the sensitivity of our stockpiles and ore on leach pads to changes in metal price, see the Critical Accounting Policies section in Item 7, Management’s Discussion and Analysis of Consolidated Financial Condition and Results of Operation.
Decreases in the market price of metals can also significantly impact our impairment analysis for long-lived assets and goodwill. An impairment loss is measured and recorded for long-lived assets based on the estimated fair value of the long-lived assets being tested for impairment and their carrying amounts. An impairment loss is measured and recorded for goodwill based on the carrying amount of the reporting unit and its fair value. Fair value is typically determined through the use of an income approach utilizing estimates of discounted future cash flows or a market approach utilizing recent transaction activity for comparable properties. The estimated undiscounted cash flows used to assess recoverability of long-lived assets and the fair value of reporting units are derived from current business plans, which are developed using short-term price forecasts reflective of the current price environment and management’s projections for long-term average metal prices. For information concerning the sensitivity of our impairment analysis over long-lived assets and goodwill to changes in metal price, see the Critical Accounting Policies section in Item 7, Management’s Discussion and Analysis of Consolidated Financial Condition and Results of Operation.
Foreign Currency
In addition to our operations in the United States, we have significant operations and/or assets in Canada, Mexico, Dominican Republic, Peru, Suriname, Argentina, Chile, Australia and Ghana. All of our operations sell their gold, copper, silver, lead and zinc production based on U.S. dollar metal prices. Foreign currency exchange rates can fluctuate widely due to numerous factors, such as supply and demand for foreign and U.S. currencies and U.S. and foreign country economic conditions. Fluctuations in the local currency exchange rates in relation to the U.S. dollar can increase or decrease profit margins, cash flow and Costs applicable to sales per ounce/pound to the extent costs are paid in local currency at foreign operations. Additionally, if a sustained weakening of the U.S. dollar in relation to other foreign currencies that impact our cost structure were not mitigated by offsetting increases in the U.S. dollar metal prices or by other factors, the amount of proven and probable reserves in the applicable foreign country could be reduced as certain proven and probable reserves may no longer be economic. The extent of any such reduction would be dependent on a variety of factors, including the length of time of any such weakening of the U.S. dollar and management’s long-term view of the applicable exchange rate. Foreign currency exchange rates in relation to the U.S. dollar have not had a material impact on our determination of proven and probable reserves in the past. However, future reductions of proven and probable reserves could result in reduced sales and increased Depreciation and amortization and, depending on the level of reduction, this could also result in impairments of long-lived assets and goodwill.
Commodity Price Exposure
Our provisional metal sales contain an embedded derivative that is required to be separated from the host contract for accounting purposes. The host contract is the receivable from the sale of the respective metal concentrates at the prevailing indices’ prices at the time of sale. The embedded derivative, which does not qualify for hedge accounting, is marked to market through earnings each period prior to final settlement. The below sensitivity analysis is based on a historical price volatility of the respective metal prices.
At December 31, 2020, Newmont had gold sales of 224,000 ounces priced at an average of $1,890 per ounce, subject to final pricing over the next several months. Each 10% change in the price for provisionally priced gold sales would have an approximate $29 effect on our Net income (loss) attributable to Newmont stockholders. The London Bullion Market Association P.M. closing settlement price at December 31, 2020 for gold was $1,888 per ounce.
At December 31, 2020, Newmont had copper sales of 12 million pounds priced at an average of $3.52 per pound, subject to final pricing over the next several months. Each 10% change in the price for provisionally priced copper sales would have an approximate $3 effect on our Net income (loss) attributable to Newmont stockholders. The LME closing settlement price at December 31, 2020 for copper was $3.51 per pound.
At December 31, 2020, Newmont had silver sales of 4 million ounces priced at an average of $26.50 per ounce, subject to final pricing over the next several months. Each 10% change in the price for provisionally priced silver sales would have an approximate $7 effect on our Net income (loss) attributable to Newmont stockholders. The London Bullion Market Association closing settlement price at December 31, 2020 for silver was $26.45 per ounce.
At December 31, 2020, Newmont had lead sales of 25 million pounds priced at an average of $0.90 per pound, subject to final pricing over the next several months. Each 10% change in the price for provisionally priced lead sales would have an approximate $1 effect on our Net income (loss) attributable to Newmont stockholders. The LME closing settlement price at December 31, 2020 for lead was $0.89 per pound.
At December 31, 2020, Newmont had zinc sales of 54 million pounds priced at an average of $1.24 per pound, subject to final pricing over the next several months. Each 10% change in the price for provisionally priced zinc sales would have an approximate $4 effect on our Net income (loss) attributable to Newmont stockholders. The LME closing settlement price at December 31, 2020 for zinc was $1.24 per pound.
Item 8. FINANCIAL STATEMENTS AND SUPPLEMENTARY DATA
REPORT OF INDEPENDENT REGISTERED PUBLIC ACCOUNTING FIRM
To the Board of Directors and Stockholders of Newmont Corporation
Opinion on the Financial Statements
We have audited the accompanying consolidated balance sheets of Newmont Corporation (the Company) as of December 31, 2020 and 2019, the related consolidated statements of operations, comprehensive income (loss), changes in equity and cash flows for each of the three years in the period ended December 31, 2020, the related notes and the financial statement schedule in Item 15(a)(2) (collectively referred to as the “consolidated financial statements”). In our opinion, based on our audits and, for 2020 and 2019 the report of other auditors, the consolidated financial statements present fairly, in all material respects, the financial position of the Company at December 31, 2020 and 2019, and the results of its operations and its cash flows for each of the three years in the period ended December 31, 2020, in conformity with U.S. generally accepted accounting principles.
We did not audit the financial statements of Nevada Gold Mines LLC, a 38.5% owned investment which is proportionately consolidated, which reflects total assets constituting 19% and 20% at December 31, 2020 and 2019, respectively, and sales constituting 21% and 10% and net income constituting 24% and 7% in 2020 and 2019, respectively, of the related consolidated totals. Those statements were audited by other auditors whose report has been furnished to us, and our opinion, insofar as it relates to the amounts included for Nevada Gold Mines LLC, is based solely on the report of the other auditors.
We also have audited, in accordance with the standards of the Public Company Accounting Oversight Board (United States) (PCAOB), the Company's internal control over financial reporting as of December 31, 2020, based on criteria established in Internal Control-Integrated Framework issued by the Committee of Sponsoring Organizations of the Treadway Commission 2013 framework, and our report dated February 18, 2021 expressed an unqualified opinion thereon, based on our audit and the report of the other auditors.
Basis for Opinion
These financial statements are the responsibility of the Company's management. Our responsibility is to express an opinion on the Company’s financial statements based on our audits. We are a public accounting firm registered with the PCAOB and are required to be independent with respect to the Company in accordance with the U.S. federal securities laws and the applicable rules and regulations of the Securities and Exchange Commission and the PCAOB.
We conducted our audits in accordance with the standards of the PCAOB. Those standards require that we plan and perform the audit to obtain reasonable assurance about whether the financial statements are free of material misstatement, whether due to error or fraud. Our audits included performing procedures to assess the risks of material misstatement of the financial statements, whether due to error or fraud, and performing procedures that respond to those risks. Such procedures included examining, on a test basis, evidence regarding the amounts and disclosures in the financial statements. Our audits also included evaluating the accounting principles used and significant estimates made by management, as well as evaluating the overall presentation of the financial statements. We believe that our audits and the report of other auditors provide a reasonable basis for our opinion.
Critical Audit Matters
The critical audit matter communicated below is a matter arising from the current period audit of the financial statements that was communicated or required to be communicated to the audit committee and that: (1) relates to accounts or disclosures that are material to the financial statements and (2) involved our especially challenging, subjective or complex judgments. The communication of the critical audit matter does not alter in any way our opinion on the consolidated financial statements, taken as a whole, and we are not, by communicating the critical audit matter below, providing separate opinions on the critical audit matter or on the accounts or disclosures to which it relates.
| Reclamation Liabilities | |||||
| Description of the Matter | As discussed in Note 2 and Note 6 of the consolidated financial statements, the Company’s mining and exploration activities are subject to various domestic and international laws and regulations governing the protection of the environment. Reclamation obligations are recognized when incurred and recorded as liabilities at fair value. Reclamation liabilities are periodically adjusted to reflect changes in the estimated present value resulting from the passage of time and revisions to the estimates of either the timing or amount of the reclamation costs. Auditing management’s accounting for reclamation liabilities was challenging, as significant judgment is required by the Company to estimate required cash flows to meet obligations established by mining permit, local statutes and promissory estoppel at the end of mine life. The significant judgment was primarily due to the inherent estimation uncertainty relating to the extent of future reclamation activities and related costs. | ||||
| How We Addressed the Matter in Our Audit | We obtained an understanding, evaluated the design, and tested the operating effectiveness of the controls over the Company’s accounting for reclamation liabilities, including controls over management’s review of estimated future costs and the reclamation liability calculation. To test the reclamation liabilities, among other procedures, we evaluated the methodology, significant assumptions and the underlying data used by the Company in its estimate. To assess the estimates of reclamation activities and cash flows, we evaluated significant changes from the prior estimate, verified consistency between timing of reclamation activities and projected mine life, compared anticipated costs across the Company’s mines, verified cost rates against third-party information or internal cost records and recalculated management’s estimate. We involved our reclamation specialists to interview members of the Company’s engineering staff, assess the completeness of the mine reclamation estimates with respect to meeting mine closure and post closure requirements, and evaluate the reasonableness of the engineering estimates and assumptions. |
/s/ Ernst & Young LLP
We have served as the Company’s auditor since 2014.
Denver, Colorado
February 18, 2021
REPORT OF INDEPENDENT REGISTERED PUBLIC ACCOUNTING FIRM
To the Board of Managers and Members of Nevada Gold Mines LLC
Opinions on the Financial Statements and Internal Control over Financial Reporting
We have audited the consolidated balance sheet of Nevada Gold Mines LLC and its subsidiaries (together, the Joint Venture) as of December 31, 2020 and 2019, and the related consolidated statements of operations and comprehensive income, changes in members’ equity and cash flows for the year then ended December 31, 2020 and for the period from inception April 11, 2019 to December 31, 2019, including the related notes (collectively referred to as the consolidated financial statements) (not presented herein). We also have audited the Joint Venture’s internal control over financial reporting as of December 31, 2020, based on criteria established in Internal Control – Integrated Framework (2013) issued by the Committee of Sponsoring Organizations of the Treadway Commission (COSO).
In our opinion, the consolidated financial statements referred to above present fairly, in all material respects, the financial position of the Joint Venture as of December 31, 2020 and 2019, and the results of its operations and its cash flows for the year ended
Showing the first 8K of 362K characters. Open the full section
Item 9. CHANGES IN AND DISAGREEMENTS WITH ACCOUNTANTS ON ACCOUNTING AND FINANCIAL DISCLOSURE
None.
Item 9A. CONTROLS AND PROCEDURES
Evaluation of Disclosure Controls and Procedures
The Company’s management, with the participation of the Chief Executive Officer and Chief Financial Officer of the Company, carried out an evaluation of the effectiveness of the design and operation of the Company’s disclosure controls and procedures (as defined in Rules 13a-15(e) and 15d-15(e) of the Securities Exchange Act of 1934, as amended (the “Exchange Act”)) as of December 31, 2020, the end for the period covered by this report. Based on such evaluation, the Company’s Chief Executive Officer and Chief Financial Officer have concluded that, as of December 31, 2020, the Company’s disclosure controls and procedures are effective to ensure that information required to be disclosed by the Company in reports that it files or submits under the Exchange Act is recorded, processed, summarized and reported within the required time periods and are designed to ensure that information required to be disclosed in its reports is accumulated and communicated to the Company’s management, including the Chief Executive Officer and Chief Financial Officer, as appropriate to allow timely decisions regarding required disclosure.
Management’s Report on Internal Control over Financial Reporting
The management of the Company is responsible for establishing and maintaining adequate internal control over financial reporting. Internal control over financial reporting is a process designed by, or under the supervision of, the Company’s principal executive and principal financial officers and effected by the Company’s Board of Directors, management and other personnel, to provide reasonable assurance regarding the reliability of financial reporting and the preparation of financial statements for external purposes in accordance with generally accepted accounting principles. Because of its inherent limitations, internal control over financial reporting may not prevent or detect misstatements. Also, projections of any evaluation of effectiveness to future periods are subject to risk that controls may become inadequate because of changes in conditions, or that the degree of compliance with the policies or procedures may deteriorate.
The Company’s management assessed the effectiveness of the Company’s internal control over financial reporting at December 31, 2020. In making this assessment, the Company’s management used the criteria set forth by the Committee of Sponsoring Organizations of the Treadway Commission (COSO) in Internal Control-Integrated Framework 2013. Based upon its assessment, management concluded that, at December 31, 2020, the Company’s internal control over financial reporting was effective.
As permitted by the SEC Staff interpretive guidance for proportionately consolidated entities, the Company’s management excluded NGM from its assessment of internal control over financial reporting as of December 31, 2020, as management does not have the ability to dictate, modify or assess the controls at NGM. The Company has implemented internal controls over financial reporting for recognizing its proportionate share of the assets, liabilities, and operations of NGM. Refer to Part II, Item 8 "Financial Statements and Supplementary Data" for NGM's "Report of Independent Registered Public Accounting Firm" for Opinion on the Financial Statements and Internal Controls over Financial Reporting.
NGM represented 19% of the Company’s consolidated Total assets as of December 31, 2020, while its Sales comprised 21% of the Company’s consolidated sales and its Net income attributable to Newmont stockholders comprised 24% of the Company’s net income for the year ended December 31, 2020.
Ernst & Young LLP, an independent registered public accounting firm, who audited the Company’s Consolidated Financial Statements as of December 31, 2020 and the year then ended included in this Form 10-K, has issued an attestation report on the Company’s internal control over financial reporting, as of December 31, 2020, which is included herein.
Changes in Internal Controls
There were no changes in the Company’s internal control over financial reporting that occurred during the quarter ended December 31, 2020, that have materially affected, or are reasonably likely to materially affect, our internal controls over financial reporting.
REPORT OF INDEPENDENT REGISTERED PUBLIC ACCOUNTING FIRM
To the Board of Directors and Stockholders of Newmont Corporation
Opinion on Internal Control Over Financial Reporting
We have audited Newmont Corporation’s internal control over financial reporting as of December 31, 2020, based on criteria established in Internal Control—Integrated Framework issued by the Committee of Sponsoring Organizations of the Treadway Commission 2013 framework (the COSO criteria). In our opinion, Newmont Corporation (the Company), based on our audit and the report of other auditors, maintained, in all material respects, effective internal control over financial reporting as of December 31, 2020, based on the COSO criteria.
We did not examine the effectiveness of internal control over financial reporting of Nevada Gold Mines LLC, a 38.5% owned investment which is proportionately consolidated, whose financial statements reflect total assets, sales and net income constituting 19%, 21%, and 24%, respectively, of the related consolidated financial statement amounts as of and for the year ended December 31, 2020. The effectiveness of Nevada Gold Mines LLC’s internal control over financial reporting was audited by other auditors whose report has been furnished to us, and our opinion, insofar as it relates to the effectiveness of Nevada Gold Mines LLC’s internal control over financial reporting, is based solely on the report of the other auditors.
We also have audited, in accordance with the standards of the Public Company Accounting Oversight Board (United States), the consolidated balance sheets of the Company as of December 31, 2020 and 2019, the related consolidated statements of operations, comprehensive income (loss), changes in equity and cash flows for each of the three years in the period ended December 31, 2020, the related notes and financial statement schedule in Item 15(a)(2) and our report dated February 18, 2021 expressed an unqualified opinion thereon, based on our audit and the report of the other auditors.
Basis for Opinion
The Company’s management is responsible for maintaining effective internal control over financial reporting and for its assessment of the effectiveness of internal control over financial reporting included in the accompanying Management’s Report on Internal Control over Financial Reporting. Our responsibility is to express an opinion on the Company’s internal control over financial reporting based on our audit and the report of the other auditors. We are a public accounting firm registered with the PCAOB and are required to be independent with respect to the Company in accordance with the U.S. federal securities laws and the applicable rules and regulations of the Securities and Exchange Commission and the PCAOB.
We conducted our audit in accordance with the standards of the PCAOB. Those standards require that we plan and perform the audit to obtain reasonable assurance about whether effective internal control over financial reporting was maintained in all material respects.
Our audit included obtaining an understanding of internal control over financial reporting, assessing the risk that a material weakness exists, testing and evaluating the design and operating effectiveness of internal control based on the assessed risk, and performing such other procedures as we considered necessary in the circumstances. We believe that our audit and the report of other auditors provides a reasonable basis for our opinion.
Definition and Limitations of Internal Control Over Financial Reporting
A company’s internal control over financial reporting is a process designed to provide reasonable assurance regarding the reliability of financial reporting and the preparation of financial statements for external purposes in accordance with generally accepted accounting principles. A company’s internal control over financial reporting includes those policies and procedures that (1) pertain to the maintenance of records that, in reasonable detail, accurately and fairly reflect the transactions and dispositions of the assets of the company; (2) provide reasonable assurance that transactions are recorded as necessary to permit preparation of financial statements in accordance with generally accepted accounting principles, and that receipts and expenditures of the company are being made only in accordance with authorizations of management and directors of the company; and (3) provide reasonable assurance regarding prevention or timely detection of unauthorized acquisition, use, or disposition of the company’s assets that could have a material effect on the financial statements.
Because of its inherent limitations, internal control over financial reporting may not prevent or detect misstatements. Also, projections of any evaluation of effectiveness to future periods are subject to the risk that controls may become inadequate because of changes in conditions, or that the degree of compliance with the policies or procedures may deteriorate.
/s/ Ernst & Young LLP
Denver, Colorado
February 18, 2021
Item 9B. OTHER INFORMATION
Departure of Certain Officers; Compensatory Arrangements of Certain Officers.
On February 13, 2021, Mr. Randy Engel, Executive Vice President, Strategic Development, notified the Company of his decision to retire on April 4, 2021 after 27 years of dedicated service to the Company. In lieu of a three-year equity long term incentive grant on February 22, 2021 with an approximate value of $2,000,000, Mr. Engel will receive a cash payment of $100,000 representing the approximate pro-rata portion of the 2021 long term incentive grant to which Mr. Engel is entitled according to the retirement provisions of the Company’s long term incentive programs. Mr. Engel is voluntarily retiring with eligibility under the disclosed retirement programs of the Company, and he will not receive additional pay or benefits beyond those programs. The Company extends its deepest thanks to Mr. Engel for his significant contributions over the course of his meaningful career with the Company.
On February 17, 2021, following review of market compensation and individual performance, the Company’s Board of Directors approved 2021 target equity long term incentives for Mr. Tom Palmer, President and Chief Executive Officer, of $8,050,000, payable in future years according to the terms of the Company’s long term incentive programs.
On February 17, 2021, following review of market compensation and individual performance, the Company’s Leadership Development and Compensation Committee of the Board of Directors approved an annual base salary for Mr. Rob Atkinson, Executive Vice President and Chief Operating Officer, of $800,000, effective March 1, 2021, and annual target equity long term incentives of $3,000,000. The long term incentives are payable in future years according to the terms of the Company’s long term incentive programs.
PART III
Item 10. INFORMATION ABOUT OUR EXECUTIVE OFFICERS
Information concerning Newmont’s directors, Audit Committee, compliance with Section 16(a) of the Exchange Act and Code of Ethics is contained in Newmont’s definitive Proxy Statement, filed pursuant to Regulation 14A promulgated under the Securities Exchange Act of 1934 for the 2021 Annual Meeting of Stockholders and is incorporated herein by reference.
Information concerning Newmont’s executive officers, as of December 31, 2020, is set forth below:
| Name | Age | Office | ||||||||||||
| Thomas R. Palmer | 53 | President and Chief Executive Officer | ||||||||||||
| Rob Atkinson | 50 | Executive Vice President and Chief Operating Officer | ||||||||||||
| Nancy K. Buese | 50 | Executive Vice President and Chief Financial Officer | ||||||||||||
| Jennifer Cmil | 50 | Executive Vice President, Human Resources | ||||||||||||
| Randy Engel | 54 | Executive Vice President, Strategic Development | ||||||||||||
| Dean Gehring | 52 | Executive Vice President and Chief Technology Officer | ||||||||||||
| Stephen P. Gottesfeld | 53 | Executive Vice President and Chief Sustainability & External Affairs Officer | ||||||||||||
| Nancy Lipson | 50 | Executive Vice President and General Counsel | ||||||||||||
| John W. Kitlen | 56 | Vice President, Controller and Chief Accounting Officer |
There are no family relationships by blood, marriage or adoption among any of the above executive officers or members of the Board of Directors of Newmont. Each executive officer is elected annually by the Board of Directors of Newmont to serve for one year or until his or her respective successor is elected and qualified. There is no arrangement or understanding between any of the above executive officers and any other person pursuant to which he or she was selected as an executive officer.
Mr. Palmer has served as President and Chief Executive Officer and a member of the Board of Directors since October 2019. He served as President since June 2019 and as President and Chief Operating Officer from November 2018 until June 2019. Previously, he served as Executive Vice President and Chief Operating Officer since May 2016. Mr. Palmer was elected Senior Vice President, Asia Pacific in February 2015 after serving as Senior Vice President, Indonesia since March 2014. Prior to joining Newmont, he was the Chief Operating Officer, Pilbara Mines at Rio Tinto Iron Ore. Over a 20-year career with Rio Tinto, Mr. Palmer worked in a variety of roles across a number of commodities, including General Manager, Technology for the Bauxite and Alumina business; General Manager, Operations at Hail Creek coal mine; and General Manager, Asset Management at Palabora Mining Company in South Africa.
Mr. Atkinson was elected Executive Vice President and Chief Operating Officer in June 2019. Mr. Atkinson most recently served as Head of Productivity and Technical Support for Rio Tinto from June 2016 to February 2019. He also served as Chief Operating Officer for Rio Tinto’s portfolio of copper interests in Mongolia, the US, Chile and Indonesia from September 2013 to May 2016. Prior to that Mr. Atkinson lead ASX-listed Energy Resources of Australia as Chief Executive and Director from September 2008 to August 2013 and served as General Manager of Weipa Bauxite from June 2005 to August 2008.
Ms. Buese was elected Executive Vice President and Chief Financial Officer in October 2016. Ms. Buese most recently served as Executive Vice President and Chief Financial Officer for MPLX, a publicly traded energy company formed by Marathon Petroleum Corporation. Prior to MPLX’s acquisition of MarkWest Energy Partners in 2015, Ms. Buese served for 11 years as Executive Vice President and Chief Financial Officer of MarkWest. Ms. Buese also is a former Partner with Ernst & Young and worked in public accounting for 12 years.
Ms. Cmil was elected Executive Vice President, Human Resources in October 2019. She served as Senior Vice President, Human Resources since June 2019 after having previously serving as Vice President, Talent Management since February 2018. Ms. Cmil joined the Company in 2010 and has held the roles of Group Executive, Human Resources from April 2014 to February 2018, and Senior Director, Human Resources from May 2010 to March 2014.
Mr. Engel was elected Executive Vice President, Strategic Development in October 2008, having served as Senior Vice President, Strategy and Corporate Development since July 2007. Mr. Engel served as Vice President, Strategic Planning and Investor relations from 2006 to 2007; Group Executive, Investor Relations from 2004 to 2006; and Assistant Treasurer from 2001 to 2004. Mr. Engel has been with Newmont since 1994, and has served in various capacities in the areas of business planning, corporate treasury and human resources.
Mr. Gehring was elected as Executive Vice President and Chief Technology Officer in June 2019 after serving as Regional Senior Vice President, South America since June 2017. Prior to joining Newmont, Mr. Gehring spent 14 years with Rio Tinto in a variety of executive roles including President and Chief Executive Officer of Rio Tinto Minerals from October 2014 to October 2016. Prior roles also included Global Head of Safety and Security and General Manager of Resource Development for the Oyu Tolgoi mine in Mongolia. He previously worked as Manager of Technical Services at Freeport’s Grasberg mine and held various operational and technical roles with BHP Billiton prior that.
Mr. Gottesfeld was elected as Executive Vice President and Chief Sustainability & External Affairs Officer in June 2019 after having served as Executive Vice President and General Counsel since March 2015. Prior to that he served as Executive Vice President, General Counsel and Corporate Secretary since February 2013. He previously served as Senior Vice President, General Counsel and Corporate Secretary since February 2012 and Vice President and General Counsel since January 2010. Mr. Gottesfeld was Vice President, Communications and Public Affairs from 2006 to 2010. Mr. Gottesfeld was Newmont's Associate General Counsel from 2004 to 2006, responsible for Newmont's Latin American, African and Central Asian legal affairs. From 2002 to 2004, Mr. Gottesfeld was Newmont's Associate General Counsel and General Manager of Newmont Peru S.R.L., working in Lima, Peru. From 1997 to 2001, Mr. Gottesfeld served in various roles, including as Assistant General Counsel and Senior Counsel.
Ms. Lipson was elected as Executive Vice President and General Counsel in June 2019, after previously serving as Vice President and Deputy General Counsel since February 2013. Prior to that she served as Associate General Counsel and Assistant Secretary since January 2010. From July 2005 to January 2010, she was Assistant General Counsel. Prior to joining the Company in July 2005 she was Senior Counsel for Sports Authority and for Qwest Communications. Ms. Lipson was also an Associate with the law firm of Otten, Johnson, Robinson, Neff & Ragonetti, P.C.
Mr. Kitlen became the Vice President, Controller and Chief Accounting Officer in June 2016. He was elected Vice President, Internal Audit in October 2012, having previously served as Director, Internal Audit since joining Newmont in February 2011. Prior to joining Newmont, Mr. Kitlen served as Director, Internal Audit at Sun Microsystems for four years. Previously, he served as the Internal Audit Director for StorageTek and spent more than seven years with Level 3 Communications in various roles including Vice President of Internal Audit, Assistant Corporate Controller and Director of Finance. Mr. Kitlen began his career in public accounting with Deloitte and Touche.
Item 11. EXECUTIVE COMPENSATION
Information concerning this item is contained in Newmont’s definitive Proxy Statement, filed pursuant to Regulation 14A promulgated under the Securities Exchange Act of 1934 for the 2021 Annual Meeting of Stockholders and is incorporated herein by reference.
Item 12. SECURITY OWNERSHIP OF CERTAIN BENEFICIAL OWNERS AND MANAGEMENT AND RELATED STOCKHOLDER MATTERS
Information concerning this item is contained in Newmont’s definitive Proxy Statement, filed pursuant to Regulation 14A promulgated under the Securities Exchange Act of 1934 for the 2020 Annual Meeting of Stockholders and incorporated herein by reference.
Equity Compensation Plan Information
The following table sets forth at December 31, 2020 information regarding Newmont’s Common Stock that may be issued under Newmont’s equity compensation plans:
| Number of Securities to be issued upon exercise of outstanding options, warrants and rights | Weighted average exercise price of outstanding options, warrants and rights | Number of securities remaining available for future issuance under equity compensation plans (excluding securities reflected in column (a)) | |||||||||||||||||||||
| Plan Category | (a) | (b) (1) | (c) | ||||||||||||||||||||
| Equity compensation plans approved by security holders (2) | 4,410,140 | (3) | 58.72 | 23,957,164 | (4) | ||||||||||||||||||
| Equity compensation plans not approved by security holders | — | N/A | — |
____________________________
(1)The weighted average exercise price includes both Employee Stock Options and Goldcorp Options. It does not take into account the shares issuable upon vesting of restricted stock units, performance leveraged stock units or strategic stock units.
(2)Newmont’s 2020 Stock Incentive Plan was approved by the stockholders on April 21, 2020. A maximum of 20,000,000 shares of Newmont's Common Stock, plus up to 3,644,782 shares available for grant under the 2013 Incentive Plan as of May 1, 2020, were authorized to be issued under the 2013 Stock Incentive Plan at that time. There are currently 23,957,164 shares registered and available to grant under the 2020 Stock Incentive Plan. There are no equity compensation plans not approved by stockholders.
(3)This balance includes outstanding Goldcorp RSUs exchanged for Newmont awards (“Substitute Awards”) upon acquisition. These Substitute Awards do not count against Newmont’s plan balance pursuant to paragraphs 2(ww) and 4(b) (vi) of Newmont’s 2020 Stock Incentive Plan.
(4)Securities remaining available for future issuance under the 2020 Stock Incentive Plan. No additional grants or awards will be made under any of the Company’s other plans. This balance does not include the Substitute Awards, as they are excluded from Newmont’s plan balance pursuant to paragraphs 2(ww) and 4(b)(vi) of Newmont’s 2020 Stock Incentive Compensation Plan.
Item 13. CERTAIN RELATIONSHIPS AND RELATED TRANSACTIONS, AND DIRECTOR INDEPENDENCE
Information concerning this item is contained in Newmont’s definitive Proxy Statement, filed pursuant to Regulation 14A promulgated under the Securities Exchange Act of 1934 for the 2021 Annual Meeting of Stockholders and incorporated herein by reference.
Item 14. PRINCIPAL ACCOUNTING FEES AND SERVICES
Information concerning this item is contained in Newmont’s definitive Proxy Statement, filed pursuant to Regulation 14A promulgated under the Securities Exchange Act of 1934 for the 2021 Annual Meeting of Stockholders and incorporated herein by reference.
PART IV
Item 15. EXHIBITS, FINANCIAL STATEMENT SCHEDULES
The following documents are filed as a part of this report:
**(a)**Financial Statements
(1)The Consolidated Financial Statements, together with the reports of the independent auditors thereon dated February 18, 2021, are included as part of Item 8, Financial Statements and Supplementary Data.
(2)Financial Statement Schedules:
Included on page SCH-1 is Schedule II - Valuation and Qualifying Accounts.
(3)Exhibits:
*These exhibits relate to executive compensation plans and arrangements.
** Certain schedules are omitted pursuant to item 601(b) (2) of Regulation S-K. Registrant agrees to furnish supplementally any omitted schedules to the SEC upon request.
*** Portions of this exhibit have been redacted pursuant to Item 601(b) (10) of Regulation S-K. Registrant agrees to furnish supplementally an unedited copy of the exhibit to the SEC upon request.
SIGNATURES
Pursuant to the requirements of Section 13 or 15(d) of the Securities Exchange Act of 1934, the registrant has duly caused this Annual Report on Form 10-K to be signed on its behalf by the undersigned, thereunto duly authorized.
| NEWMONT CORPORATION | ||||||||
| By: | /s/ NANCY LIPSON | |||||||
| Nancy Lipson Executive Vice President and General Counsel |
February 18, 2021
Pursuant to the requirements of the Securities Exchange Act of 1934, this report has been signed below by the following persons on behalf of the registrant and in the capacities indicated on February 18, 2021.
| Signature | Title | |||||||
| ***** | President, Chief Executive Officer and Director | |||||||
| Thomas R. Palmer | (Principal Executive Officer) | |||||||
| ***** | Executive Vice President and Chief Financial Officer | |||||||
| Nancy K. Buese | (Principal Financial Officer) | |||||||
| ***** | Vice President, Controller and Chief Accounting Officer | |||||||
| John W. Kitlen | (Principal Accounting Officer) | |||||||
| Gregory H. Boyce* | Vice Chair | |||||||
| Bruce R. Brook* | Director | |||||||
| Maura J. Clark* | Director | |||||||
| Matthew Coon Come* | Director | |||||||
| Noreen Doyle* | Non-Executive Chair | |||||||
| Veronica M. Hagen* | Director | |||||||
| René Médori* | Director | |||||||
| Jane Nelson* | Director | |||||||
| Julio M. Quintana* | Director | |||||||
| Susan N. Story* | Director |
| *By: | /s/ NANCY LIPSON | |||||||
| Nancy Lipson Attorney-in-Fact |
SCH- 1
SCHEDULE II-VALUATION AND QUALIFYING ACCOUNTS
| Years Ended December 31, | |||||||||||||||||
| 2020 | 2019 | 2018 | |||||||||||||||
| (in millions) | |||||||||||||||||
| Deferred Income Tax Valuation Allowance | |||||||||||||||||
| Balance at beginning of year | $ | 3,112 | $ | 2,994 | $ | 2,815 | |||||||||||
| Additions due to acquisition of Goldcorp | 86 | 521 | — | ||||||||||||||
| Additions to deferred income tax expense | 372 | 97 | 200 | ||||||||||||||
| Reduction of deferred income tax expense | (186) | (392) | (54) | ||||||||||||||
| Re-classification to Assets Held for Sale | — | (371) | — | ||||||||||||||
| Additions reflected in other components of the financial statements | 34 | 263 | — | ||||||||||||||
| Additions due to Tax Cuts and Jobs Act | — | — | 79 | ||||||||||||||
| Reduction due to Tax Cuts and Jobs Act | — | — | (46) | ||||||||||||||
| Balance at end of year | $ | 3,418 | $ | 3,112 | $ | 2,994 |
Refer to Note 12 of the Consolidated Financial Statements for additional information.
SCH- 2