 filings.tools
Netflix 10-K 2023-12-31
Filed 2024-01-26. 24 sections, 317K characters. Original on sec.gov · Markdown · JSON
Cover and table of contents
UNITED STATES SECURITIES AND EXCHANGE COMMISSION
Washington, D.C. 20549
_____________________________________________________________________
FORM 10-K
_____________________________________________________________________
(Mark One)
| ☒ | ANNUAL REPORT PURSUANT TO SECTION 13 OR 15(d) OF THE SECURITIES EXCHANGE ACT OF 1934 |
For the fiscal year ended December 31, 2023
OR
| ☐ | TRANSITION REPORT PURSUANT TO SECTION 13 OR 15(d) OF THE SECURITIES EXCHANGE ACT OF 1934 |
For the transition period from to
Commission File Number: 001-35727
_____________________________________________________________________
Netflix, Inc.
(Exact name of registrant as specified in its charter)
_____________________________________________________________________
| Delaware | 77-0467272 | |||||||
| (State or other jurisdiction of incorporation or organization) | (I.R.S. Employer Identification No.) |
121 Albright Way, Los Gatos, California 95032
(Address and zip code of principal executive offices)
(408) 540-3700
(Registrant’s telephone number, including area code)
_____________________________________________________________________
Securities registered pursuant to Section 12(b) of the Act:
| Title of each class | Trading Symbol(s) | Name of each exchange on which registered | ||||||
| Common stock, par value $0.001 per share | NFLX | NASDAQ Global Select Market |
Securities registered pursuant to Section 12(g) of the Act: None
_____________________________________________________________________
Indicate by check mark if the registrant is a well-known seasoned issuer, as defined in Rule 405 of the Securities Act. Yes ☒ No ☐
Indicate by check mark if the registrant is not required to file reports pursuant to Section 13 or Section 15(d) of the Act. Yes ☐ No ☒
Indicate by check mark whether the registrant: (1) has filed all reports required to be filed by Section 13 or 15(d) of the Securities Exchange Act of 1934 during the preceding 12 months (or for such shorter period that the registrant was required to file such reports), and (2) has been subject to such filing requirements for the past 90 days. Yes ☒ No ☐
Indicate by check mark whether the registrant has submitted electronically, every Interactive Data File required to be submitted pursuant to Rule 405 of Regulation S-T (§232.405 of this chapter) during the preceding 12 months (or for such shorter period that the registrant was required to submit such files). Yes ☒ No ☐
Indicate by check mark whether the registrant is a large accelerated filer, an accelerated filer, a non-accelerated filer, a smaller reporting company, or an emerging growth company. See the definitions of “large accelerated filer,” “accelerated filer,” “smaller reporting company,” and “emerging growth company” in Rule 12b-2 of the Exchange Act.
| Large accelerated filer | ☒ | Accelerated filer | ☐ | |||||||||||
| Non-accelerated filer | ☐ | Smaller reporting company | ☐ | |||||||||||
| Emerging growth company | ☐ |
If an emerging growth company, indicate by check mark if the registrant has elected not to use the extended transition period for complying with any new or revised financial accounting standards provided pursuant to Section 13(a) of the Exchange Act. ☐
Indicate by check mark whether the registrant has filed a report on and attestation to its management's assessment of the effectiveness of its internal control over financial reporting under Section 404(b) of the Sarbanes-Oxley Act (15 U.S.C. 7262(b)) by the registered public accounting firm that prepared or issued its audit report. ☒
If securities are registered pursuant to Section 12(b) of the Act, indicate by check mark whether the financial statements of the registrant included in the filing reflect the correction of an error to previously issued financial statements. ☐
Indicate by check mark whether any of those error corrections are restatements that required a recovery analysis of incentive-based compensation received by any of the registrant’s executive officers during the relevant recovery period pursuant to §240.10D-1(b). ☐
Indicate by check mark whether the registrant is a shell company (as defined in Rule 12b-2 of the Act). Yes ☐ No ☒
As of June 30, 2023 the aggregate market value of voting stock held by non-affiliates of the registrant, based upon the closing sales price for the registrant’s common stock, as reported in the NASDAQ Global Select Market System, was $192,301,932,760. Shares of common stock beneficially owned by each executive officer and director of the registrant and by each person known by the registrant to beneficially own 10% or more of the outstanding common stock
have been excluded in that such persons may be deemed to be affiliates. This determination of affiliate status is not necessarily a conclusive determination for any other purpose.
As of December 31, 2023, there were 432,759,584 shares of the registrant’s common stock, par value $0.001, outstanding.
DOCUMENTS INCORPORATED BY REFERENCE
Parts of the registrant’s Proxy Statement for the registrant’s 2024 Annual Meeting of Stockholders are incorporated by reference into Part III of this Annual Report on Form 10-K.
NETFLIX, INC.
TABLE OF CONTENTS
PART I
Forward-Looking Statements
This Annual Report on Form 10-K contains forward-looking statements within the meaning of the federal securities laws. These forward-looking statements include, but are not limited to, statements regarding: our core strategy; our ability to improve our content offerings and service; our future financial performance, including expectations regarding revenues, deferred revenue, operating income and margin, net income, expenses, and profitability; liquidity, including the sufficiency of our capital resources, net cash provided by (used in) operating activities, access to financing sources, and free cash flows; capital allocation strategies, including any stock repurchases or repurchase programs; seasonality; stock price volatility; impact of foreign exchange rate fluctuations, including on net income, revenues and average revenues per paying member; impact of interest rate fluctuations; adequacy of existing facilities; future regulatory changes and their impact on our business; intellectual property; price changes and testing; accounting treatment for changes related to content assets; acquisitions; actions by competitors; membership growth, including impact of content and pricing changes on membership growth; partnerships; advertising; multi-household usage; member viewing patterns; dividends; future contractual obligations, including unknown content obligations and timing of payments; our global content and marketing investments, including investments in original programming; impact of work stoppages; content amortization; resolutions of tax examinations; tax expense; unrecognized tax benefits; deferred tax assets; our ability to effectively manage change and growth; our company culture; and our ability to attract and retain qualified employees and key personnel. These forward-looking statements are subject to risks and uncertainties that could cause actual results and events to differ. A detailed discussion of these and other risks and uncertainties that could cause actual results and events to differ materially from such forward-looking statements is included throughout this filing and particularly in Item 1A: "Risk Factors" section set forth in this Annual Report on Form 10-K. All forward-looking statements included in this document are based on information available to us on the date hereof, and we assume no obligation to revise or publicly release any revision to any such forward-looking statement, except as may otherwise be required by law.
Item 1. Business
ABOUT US
Netflix, Inc. (“Netflix”, “the Company”, “registrant”, “we”, or “us”) is one of the world’s leading entertainment services with over 260 million paid memberships in over 190 countries enjoying TV series, films and games across a wide variety of genres and languages. Members can play, pause and resume watching as much as they want, anytime, anywhere, and can change their plans at any time.
Our core strategy is to grow our business globally within the parameters of our operating margin target. We strive to continuously improve our members' experience by offering compelling content that delights them and attracts new members. We seek to drive conversation around our content to further enhance member joy, and we are continuously enhancing our user interface to help our members more easily choose content that they will find enjoyable.
BUSINESS SEGMENTS
We operate as one operating segment. Our revenues are primarily derived from monthly membership fees for services related to streaming content to our members. See Note 12, Segment and Geographic Information, in the accompanying notes to our consolidated financial statements for further detail.
COMPETITION
The market for entertainment video is intensely competitive and subject to rapid change. We compete with a broad set of activities for consumers’ leisure time, including other entertainment video providers, such as linear TV, streaming entertainment providers (including those that provide pirated content), video gaming providers and more broadly against other sources of entertainment, like social media, that our members could choose in their moments of free time. We also compete against entertainment video providers and content producers in obtaining content for our service, both for licensed content and for original content projects.
While consumers may maintain simultaneous relationships with multiple entertainment sources, we strive for consumers to choose us in their moments of free time. We have often referred to this choice as our objective of "winning moments of truth." In attempting to win these moments of truth with our members, we seek to continually improve our service, including both our technology and our content offerings.
SEASONALITY
Our membership growth exhibits a seasonal pattern that reflects variations when consumers buy internet-connected screens and when they tend to increase their viewing. Historically, the fourth quarter represents our greatest streaming membership growth. In addition, our membership growth can be impacted by our content release schedule and changes to pricing and plans.
INTELLECTUAL PROPERTY
We regard our trademarks, service marks, copyrights, patents, domain names, trade dress, trade secrets, proprietary technologies and similar intellectual property as important to our success. We use a combination of patent, trademark, copyright and trade secret laws and confidentiality agreements to protect our proprietary intellectual property. Our intellectual property rights extend to our technology, business processes and the content we produce and distribute through our service. We use the intellectual property of third parties in creating some of our content, merchandising our products and marketing our service. Our ability to provide our members with content they can watch depends on studios, content providers and other rights holders licensing rights, including distribution rights, to such content and certain related elements thereof, such as the public performance of music contained within the content we distribute. The license periods and the terms and conditions of such licenses vary. Our ability to protect and enforce our intellectual property rights is subject to certain risks and from time to time we encounter disputes over rights and obligations concerning intellectual property. We cannot provide assurance that we will prevail in any intellectual property disputes.
REGULATION
The media landscape and the internet delivery of content have seen growing regulatory action. Historically, media has been highly regulated in many countries. We are seeing some of these legacy regulatory frameworks be updated and expanded to address services like ours. In particular, we are seeing some countries update their cultural support legislation to include services like Netflix. This includes content quotas, levies and investment obligations. Some even restrict the extent of ownership rights we can have both in our service and in our content. In certain countries, regulators are also looking at restrictions that could require formal reviews of and/or adjustments to content that appears on our service in their country. In general these regulations impact all services and may make operating in certain jurisdictions more expensive or restrictive as to the content offerings we may provide.
HUMAN CAPITAL
We view our employees and our culture as key to our success. As of December 31, 2023, we had approximately 13,000 full-time employees. Of these, approximately 9,000 (69%) were located in the United States and Canada, 2,000 (15%) in Europe, Middle East, and Africa, 500 (4%) in Latin America and 1,500 (12%) in Asia-Pacific. We also have a number of employees engaged in content production, some of whom are part-time or temporary, and whose numbers fluctuate throughout the year. We believe a critical component of our success is our company culture. This culture, which is detailed in a "Culture Memo" located on our website, is often described as providing a unique environment for our associates to perform the best work of their lives in pursuit of excellence. We aim to attract and retain great people - representing a diverse array of perspectives and skills - to work together as a dream team. We empower all of our employees so that they can have significant impact and input into decision-making; each employee has a high degree of freedom and power to make the decisions and take actions in the best interest of the company in carrying out their role. In return, our employees are responsible and accountable for those decisions and actions. With this approach, we believe we are a more flexible, fun, stimulating, creative, collaborative and successful organization.
As we have expanded our offices globally, our company culture remains an important aspect of our operations. We are mindful of cultural differences across and within regions. Fostering a work environment that is culturally diverse, inclusive and equitable is a major focus for us. We work to build diversity, inclusion and equity into all aspects of our operations globally, with the goal of having diversity and inclusion function as a critical lens through which each Netflix employee carries out their role. We want more people and cultures to see themselves reflected on screen - so it’s important that our employee base is diverse and represents the communities we serve. We look to help increase representation by training our recruiters on how to hire more inclusively, and to help the company and senior leaders diversify their networks. We also support numerous employee resource groups (ERGs), representing employees and allies from a broad array of historically underrepresented and/or marginalized communities. We publish annually an update on our inclusion initiatives and progress, which further highlights our approach to diversity and inclusion, and publish our EEO-1 reports on our website.
We believe in fostering great leaders. We offer programs, such as seminars and lectures, that are designed to equip our leaders (officers, VPs, people managers and director and senior manager-level employees) to lead the business and our teams in alignment with our expectations and strategic goals. We have built a portfolio of programs under three foundational pillars - great company, great leaders, and great human beings - which we believe support our current and future success. We also offer programs and workshops to provide skills and coaching to employees on a variety of topics, such as leading and inspiring
teams. We believe this focus helps our employees grow as leaders and well-rounded individuals, and better positions Netflix to operate our global business of providing compelling content to entertain the world.
We aim to generally pay our employees at the top of their personal market, and they generally are able to choose the form of their compensation between cash and stock options. This permits employee compensation to be highly personalized and reflective of each employee's individual needs and preferences. We conduct pay equity analyses at least annually, and have adopted practices to help ensure that employees from underrepresented groups are not being underpaid based on gender (globally) and race (U.S.) relative to others doing the same or similar work under comparable circumstances. We aim to rectify any pay gaps that we find through this analysis.
We care about the health and well-being of our employees and their families and provide a variety of benefit programs based on region, including health benefits. In the U.S., employees generally receive an annual cash health benefit allowance that they may allocate to medical, dental and vision premiums in a way that makes sense for them. Employees have access to a host of other benefits, including mental health, childcare, family planning and a company match for charitable donations.
We believe that our approach to human capital resources has been instrumental in our growth, and has made Netflix a desirable destination for employees.
OTHER INFORMATION
We maintain a website at www.netflix.com. The contents of our website are not incorporated in, or otherwise to be regarded as part of, this Annual Report on Form 10-K. We make available, free of charge on our website, access to our Annual Report on Form 10-K, our Quarterly Reports on Form 10-Q, our Current Reports on Form 8-K and amendments to those reports filed or furnished pursuant to Section 13(a) or 15(d) of the Securities Exchange Act of 1934, as amended (the "Exchange Act"), as soon as reasonably practicable after we file or furnish them electronically with the Securities and Exchange Commission ("SEC").
Investors and others should note that we announce material financial and other information to our investors using our investor relations website (ir.netflix.net), SEC filings, press releases, public conference calls and webcasts. We use these channels as well as social media and blogs to communicate with our members and the public about our company, our services and other issues. It is possible that the information we post on social media and blogs could be deemed to be material information. Therefore, we encourage investors, the media, and others interested in our company to review the information we post on the social media channels and blogs listed on our investor relations website.
Item 1A. Risk Factors
If any of the following risks actually occur, our business, financial condition and results of operations could be harmed. In that case, the trading price of our common stock could decline, and you could lose all or part of your investment.
Risks Related to Our Business
If our efforts to attract and retain members are not successful, our business will be adversely affected.
We must continually add new members both to replace canceled memberships and to grow our business beyond our current membership base. Our penetration and growth rates have fluctuated and vary across the jurisdictions where we provide our service. In countries where we have been operating for many years or where we are highly penetrated, our membership growth is slower than in newer or less penetrated countries. Our ability to continue to attract and retain members will depend in part on our ability to consistently provide our members in countries around the globe with compelling content choices that keep our members engaged with our service, effectively drive conversation around our content and service, as well as provide a quality experience for choosing and enjoying TV series, films and games. Furthermore, the relative service levels, content offerings, pricing and related features of competitors to our service may adversely impact our ability to attract and retain members. Competitors include other entertainment video providers, such as linear television, and streaming entertainment providers (including those that provide pirated content), video gaming providers, as well as user-generated content, and more broadly other sources of entertainment that our members could choose in their moments of free time.
Members cancel our service for many reasons, including a perception that they do not use the service sufficiently, that they need to cut household expenses, dissatisfaction with content, a preference for competitive services and customer service issues that they believe are not satisfactorily resolved. Membership growth is also impacted by seasonality, with the fourth quarter historically representing our greatest growth, as well as the timing of our content release schedules. Adverse macroeconomic conditions, including inflation, may also adversely impact our ability to attract and retain members. If we do not grow as expected, given, in particular, that our content costs are largely fixed in nature, we may not be able to adjust our expenditures or increase our (per membership) revenues, including by adjusting membership pricing, commensurate with the lowered growth rate such that our margins, liquidity and results of operations may be adversely impacted. If we are unable to successfully compete with current and new competitors in providing compelling content, retaining our existing members and attracting new members, our business will be adversely affected.
If we do not continuously provide value to our members, including making improvements to our service in a manner that is favorably received by them, our revenue, results of operations and business will be adversely affected.
If consumers do not perceive our service offering to be of value, including if we introduce new or adjust existing features, adjust pricing or service offerings, or change the mix of content in a manner that is not favorably received by them, we may not be able to attract and retain members, and accordingly, our revenue, including revenue per paying membership, and results of operations may be adversely affected. We have recently expanded our entertainment video offering to include games. If our efforts to develop and offer games are not valued by our current and future members, our ability to attract and retain members may be negatively impacted. We may also seek to extend our business into new products and services to help drive growth. For example, we are expanding our offering of consumer products and live experiences. To the extent we cannot successfully find and develop new products and services to help drive growth, our future results of operations and growth may be adversely impacted.
We have and may, from time to time, adjust our membership pricing, our membership plans, or our pricing model itself. For example, we introduced a new, lower-priced ad-supported subscription plan. Similarly, we have increased enforcement of and will continue to enforce our terms of use to limit multi-household usage and shared viewing outside of a household. These and other adjustments we make may not be well-received by consumers, and could negatively impact our ability to attract and retain members, revenues per paying membership, revenue and our results of operations. In addition, many of our members rejoin our service or originate from word-of-mouth advertising from existing members. If our efforts to satisfy our existing members or adjustments to our service are not successful, we may not be able to attract or retain members, and as a result, our ability to maintain and/or grow our business will be adversely affected.
Changes in competitive offerings for entertainment video could adversely impact our business.
The market for entertainment is intensely competitive and subject to rapid change. Through new and existing distribution channels, consumers have increasing options to access entertainment video. The various economic models underlying these channels include subscription, transactional, ad-supported and piracy-based models. All of these have the potential to capture
meaningful segments of the entertainment video market. Traditional providers of entertainment video, including broadcasters and cable network operators, as well as internet based e-commerce or entertainment video providers are increasing their streaming video offerings. Several of these competitors have long operating histories, large customer bases, strong brand recognition, exclusive rights to certain content, large content libraries, and significant financial, marketing and other resources. They may offer more compelling content or secure better terms from suppliers, adopt more aggressive pricing and devote more resources to product development, technology, infrastructure, content acquisitions and marketing. New entrants may enter the market or existing providers may adjust their services with unique offerings or approaches to providing entertainment video. In addition, new technological developments, including the development and use of generative artificial intelligence, are rapidly evolving. If our competitors gain an advantage by using such technologies, our ability to compete effectively and our results of operations could be adversely impacted. Companies also may enter into business combinations or alliances that strengthen their competitive positions. Piracy also threatens to damage our business, as its fundamental proposition to consumers is so compelling and difficult to compete against: virtually all content for free. In light of the compelling consumer proposition, piracy services are subject to rapid global growth, and our efforts to prevent that growth may be insufficient. If we are unable to successfully or profitably compete with current and new competitors, our business will be adversely affected, and we may not be able to increase or maintain market share, revenues or profitability.
We face risks, such as unforeseen costs and potential liability in connection with content we acquire, produce, license and/or distribute through our service.
As a producer and distributor of content, we face potential liability for negligence, copyright and trademark infringement, or other claims based on the nature and content of materials that we acquire, produce, license and/or distribute. We also may face potential liability for content used in promoting our service, including marketing materials. We devote significant resources toward the de
Showing the first 8K of 71K characters. Open the full section
Item 1B. Unresolved Staff Comments
None.
Item 1C. Cybersecurity
We have an enterprise-wide information security program designed to identify, protect, detect and respond to and manage reasonably foreseeable cybersecurity risks and threats. To protect our information systems from cybersecurity threats, we use various security tools that help prevent, identify, escalate, investigate, resolve and recover from identified vulnerabilities and security incidents in a timely manner. These include, but are not limited to, internal reporting, monitoring and detection tools, and a bug bounty program to allow security researchers to assist us in identifying vulnerabilities in our products before they are exploited by malicious threat actors. We also maintain a third party security program to identify, prioritize, assess, mitigate and remediate third party risks; however, we rely on the third parties we use to implement security programs commensurate with their risk, and we cannot ensure in all circumstances that their efforts will be successful.
We regularly assess risks from cybersecurity and technology threats and monitor our information systems for potential vulnerabilities. We use a widely-adopted risk quantification model to identify, measure and prioritize cybersecurity and technology risks and develop related security controls and safeguards. We conduct regular reviews and tests of our information security program and also leverage audits by our internal audit team, tabletop exercises, penetration and vulnerability testing, red team exercises, simulations, and other exercises to evaluate the effectiveness of our information security program and improve our security measures and planning. We also engage an external auditor to conduct an annual payment card industry data security standard review of our security controls protecting payment information, as well as third-party penetration testing of our cardholder environment and related systems. The results of these assessments are reported to the Audit Committee.
Our systems periodically experience directed attacks intended to lead to interruptions and delays in our service and operations as well as loss, misuse or theft of personal information (of third parties, employees, and our members) and other data, confidential information or intellectual property, and we have experienced an unauthorized release of certain digital content assets. However, to date these incidents have not had a material impact on our service, systems or business. Any significant disruption to our service or access to our systems could result in a loss of members and adversely affect our business and results of operation. Further, a penetration of our systems or a third-party’s systems or other misappropriation or misuse of personal information could subject us to business, regulatory, litigation and reputation risk, which could have a negative effect on our business, financial condition and results of operations. See "Risk Factors - Any significant disruption in or unauthorized access to our computer systems or those of third parties that we utilize in our operations, including those relating to cybersecurity or arising from cyber-attacks, could result in a loss or degradation of service, unauthorized access, disclosure or destruction of data, including member and corporate information, or theft of intellectual property, including digital content assets, which could adversely impact our business."
The Vice President of Security and Privacy Engineering leads our global information security organization responsible for overseeing the Netflix information security program. Our VP of Security and Privacy Engineering has over 30 years of industry experience, including serving in similar roles leading and overseeing cybersecurity programs at other public companies. Team members who support our information security program have relevant educational and industry experience,
including holding similar positions at large technology companies. The teams provide regular reports to senior management and other relevant teams on various cybersecurity threats, assessments and findings.
The Board oversees our annual enterprise risk assessment, where we assess key risks within the company, including security and technology risks and cybersecurity threats. The Audit Committee of the Board oversees our cybersecurity risk and receives regular reports from our VP of Security and Privacy Engineering on various cybersecurity matters, including risk assessments, mitigation strategies, areas of emerging risks, incidents and industry trends, and other areas of importance.
Item 2. Properties
We have leased principal properties in both Los Gatos, California, which is the location of our corporate headquarters, and in Los Angeles, California. In addition, we lease various office and production space throughout the world.
We believe that our existing facilities are adequate to meet current requirements, and that suitable additional or substitute space will be available as needed to accommodate any further physical expansion of operations and for any additional offices.
Item 3. Legal Proceedings
Information with respect to this item may be found in Note 8 Commitments and Contingencies in the accompanying notes to our consolidated financial statements included in Part II, Item 8, "Financial Statements and Supplementary Data" of this Annual Report on Form 10-K, under the caption "Legal Proceedings" which information is incorporated herein by reference.
Item 4. Mine Safety Disclosures
Item 5. Market for Registrant’s Common Equity, Related Stockholder Matters and Issuer Purchases of Equity Securities
Market Information
Our common stock is traded on the NASDAQ Global Select Market under the symbol “NFLX”.
Holders
As of December 31, 2023, there were approximately 2,728 stockholders of record of our common stock, although there is a significantly larger number of beneficial owners of our common stock.
Dividend Policy
We have never declared or paid any cash dividends on our capital stock, and we do not currently anticipate paying any cash dividends in the foreseeable future.
Company Purchases of Equity Securities
Stock repurchases during the three months ended December 31, 2023 were as follows:
| Period | Total Number of Shares Purchased (1) | Average Price Paid per Share (2) | Total Number of Shares Purchased as Part of Publicly Announced Programs (1) | Approximate Dollar Value of Shares that May Yet Be Purchased Under the Program (1) | ||||||||||||||||||||||
| (in thousands) | ||||||||||||||||||||||||||
| October 1 - 31, 2023 | 287,360 | $ | 404.62 | 287,360 | $ | 10,738,584 | ||||||||||||||||||||
| November 1 - 30, 2023 | 2,708,477 | $ | 447.03 | 2,708,477 | $ | 9,527,821 | ||||||||||||||||||||
| December 1 - 31, 2023 | 2,481,771 | $ | 472.63 | 2,481,771 | $ | 8,354,857 | ||||||||||||||||||||
| Total | 5,477,608 | 5,477,608 |
| (1) In March 2021, the Company’s Board of Directors authorized the repurchase of up to $5 billion of its common stock, with no expiration date, and in September 2023, the Board of Directors increased the share repurchase authorization by an additional $10 billion, also with no expiration date. For further information regarding stock repurchase activity, see Note 9 Stockholders’ Equity to the consolidated financial statements in this Annual Report. | ||
| (2) Average price paid per share includes costs associated with the repurchases. |
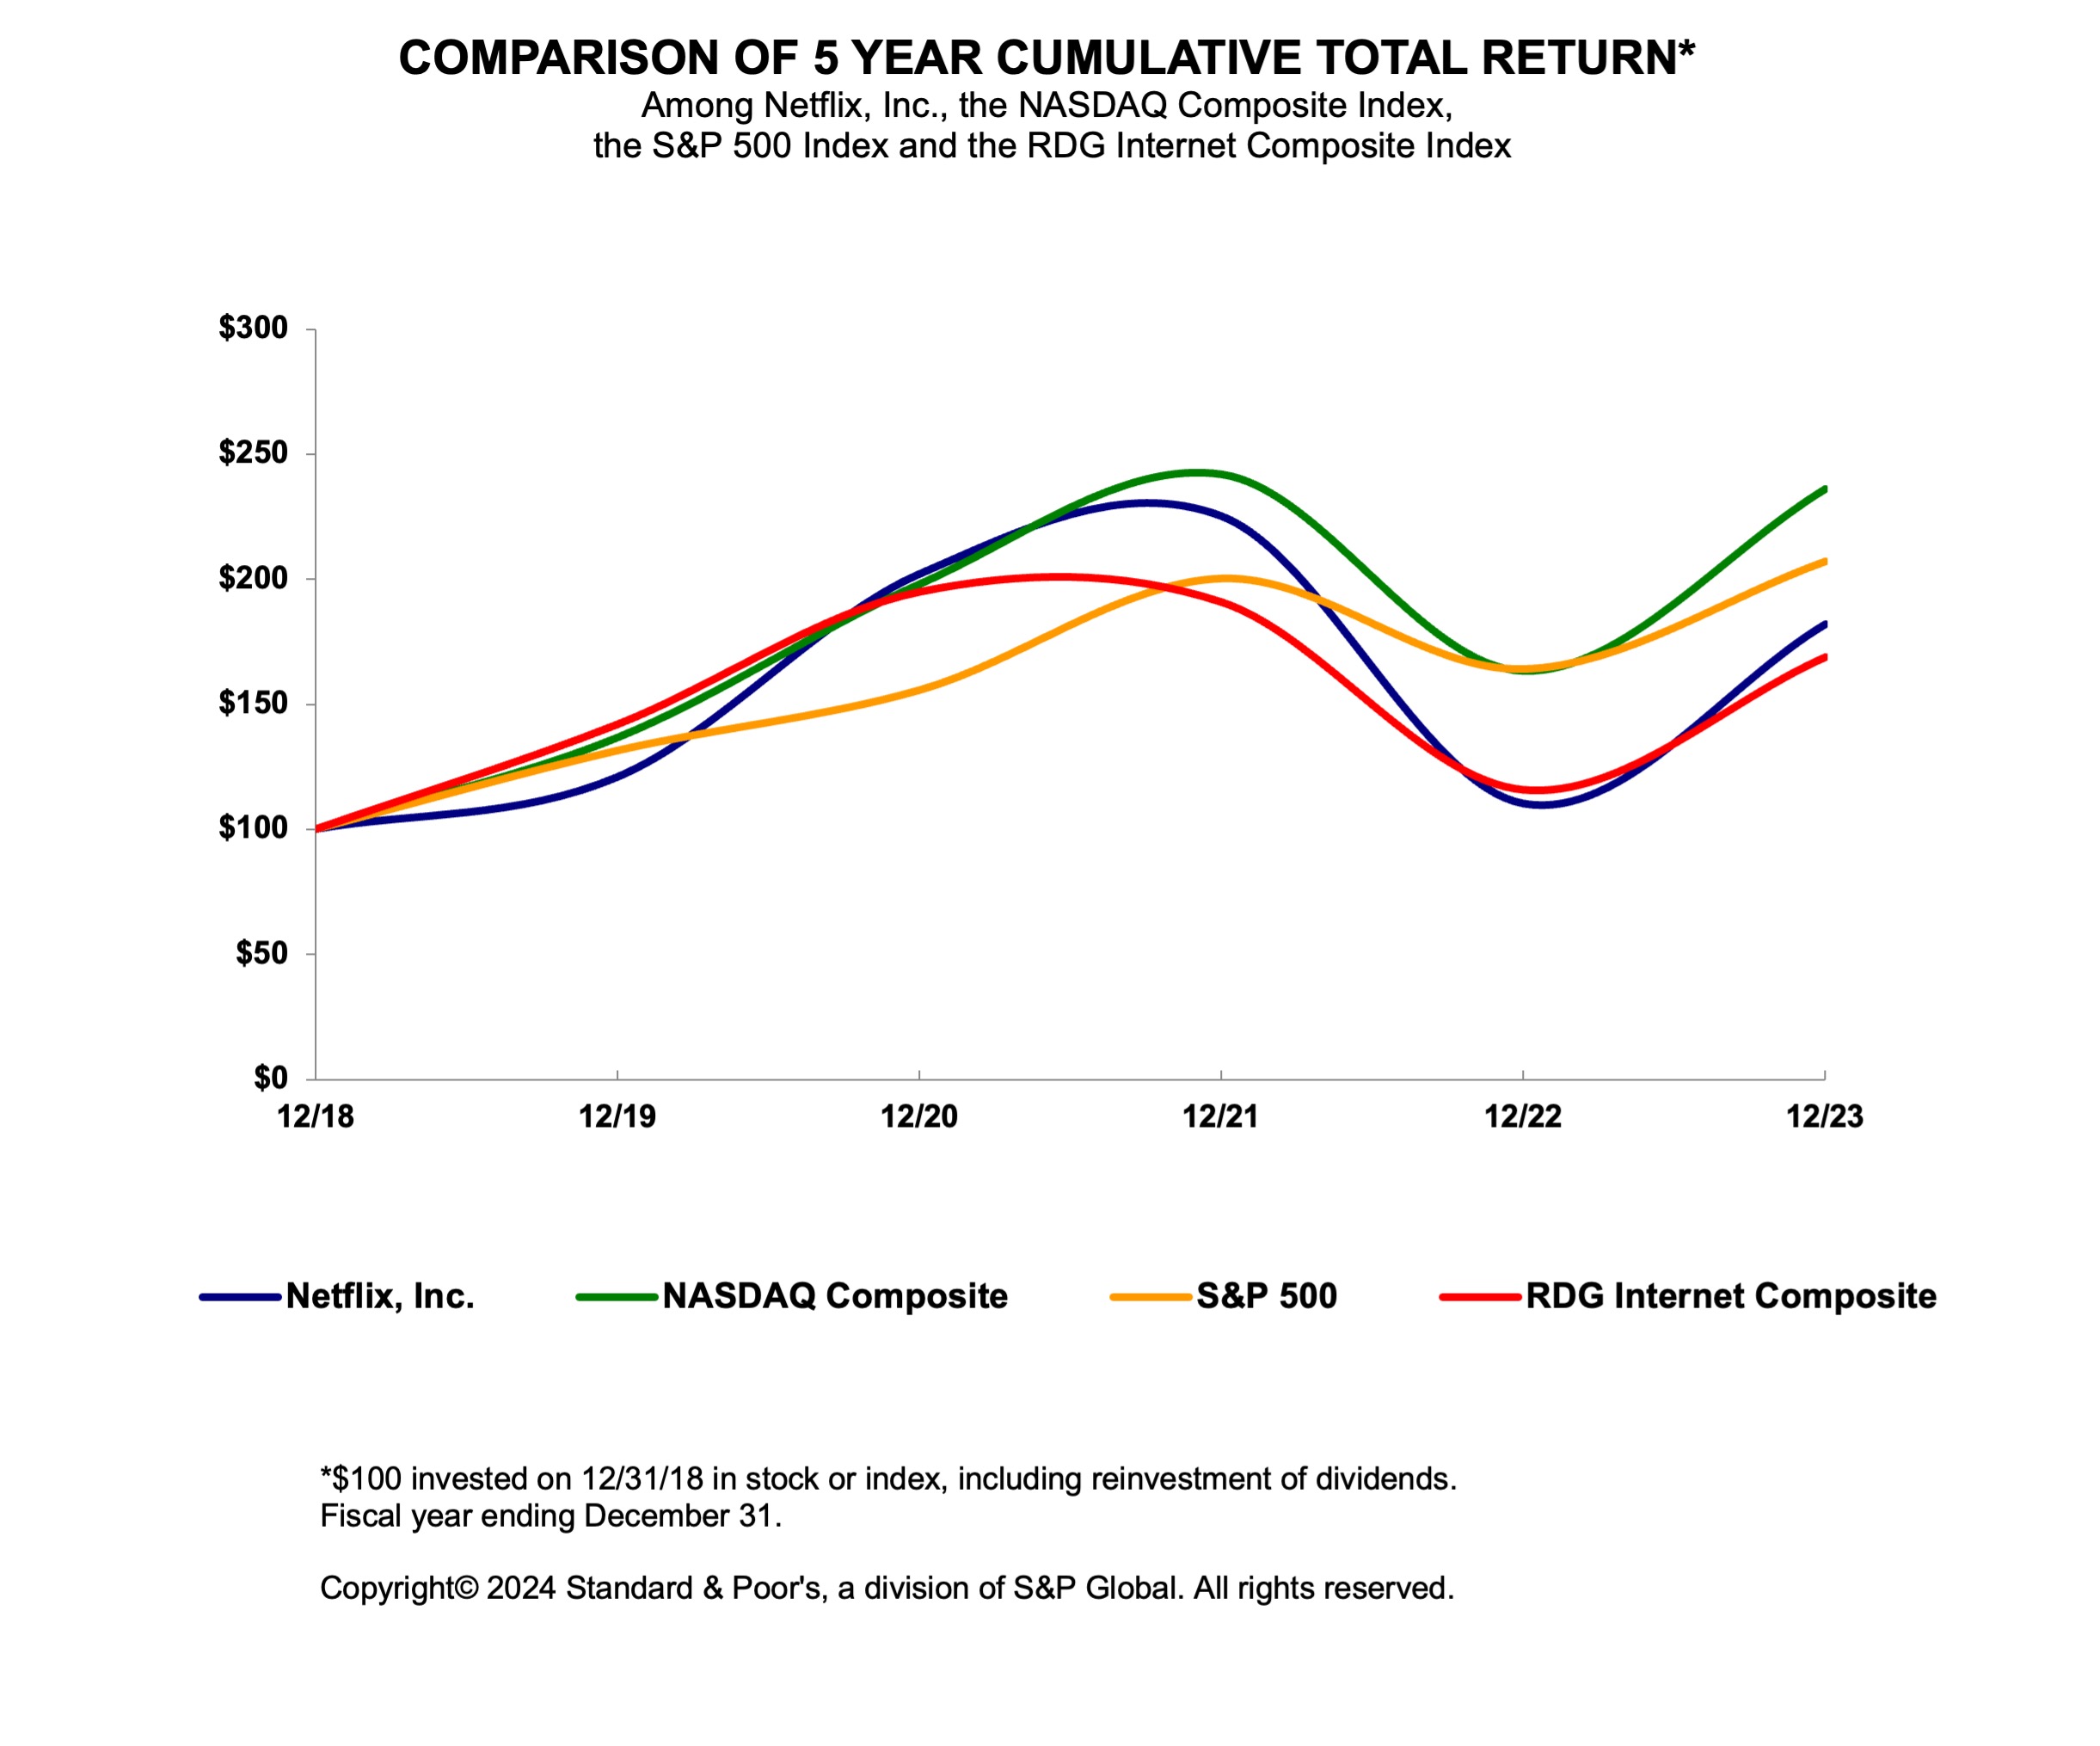
Stock Performance Graph
Notwithstanding any statement to the contrary in any of our previous or future filings with the Securities and Exchange Commission, the following information relating to the price performance of our common stock shall not be deemed “filed” with the Commission or “soliciting material” under the Exchange Act and shall not be incorporated by reference into any such filings.
The following graph compares, for the five year period ended December 31, 2023, the total cumulative stockholder return on the Company’s common stock with the total cumulative return of the NASDAQ Composite Index, the S&P 500 Index and the RDG Internet Composite Index. Measurement points are the last trading day of each of the Company’s fiscal years ended December 31, 2018, December 31, 2019, December 31, 2020, December 31, 2021, December 31, 2022 and December 31, 2023. Total cumulative stockholder return assumes $100 invested at the beginning of the period in the Company’s common stock, the stocks represented in the NASDAQ Composite Index, the stocks represented in the S&P 500 Index and the stocks represented in the RDG Internet Composite Index, respectively, and reinvestment of any dividends. Historical stock price performance should not be relied upon as an indication of future stock price performance.
Item 6. [Reserved]
Item 7. Management’s Discussion and Analysis of Financial Condition and Results of Operations
This section of this Form 10-K generally discusses 2023 and 2022 items and year-to-year comparisons between 2023 and 2022. Discussions of 2021 items and year-to-year comparisons between 2022 and 2021 that are not included in this Form 10-K can be found in "Management's Discussion and Analysis of Financial Condition and Results of Operations" in Part II, Item 7 of the Company's Annual Report on Form 10-K for the fiscal year ended December 31, 2022.
Results of Operations
The following represents our consolidated performance highlights:
| As of/Year Ended December 31, | Change | |||||||||||||||||||||||||
| 2023 | 2022 | 2021 | 2023 vs. 2022 | |||||||||||||||||||||||
| (in thousands, except revenue per membership and percentages) | ||||||||||||||||||||||||||
| Financial Results: | ||||||||||||||||||||||||||
| Streaming revenues | $ | 33,640,458 | $ | 31,469,852 | $ | 29,515,496 | 7 | % | ||||||||||||||||||
| DVD revenues (1) | 82,839 | 145,698 | 182,348 | (43) | % | |||||||||||||||||||||
| Total revenues | $ | 33,723,297 | $ | 31,615,550 | $ | 29,697,844 | 7 | % | ||||||||||||||||||
| Operating income | $ | 6,954,003 | $ | 5,632,831 | $ | 6,194,509 | 23 | % | ||||||||||||||||||
| Operating margin | 21 | % | 18 | % | 21 | % | ||||||||||||||||||||
| Global Streaming Memberships: | ||||||||||||||||||||||||||
| Paid net membership additions | 29,529 | 8,903 | 18,181 | 232 | % | |||||||||||||||||||||
| Paid memberships at end of period | 260,276 | 230,747 | 221,844 | 13 | % | |||||||||||||||||||||
| Average paying memberships | 240,889 | 222,924 | 210,784 | 8 | % | |||||||||||||||||||||
| Average monthly revenue per paying membership | $ | 11.64 | $ | 11.76 | $ | 11.67 | (1) | % |
(1) In April 2023, we announced our plans to discontinue our DVD-by-mail service, and we ceased providing our mailing services to customers on September 29, 2023. The discontinuance of our DVD business had an immaterial impact on our operations and financial results.
Consolidated revenues for the year ended December 31, 2023 increased 7% as compared to the year ended December 31, 2022. Operating margin for the year ended December 31, 2023 increased three percentage points, primarily due to revenues growing at a faster rate as compared to the growth in cost of revenues and marketing and decreased technology and development expenses, partially offset by higher growth in general and administrative expenses as compared to the growth in revenues.
Streaming Revenues
We primarily derive revenues from monthly membership fees for services related to streaming content to our members. We offer a variety of streaming membership plans, the price of which varies by country and the features of the plan. As of December 31, 2023, pricing on our paid plans ranged from the U.S. dollar equivalent of $1 to $28 per month, and pricing on our extra member sub accounts ranged from the U.S. dollar equivalent of $2 to $8 per month. We expect that from time to time the prices of our membership plans in each country may change and we may test other plan and price variations.
We also earn revenue from advertisements presented on our streaming service, consumer products and various other sources. Revenues earned from sources other than monthly membership fees were not material for the years ended December 31, 2023, 2022, and 2021.
| Year Ended December 31, | Change | |||||||||||||||||||||||||||||||
| 2023 | 2022 | 2021 | 2023 vs. 2022 | |||||||||||||||||||||||||||||
| (in thousands, except percentages) | ||||||||||||||||||||||||||||||||
| Streaming revenues | $ | 33,640,458 | $ | 31,469,852 | $ | 29,515,496 | $ | 2,170,606 | 7 | % | ||||||||||||||||||||||
Streaming revenues for the year ended December 31, 2023 increased 7% as compared to the year ended December 31, 2022, primarily due to the 8% growth in average paying memberships, partially offset by a 1% decrease in average monthly revenue per paying membership. The decrease in average monthly revenue per paying membership was primarily due to changes in plan mix, higher membership growth in regions with lower average monthly revenue per paying membership, partially offset by limited price increases. Additionally, streaming revenues for the year ended December 31, 2023 were further impacted by unfavorable fluctuations in foreign exchange rates.
The following tables summarize streaming revenue and other streaming membership information by region for the years ended December 31, 2023, 2022 and 2021.
United States and Canada (UCAN)
| As of/Year Ended December 31, | Change | |||||||||||||||||||||||||||||||
| 2023 | 2022 | 2021 | 2023 vs. 2022 | |||||||||||||||||||||||||||||
| (in thousands, except revenue per membership and percentages) | ||||||||||||||||||||||||||||||||
| Revenues | $ | 14,873,783 | $ | 14,084,643 | $ | 12,972,100 | $ | 789,140 | 6 | % | ||||||||||||||||||||||
| Paid net membership additions (losses) | 5,832 | (919) | 1,279 | 6,751 | 735 | % | ||||||||||||||||||||||||||
| Paid memberships at end of period (1) | 80,128 | 74,296 | 75,215 | 5,832 | 8 | % | ||||||||||||||||||||||||||
| Average paying memberships | 76,126 | 74,001 | 74,234 | 2,125 | 3 | % | ||||||||||||||||||||||||||
| Average monthly revenue per paying membership | $ | 16.28 | $ | 15.86 | $ | 14.56 | $ | 0.42 | 3 | % | ||||||||||||||||||||||
| Constant currency change (2) | 3 | % | ||||||||||||||||||||||||||||||
Europe, Middle East, and Africa (EMEA)
| As of/Year Ended December 31, | Change | |||||||||||||||||||||||||||||||
| 2023 | 2022 | 2021 | 2023 vs. 2022 | |||||||||||||||||||||||||||||
| (in thousands, except revenue per membership and percentages) | ||||||||||||||||||||||||||||||||
| Revenues | $ | 10,556,487 | $ | 9,745,015 | $ | 9,699,819 | $ | 811,472 | 8 | % | ||||||||||||||||||||||
| Paid net membership additions | 12,084 | 2,693 | 7,338 | 9,391 | 349 | % | ||||||||||||||||||||||||||
| Paid memberships at end of period (1) | 88,813 | 76,729 | 74,036 | 12,084 | 16 | % | ||||||||||||||||||||||||||
| Average paying memberships | 80,928 | 73,904 | 69,518 | 7,024 | 10 | % | ||||||||||||||||||||||||||
| Average monthly revenue per paying membership | $ | 10.87 | $ | 10.99 | $ | 11.63 | $ | (0.12) | (1) | % | ||||||||||||||||||||||
| Constant currency change (2) | (1) | % | ||||||||||||||||||||||||||||||
Latin America (LATAM)
| As of/Year Ended December 31, | Change | |||||||||||||||||||||||||||||||
| 2023 | 2022 | 2021 | 2023 vs. 2022 | |||||||||||||||||||||||||||||
| (in thousands, except revenue per membership and percentages) | ||||||||||||||||||||||||||||||||
| Revenues | $ | 4,446,461 | $ | 4,069,973 | $ | 3,576,976 | $ | 376,488 | 9 | % | ||||||||||||||||||||||
| Paid net membership additions | 4,298 | 1,738 | 2,424 | 2,560 | 147 | % | ||||||||||||||||||||||||||
| Paid memberships at end of period (1) | 45,997 | 41,699 | 39,961 | 4,298 | 10 | % | ||||||||||||||||||||||||||
| Average paying memberships | 42,802 | 40,000 | 38,573 | 2,802 | 7 | % | ||||||||||||||||||||||||||
| Average monthly revenue per paying membership | $ | 8.66 | $ | 8.48 | $ | 7.73 | $ | 0.18 | 2 | % | ||||||||||||||||||||||
| Constant currency change (2) | 10 | % | ||||||||||||||||||||||||||||||
Asia-Pacific (APAC)
| As of/Year Ended December 31, | Change | |||||||||||||||||||||||||||||||
| 2023 | 2022 | 2021 | 2023 vs. 2022 | |||||||||||||||||||||||||||||
| (in thousands, except revenue per membership and percentages) | ||||||||||||||||||||||||||||||||
| Revenues | $ | 3,763,727 | $ | 3,570,221 | $ | 3,266,601 | $ | 193,506 | 5 | % | ||||||||||||||||||||||
| Paid net membership additions | 7,315 | 5,391 | 7,140 | 1,924 | 36 | % | ||||||||||||||||||||||||||
| Paid memberships at end of period (1) | 45,338 | 38,023 | 32,632 | 7,315 | 19 | % | ||||||||||||||||||||||||||
| Average paying memberships | 41,033 | 35,019 | 28,461 | 6,014 | 17 | % | ||||||||||||||||||||||||||
| Average monthly revenue per paying membership | $ | 7.64 | $ | 8.50 | $ | 9.56 | $ | (0.86) | (10) | % | ||||||||||||||||||||||
| Constant currency change (2) | (6) | % | ||||||||||||||||||||||||||||||
(1) A paid membership (also referred to as a paid subscription) is defined as a membership that has the right to receive Netflix service following sign-up and a method of payment being provided, and that is not part of a free trial or certain other promotions that may be offered by the Company to new or rejoining members. Certain members have the option to add extra member sub accounts. These extra member sub accounts are not included in paid memberships. A membership is canceled and ceases to be reflected in the above metrics as of the effective cancellation date. Voluntary cancellations generally become effective at the end of the prepaid membership period. Involuntary cancellations, as a result of a failed method of payment, become effective immediately. Memberships are assigned to territories based on the geographic location used at time of sign-up as determined by the Company’s internal systems, which utilize industry standard geo-location technology.
(2) We believe the non-GAAP financial measure of constant currency revenue is useful in analyzing the underlying trends in average monthly revenue per paying membership absent foreign currency fluctuations. However, this non-GAAP financial measure should be considered in addition to, not as a substitute for, or superior to other financial measures prepared in accordance with GAAP. In order to exclude the effect of foreign currency rate fluctuations on average monthly revenue per paying membership, we estimate current period revenue assuming foreign exchange rates had remained constant with foreign exchange rates from each of the corresponding months of the prior-year period. For the year ended December 31, 2023, our revenues would have been approximately $597 million higher had foreign currency exchange rates remained constant with those for the year ended December 31, 2022.
Cost of Revenues
Amortization of content assets makes up the majority of cost of revenues. Expenses directly associated with the acquisition, licensing and production of content (such as payroll, stock-based compensation, facilities, and other related personnel expenses, costs associated with obtaining rights to music included in our content, overall deals with talent, miscellaneous production related costs and participations and residuals), streaming delivery costs and other operations costs make up the remainder of cost of revenues. We have built our own global content delivery network (“Open Connect”) to help us efficiently stream a high volume of content to our members over the internet. Delivery expenses, therefore, include equipment costs related to Open Connect, payroll and related personnel expenses and all third-party costs, such as cloud computing costs, associated with delivering content over the internet. Other operations costs include customer service and payment processing fees, including those we pay to our integrated payment partners, as well as other costs directly incurred in making our content available to members.
| Year Ended December 31, | Change | |||||||||||||||||||||||||||||||
| 2023 | 2022 | 2021 | 2023 vs. 2022 | |||||||||||||||||||||||||||||
| (in thousands, except percentages) | ||||||||||||||||||||||||||||||||
| Cost of revenues | $ | 19,715,368 | $ | 19,168,285 | $ | 17,332,683 | $ | 547,083 | 3 | % | ||||||||||||||||||||||
| As a percentage of revenues | 58 | % | 61 | % | 58 | % |
The increase in cost of revenues for the year ended December 31, 2023 as compared to the year ended December 31, 2022 was due to a $171 million increase in content amortization relating to our existing and new content, coupled with a $376 million increase in other cost of revenues primarily due to an increase in expenses directly associated with the acquisition, licensing and production of content.
Marketing
Marketing expenses consist primarily of advertising expenses and certain payments made to our marketing and advertising sales partners, including consumer electronics ("CE") manufacturers, multichannel video programming distributors ("MVPDs"), mobile operators and ISPs. Advertising expenses include promotional activities such as digital and television advertising. Marketing expenses also include payroll, stock-based compensation, facilities, and other related expenses for personnel that support sales and marketing activities.
| Year Ended December 31, | Change | |||||||||||||||||||||||||||||||
| 2023 | 2022 | 2021 | 2023 vs. 2022 | |||||||||||||||||||||||||||||
| (in thousands, except percentages) | ||||||||||||||||||||||||||||||||
| Marketing | $ | 2,657,883 | $ | 2,530,502 | $ | 2,545,146 | $ | 127,381 | 5 | % | ||||||||||||||||||||||
| As a percentage of revenues | 8 | % | 8 | % | 9 | % |
The increase in marketing expenses for the year ended December 31, 2023 as compared to the year ended December 31, 2022 was primarily due to a $146 million increase in advertising expenses and a $21 million increase in personnel-related costs, partially offset by a $39 million decrease in payments to our marketing partners.
Technology and Development
Technology and development expenses consist primarily of payroll, stock-based compensation, facilities, and other related expenses for technology personnel responsible for making improvements to our service offerings, including testing, maintaining and modifying our user interface, our recommendations, merchandising and infrastructure. Technology and development expenses also include costs associated with general use computer hardware and software.
| Year Ended December 31, | Change | |||||||||||||||||||||||||||||||
| 2023 | 2022 | 2021 | 2023 vs. 2022 | |||||||||||||||||||||||||||||
| (in thousands, except percentages) | ||||||||||||||||||||||||||||||||
| Technology and development | $ | 2,675,758 | $ | 2,711,041 | $ | 2,273,885 | $ | (35,283) | (1) | % | ||||||||||||||||||||||
| As a percentage of revenues | 8 | % | 9 | % | 8 | % |
Technology and development expenses for the year ended December 31, 2023 as compared to the year ended December 31, 2022 remained relatively flat.
General and Administrative
General and administrative expenses consist of payroll, stock-based compensation, facilities, and other related expenses for corporate personnel. General and administrative expenses also include professional fees and other general corporate expenses.
| Year Ended December 31, | Change | |||||||||||||||||||||||||||||||
| 2023 | 2022 | 2021 | 2023 vs. 2022 | |||||||||||||||||||||||||||||
| (in thousands, except percentages) | ||||||||||||||||||||||||||||||||
| General and administrative | $ | 1,720,285 | $ | 1,572,891 | $ | 1,351,621 | $ | 147,394 | 9 | % | ||||||||||||||||||||||
| As a percentage of revenues | 5 | % | 5 | % | 5 | % |
The increase in general and administrative expenses for the year ended December 31, 2023 as compared to the year ended December 31, 2022 was primarily due to a $82 million increase in third-party expenses and a $78 million increase in personnel-related costs.
Interest Expense
Interest expense consists primarily of the interest associated with our outstanding debt obligations, including the amortization of debt issuance costs. See Note 6 Debt in the accompanying notes to our consolidated financial statements for further detail on our debt obligations.
| Year Ended December 31, | Change | |||||||||||||||||||||||||||||||
| 2023 | 2022 | 2021 | 2023 vs. 2022 | |||||||||||||||||||||||||||||
| (in thousands, except percentages) | ||||||||||||||||||||||||||||||||
| Interest expense | $ | 699,826 | $ | 706,212 | $ | 765,620 | $ | (6,386) | (1) | % | ||||||||||||||||||||||
| As a percentage of revenues | 2 | % | 2 | % | 3 | % |
Interest expense for the year ended December 31, 2023 consisted primarily of $698 million of interest on our Notes. Interest expense for the year ended December 31, 2023 as compared to the year ended December 31, 2022 remained relatively flat.
Interest and Other Income (Expense)
Interest and other income (expense) consists primarily of foreign exchange gains and losses on foreign currency denominated balances and interest earned on cash, cash equivalents and short-term investments.
| Year Ended December 31, | Change | |||||||||||||||||||||||||||||||
| 2023 | 2022 | 2021 | 2023 vs. 2022 | |||||||||||||||||||||||||||||
| (in thousands, except percentages) | ||||||||||||||||||||||||||||||||
| Interest and other income (expense) | $ | (48,772) | $ | 337,310 | $ | 411,214 | $ | (386,082) | (114) | % | ||||||||||||||||||||||
| As a percentage of revenues | — | % | 1 | % | 1 | % |
Interest and other income (expense) decreased primarily due to foreign exchange losses of $293 million for the year ended December 31, 2023 as compared to a gain of $282 million for the year ended December 31, 2022. The foreign exchange loss in the year ended December 31, 2023 was primarily driven by the non-cash loss of $176 million from the remeasurement of our Senior Notes denominated in euros, coupled with the remeasurement of cash and content liability positions in currencies other than the functional currencies. The foreign exchange gain in the year ended December 31, 2022 was primarily driven by the non-cash $353 million gain from the remeasurement of our Senior Notes denominated in euros, partially offset by the remeasurement of cash and content liability positions in currencies other than the functional currencies. The change in foreign currency gains and losses was partially offset by a $221 million increase in interest income earned due to higher average interest rates and investment balances for the year ended December 31, 2023 as compared to the year ended December 31, 2022.
Provision for Income Taxes
| Year Ended December 31, | Change | |||||||||||||||||||||||||||||||
| 2023 | 2022 | 2021 | 2023 vs. 2022 | |||||||||||||||||||||||||||||
| (in thousands, except percentages) | ||||||||||||||||||||||||||||||||
| Provision for income taxes | $ | 797,415 | $ | 772,005 | $ | 723,875 | $ | 25,410 | 3 | % | ||||||||||||||||||||||
| Effective tax rate | 13 | % | 15 | % | 12 | % |
The decrease in our effective tax rate for the year ended December 31, 2023 as compared to the year ended December 31, 2022 is primarily due to a decrease in foreign taxes. See Note 10 Income Taxes to the consolidated financial statements for further information regarding income taxes.
Liquidity and Capital Resources
| As of December 31, | Change | |||||||||||||||||||
| 2023 | 2022 | 2023 vs. 2022 | ||||||||||||||||||
| (in thousands, except percentages) | ||||||||||||||||||||
| Cash, cash equivalents, restricted cash and short-term investments | $ | 7,139,488 | $ | 6,081,858 | $ | 1,057,630 | 17 | % | ||||||||||||
| Short-term and long-term debt | 14,543,261 | 14,353,076 | 190,185 | 1 | % |
Cash, cash equivalents, restricted cash and short-term investments increased $1,058 million in the year ended December 31, 2023 primarily due to cash provided by operations, partially offset by the repurchase of stock.
Debt, net of debt issuance costs, increased $190 million primarily due to the remeasurement of our euro-denominated notes. The amount of principal and interest due in the next twelve months is $1,077 million. The amount of principal and interest due beyond the next twelve months is $16,662 million. As of December 31, 2023, no amounts had been borrowed under our $1 billion Revolving Credit Agreement. See Note 6 Debt in the accompanying notes to our consolidated financial statements.
We anticipate that our future capital needs from the debt market will be more limited compared to prior years. Our ability to obtain this or any additional financing that we may choose or need, including for potential strategic acquisitions and investments, will depend on, among other things, our development efforts, business plans, operating performance, and the condition of the capital markets at the time we seek financing. We may not be able to obtain such financing on terms acceptable to us or at all. If we raise additional funds through the issuance of equity or debt securities, those securities may have rights, preferences or privileges senior to the rights of our common stock, and our stockholders may experience dilution.
In March 2021, our Board of Directors authorized the repurchase of up to $5 billion of our common stock, with no expiration date, and in September 2023, the Board of Directors increased the share repurchase authorization by an additional $10 billion, also with no expiration date. Stock repurchases may be effected through open market repurchases in compliance with Rule 10b-18 under the Exchange Act, including through the use of trading plans intended to qualify under Rule 10b5-1 under the Exchange Act, privately-negotiated transactions, accelerated stock repurchase plans, block purchases, or other similar purchase techniques and in such amounts as management deems appropriate. We are not obligated to repurchase any specific number of shares, and the timing and actual number of shares repurchased will depend on a variety of factors, including our stock price, general economic, business and market conditions, and alternative investment opportunities. We may discontinue any repurchases of our common stock at any time without prior notice. In the fiscal year ended December 31, 2023, the Company repurchased 14,513,790 shares of common stock for an aggregate amount of $6,045 million. As of December 31, 2023, $8.4 billion remains available for repurchases.
Our primary uses of cash include the acquisition, licensing and production of content, marketing programs, streaming delivery and personnel-related costs, as well as strategic acquisitions and investments. Cash payment terms for non-original content have historically been in line with the amortization period. Investments in original content, and in particular content that we produce and own, require more cash upfront relative to licensed content. For example, production costs are paid as the content is created, well in advance of when the content is available on the service and amortized. We expect to continue to significantly invest in global content, particularly in original content, which will impact our liquidity. We currently anticipate that cash flows from operations, available funds and access to financing sources, including our revolving credit facility, will continue to be sufficient to meet our cash needs for the next twelve months and beyond.
Our material cash requirements from known contractual and other obligations primarily relate to our content, debt and lease obligations. As of December 31, 2023, the expected timing of those payments are as follows:
| Contractual obligations (in thousands): | Total | Next 12 Months | Beyond 12 Months | |||||||||||||||||
| Content obligations (1) | $ | 21,713,349 | $ | 10,328,923 | $ | 11,384,426 | ||||||||||||||
| Debt (2) | 17,739,159 | 1,077,261 | 16,661,898 | |||||||||||||||||
| Operating lease obligations (3) | 3,088,899 | 513,506 | 2,575,393 | |||||||||||||||||
| Total | $ | 42,541,407 | $ | 11,919,690 | $ | 30,621,717 |
(1)As of December 31, 2023, content obligations were comprised of $4.5 billion included in "Current content liabilities" and $2.6 billion of "Non-current content liabilities" on the Consolidated Balance Sheets and $14.6 billion of obligations that are not reflected on the Consolidated Balance Sheets as they did not then meet the criteria for recognition.
Content obligations include amounts related to the acquisition, licensing and production of content. An obligation for the production of content includes non-cancelable commitments under creative talent and employment agreements and other production related commitments. An obligation for the acquisition and licensing of content is incurred at the time we enter into an agreement to obtain future titles. Once a title becomes available, a content liability is recorded on the Consolidated Balance Sheets. Certain agreements include the obligation to license rights for unknown future titles, the ultimate quantity and/or fees for which are not yet determinable as of the reporting date. Traditional film output deals, or certain TV series license agreements where the number of seasons to be aired is unknown, are examples of these types of agreements. The contractual obligations table above does not include any estimated obligation for the unknown future titles, payment for which could range from less than one year to more than five years. However, these unknown obligations are expected to be significant and we believe could include approximately $1 billion to $4 billion over the next three years, with the payments for the vast majority of such amounts expected to occur after the next twelve months. The foregoing range is based on considerable management judgments and the actual amounts may differ. Once we know the title that we will receive and the license fees, we include the amount in the contractual obligations table above.
(2)Debt obligations include our Notes consisting of principal and interest payments. See Note 6 Debt in the accompanying notes to our consolidated financial statements for further details.
(3)Operating lease obligations are comprised of operating lease liabilities included in "Accrued expenses and other liabilities" and "Other non-current liabilities" on the Consolidated Balance Sheets, inclusive of imputed interest. Operating lease obligations also include additional obligations that are not reflected on the Consolidated Balance Sheets as they did not meet the criteria for recognition. As of December 31, 2023, the Company has additional operating leases for real estate that have not yet commenced of $343 million which has been included above. See Note 5 Balance Sheet Components in the accompanying notes to our consolidated financial statements for further details regarding leases.
In addition, as of December 31, 2023, we had gross unrecognized tax benefits of $327 million, of which $221 million was classified in “Other non-current liabilities" in the Consolidated Balance Sheets. At this time, an estimate of the range of reasonably possible adjustments to the balance of unrecognized tax benefits cannot be made.
Free Cash Flow
We define free cash flow as cash provided by (used in) operating activities less purchases of property and equipment and change in other assets. We believe free cash flow is an important liquidity metric because it measures, during a given period, the amount of cash generated that is available to repay debt obligations, make strategic acquisitions and investments and for certain other activities like stock repurchases. Free cash flow is considered a non-GAAP financial measure and should not be considered in isolation of, or as a substitute for, net income, operating income, net cash provided by operating activities, or any other measure of financial performance or liquidity presented in accordance with GAAP.
In assessing liquidity in relation to our results of operations, we compare free cash flow to net income, noting that the major recurring differences are the timing impact between content payments and amortization, non-cash stock-based compensation expense, non-cash remeasurement gain/loss on our euro-denominated debt, excess property and equipment purchases over depreciation, and other working capital differences. Working capital differences primarily include deferred revenue, taxes and semi-annual interest payments on our outstanding debt. Our receivables from members generally settle quickly.
| Year Ended December 31, | Change | |||||||||||||||||||||||||
| 2023 | 2022 | 2021 | 2023 vs. 2022 | |||||||||||||||||||||||
| (in thousands) | ||||||||||||||||||||||||||
| Net cash provided by operating activities | $ | 7,274,301 | $ | 2,026,257 | $ | 392,610 | $ | 5,248,044 | 259 | % | ||||||||||||||||
| Net cash provided by (used in) investing activities | 541,751 | (2,076,392) | (1,339,853) | 2,618,143 | 126 | % | ||||||||||||||||||||
| Net cash used in financing activities | (5,950,803) | (664,254) | (1,149,776) | 5,286,549 | 796 | % | ||||||||||||||||||||
| Non-GAAP reconciliation of free cash flow: | ||||||||||||||||||||||||||
| Net cash provided by operating activities | 7,274,301 | 2,026,257 | 392,610 | 5,248,044 | 259 | % | ||||||||||||||||||||
| Purchases of property and equipment | (348,552) | (407,729) | (524,585) | (59,177) | (15) | % | ||||||||||||||||||||
| Change in other assets | — | — | (26,919) | — | — | % | ||||||||||||||||||||
| Free cash flow | $ | 6,925,749 | $ | 1,618,528 | $ | (158,894) | $ | 5,307,221 | 328 | % |
Net cash provided by operating activities increased $5,248 million from the year ended December 31, 2022 to $7,274 million for the year ended December 31, 2023. The increase in net cash provided by operating activities was primarily driven by a decrease in payments for content assets, coupled with a $916 million or 20% increase in net income and favorable changes in working capital. The payments for content assets decreased $3,519 million, from $16,660 million to $13,140 million, or 21%.
Net cash provided by (used in) investing activities increased $2,618 million from the year ended December 31, 2022 to $542 million for the year ended December 31, 2023. The increase in net cash provided by (used in) investing activities is primarily due to proceeds from the maturities of short-term investments, net of purchases, and there being no acquisitions in the year ended December 31, 2023, as compared to acquisitions for an aggregate amount of $757 million in the year ended December 31, 2022.
Net cash used in financing activities increased $5,287 million from the year ended December 31, 2022 to $5,951 million for the year ended December 31, 2023. The increase in net cash used in financing activities is primarily due to repurchases of common stock for an aggregate amount of $6,045 million in the year ended December 31, 2023, as compared to no repurchases of common stock in the year ended December 31, 2022, partially offset by the absence of debt maturities in the year ended December 31, 2023 as compared to the repayment upon maturity of the $700 million aggregate principal amount of our 5.500% Senior Notes in February 2022.
Free cash flow was $1,518 million higher than net income for the year ended December 31, 2023 primarily due to $1,057 million of amortization expense exceeding cash payments for content assets, $339 million of non-cash stock-based compensation expense, $176 million of non-cash remeasurement loss on our euro-denominated debt, and $47 million in other favorable working capital differences, partially offset by $101 million of property and equipment purchases exceeding depreciation expense.
Indemnifications
The information set forth under Note 8 Commitments and Contingencies in the accompanying notes to our consolidated financial statements included in Part II, Item 8, "Financial Statements and Supplementary Data" of this Annual Report on Form 10-K is incorporated herein by reference.
Critical Accounting Estimates
The preparation of consolidated financial statements in conformity with accounting principles generally accepted in the United States of America requires management to make estimates and assumptions that affect the reported amounts of assets and liabilities, disclosures of contingent assets and liabilities at the date of the financial statements, and the reported amounts of revenues and expenses during the reported periods. The Securities and Exchange Commission ("SEC") has defined a company’s critical accounting policies as the ones that are most important to the portrayal of a company’s financial condition and results of operations, and which require a company to make its most difficult and subjective judgments. Based on this definition, we have identified the critical accounting policies and judgments addressed below. We base our estimates on historical experience and on various other assumptions that we believe to be reasonable under the circumstances. Actual results may differ from these estimates.
Content
We acquire, license and produce content, including original programming, in order to offer our members unlimited viewing of video entertainment. The content licenses are for a fixed fee and specific windows of availability. Payment terms for certain content licenses and the production of content require more upfront cash payments relative to the amortization expense. Payments for content, including additions to content assets and the changes in related liabilities, are classified within "Net cash provided by operating activities" on the Consolidated Statements of Cash Flows.
We recognize content assets (licensed and produced) as "Content assets, net" on the Consolidated Balance Sheets. For licensed content, we capitalize the fee per title and record a corresponding liability at the gross amount of the liability when the license period begins, the cost of the title is known and the title is accepted and available for streaming. For produced content, we capitalize costs associated with the production, including development costs, direct costs and production overhead. Participations and residuals are expensed in line with the amortization of production costs.
Based on factors including historical and estimated viewing patterns, we amortize the content assets (licensed and produced) in “Cost of revenues” on the Consolidated Statements of Operations over the shorter of each title's contractual window of availability or estimated period of use or ten years, beginning with the month of first availability. The amortization is on an accelerated basis, as we typically expect more upfront viewing, and film amortization is more accelerated than TV series amortization. On average, over 90% of a licensed or produced content asset is expected to be amortized within four years
after its month of first availability. We review factors that impact the amortization of the content assets on a regular basis. Our estimates related to these factors require considerable management judgment.
In the normal course of business, we, or a third-party producing content on our behalf, may qualify for tax incentives through eligible spend on productions. The accounting for tax incentives is dependent on the particular type of incentive, including the nature of the benefit and the location the incentive is earned. In general, tax incentives are realized as cash receipts and may be received prior to or after a title launches on our service. Upon a title’s launch, any amounts we are eligible for through qualified production spend but have not received, are recognized in “Other current assets” or “Other non-current assets” on the Consolidated Balance Sheets as receivables. Tax incentives are generally accounted for as a reduction to the cost basis of content assets (presented in “Content assets, net”) and reduce content amortization over the life of the title (as presented in “Cost of revenues”) on the Consolidated Statements of Operations.
Our business model is subscription based as opposed to a model generating revenues at a specific title level. Content assets (licensed and produced) are predominantly monetized as a group and therefore are reviewed at a group level when an event or change in circumstances indicates a change in the expected usefulness of the content or that the fair value may be less than unamortized cost. To date, we have not identified any such event or changes in circumstances. If such changes are identified in the future, these aggregated content assets will be stated at the lower of unamortized cost or fair value. In addition, unamortized costs for assets that have been, or are expected to be, abandoned are written off.
Income Taxes
We record a provision for income taxes for the anticipated tax consequences of our reported results of operations using the asset and liability method. Deferred income taxes are recognized by applying enacted statutory tax rates applicable to future years to differences between the financial statement carrying amounts of existing assets and liabilities and their respective tax bases as well as net operating loss and tax credit carryforwards. The effect on deferred tax assets and liabilities of a change in tax rates is recognized in income in the period that includes the enactment date. The measurement of deferred tax assets is reduced, if necessary, by a valuation allowance when it is more likely than not they will not be realized.
Although we believe our assumptions, judgments and estimates are reasonable, changes in tax laws or our interpretation of tax laws and the resolution of any tax audits could significantly impact the amounts provided for income taxes in our consolidated financial statements.
In evaluating our ability to recover our deferred tax assets, in full or in part, we consider all available positive and negative evidence, including our past operating results, and our forecast of future earnings, future taxable income and prudent and feasible tax planning strategies. The assumptions utilized in determining future taxable income require significant judgment and are consistent with the plans and estimates we are using to manage the underlying business. Actual operating results in future years could differ from our current assumptions, judgments and estimates.
We do not recognize certain tax benefits from uncertain tax positions within the provision for income taxes. We may recognize a tax benefit only if it is more likely than not the tax position will be sustained on examination by the taxing authorities, based on the technical merits of the position. The tax benefits recognized in the financial statements from such positions are then measured based on the largest benefit that has a greater than 50% likelihood of being realized upon settlement. Due to uncertainties in any tax audit outcome, our estimates of the ultimate settlement of our unrecognized tax positions may change and the actual tax benefits may differ significantly from the estimates.
See Note 10 Income Taxes to the consolidated financial statements for further information regarding income taxes.
Recent Accounting Pronouncements
The information set forth under Note 1 to the consolidated financial statements under the caption “Basis of Presentation and Summary of Significant Accounting Policies” is incorporated herein by reference.
Item 7A. Quantitative and Qualitative Disclosures about Market Risk
We are exposed to market risks related to interest rate changes and the corresponding changes in the market values of our debt and foreign currency fluctuations.
Interest Rate Risk
At December 31, 2023, our cash equivalents and short-term investments were generally invested in money market funds and time deposits. Interest paid on such funds fluctuates with the prevailing interest rate.
As of December 31, 2023, we had $14.6 billion of debt, consisting of fixed rate unsecured debt in fourteen tranches due between 2024 and 2030. Refer to Note 6 to the consolidated financial statements for details about all issuances. The fair value
of our debt will fluctuate with movements of interest rates, increasing in periods of declining rates of interest and declining in periods of increasing rates of interest. The fair value of our debt will also fluctuate based on changes in foreign currency rates, as discussed below.
Foreign Currency Risk
We operate our business globally and transact in multiple currencies. Currencies denominated in other than the U.S. dollar accounted for 57% of revenue and 28% of operating expenses for the year ended December 31, 2023. We therefore have foreign currency risk related to these currencies, with our largest exposures being the euro, the British pound, the Brazilian real, the Canadian dollar, and the Mexican peso.
Accordingly, volatility in exchange rates, and in particular a weakening of foreign currencies relative to the U.S. dollar may negatively affect our revenue and operating income as expressed in U.S. dollars. For the year ended December 31, 2023, our revenues would have been approximately $597 million higher had foreign currency exchange rates remained constant with those in the same period of 2022. See Part II, Item 7, "Management’s Discussion and Analysis of Financial Condition and Results of Operations" for further information regarding our non-GAAP financial measure of constant currency.
In the year ended December 31, 2023, we entered into foreign exchange forward contracts to mitigate fluctuations in forecasted U.S. dollar-equivalent revenues occurring in January 2024 and beyond from changes in foreign currency exchange rates. These contracts may reduce, but do not entirely eliminate, the effect of foreign currency exchange fluctuations, and we may choose not to hedge certain exposures. We designate these contracts as cash flow hedges of forecasted foreign currency revenue and initially record the gains or losses on these derivative instruments as a component of accumulated other comprehensive income (“AOCI") and reclassify the amounts into “Revenues” on the Consolidated Statements of Operations in the same period the forecasted transaction affects earnings. If the U.S dollar weakened by 10% as of December 31, 2023, the amount recorded in AOCI related to our foreign exchange contracts, before taxes, would have been approximately $958 million lower. This adverse change in AOCI would be expected to offset a corresponding favorable foreign currency change in the underlying forecasted revenues when recognized in earnings.
In the year ended December 31, 2023, we also entered into foreign exchange forward contracts to mitigate fluctuations in forecasted and firmly committed U.S. dollar-equivalent transactions related to the licensing and production of content assets occurring in January 2024 and beyond from changes in foreign currency exchange rates. These contracts may reduce, but do not entirely eliminate, the effect of foreign currency exchange fluctuations, and we may choose not to hedge certain exposures. We designate these contracts as cash flow hedges and initially record the gains or losses on these derivative instruments as a component of AOCI and reclassify the amounts into “Cost of Revenues” to offset the hedged exposures as they affect earnings, which occurs as the underlying hedged content assets are amortized. If the U.S dollar strengthened by 10% as of December 31, 2023, the amount recorded in AOCI related to our foreign exchange contracts, before taxes, would have been approximately $71 million lower. This adverse change in AOCI would be expected to offset a corresponding favorable foreign currency change in the underlying exposures when recognized in earnings.
We have also experienced and will continue to experience fluctuations in our net income as a result of gains (losses) on the settlement and the remeasurement of monetary assets and liabilities denominated in currencies that are not the functional currency. In the year ended December 31, 2023, we recognized a $293 million foreign exchange loss primarily due to the non-cash remeasurement of our Senior Notes denominated in euros and the remeasurement of cash and content liabilities denominated in currencies other than the functional currencies.
In addition, the effect of exchange rate changes on cash, cash equivalents and restricted cash as disclosed on the Consolidated Statements of Cash Flows in the year ended December 31, 2023 was an increase of $83 million.
Item 8. Financial Statements and Supplementary Data
The consolidated financial statements and accompanying notes listed in Part IV, Item 15(a)(1) of this Annual Report on Form 10-K are included immediately following Part IV hereof and incorporated by reference herein.
Item 9. Changes in and Disagreements with Accountants on Accounting and Financial Disclosure
None.
Item 9A. Controls and Procedures
**(a)**Evaluation of Disclosure Controls and Procedures
Our management, with the participation of our co-Chief Executive Officers and Chief Financial Officer, evaluated the effectiveness of our disclosure controls and procedures (as defined in Rules 13a-15(e) and 15d-15(e) under the Exchange Act) as of the end of the period covered by this Annual Report on Form 10-K. Based on that evaluation, our co-Chief Executive Officers and Chief Financial Officer concluded that our disclosure controls and procedures as of the end of the period covered by this Annual Report on Form 10-K were effective in providing reasonable assurance that information required to be disclosed by us in reports that we file or submit under the Exchange Act, is recorded, processed, summarized and reported within the time periods specified in the Securities and Exchange Commission’s rules and forms, and that such information is accumulated and communicated to our management, including our co-Chief Executive Officers and Chief Financial Officer, as appropriate, to allow timely decisions regarding required disclosures.
Our management, including our co-Chief Executive Officers and Chief Financial Officer, does not expect that our disclosure controls and procedures or our internal controls will prevent all error and all fraud. A control system, no matter how well conceived and operated, can provide only reasonable, not absolute, assurance that the objectives of the control system are met. Further, the design of a control system must reflect the fact that there are resource constraints, and the benefits of controls must be considered relative to their costs. Because of the inherent limitations in all control systems, no evaluation of controls can provide absolute assurance that all control issues and instances of fraud, if any, within Netflix have been detected.
**(b)**Management’s Annual Report on Internal Control Over Financial Reporting
Our management is responsible for establishing and maintaining adequate internal control over financial reporting (as defined in Rule 13a-15(f) of the Exchange Act). Our management assessed the effectiveness of our internal control over financial reporting as of December 31, 2023. In making this assessment, our management used the criteria set forth by the Committee of Sponsoring Organizations of the Treadway Commission (“COSO”) in Internal Control—Integrated Framework (2013 framework). Based on our assessment under the framework in Internal Control—Integrated Framework (2013 framework), our management concluded that our internal control over financial reporting was effective as of December 31, 2023. The effectiveness of our internal control over financial reporting as of December 31, 2023 has been audited by Ernst & Young LLP, an independent registered public accounting firm, as stated in their report that is included herein.
**(c)**Changes in Internal Control Over Financial Reporting
There was no change in our internal control over financial reporting that occurred during the quarter ended December 31, 2023 that has materially affected, or is reasonably likely to materially affect, our internal control over financial reporting.
Report of Independent Registered Public Accounting Firm
To the Stockholders and the Board of Directors of Netflix, Inc.
Opinion on Internal Control Over Financial Reporting
We have audited Netflix, Inc.’s internal control over financial reporting as of December 31, 2023, based on criteria established in Internal Control-Integrated Framework issued by the Committee of Sponsoring Organizations of the Treadway Commission (2013 framework) (the COSO criteria). In our opinion, Netflix, Inc. (the Company) maintained, in all material respects, effective internal control over financial reporting as of December 31, 2023, based on the COSO criteria.
We also have audited, in accordance with the standards of the Public Company Accounting Oversight Board (United States) (PCAOB), the consolidated balance sheets of the Company as of December 31, 2023 and 2022, the related consolidated statements of operations, comprehensive income, stockholders’ equity and cash flows for each of the three years in the period ended December 31, 2023, and the related notes and our report dated January 26, 2024 expressed an unqualified opinion thereon.
Basis for Opinion
The Company’s management is responsible for maintaining effective internal control over financial reporting and for its assessment of the effectiveness of internal control over financial reporting included in the accompanying Management’s Annual Report on Internal Control Over Financial Reporting. Our responsibility is to express an opinion on the Company’s internal control over financial reporting based on our audit. We are a public accounting firm registered with the PCAOB and are required to be independent with respect to the Company in accordance with the U.S. federal securities laws and the applicable rules and regulations of the Securities and Exchange Commission and the PCAOB.
We conducted our audit in accordance with the standards of the PCAOB. Those standards require that we plan and perform the audit to obtain reasonable assurance about whether effective internal control over financial reporting was maintained in all material respects.
Our audit included obtaining an understanding of internal control over financial reporting, assessing the risk that a material weakness exists, testing and evaluating the design and operating effectiveness of internal control based on the assessed risk, and performing such other procedures as we considered necessary in the circumstances. We believe that our audit provides a reasonable basis for our opinion.
Definition and Limitations of Internal Control Over Financial Reporting
A company’s internal control over financial reporting is a process designed to provide reasonable assurance regarding the reliability of financial reporting and the preparation of financial statements for external purposes in accordance with generally accepted accounting principles. A company’s internal control over financial reporting includes those policies and procedures that (1) pertain to the maintenance of records that, in reasonable detail, accurately and fairly reflect the transactions and dispositions of the assets of the company; (2) provide reasonable assurance that transactions are recorded as necessary to permit preparation of financial statements in accordance with generally accepted accounting principles, and that receipts and expenditures of the company are being made only in accordance with authorizations of management and directors of the company; and (3) provide reasonable assurance regarding prevention or timely detection of unauthorized acquisition, use, or disposition of the company’s assets that could have a material effect on the financial statements.
Because of its inherent limitations, internal control over financial reporting may not prevent or detect misstatements. Also, projections of any evaluation of effectiveness to future periods are subject to the risk that controls may become inadequate because of changes in conditions, or that the degree of compliance with the policies or procedures may deteriorate.
| /s/ Ernst & Young LLP | |||||
| San Jose, California | |||||
| January 26, 2024 |
Item 9B. Other Information
Rule 10b5-1 Trading Plans
The adoption or termination of contracts, instructions or written plans for the purchase or sale of our securities by our Section 16 officers and directors for the three months ended December 31, 2023, each of which is intended to satisfy the affirmative defense conditions of Rule 10b5-1(c) under the Exchange Act (“Rule 10b5-1 Plan”), were as follows:
| Name | Title | Action | Date Adopted | Expiration Date | Aggregate # of Securities to be Purchased/Sold | |||||||||||||||||||||||||||
| Ted Sarandos (1) | Co-CEO and Director | Adoption | 11/10/2023 | 2/7/2025 | 68,957 |
| (1) Ted Sarandos, co-CEO and a member of the Board of Directors, entered into a pre-arranged stock trading plan pursuant to Rule 10b5-1 on November 10, 2023. Mr. Sarandos' plan provides for the potential exercise of vested stock options and the associated sale of up to 68,957 shares of Netflix common stock. The plan expires on February 7, 2025, or upon the earlier completion of all authorized transactions under the plan. |
Other than those disclosed above, none of our directors or officers adopted or terminated a "non-Rule 10b5-1 trading arrangement" as defined in Item 408 of Regulation S-K.
Item 9C. Disclosure Regarding Foreign Jurisdictions that Prevent Inspections
Item 10. Directors, Executive Officers and Corporate Governance
Information regarding our directors and executive officers is incorporated by reference from the information contained under the sections “Proposal One: Election of Directors,” and “Code of Ethics” in our Proxy Statement for the Annual Meeting of Stockholders.
Item 11. Executive Compensation
Information required by this item is incorporated by reference from information contained under the sections “Compensation Discussion and Analysis” and “Compensation of Named Executive Officers and Other Matters” in our Proxy Statement for the Annual Meeting of Stockholders.
Item 12. Security Ownership of Certain Beneficial Owners and Management and Related Stockholder Matters
Information required by this item is incorporated by reference from information contained under the sections “Security Ownership of Certain Beneficial Owners and Management” and “Equity Compensation Plan Information” in our Proxy Statement for the Annual Meeting of Stockholders.
Item 13. Certain Relationships and Related Transactions, and Director Independence
Information required by this item is incorporated by reference from information contained under the section “Certain Relationships and Related Transactions” and “Director Independence” in our Proxy Statement for the Annual Meeting of Stockholders.
Item 14. Principal Accountant Fees and Services
Information with respect to principal independent registered public accounting firm fees and services is incorporated by reference from the information under the caption “Proposal Two: Ratification of Appointment of Independent Registered Public Accounting Firm” in our Proxy Statement for the Annual Meeting of Stockholders.
PART IV
Item 15. Exhibits, Financial Statement Schedules
(a)The following documents are filed as part of this Annual Report on Form 10-K:
(1)Financial Statements:
The financial statements are filed as part of this Annual Report on Form 10-K under “Item 8. Financial Statements and Supplementary Data.”
(2)Financial Statement Schedules:
The financial statement schedules are omitted as they are either not applicable or the information required is presented in the financial statements and notes thereto under “Item 8. Financial Statements and Supplementary Data.”
(3)Exhibits:
See Exhibit Index immediately following the signature page of this Annual Report on Form 10-K.
Item 16. Form 10–K Summary
None.
NETFLIX, INC.
INDEX TO FINANCIAL STATEMENTS
Report of Independent Registered Public Accounting Firm
To the Stockholders and the Board of Directors of Netflix, Inc.
Opinion on the Financial Statements
We have audited the accompanying consolidated balance sheets of Netflix, Inc. (the Company) as of December 31, 2023 and 2022, the related consolidated statements of operations, comprehensive income, stockholders’ equity and cash flows for each of the three years in the period ended December 31, 2023, and the related notes (collectively referred to as the “consolidated financial statements"). In our opinion, the consolidated financial statements present fairly, in all material respects, the financial position of the Company at December 31, 2023 and 2022, and the results of its operations and its cash flows for each of the three years in the period ended December 31, 2023, in conformity with U.S. generally accepted accounting principles.
We also have audited, in accordance with the standards of the Public Company Accounting Oversight Board (United States) (PCAOB), the Company’s internal control over financial reporting as of December 31, 2023, based on criteria established in Internal Control-Integrated Framework issued by the Committee of Sponsoring Organizations of the Treadway Commission (2013 framework), and our report dated January 26, 2024 expressed an unqualified opinion thereon.
Basis for Opinion
These financial statements are the responsibility of the Company’s management. Our responsibility is to express an opinion on the Company’s financial statements based on our audits. We are a public accounting firm registered with the PCAOB and are required to be independent with respect to the Company in accordance with the U.S. federal securities laws and the applicable rules and regulations of the Securities and Exchange Commission and the PCAOB.
We conducted our audits in accordance with the standards of the PCAOB. Those standards require that we plan and perform the audit to obtain reasonable assurance about whether the financial statements are free of material misstatement, whether due to error or fraud. Our audits included performing procedures to assess the risks of material misstatement of the financial statements, whether due to error or fraud, and performing procedures that respond to those risks. Such procedures included examining, on a test basis, evidence regarding the amounts and disclosures in the financial statements. Our audits also included evaluating the accounting principles used and significant estimates made by management, as well as evaluating the overall presentation of the financial statements. We believe that our audits provide a reasonable basis for our opinion.
Critical Audit Matter
The critical audit matter communicated below is a matter arising from the current period audit of the financial statements that was communicated or required to be communicated to the audit committee and that: (1) relates to accounts or disclosures that are material to the financial statements and (2) involved our especially challenging, subjective or complex judgments. The communication of the critical audit matter does not alter in any way our opinion on the consolidated financial statements, taken as a whole, and we are not, by communicating the critical audit matter below, providing a separate opinion on the critical audit matter or on the accounts or disclosures to which it relates.
| Content Amortization | |||||
| Description of the Matter | As disclosed in Note 1 to the consolidated financial statements “Organization and Summary of Significant Accounting Policies”, the Company acquires, licenses and produces content, including original programming (“Content”). The Company amortizes Content based on factors including historical and estimated viewing patterns. Auditing the amortization of the Company’s Content is complex and subjective due to the judgmental nature of amortization which is based on an estimate of future viewing patterns. Estimated viewing patterns are based on historical and forecasted viewing. If actual viewing patterns differ from these estimates, the pattern and/or period of amortization would be changed and could affect the timing of recognition of content amortization. | ||||
| How We Addressed the Matter in Our Audit | We obtained an understanding, evaluated the design and tested the operating effectiveness of controls over the content amortization process. For example, we tested controls over management’s review of the content amortization method and the significant assumptions, including the historical and forecasted viewing hour consumption, used to develop estimated viewing patterns. We also tested management’s controls to determine that the data used in the model was complete and accurate. To test content amortization, our audit procedures included, among others, evaluating the content amortization method, testing the significant assumptions used to develop the estimated viewing patterns and testing the completeness and accuracy of the underlying data. For example, we assessed management’s assumptions by comparing them to current viewing trends and current operating information including comparing previous estimates of viewing patterns to actual results. We also performed sensitivity analyses to evaluate the potential changes in the content amortization recorded that could result from changes in the assumptions. |
| /s/ Ernst & Young LLP | |||||
| We have served as the Company's auditor since 2012. | |||||
| San Jose, California | |||||
| January 26, 2024 |
NETFLIX, INC.
CONSOLIDATED STATEMENTS OF OPERATIONS
(in thousands, except per share data)
| Year ended December 31, | ||||||||||||||||||||
| 2023 | 2022 | 2021 | ||||||||||||||||||
| Revenues | $ | 33,723,297 | $ | 31,615,550 | $ | 29,697,844 | ||||||||||||||
| Cost of revenues | 19,715,368 | 19,168,285 | 17,332,683 | |||||||||||||||||
| Marketing | 2,657,883 | 2,53 |
Showing the first 8K of 144K characters. Open the full section