 filings.tools
Item 5. Market for Registrant’s Common Equity, Related Stockholder Matters and Issuer Purchases of Equity Securities
4K characters. Original on sec.gov · Markdown
Item 5. Market for Registrant’s Common Equity, Related Stockholder Matters and Issuer Purchases of Equity Securities
COMMON STOCK
We have 800,000,000 shares authorized at a $1 par value per share, of which 167,848,424 shares and 170,607,336 shares were issued and outstanding as of December 31, 2019 and 2018, respectively.
PREFERRED STOCK
We have 10,000,000 shares authorized at a $1 par value per share, of which no shares were issued and outstanding as of December 31, 2019 and 2018.
MARKET INFORMATION
Our common stock is listed on the New York Stock Exchange and trades under the symbol NOC.
HOLDERS
As of January 27, 2020, there were 21,374 common shareholders of record.
PURCHASES OF EQUITY SECURITIES BY THE ISSUER AND AFFILIATED PURCHASERS
The table below summarizes our repurchases of common stock during the three months ended December 31, 2019:
| Period | Total Number of Shares Purchased | Average Price Paid per Share**(1)** | Total Number of Shares Purchased as Part of Publicly Announced Plans or Programs | Approximate Dollar Value of Shares that May Yet Be Purchased under the Plans or Programs ($ in millions) | ||||||||||
| September 28, 2019 - October 25, 2019 | 216,962 | $ | 361.84 | 216,962 | $ | 3,553 | ||||||||
| October 26, 2019 - November 22, 2019 | 286,241 | 350.08 | 286,241 | 3,453 | ||||||||||
| November 23, 2019 - December 31, 2019 | 356,900 | 346.23 | 356,900 | 3,330 | ||||||||||
| Total | 860,103 | $ | 351.45 | 860,103 | $ | 3,330 |
| (1) | Includes commissions paid. |
Share repurchases take place from time to time, subject to market conditions and management’s discretion, in the open market or in privately negotiated transactions. The company retires its common stock upon repurchase and, in the periods presented, has not made any purchases of common stock other than in connection with these publicly announced repurchase programs.
See Note 3 to the consolidated financial statements for further information on our share repurchase programs.
-22-
NORTHROP GRUMMAN CORPORATION
STOCK PERFORMANCE GRAPH
Comparison of Cumulative Five Year Total Return
Among Northrop Grumman, the S&P 500 Index and the S&P Aerospace & Defense (A&D) Index
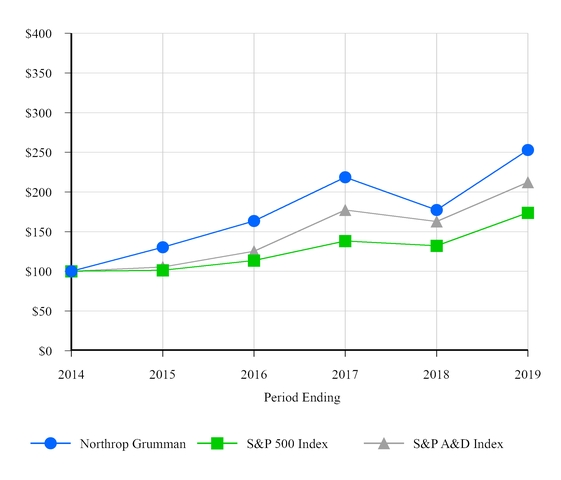
| • | Assumes $100 invested at the close of business on December 31, 2014, in Northrop Grumman Corporation common stock, Standard & Poor’s (S&P) 500 Index and the S&P Aerospace & Defense Index. |
| • | The cumulative total return assumes reinvestment of dividends. |
| • | The S&P Aerospace & Defense Index is comprised of Arconic, Inc., The Boeing Company, General Dynamics Corporation, Huntington Ingalls Industries Inc., L3Harris Technologies, Inc., Lockheed Martin Corporation, Northrop Grumman Corporation, Raytheon Company, Textron, Inc., TransDigm Group and United Technologies Corporation. |
| • | The total return is weighted according to market capitalization of each company at the beginning of each year. |
| • | This graph is not deemed to be “filed” with the U.S. Securities and Exchange Commission (SEC) or subject to the liabilities of Section 18 of the Securities Exchange Act of 1934 (the Exchange Act), and should not be deemed to be incorporated by reference into any of our prior or subsequent filings under the Securities Act of 1933 or the Exchange Act. |
-23-
NORTHROP GRUMMAN CORPORATION
Previous: Item 4. Mine Safety Disclosures · Next: Item 6. Selected Financial Data