 filings.tools
Item 1. Business
63K characters. Original on sec.gov · Markdown
Item 1. Business
General
NRG Energy, Inc., or NRG or the Company, is an energy company built on dynamic retail brands with diverse generation assets. NRG brings the power of energy to consumers by producing, selling and delivering electricity and related products and services in major competitive power markets in the U.S. in a manner that delivers value to all of NRG's stakeholders. NRG is perfecting the integrated model by balancing retail load with generation supply within its deregulated markets, while evolving to a customer-driven business. The Company sells energy, services, and innovative, sustainable products and services directly to retail customers under the names "NRG" and "Reliant" and other brand names owned by NRG supported by approximately 23,000(a) MW of generation as of December 31, 2018. NRG was incorporated as a Delaware corporation on May 29, 1992.
Strategy
NRG's strategy is to maximize stockholder value through the safe production and sale of reliable power to its customers in the markets served by the Company, while positioning the Company to provide innovative solutions to the end-use energy consumer. This strategy is designed to enable the Company to optimize the integrated model to generate predictable cash flow, significantly strengthen earnings and cost competitiveness, and lower risk and volatility. Sustainability is an integral piece of NRG's strategy and ties directly to business success, reduced risks and brand value.
To effectuate the Company’s strategy, NRG is focused on: (i) serving the energy needs of end-use residential, commercial and industrial customers in competitive markets through multiple brands and channels with a variety of retail energy products and services differentiated by innovative features, premium service, sustainability, and loyalty/affinity programs; (ii) deploying innovative and renewable energy solutions for consumers within its retail businesses; (iii) excellence in operating performance of its existing assets including optimal hedging of generation assets and retail load operations; and (iv) engaging in a proactive capital allocation plan within the dictates of prudent balance sheet management.
Transformation Plan
NRG is well underway in executing its Transformation Plan. The Company expects to fully implement the Transformation Plan by the end of 2020 with a significant portion completed in 2018. The three-part, three-year plan is comprised of the following targets and the Company's achievements towards such targets are as follows:
Operations and Cost Excellence
Recurring cost savings and margin enhancement of $1,065 million, which consists of $590 million of cumulative cost savings, a $215 million net margin enhancement program, $50 million annual reduction in maintenance capital expenditures, and $210 million in permanent selling, general and administrative expense reduction associated with asset sales. The Company realized annual cost savings of $532 million and $32 million of margin enhancements during the year ended December 31, 2018 and is on track to realize $590 million of cost savings and $135 million of margin enhancements in 2019.
The Company expects to realize (i) $370 million of non-recurring working capital improvements through 2020 and (ii) approximately $290 million of one-time costs to achieve. By December 31, 2018, NRG has realized $333 million of non-recurring working capital improvements and $194 million of one-time costs to achieve, and expects to incur approximately $95 million of one-time costs to achieve in 2019.
Portfolio Optimization
Targeted and completed $3.0 billion of asset sale cash proceeds received through February 28, 2019.
Capital Structure and Allocation
As of December 31, 2018, the Company achieved the previously announced target of reducing consolidated corporate debt to 3.0x net debt / adjusted EBITDA(b) credit ratio on a pro forma basis that includes the South Central Portfolio sale proceeds. As of February 28, 2019, the Company completed $1.5 billion of share repurchases.
| (a) | excluding discontinued operations and held for sale |
| (b) | adjusted EBITDA as defined per the Senior Credit Facility |
Business Overview
As of December 31, 2018, the Company’s core businesses include (i) retail electricity and natural gas for residential, industrial and commercial consumers, including personal power solutions and Business Solutions, which includes C&I customers and other distributed and reliability products, and (ii) wholesale conventional generation primarily to support the retail business. The Company is committed to continuing to evaluate and streamline its generation portfolio to focus on locational value and supporting the retail business in each of the markets where the Company participates. In furtherance of this goal, during 2018, NRG divested non-core businesses which included, among others: (i) NRG Yield, Inc. and the Company's Renewables Platform, and (ii) the Company's South Central Portfolio.
The Company previously had an ownership interest in GenOn Energy, Inc. which filed for bankruptcy on June 14, 2017. As a result of the bankruptcy filing, NRG determined it no longer controlled GenOn and deconsolidated GenOn and its subsidiaries for financial reporting purposes. On December 14, 2018, GenOn emerged from bankruptcy as a standalone company no longer owned by NRG.
Retail
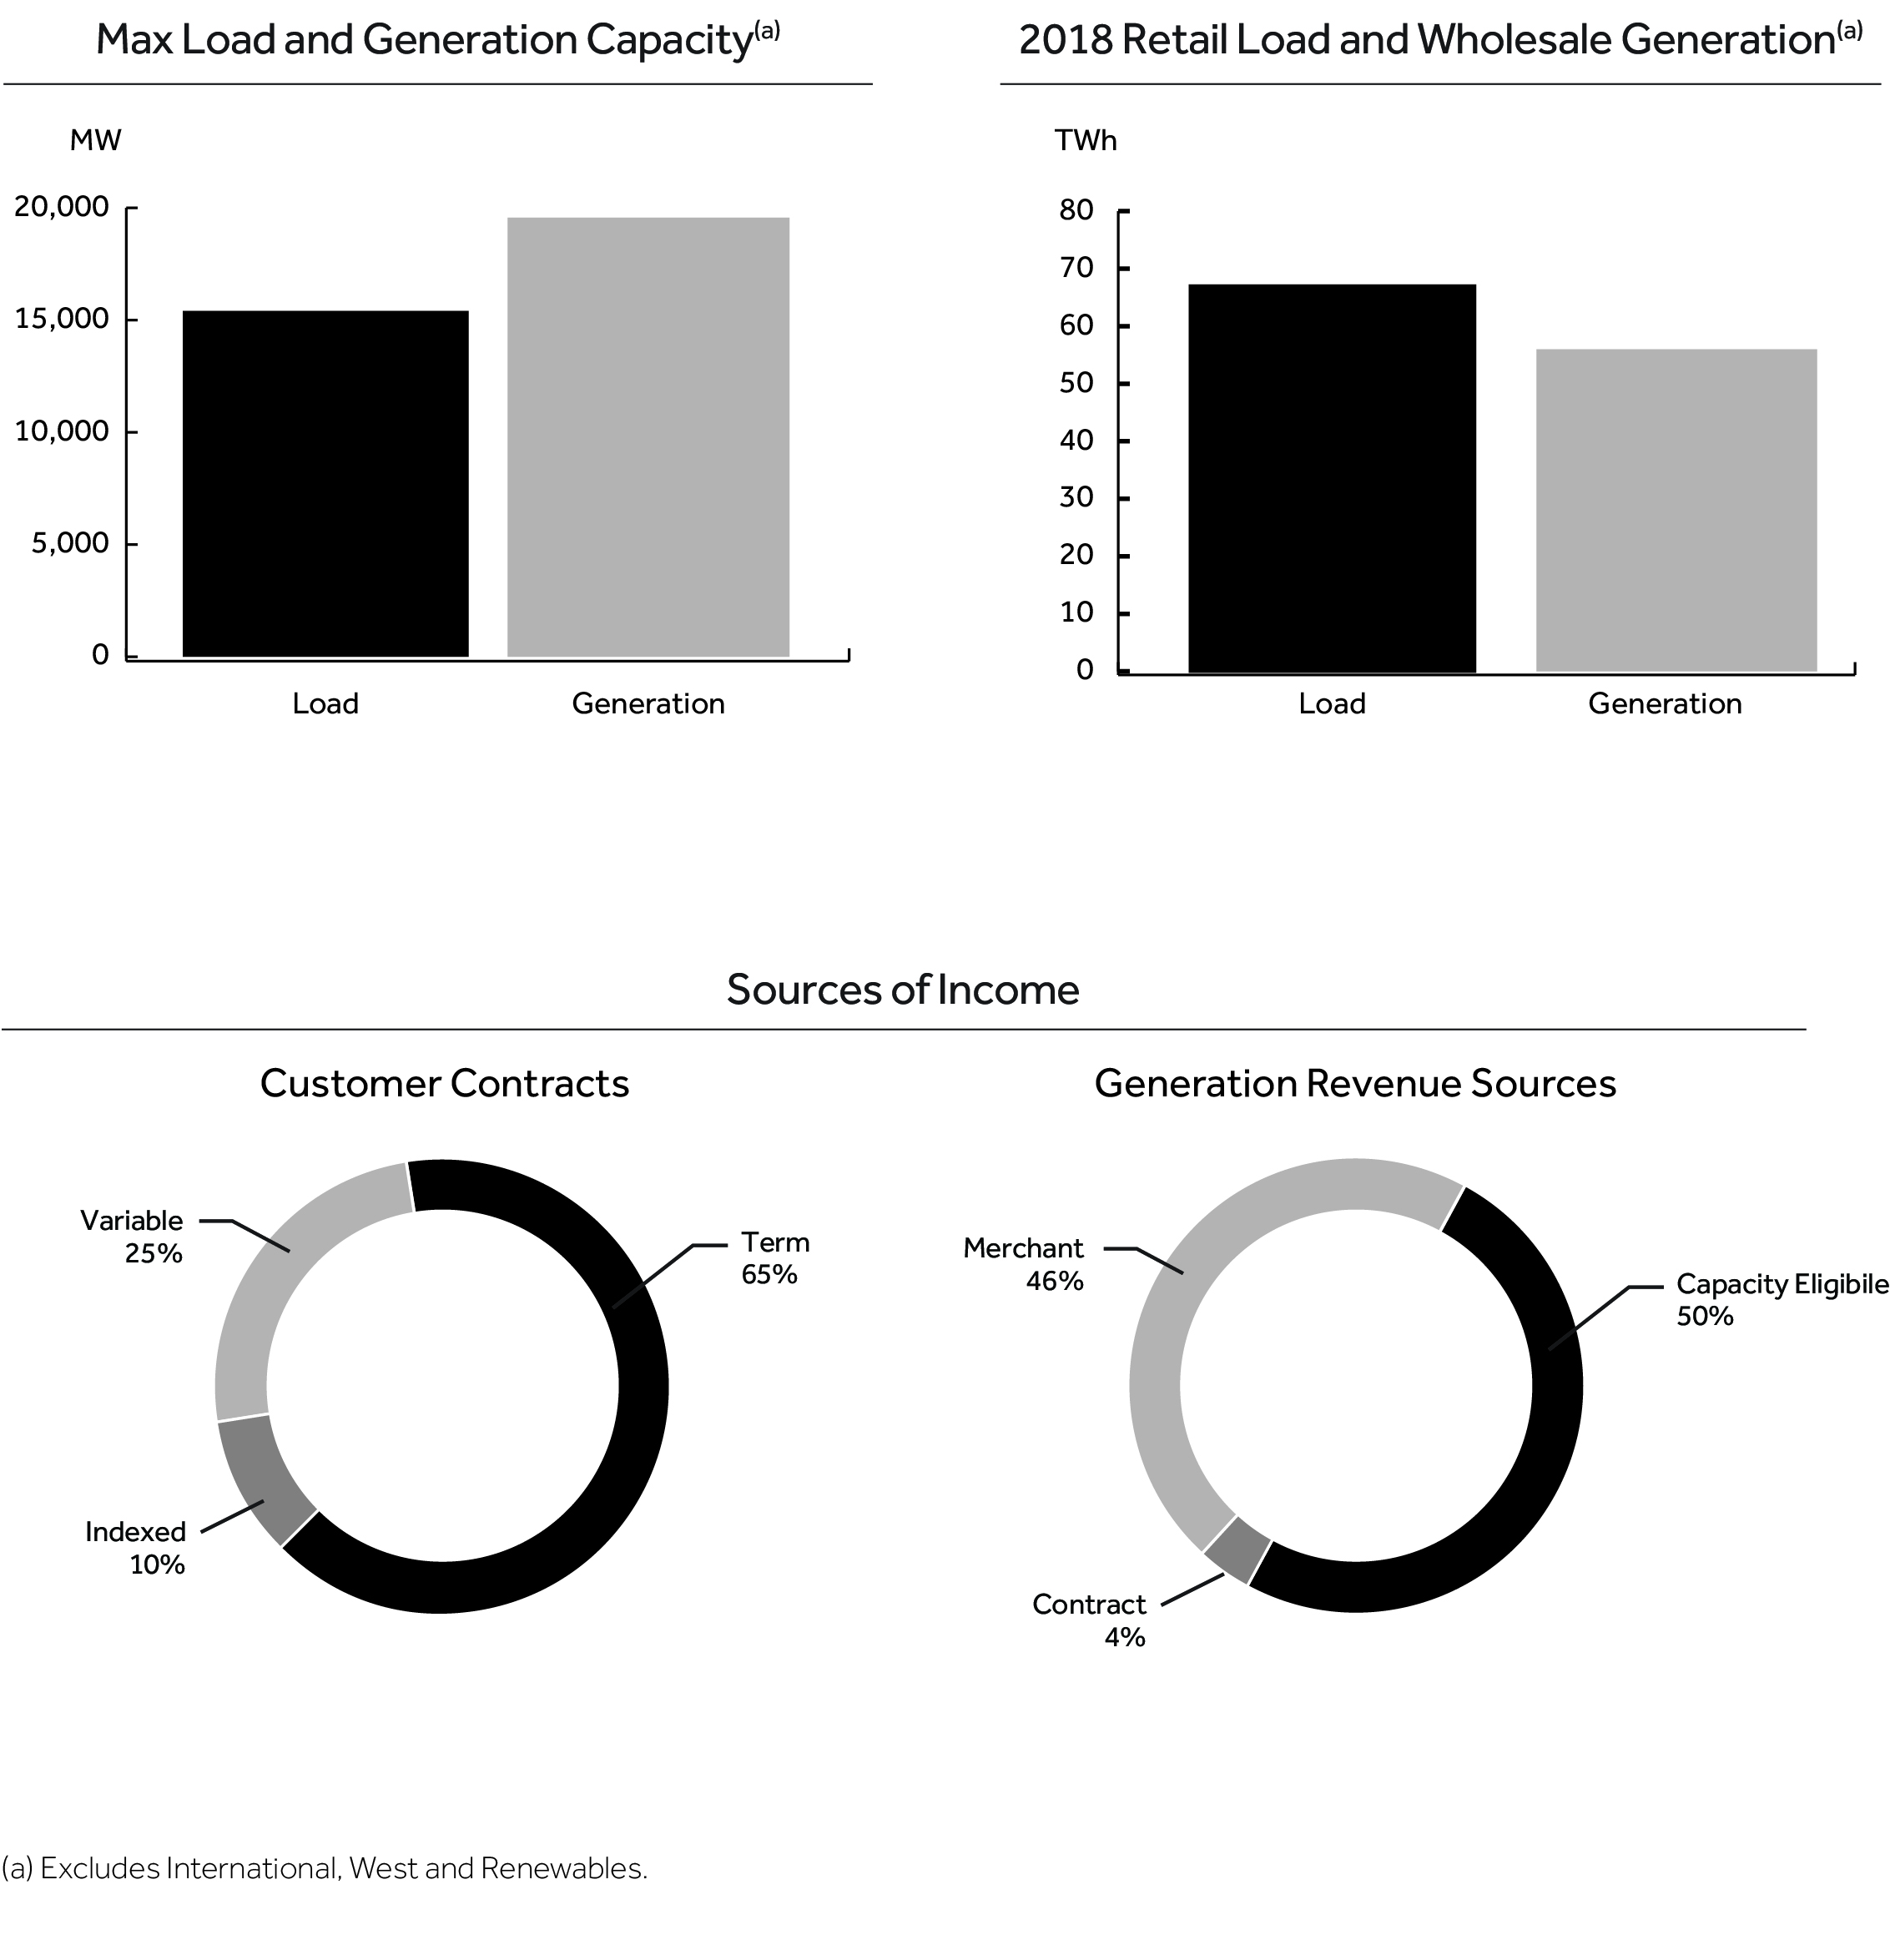
Retail provides energy and related services to residential, industrial and commercial consumers through various brands and sales channels across the U.S. In 2018, Retail delivered approximately 67 TWhs of electricity and 11 MDth of natural gas and served approximately 3.1 million customers. Retail's results make it one of the largest competitive energy retailers in the U.S. As of the end of 2018, Retail has recurring electricity and/or natural gas sales in 19 U.S. states, the District of Columbia, and 2 provinces in Canada. Retail's brands, collectively, are the largest providers of electricity in Texas.
Residential and small commercial (Mass Market) consumers make purchase decisions based on a variety of factors, including price, customer service, brand, product choices and value-added features. These consumers purchase products through a variety of sales channels, including direct sales, call centers, websites, brokers and brick-and-mortar stores. Through its broad range of service offerings and value propositions, Retail is able to attract, retain, and increase the value of its customer relationships. Retail's brands are recognized for exemplary customer service, innovative smart energy and technology product offerings and environmentally friendly solutions.
Included in Retail is the Company's Business Solutions group, which includes demand response, commodity sales, energy efficiency and energy management solutions. An integrated provider of supply and distributed energy resources, Business Solutions focuses on distributed products and services as businesses seek greater reliability, cleaner power or other benefits that they cannot obtain from the grid. These solutions include system power, distributed generation, solar and wind products, carbon management and specialty services, backup generation, storage and distributed solar, demand response and energy efficiency and advisory services. In providing on-site energy solutions, the Company often benefits from its ability to supply energy products from its wholesale generation portfolio to commercial and industrial retail customers. In 2018, Business Solutions delivered approximately 21 TWhs of electricity and managed approximately 2,000 MWs of demand response positions across its portfolio.
Generation
The Company’s wholesale power generation business includes plant operations, commercial operations, EPC, asset management, energy services and other critical related functions.
The wholesale generation business is capital-intensive and commodity-driven with numerous industry participants that compete on the basis of the location of their plants, fuel mix, plant efficiency and reliability services. The Company owns a diversified power generation portfolio with approximately 23,000(a) MW of fossil fuel, nuclear and renewable generation capacity at 37 plants as of December 31, 2018. In addition, the Company operates approximately 8,200 MW of coal and natural gas generation at 17 plants on behalf of third parties as of December 31, 2018. The Company's power generation assets are diversified by fuel-type, dispatch level and region, which helps mitigate the risks associated with fuel price volatility and market demand cycles. NRG's U.S. baseload and intermediate facilities provide the Company with a significant source of cash flow. Many of NRG's generation facilities are located near population centers, which often translates into higher revenue. Additionally, NRG's peaking facilities provide opportunities to capture significant upside potential during periods of high demand, which typically drive higher energy prices.
(a) excluding discontinued operations and held for sale
Wholesale power generation is a regional business that is currently highly fragmented and diverse in terms of industry structure. As such, there is a wide variation in terms of the capabilities, resources, nature and identities of the companies the Company competes with depending on the market. Competitors include regulated utilities, municipalities, cooperatives, other independent power producers, and power marketers or trading companies, including those owned by financial institutions. Many of the Company's generation assets, however, are located within densely populated areas that tend to have higher wholesale pricing as a result of relatively favorable local supply-demand balance. The Company believes that its extensive generation portfolio provides asset optimization opportunities. NRG continuously evaluates opportunities for development of new generation, on both a merchant and contracted basis.
NRG Operations
The NRG businesses described above are supported through the NRG operational infrastructure, which begins with the Company’s asset fleet and the associated commercial and retail operations. The images below illustrate NRG's U.S. power generation, net capacity and retail capabilities as of December 31, 2018, excluding discontinued operations:
The following table summarizes NRG's global generation portfolio as of December 31, 2018:
| Global Generation Portfolio(a)(b)(c) | ||||||||||||
| (In MW) | ||||||||||||
| Generation | ||||||||||||
| Generation Type | Texas(f) | East/West(d)(e) | Other | Total Global | ||||||||
| Natural gas | 4,739 | 5,248 | — | 9,987 | ||||||||
| Coal | 4,174 | 3,745 | — | 7,919 | ||||||||
| Oil | — | 3,621 | — | 3,621 | ||||||||
| Nuclear | 1,126 | — | — | 1,126 | ||||||||
| Wind | — | 75 | — | 75 | ||||||||
| Utility Scale Solar | — | 322 | — | 322 | ||||||||
| Battery Storage & Distributed Solar | 2 | — | 60 | 62 | ||||||||
| Total generation capacity | 10,041 | 13,011 | 60 | 23,112 |
(a) All Utility Scale Solar and Distributed Solar facilities are described in MW on an alternating current basis. MW figures provided represent nominal summer net MW capacity of power generated as adjusted for the Company's owned or leased interest excluding capacity from inactive/mothballed units
(b) The NRG Yield Inc. and the Renewables Platform businesses, which represented 3,428 MW of global generation, were sold on August 31, 2018
(c) Excludes the South Central Portfolio, except for Cottonwood, which was sold on February 4, 2019, as well as the 528 MW natural gas-fired project in Carlsbad, California that was sold on February 27, 2019
(d) Includes the 1,263 MW Cottonwood facility that was sold to Cleco on February 4, 2019, which the Company is leasing until 2025
(e) Includes International and Renewables
(f) Does not include plants outside of the ERCOT market or the Sherbino wind farm, which are included in East/West
The Company has the advantage of being able to supply its retail businesses with its own generation, which can reduce the need to sell and buy power from other institutions and intermediaries, resulting in lower transaction costs and credit exposures. This combination of generation and retail allows for a reduction in actual and contingent collateral, through offsetting transactions and by reducing the need to hedge the retail power supply through third parties.
The generation and retail combination also provides stability in cash flows, as changes in commodity prices generally have offsetting impacts between the two businesses. This offsetting nature, in relation to changes in market prices, is an integral part of NRG's goal of providing a reliable source of future cash flow for the Company.
NRG's portfolio diversification and commercial operations hedging strategy provides the Company with reliable future cash flows. NRG has hedged a portion of its coal and nuclear capacity with decreasing hedge levels through 2022. In addition, NRG's cleared capacity revenues not only enhance the reliability of future cash flows but are not correlated to natural gas prices during the contracted period. As of December 31, 2018, the Company had purchased fuel forward under fixed price contracts, with contractually-specified price escalators, for approximately 68% of its expected coal requirement from 2019 to 2020. The Company enters into additional hedges when it believes market conditions are favorable.
Commercial Operations Overview
NRG seeks to maximize profitability and manage cash flow volatility through the marketing, trading and sale of energy, capacity and ancillary services into spot, intermediate and long-term markets and through the active management and trading of transmission rights, emissions allowances, renewable energy credits, fuel supplies and transportation-related services. The Company's principal objectives are the realization of the full market value of its overall portfolio, including the capture of its extrinsic value, the management and mitigation of commodity market risk and the reduction of cash flow volatility over time.
NRG enters into supply contracts, power sales and hedging arrangements via a wide range of products and contracts, including PPAs, fuel supply contracts, capacity auctions, natural gas derivative instruments and other financial instruments. In addition, because changes in power prices in the markets where NRG operates are generally correlated to changes in natural gas prices, NRG uses hedging strategies that may include power and natural gas forward purchases and sales contracts to manage the commodity price risk. The objective of these hedging strategies is to stabilize the cash flow generated by NRG's overall portfolio.
In addition to power purchases and sales and hedging arrangements, NRG trades electric power, natural gas and related commodity and financial products, including forwards, futures, options and swaps. The Company seeks to generate profits from volatility in the price of electricity, capacity, fuels and transmission congestion by buying and selling contracts in wholesale markets under guidelines approved by the Company's risk management committee.
Retail Operations
NRG's retail businesses sell electricity to residential, commercial and industrial consumers at either fixed, indexed or variable prices. Residential and smaller commercial consumers typically contract for terms ranging from one month to five years while industrial contracts are often between one year and five years in length. In 2018, NRG's retail businesses sold approximately 67 TWhs of electricity and 11 MDth of natural gas. In any given year, the quantity of TWhs and MDth sold can be affected by weather, economic conditions and competition. The wholesale supply is typically purchased as the anticipated load is contracted from a combination of NRG's wholesale portfolio and other third parties. The ability to choose supply from the market or the Company's portfolio allows for an optimal combination to support and stabilize retail margins.
Capacity and Other Contracted Revenue Sources
NRG's revenues and cash flows benefit from capacity/demand payments and other contracted revenue sources, originating from market clearing capacity prices, Resource Adequacy contracts, tolling arrangements and other long-term contractual arrangements:
Capacity auctions — The Company's largest sources of capacity revenues are capacity auctions in PJM and ISO-NE. Both PJM and ISO-NE operate a pay-for-performance model where capacity payments are modified based on real-time performance, where NRG's actual revenues will be the combination of revenues based on the cleared auction MWs plus the net of any over- and under-performance of NRG's fleet.
| ◦ | 2021/2022 PJM Auction Results — On May 23, 2018, PJM announced the results of its 2021/2022 base residual auction. NRG cleared approximately 4,619 MW of Capacity Performance product for the generation fleet. NRG's expected capacity revenues from the base residual auction for the 2021/2022 delivery year are approximately $322 million. The table below provides a detailed description of NRG’s 2021/2022 base residual auction results from May 23, 2018: |
| Generation | ||||||
| Zone | Cleared Capacity (MW) | Price ($/MW-day) | ||||
| COMED | 3,995 | $ | 195.55 | |||
| EMAAC | 552 | $ | 165.73 | |||
| PEPCO | 72 | $ | 140.00 | |||
| Total | 4,619 |
NRG through its demand response business received a capacity award of 3,194 MWs at a volume weighted average price of $155.16 per MW-day, or $181 million of revenue, and pays out a portion of these revenues to our customers reflected as cost of sales.
| ◦ | 2022/2023 ISO-NE Auction Results - On February 6, 2019 ISO-NE announced the results of its 2022/2023 forward capacity auction. NRG cleared 1,517 MW of capacity. NRG's expected capacity revenues from the auction for the 2022/2023 delivery year are approximately $69 million. |
Resource adequacy and bilateral contracts — In California, there is a resource adequacy requirement which is primarily satisfied through bilateral contracts. Such bilateral contracts are typically short-term resource adequacy contracts. When bilateral contracting does not satisfy the resource adequacy need, such shortfalls can be addressed through procurement tools administered by the CAISO, including the capacity procurement mechanism or reliability must-run contracts.
Bilateral contracts — The Company enters into physical power bilateral contracts for the sale of energy from our generation fleet as part of the Company's portfolio optimization strategy. Counterparties to the contracts are either third parties or our Retail segment. The Company primarily sells physical capacity forward through bilateral contracts for our New York assets. To the extent NRG is not able to enter into a physical bilateral contract, NRG will sell the remaining capacity into the NYISO six month strip, monthly or spot auctions.
Fuel Supply and Transportation
NRG's fuel requirements consist of various forms of fossil fuel (including coal, natural gas and oil) and nuclear fuel. The prices of fossil fuels are highly volatile. The Company obtains its fossil fuels from multiple suppliers and through multiple transporters. Although availability is generally not an issue, localized shortages, transportation availability, delays arising from extreme weather conditions and supplier financial stability issues can and do occur. The preceding factors related to the sources and availability of raw materials are fairly uniform across the Company's businesses and fuel products used.
Coal — The Company believes it is adequately hedged, using forward coal supply agreements, for its domestic coal consumption for 2019. NRG actively manages its coal requirements based on forecasted generation, market volatility and its inventory on site. As of December 31, 2018, NRG had purchased forward contracts to provide fuel for approximately 68% of the Company's expected requirements from 2019 through 2020. NRG purchased approximately 23 million tons of coal in 2018, almost all of which was Powder River Basin coal. For fuel transport, NRG has entered into various rail and barge transportation and rail car lease agreements with varying tenures that provide for most of the Company's transportation requirements of Powder River Basin coal for the next 2 years.
The following table shows the percentage of the Company's coal requirements from 2019 through 2020 that have been purchased forward as of December 31, 2018:
| Percentage of Company's Requirement | ||
| 2019 | 100 | % |
| 2020 | 36 | % |
Natural Gas — NRG operates a fleet of mid-merit and peaking natural gas plants across all its U.S. wholesale regions. Fuel needs are managed on a spot basis, especially for peaking assets, as the Company does not believe it is prudent to forward purchase natural gas for these types of units, the dispatch of which is highly unpredictable. The Company contracts for natural gas storage services as well as natural gas transportation services to deliver natural gas when needed.
Nuclear Fuel — STP's owners satisfy their fuel supply requirements by: (i) acquiring uranium concentrates and contracting for conversion of the uranium concentrates into uranium hexafluoride; (ii) contracting for enrichment of uranium hexafluoride; and (iii) contracting for fabrication of nuclear fuel assemblies. Through its proportionate participation in STPNOC, which is the NRC-licensed operator of STP and responsible for all aspects of fuel procurement, NRG is party to a number of long-term forward purchase contracts with many of the world's largest suppliers covering STP's requirements for uranium concentrates with only approximately 25% of STP's requirements outstanding for the duration of the original operating license. Similarly, NRG is party to long-term contracts to procure STP's requirements for conversion and enrichment services and fuel fabrication for the life of the operating license. Since the operating license was renewed for another 20 years in September 2017, STPNOC has begun to review a second phase of fuel purchasing.
Operational Statistics
Retail
The following are industry statistics for the Company's customer count, load and economic gross margin per MWh:
| Years ended December 31, | |||||||||||
| 2018 | 2017 | 2016 | |||||||||
| Sales volumes (in GWh) | |||||||||||
| Mass electricity - Texas | 37,846 | 36,169 | 35,102 | ||||||||
| Mass electricity - All other regions | 7,968 | 6,221 | 6,764 | ||||||||
| C&I electricity - Texas | 20,192 | 19,586 | 17,540 | ||||||||
| C&I electricity - All other regions | 984 | 814 | 1,366 | ||||||||
| Total Load | 66,990 | 62,790 | 60,772 | ||||||||
| Customer count - Electricity (in thousands) | |||||||||||
| Texas | |||||||||||
| Average Retail Mass | 2,176 | 2,139 | 2,058 | ||||||||
| Ending Retail Mass | 2,291 | 2,159 | 2,102 | ||||||||
| All other regions | |||||||||||
| Average Retail Mass | 790 | 675 | 679 | ||||||||
| Ending Retail Mass | 903 | 673 | 671 | ||||||||
| Customer count - Natural gas (in thousands) | |||||||||||
| Average Retail Mass | 64 | 11 | 8 | ||||||||
| Ending Retail Mass | 99 | 15 | 9 | ||||||||
| Gross margin and economic gross margin | |||||||||||
| Gross margin (in millions) | $ | 2,055 | $ | 1,778 | $ | 2,006 | |||||
| Economic gross margin (in millions) | 1,802 | 1,602 | 1,649 | ||||||||
| Gross margin per MWh | 30.68 | 28.32 | 33.01 | ||||||||
| Economic gross margin per MWh | 26.91 | 25.51 | 27.13 | ||||||||
| Customer contract mix | |||||||||||
| Term | 65 | % | 70 | % | 70 | % | |||||
| Variable | 25 | % | 22 | % | 23 | % | |||||
| Indexed | 10 | % | 8 | % | 7 | % | |||||
| 100 | % | 100 | % | 100 | % |
Generation
The following are industry statistics for the Company's fossil and nuclear plants, as defined by the NERC, and are more fully described below:
Annual Equivalent Availability Factor, or EAF — Measures the percentage of maximum generation available over time as the fraction of net maximum generation that could be provided over a defined period of time after all types of outages and deratings, including seasonal deratings, are taken into account.
Net Heat Rate — The net heat rate represents the total amount of fuel in BTU required to generate one net kWh provided.
Net Capacity Factor — The net amount of electricity that a generating unit produces over a period of time divided by the net amount of electricity it could have produced if it had run at full power over that time period. The net amount of electricity produced is the total amount of electricity generated minus the amount of electricity used during generation.
The tables below present these performance metrics for the Company's global power generation portfolio, including leased facilities and those accounted for through equity method investments, for the years ended December 31, 2018 and 2017:
| Year Ended December 31, 2018 | ||||||||||||||
| Fossil and Nuclear Plants (a) | ||||||||||||||
| Net Owned Capacity (MW) | Net Generation (MWh) (In thousands) (a) | Annual Equivalent Availability Factor | Average Net Heat Rate BTU/kWh | Net Capacity Factor | ||||||||||
| Generation | ||||||||||||||
| Texas | 10,161 | 38,214 | 85.2 | % | 10,423 | 44.7 | % | |||||||
| East/West/Other (b) | 13,037 | 21,089 | 82.8 | % | 9,711 | 17.8 | % | |||||||
| Other (c) | 60 |
| Year Ended December 31, 2017 | ||||||||||||||
| Fossil and Nuclear Plants (a) | ||||||||||||||
| Net Owned Capacity (MW) | Net Generation (MWh) (In thousands) (a) | Annual Equivalent Availability Factor | Average Net Heat Rate BTU/kWh | Net Capacity Factor | ||||||||||
| Generation | ||||||||||||||
| Texas | 10,159 | 38,694 | 90.4 | % | 10,490 | 45.0 | % | |||||||
| East/West/Other (b) | 14,594 | 21,338 | 84.7 | % | 9,738 | 16.4 | % | |||||||
| Other (c) | 114 |
| (a) | Net generation excludes equity method investments |
| (b) | Includes International, NRG renewable assets, Sherbino and the 1,263 MW Cottonwood facility, which NRG will lease back |
| (c) | The net capacity figure within "Other" includes the aggregate production capacity of installed and activated residential solar energy systems |
The generation performance by region for the three years ended December 31, 2018, 2017 and 2016, is shown below:
| Net Generation | ||||||||
| 2018 | 2017 | 2016 | ||||||
| (In thousands of MWh) | ||||||||
| Generation | ||||||||
| Texas | ||||||||
| Coal | 24,781 | 24,757 | 21,738 | |||||
| Gas | 4,415 | 4,428 | 6,379 | |||||
| Nuclear (a) | 9,018 | 9,509 | 9,559 | |||||
| Total Texas | 38,214 | 38,694 | 37,676 | |||||
| East/West | ||||||||
| Coal | 7,965 | 8,403 | 9,931 | |||||
| Oil | 544 | 319 | 318 | |||||
| Gas | 11,797 | 10,949 | 11,671 | |||||
| Renewables | 783 | 1,667 | 1,828 | |||||
| Total East/West | 21,089 | 21,338 | 23,748 |
| (a) | MWh information reflects the Company's undivided interest in total MWh generated by STP |
Greenhouse Gas Emissions — NRG emits CO2 and small quantities of other GHGs (0.6% of total) when generating electricity at a majority of its facilities. The graphs presented below illustrate NRG's domestic emissions of CO2e for the 2014 through 2018 period. A significant majority (>99%) of NRG's emission sources are subject to federal (U.S. EPA) GHG reporting requirements programs. From 2014 to 2018, the Company's CO2e emissions decreased from 72 million metric tons to 46 million metric tons, representing a 36% reduction. The primary factor leading to the decreased emissions include reductions in fleet net generation due to a market-driven shift from coal as a primary fuel to natural gas. The Company's goal is to reduce CO2e emissions by 50% by 2030, and 90% by 2050, using 2014 as a baseline.
As of December 31, 2018, less than 25% of the Company's consolidated operating revenues were derived from coal-fired operating assets.
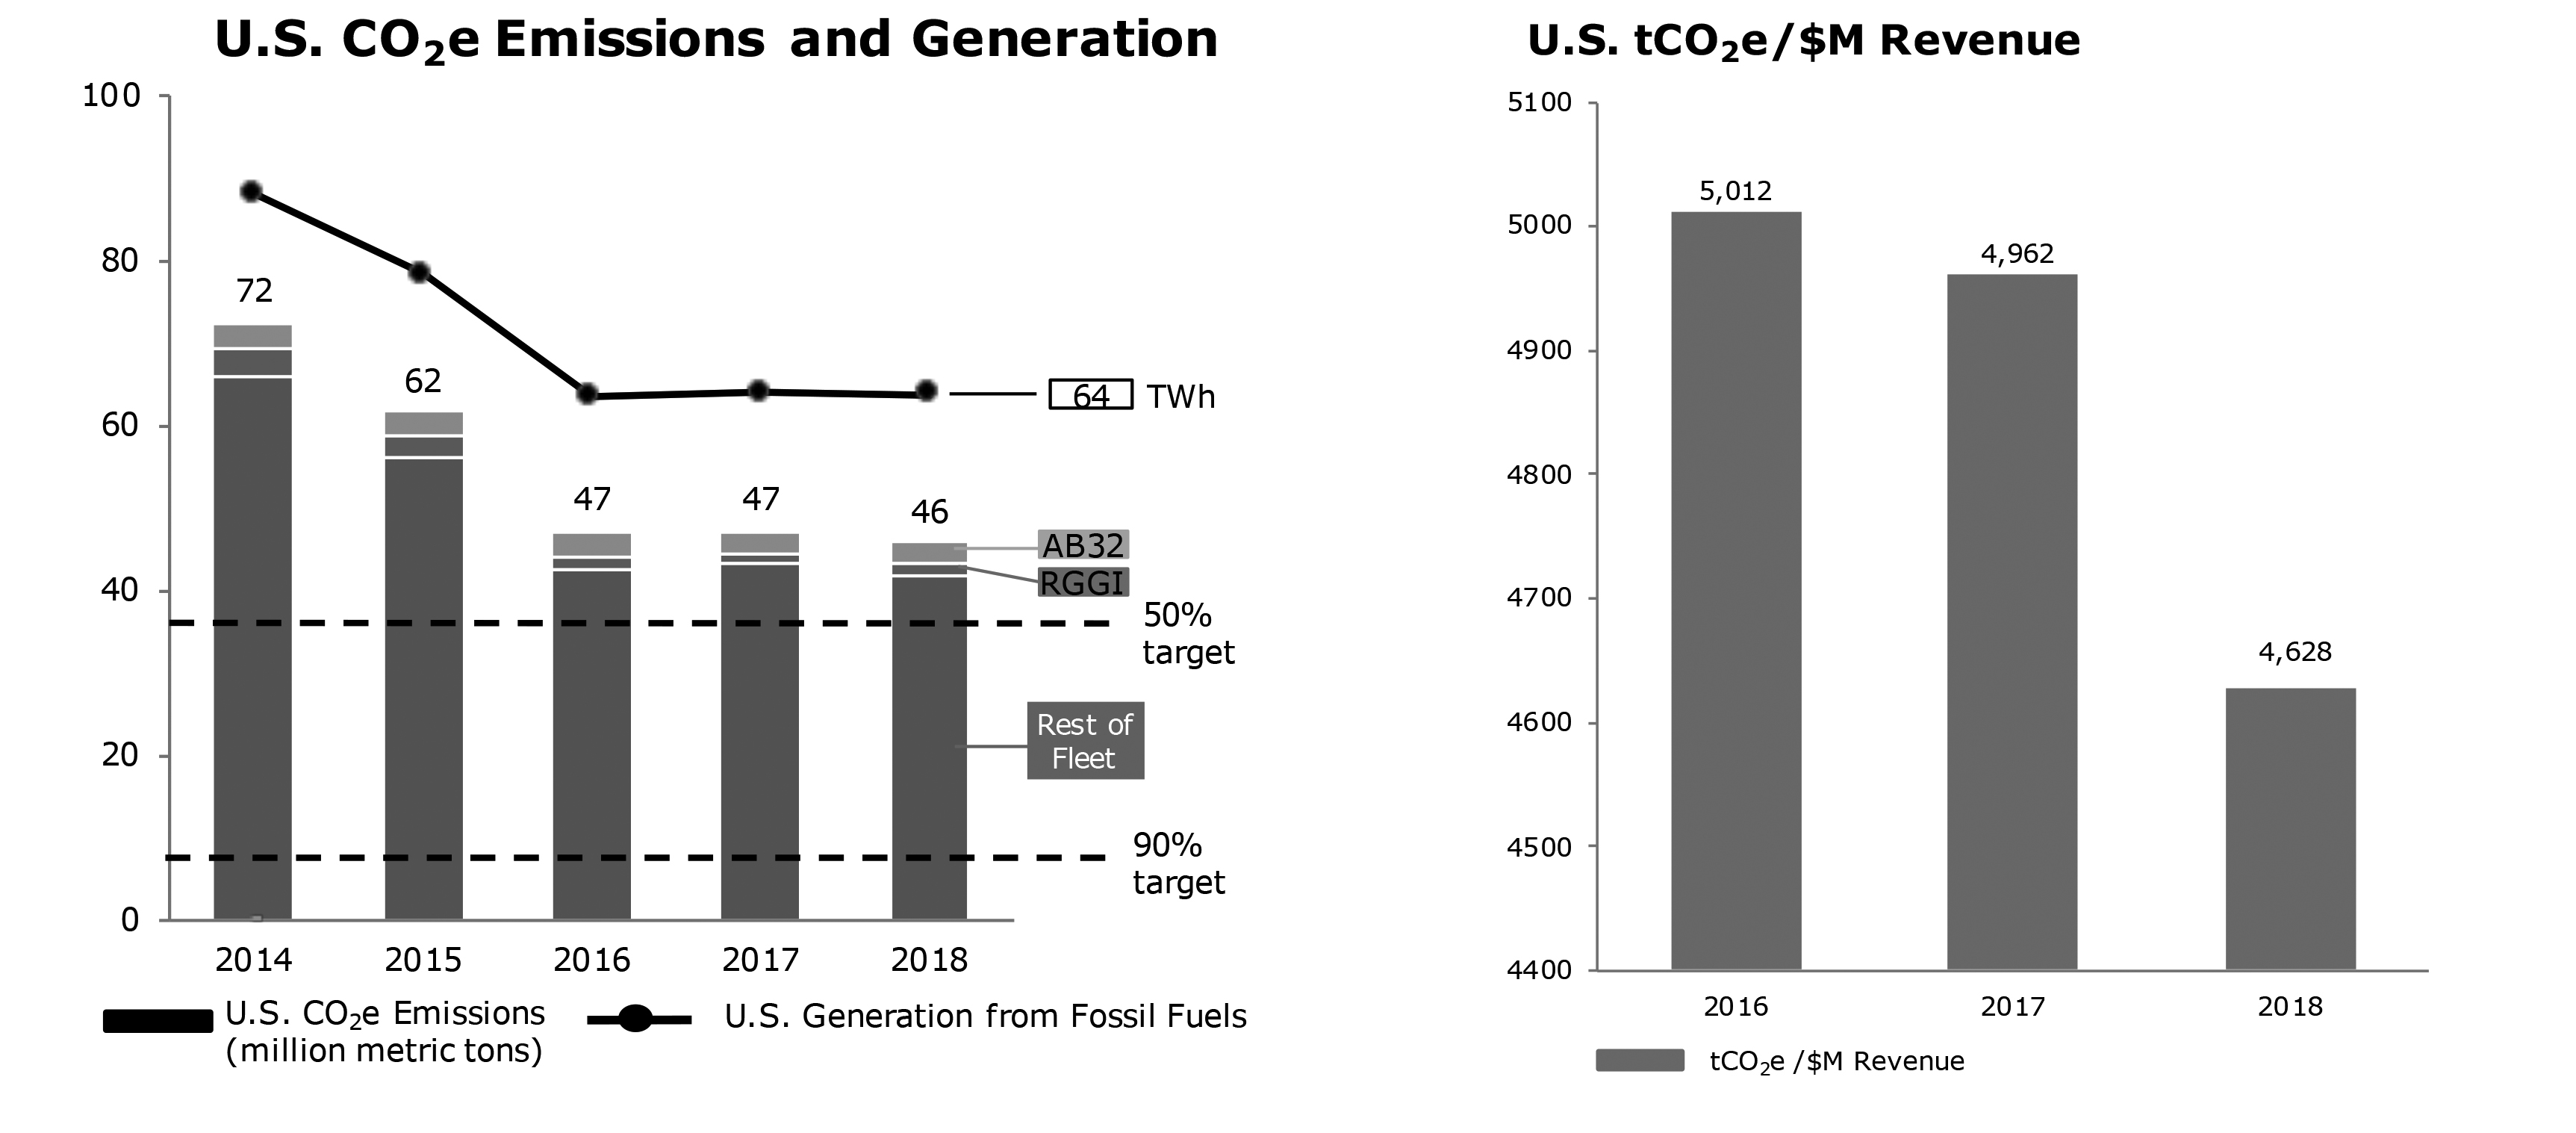
The effects from federal, regional or state regulation of GHGs on the Company's financial performance will depend on a number of factors, including the outcome of the legal challenges and actions of the current U.S. presidential administration.
Segment Review
The Company's segment structure reflects how management currently makes financial decisions and allocates resources. The Company's businesses are segregated as follows: Retail, which includes Mass customers and Business Solutions, which includes C&I customers and other distributed and reliability products; and Generation, which includes all power plant activities, domestic and international, as well as renewables. Intersegment sales are accounted for at market. The Company has recast data from prior periods to reflect changes in reportable segments to conform to the current year presentation.
As further described in Note 3, Acquisitions, Discontinued Operations and Dispositions, the Company is treating the following businesses as discontinued operations, which have been recast to present in the corporate segment:
-
South Central Portfolio
-
NRG Yield, Inc. and its Renewables Platform
-
Carlsbad
-
GenOn
Revenues
The following table contains a summary of NRG's operating revenues by segment for the years ended December 31, 2018, 2017 and 2016, as discussed in Item 15 — Note 17, Segment Reporting, to the consolidated financial statements. Refer to that footnote for additional financial information about NRG's business segments including a profit measure and total assets. In addition, refer to Item 2 — Properties, to the consolidated financial statements for information about facilities in each of NRG's business segments.
| Year Ended December 31, 2018 | |||||||||||||||||||||||||||
| Energy Revenues | Capacity Revenues | Retail Revenues | Mark-to- Market Activities | Contract Amortization | Other Revenues(a) | Total Operating Revenues(b) | |||||||||||||||||||||
| (In millions) | |||||||||||||||||||||||||||
| Generation | $ | 2,677 | $ | 670 | $ | — | $ | (202 | ) | $ | — | $ | 287 | $ | 3,432 | ||||||||||||
| Retail | — | — | 7,110 | (7 | ) | — | — | 7,103 | |||||||||||||||||||
| Corporate and Eliminations (b) | (1,129 | ) | — | (5 | ) | 79 | — | (2 | ) | (1,057 | ) | ||||||||||||||||
| Total | $ | 1,548 | $ | 670 | $ | 7,105 | $ | (130 | ) | $ | — | $ | 285 | $ | 9,478 |
| (a) | Consists operation and maintenance revenues and unrealized trading activities, primarily at BETM (Generation segment) |
| (b) | Energy revenues include inter-segment sales primarily between Generation and Retail |
| Year Ended December 31, 2017 | |||||||||||||||||||||||||||
| Energy Revenues | Capacity Revenues | Retail Revenues | Mark-to- Market Activities | Contract Amortization | Other Revenues(c) | Total Operating Revenues(d) | |||||||||||||||||||||
| (In millions) | |||||||||||||||||||||||||||
| Generation | $ | 2,725 | $ | 618 | $ | — | $ | 37 | $ | — | $ | 235 | $ | 3,615 | |||||||||||||
| Retail | — | — | 6,374 | (4 | ) | (1 | ) | — | 6,369 | ||||||||||||||||||
| Corporate and Eliminations (d) | (1,089 | ) | (6 | ) | 4 | 219 | — | (38 | ) | (910 | ) | ||||||||||||||||
| Total | $ | 1,636 | $ | 612 | $ | 6,378 | $ | 252 | $ | (1 | ) | $ | 197 | $ | 9,074 |
| (c) | Consists of operation and maintenance revenues and energy service revenues, primarily at BETM (Generation segment) |
| (d) | Energy revenues include inter-segment sales primarily between Generation and Retail |
| Year Ended December 31, 2016 | |||||||||||||||||||||||||||
| Energy Revenues | Capacity Revenues | Retail Revenues | Mark-to- Market Activities | Contract Amortization | Other Revenues(e) | Total Operating Revenues(f) | |||||||||||||||||||||
| (In millions) | |||||||||||||||||||||||||||
| Generation | $ | 3,243 | $ | 642 | $ | — | $ | (565 | ) | $ | — | $ | 313 | $ | 3,633 | ||||||||||||
| Retail | — | — | 6,332 | (1 | ) | (1 | ) | — | 6,330 | ||||||||||||||||||
| Corporate and Eliminations(f) | (974 | ) | (5 | ) | 36 | (70 | ) | — | (35 | ) | (1,048 | ) | |||||||||||||||
| Total | $ | 2,269 | $ | 637 | $ | 6,368 | $ | (636 | ) | $ | (1 | ) | $ | 278 | $ | 8,915 |
(e) Consists of operation and maintenance revenues and energy service revenues, primarily at BETM (Generation segment)
(f) Energy revenues include inter-segment sales primarily between Generation and Retail
Seasonality and Price Volatility
Annual and quarterly operating results of the Company's wholesale power generation segments can be significantly affected by weather and energy commodity price volatility. Significant other events, such as the demand for natural gas, interruptions in fuel supply infrastructure and relative levels of hydroelectric capacity can increase seasonal fuel and power price volatility. The preceding factors related to seasonality and price volatility are fairly uniform across the Company's wholesale generation business segments.
The sale of electric power to retail customers is also a seasonal business with the demand for power generally peaking during the summer months. As a result, net working capital requirements for the Company's retail operations generally increase during summer months along with the higher revenues, and then decline during off-peak months. Weather may impact operating results and extreme weather conditions could materially affect results of operations. The rates charged to retail customers may be impacted by fluctuations in total power prices and market dynamics like the price of natural gas, transmission constraints, competitor actions, and changes in market heat rates.
Market Framework
Retail
NRG's retail businesses sell energy and related services as well as portable power and battery solutions to customers across the country. In most of the states that have introduced retail consumer choice, NRG's retail businesses competitively offer retail power, natural gas, portable power and other value-enhancing services to end-use customers. Each retail choice state establishes its own retail competition laws and regulations, and the specific operational, licensing, and compliance requirements vary on a state-by-state basis. In the East markets, incumbent utilities currently provide default service and as a result typically serve a majority of residential customers. In Texas, NRG’s retail business activities are subject to standards and regulations adopted by the PUCT and ERCOT, including the requirement for retailers to be certified by the PUCT in order to contract with end-users to sell electricity. A majority of the retail load is in the ERCOT market region and is served by competitive retail suppliers, except certain areas that are served by municipal utilities and electric cooperatives that have not opted into competitive choice. Regulated terms and conditions of default service, as well as any movement to replace default service with competitive services, as is done in ERCOT, can affect customer participation in retail competition. The attractiveness of NRG's retail offerings in each state may be impacted by the rules, regulations, market structure and communication requirements from public utility commissions in each state across the country.
Wholesale
NRG's fleet operates in organized energy markets, known as RTOs or ISOs. Each organized market administers day-ahead and real-time centralized bid-based energy and ancillary services markets pursuant to tariffs approved by FERC, or in the case of ERCOT, market rules approved by the PUCT. These tariffs and rules dictate how the energy markets operate, how market participants make bilateral sales with one another, and how entities with market-based rates are compensated. Established prices reflect the value of energy at the specific location and time it is delivered, which is known as the Locational Marginal Price, or LMP. Each market is subject to market mitigation measures designed to limit the exercise of locational market power. These market structures facilitate NRG's sale of power and capacity products at market-based rates.
Other than ERCOT, each of the ISO regions also operates a capacity or resource adequacy market that provides an opportunity for generating and demand response resources to earn revenues to offset their fixed costs that are not recovered in the energy and ancillary services markets. The ISOs are also responsible for transmission planning and operations.
Texas
NRG's Texas wholesale power generation business is located in the ERCOT market. The ERCOT market is one of the nation's largest and historically fastest growing power markets. ERCOT is an energy- only market, and has implemented market rule changes referred to as the Operating Reserve Demand Curve (ORDC) to provide pricing more reflective of higher energy value when operating reserves are scarce or constrained. The PUCT directed the implementation of the ORDC in 2014 to act as the primary scarcity pricing mechanism and has modified it several times since then, including as recently as January 2019.
East/West
NRG's generation and demand response assets located in the East region of the U.S. are within the control areas of ISO-NE, MISO, NYISO and PJM. Each of the market regions in the East region provides for robust competition in the day-ahead and real-time energy and ancillary services markets. Additionally, the East region receives a significant portion of its revenues from capacity markets in ISO-NE, MISO, NYISO and PJM. PJM and ISO-NE use a three-year forward capacity auction, while NYISO uses a month-ahead capacity auction. MISO has an annual auction, known as the Planning Resource Auction. Capacity market prices are sensitive to design parameters, as well as additions of new capacity. Both ISO-NE and PJM operate a pay-for-performance model where capacity payments are modified based on real-time generator performance. In such markets, NRG’s actual revenues will be the combination of cleared auction prices times the quantity of MWs cleared, plus the net of any over-performance "bonus payments" and any under-performance charges. In both markets, bidding rules allow for the incorporation of a risk premium into generator bids.
In the West region, NRG operates a fleet of natural gas fired facilities located entirely within the CAISO footprint. The CAISO operates day-ahead and real-time locational markets for energy and ancillary services, while managing congestion primarily through nodal prices. The CAISO system facilitates NRG's sale of power, ancillary services and capacity products at market-based rates, either within the CAISO's centralized energy and ancillary service markets or bilaterally pursuant to tolling arrangements or other capacity sales with California's LSEs. The CPUC also determines capacity requirements for LSEs and for specified local areas utilizing inputs from the CAISO. Both the CAISO and CPUC rules require LSEs to contract with sufficient generation resources in order to maintain minimum levels of generation within defined local areas. Additionally, the CAISO has independent authority to contract with needed resources under certain circumstances, typically either when LSEs have failed to procure sufficient resources, or system conditions change unexpectedly.
The Company’s Agua Caliente and Ivanpah projects are party to PPAs with PG&E. Both projects have project financing with the U.S. DOE, and Agua Caliente Borrower 1 LLC, along with Agua Caliente Borrower 2 LLC, which is owned by Clearway Energy Inc., are party to a back leverage financing related to the Agua Caliente project. On January 29, 2019, PG&E Corp. and subsidiary utility PG&E filed for Chapter 11 bankruptcy protection. For further discussion see Item 1 - Energy Regulatory Matters, Note 11 - Debt and Capital Leases and Note 15 - Investments Accounted for by the Equity Method and Variable Interest Entities.
Energy Regulatory Matters
As owners of power plants and participants in retail and wholesale energy markets, certain NRG entities are subject to regulation by various federal and state government agencies. These include the CFTC, FERC, NRC and the PUCT, as well as other public utility commissions in certain states where NRG's generating or distributed generation assets are located. In addition, NRG is subject to the market rules, procedures and protocols of the various ISO and RTO markets in which it participates. Likewise, certain NRG entities participating in the retail markets are subject to rules and regulations established by the states in which NRG entities are licensed to sell at retail. NRG must also comply with the mandatory reliability requirements imposed by NERC and the regional reliability entities in the regions where NRG operates.
NRG's operations within the ERCOT footprint are not subject to rate regulation by FERC, as they are deemed to operate solely within the ERCOT market and not in interstate commerce. These operations are subject to regulation by the PUCT, as well as to regulation by the NRC with respect to NRG's ownership interest in STP.
Federal Energy Regulation
Complaints Ahead of PG&E Corporation Bankruptcy Filing — On January 18, 2019, NextEra filed a petition for declaratory order requesting that FERC assert its jurisdiction over PG&E's wholesale contracts prior to PG&E's formal bankruptcy filing. Exelon Corporation and EDF Renewables filed similar complaints. On January 25, 2019, FERC found that it and the bankruptcy courts have concurrent jurisdiction to review and address the disposition of wholesale power contracts. The matter is in litigation.
State Energy Regulation
State Out-Of-Market Subsidy Proposals — NRG has opposed efforts to provide out-of-market subsidies and intends to continue opposing them in the future. NRG has petitioned the Supreme Court of the United States to hear cases from the Seventh and Second Circuit Courts regarding ZECs in Illinois and New York, respectively. NRG is also currently participating in the NJBPU's proceeding regarding ZECs, and is involved in the informational meetings that the PA PUC is holding regarding the nuclear subsidy issue.
Regional Regulatory Developments
NRG is affected by rule/tariff changes that occur in the ISO regions. For further discussion on regulatory developments see Item 15 — Note 22, Regulatory Matters, to the Consolidated Financial Statements.
PJM
Capacity Market Reforms Filing — FERC is considering various proposals to reform the PJM capacity market, including whether to accommodate state subsidies in the wholesale market or to mitigate subsidized resources, along with other changes. As part of this process, FERC established a procedural timetable and delayed the 2019 Base Residual Auction until August 2019. Decisions around harmonizing federal and state policy initiatives is a critical factor for setting future prices.
New England
ISO-NE Retention of Mystic Units — ISO-NE is currently engaged in extensive litigation at FERC regarding how to ensure system reliability in a gas-constrained system. In particular, FERC has approved ISO-NE's proposal to retain units at the Mystic generating station, which utilizes liquefied natural gas for fuel security. Among other things, FERC specifically will allow resources retained for fuel security to enter a zero bid in the Forward Capacity Auction. On January 2, 2019, multiple parties filed for rehearing. The motions for rehearing are pending at FERC. The outcome of this matter will potentially affect future capacity market prices.
New York
Independent Power Producers of New York Complaint — A variety of generators have requested that FERC address the market impacts of out-of-market payments to existing generation in the NYISO. This request was prompted by the ZEC program initiated by the NYSPSC in 2013, with various requests for FERC to act since. The generators asked FERC to direct the NYISO to require that capacity from existing generation resources that would have exited the market but for out-of-market payments be mitigated. Failure to implement buyer-side mitigation measures could result in uneconomic entry, which artificially decreases capacity prices below competitive market levels.
New York Public Service Commission Retail Energy Market Proceedings — On February 23, 2016, the NYSPSC issued what it refers to as its "Retail Reset" order. Among other things, the Reset Order placed a price cap on energy supply offers and imposed burdensome new regulations on customers. Various parties have challenged the NYPSC's authority to regulate prices charged by competitive suppliers, and that litigation is ongoing.
Texas
ORDC Reforms — In January 2019, the PUCT directed ERCOT to implement changes to its scarcity pricing structure, known as the ORDC, which is designed to increase the likelihood of scarcity pricing to support existing generation and new investment. The PUCT directed ORDC reforms to be implemented in two phases of gradually increasing magnitude. The first phase will become effective prior to the summer of 2019 and the second phase will become effective prior to the summer of 2020.
Environmental Regulatory Matters
NRG is subject to numerous environmental laws in the development, construction, ownership and operation of projects. These laws generally require that governmental permits and approvals be obtained before construction and during operation of power plants. Federal and state environmental laws historically have become more stringent over time. Future laws may require the addition of emissions controls or other environmental controls or impose restrictions on our operations, which could affect the Company's operations. Complying with environmental laws often involves significant capital and operating expenses, as well as occasionally curtailing operations. NRG decides to invest capital for environmental controls based on the relative certainty of the requirements, an evaluation of compliance options, and the expected economic returns on capital.
A number of regulations that may affect the Company are under review by the EPA, including ESPS for GHGs, ash disposal requirements, NAAQS revisions and implementation and effluent limitation guidelines. NRG will evaluate the impact of these regulations as they are revised but cannot fully predict the impact of each until anticipated revisions and legal challenges are resolved.
Air
The CAA and the resulting regulations (as well as similar state and local requirements) have the potential to affect air emissions, operating practices and pollution control equipment required at power plants. Under the CAA, the EPA sets NAAQS for certain pollutants including SO2, ozone, and PM2.5. Many of the Company's facilities are located in or near areas that are classified by the EPA as not achieving certain NAAQS (non-attainment areas). The relevant NAAQS have become more stringent. The Company maintains a comprehensive compliance strategy to address continuing and new requirements. Complying with increasingly stringent air regulations could require the installation of additional emissions control equipment at some NRG facilities or retiring of units if installing such controls is not economic. Significant changes to air regulatory programs affecting the Company are described below.
MATS — In 2012, the EPA promulgated standards (the MATS rule) to control emissions of HAPs from coal and oil-fired electric generating units. The rule established limits for mercury, non-mercury metals, certain organics and acid gases, which had to be met beginning in April 2015. In December 2018, the EPA proposed a finding that regulating HAPs was not "appropriate and necessary" because the costs far exceed the benefits. Nonetheless, the EPA proposed keeping the substantive requirements of the MATS rule. While NRG cannot predict the final outcome of this rulemaking, NRG believes that because it has already invested in pollution controls and cleaner technologies, the fleet is well-positioned to comply with the MATS rule.
Clean Power Plan — The attention in recent years on GHG emissions has resulted in federal regulations and state legislative and regulatory action. In October 2015, the EPA finalized the CPP, addressing GHG emissions from existing EGUs. On February 9, 2016, the U.S. Supreme Court stayed the CPP. The D.C. Circuit heard oral argument on the legal challenges to the CPP in September 2016. At the EPA's request, the D.C. Circuit agreed on April 28, 2017 to hold the case in abeyance. On October 16, 2017, the EPA proposed a rule to repeal the CPP. In August 2018, the EPA published the proposed Affordable Clean Energy, or ACE, rule to replace the CPP. The ACE rule proposes that the EPA would provide guidelines for states to in turn require heat rate improvements at coal-fired EGUs to reduce GHG emissions.
Byproducts, Wastes, Hazardous Materials and Contamination
In April 2015, the EPA finalized the rule regulating byproducts of coal combustion (e.g., ash and gypsum) as solid wastes under the RCRA. In September 2017, the EPA agreed to reconsider the rule. On July 30, 2018, the EPA promulgated a rule that amends the existing ash rule by extending some of the deadlines and providing more flexibility for compliance. On August 21, 2018, the D.C. Circuit found, among other things, that the EPA had not adequately regulated unlined ponds and legacy ponds. Accordingly, we anticipate that the EPA will promulgate new regulations to address these issues (including compliance deadlines) as it reconsiders other aspects of the existing rule. The EPA has stated that it intends to further revise the rule. The Company will provide estimates of the cost of compliance after the rule is revised.
Domestic Site Remediation Matters
Under certain federal, state and local environmental laws, a current or previous owner or operator of a facility, including an electric generating facility, may be required to investigate and remediate releases or threatened releases of hazardous or toxic substances or petroleum products. NRG may be responsible for property damage, personal injury and investigation and remediation costs incurred by a party in connection with hazardous material releases or threatened releases. These laws impose liability without regard to whether the owner knew of or caused the presence of the hazardous substances, and the courts have interpreted liability under such laws to be strict (without fault) and joint and several. Cleanup obligations can often be triggered during the closure or decommissioning of a facility, in addition to spills during its operations. Further discussions of affected NRG sites can be found in Item 15 — Note 23, Environmental Matters, to the Consolidated Financial Statements.
Nuclear Waste — The federal government's program to construct a nuclear waste repository at Yucca Mountain, Nevada was discontinued in 2010. Since 1998, the U.S. DOE has been in default of the federal government's obligations to begin accepting spent nuclear fuel, or SNF, and high-level radioactive waste, or HLW, under the Nuclear Waste Policy Act. Owners of nuclear plants, including the owners of STP, had been required to enter into contracts setting out the obligations of the owners and the U.S. DOE, including the fees to be paid by the owners for the U.S. DOE's services to license a spent fuel repository. Effective May 16, 2014, the U.S. DOE stopped collecting the fees.
On February 5, 2013, STPNOC entered into a settlement agreement with the U.S. DOE for payment of damages relating to the U.S. DOE's failure to accept SNF and HLW under the Nuclear Waste Policy Act through December 31, 2013, which was extended through an addendum dated January 24, 2014, to December 31, 2016. On December 12, 2016, STPNOC received the federal government's offer of another three-year extension of payment for continued failure to accept SNF and HLW. The proposal was reviewed and accepted. There are no facilities for the reprocessing or permanent disposal of SNF currently in operation in the U.S., nor has the NRC licensed any such facilities. STPNOC currently stores all SNF generated by its nuclear generating facilities in on-site storage pools. Since STPNOC's SNF storage pools do not have sufficient storage capacity for the life of the units, STPNOC is proceeding to construct dry cask storage capability on-site. STPNOC plans to continue to assert claims against the U.S. DOE for damages relating to the U.S. DOE's failure to accept SNF and HLW.
Under the federal Low-Level Radioactive Waste Policy Act of 1980, as amended, the state of Texas is required to provide, either on its own or jointly with other states in a compact, for the disposal of all low-level radioactive waste generated within the state. STP's warehouse capacity is adequate for on-site storage until a site in Andrews County, Texas becomes fully operational.
Water
The Company is required under the CWA to comply with intake and discharge requirements, requirements for technological controls and operating practices. As with air quality regulations, federal and state water regulations have become more stringent and imposed new requirements.
Once Through Cooling Regulation — In August 2014, EPA finalized the regulation regarding the use of water for once through cooling at existing facilities to address impingement and entrainment concerns. While NRG anticipates that more stringent requirements will be incorporated into some of its water discharge permits over the next several years as NPDES permits are renewed, the Company anticipates the cost of complying with these restrictions to be immaterial.
Effluent Limitations Guidelines — In November 2015, the EPA revised the Effluent Limitations Guidelines for Steam Electric Generating Facilities, which would have imposed more stringent requirements (as individual permits were renewed) for wastewater streams from flue gas desulfurization, fly ash, bottom ash, and flue gas mercury control. In April 2017, the EPA granted two petitions to reconsider the rule and also administratively stayed some of the deadlines. On September 18, 2017, the EPA promulgated a final rule that (i) postpones the compliance dates to preserve the status quo for FGD wastewater and bottom ash transport water by two years to November 2020 until the EPA completes its next rulemaking and (ii) withdrew the April 2017 administrative stay. The legal challenges have been suspended while the EPA reconsiders and likely modifies the rule. Accordingly, the Company has eliminated its estimate of the environmental capital expenditures that would have been required to comply with permits incorporating the revised guidelines. The Company will revisit these estimates after the rule is revised.
Regional Environmental Developments
Burton Island Old Ash Landfill — In January 2006, NRG's Indian River Power LLC was notified that it may be a potentially responsible party with respect to Burton Island Old Ash Landfill, a historic captive landfill located at the Indian River facility. On October 1, 2007, NRG signed an agreement with DNREC to investigate the site through the Voluntary Clean-up Program, or the VCP. On February 4, 2008, DNREC issued findings that no further action was required in relation to surface water and that a previously planned shoreline stabilization project would satisfactorily address shoreline erosion. The landfill itself required a Remedial Investigation and Feasibility Study to determine the type and scope of any additional required work. DNREC approved the Feasibility Study in December 2012. In January 2013, DNREC proposed a remediation plan based on the Feasibility Study. The remediation plan was approved in October 2013. In December 2015, DNREC approved the Company's remediation design, the Company's Closure Report and the Company's Long Term Stewardship Plan. The cost of completing the work required by the approved remediation plan is consistent with amounts budgeted in early 2016 and remediation was completed in 2017. The estimated cost to comply with the Long-Term Stewardship Plan was added to the liability in 2016.
In addition to the VCP, on May 29, 2008, DNREC requested that NRG's Indian River Power LLC participate in the development and performance of a Natural Resource Damage Assessment at the Burton Island Old Ash Landfill. NRG is working with DNREC and other trustees to close out the assessment process.
Customers
NRG sells to a wide variety of customers. ERCOT accounted for 11% of NRG's total revenue in 2018. The Company owns and operates power plants to generate and sell power to wholesale customers such as utilities and other intermediaries. The Company also directly sells to end-use customers in the residential, commercial and industrial sectors. NRG also receives significant revenues from PJM in its capacity as the regional transmission organization for the PJM footprint.
Employees
As of December 31, 2018, NRG and its consolidated subsidiaries had 4,862 employees, approximately 26% of whom were covered by U.S. bargaining agreements. During 2018, the Company did not experience any labor stoppages or labor disputes at any of its facilities.
Available Information
NRG's annual reports on Form 10-K, quarterly reports on Form 10-Q, current reports on Form 8-K, and amendments to those reports filed or furnished pursuant to section 13(a) or 15(d) of the Exchange Act are available free of charge through the Company's website, www.nrg.com, as soon as reasonably practicable after they are electronically filed with, or furnished to, the SEC. The Company also routinely posts press releases, presentations, webcasts, sustainability reports and other information regarding the Company on the Company's website. The information posted on the Company's website is not a part of this report.
Previous: Cover and table of contents · Next: Item 1A. Risk Factors Related to NRG Energy, Inc.