 filings.tools
Item 5. Market for Registrant's Common Equity, Related Stockholder Matters and Issuer Purchases of Equity Securities.
5K characters. Original on sec.gov ·
Item 5. Market for Registrant's Common Equity, Related Stockholder Matters and Issuer Purchases of Equity Securities.
Market Information and Holders
NRG's common stock trades on the New York Stock Exchange under the symbol "NRG." NRG's authorized capital stock consists of 500,000,000 shares of common stock and 10,000,000 shares of preferred stock. A total of 25,000,000 shares of the Company's common stock are authorized for issuance under the NRG LTIP. No shares of NRG common stock were available for future issuance under the NRG GenOn LTIP. For more information about the NRG LTIP and the NRG GenOn LTIP, refer to Item 12 — Security Ownership of Certain Beneficial Owners and Management and Related Stockholder Matters and Item 15 — Note 21, Stock-Based Compensation, to the Consolidated Financial Statements*.*
As of January 31, 2020, there were 18,378 common stockholders of record.
Beginning in the first quarter of 2020, NRG increased the annual dividend to $1.20 per share from $0.12 per share and expects to target an annual dividend growth rate of 7-9% per share in subsequent years.
Issuer Purchases of Equity Securities
The table below sets forth the information with respect to purchases made by or on behalf of NRG or any "affiliated purchaser" (as defined in Rule 10b-18(a)(3) under the Exchange Act) of NRG's common stock during the quarter ended December 31, 2019.
| For the three months ended December 31, 2019 | Total Number of Shares Purchased | Average Price Paid per Share(b) | Total Number of Shares Purchased as Part of Publicly Announced Plans or Programs | Approximate Dollar Value of Shares that May Yet Be Purchased Under the Plans or Programs(c) | ||||||||||||||||||||||
| Month #1 | ||||||||||||||||||||||||||
| (October 1, 2019 to October 31, 2019, | 441,112 | $ | 39.10 | 441,112 | $ | 194,832,497 | ||||||||||||||||||||
| Month #2 | ||||||||||||||||||||||||||
| (November 1, 2019 to November 30, 2019, | 1,639,846 | $ | 39.19 | 1,639,846 | $ | 130,537,517 | ||||||||||||||||||||
| Month #3 | ||||||||||||||||||||||||||
| (December 1, 2019 to December 31, 2019) | 985,444 | $ | 39.35 | 985,444 | $ | 91,738,742 | ||||||||||||||||||||
| Total at December 31, 2019 | 3,066,402 | $ | 39.23 | 3,066,402 | ||||||||||||||||||||||
(a)In 2019, the Company's board of directors authorized the Company to repurchase $1.25 billion of its common stock. A $1.0 billion program was announced on February 28, 2019 and a $0.25 billion program was announced on August 7, 2019. Under the 2019 programs, the Company completed $1.25 billion share repurchases through February 27, 2020
(b)The average price paid per share excludes commissions of $0.02 per share paid in connection with the open market share repurchases
(c)Includes commissions of $0.02 per share paid in connection with the open market share repurchases
Stock Performance Graph
The performance graph below compares the cumulative total stockholder return on NRG's common stock for the period December 31, 2014 through December 31, 2019 with the cumulative total return of the Standard & Poor's 500 Composite Stock Price Index, or S&P 500, and the Philadelphia Utility Sector Index, or UTY.
The performance graph shown below is being furnished and compares each period assuming that $100 was invested on December 31, 2014, in each of the common stock of NRG, the stocks included in the S&P 500 and the stocks included in the UTY, and that all dividends were reinvested.
Comparison of Cumulative Total Return
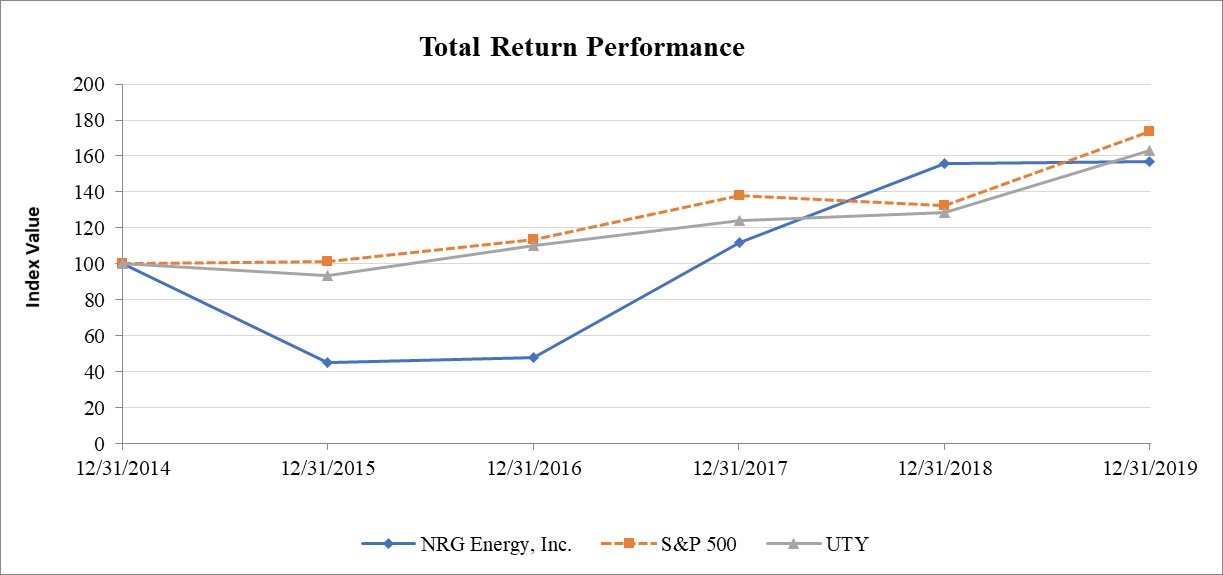
| 12/31/2014 | 12/31/2015 | 12/31/2016 | 12/31/2017 | 12/31/2018 | 12/31/2019 | ||||||||||||||||||||||||||||||
| NRG Energy, Inc. | $ | 100.00 | $ | 44.97 | $ | 47.85 | $ | 111.82 | $ | 156.09 | $ | 157.16 | |||||||||||||||||||||||
| S&P 500 | 100.00 | 101.38 | 113.51 | 138.29 | 132.23 | 173.86 | |||||||||||||||||||||||||||||
| UTY | 100.00 | 93.75 | 110.05 | 124.16 | 128.53 | 163.00 |
Previous: Item 4. Mine Safety Disclosures · Next: Item 6. Selected Financial Data