 filings.tools
NetApp (NTAP) 10-K risk factor changes: FY2019 vs FY2018
The 2019-04-26 10-K against the 2018-04-27 one, compared heading by heading and sentence by sentence. One of these filings carries no fiscal year tag, so its year is the calendar year of the period end.
Item 1A61 rewritten10 added11 removed271 unchanged
All filing items933 rewritten589 added384 removed1,811 unchanged
Summary
counted, not written
- Item 1A headings could not be compared: only 0 carried over between the two years, which usually means one filing was read wrongly, so none is reported as new or removed.
- Sentence by sentence, 589 added, 384 removed, 933 rewritten and 1,811 unchanged across 16 items that differ.
Sentences by item
21 items, with every count and a link to each item that changed
Underlined words on a shaded ground are new in FY2019; struck-through words were in FY2018. Sentences that are wholly new or wholly gone are labelled rather than marked.
Item 1A. Risk Factors
61 rewritten, 10 added, 11 removed, 271 unchanged
Our business may be harmed by [added: technological] trends in [removed: the networked storage hardware] [added: our] market or if we are unable to keep pace with rapid industry, technological and market changes.
However, despite continued data growth, [added: our traditional market,] the networked storage hardware [removed: market] [added: market,] experienced a decline in each of the last three calendar years due to a combination of customers delaying purchases in the face of technology transitions, increasing adoption of Cloud environments built on commodity hardware, increased storage efficiency, and changing economic and business environments.
While customers are navigating through their [removed: IT] [added: information technology (IT)] transformations, which leverage modern architectures and hybrid cloud environments, they are also reducing IT budgets, looking for simpler solutions, and rethinking how they consume IT.
As a result of these and other factors discussed in the report, our revenue may decline [added: on a year-over-year basis,] as it did in fiscal years 2015, 2016 and [removed: 2017, on a year-over year basis.][added: 2017.]
If we are unable to develop, introduce and gain market acceptance for new products [added: and services] while managing the transition from older [removed: products,] [added: ones,] or if we cannot provide the expected level of [removed: quality, service] [added: quality] and support for our new [removed: products,] [added: products and services,] our business, operating results and financial condition could be harmed.
Our future growth depends upon the successful development and introduction of new hardware and software products and [removed: related] services.
New or additional product introductions, including new hardware and software offerings, such as NetApp HCI, Cloud Volumes ONTAP, and new all flash storage products, subject us to additional financial and operational risks, including our ability to forecast customer preferences and/or demand, our ability to successfully manage the transition from older products and solutions, our ability to forecast the impact of customers’ demand for new [removed: products] [added: products, services] and solutions or the products being replaced, and our ability to manage production capacity to meet the demand for new [removed: products.][added: products and services.]
In addition, as new or enhanced products [added: and services] are introduced, we must also avoid excessive levels of older product inventories and related components and ensure that [removed: enough supplies of] new products [added: and services] can be delivered to meet customers’ demands.
Further risks inherent in [added: the introduction of] new [removed: product] [added: products, services] and solutions [removed: introductions] include the uncertainty of price-performance relative to products of competitors, competitors’ responses to the introductions, delays in sales caused by the desire of customers to evaluate new products for extended periods of time and our partners’ investment in selling our new products and solutions.
[removed: Our new consumption based] [added: Transition to consumption-based] business models may adversely affect our revenues and [removed: profitability.][added: profitability in other areas of our business.]
These business models continue to evolve, and we may not be able to compete effectively, generate significant revenues or maintain the profitability of our [removed: consumption based] [added: consumption-based] offerings.
Additionally, the increasing prevalence of cloud and SaaS delivery models offered by us and our competitors may unfavorably impact the pricing of our on-premise hardware and software offerings and could [removed: have a dampening impact on overall demand for our on-premise hardware and software product and service offerings, which could]
As customer demand for our consumption model offerings increases, we [removed: could] [added: will] experience [removed: volatility in our reported revenues and operating results due to] differences in the timing of revenue recognition between our traditional hardware and software license arrangements, [added: including for the software license components of enterprise software license agreements] (for which revenue is generally recognized in full at the time of delivery), relative to our consumption model offerings, (for which revenue is generally recognized ratably over the term of the arrangement).
Qualifying and developing new indirect channel partners typically [removed: require] [added: requires] a significant investment of time and resources before acceptable levels of productivity are met.
We compete with many companies in the markets we serve, including established public companies, [removed: newly] [added: newer] public companies with a strong flash focus, and new market entrants addressing the growing opportunity for hyper-converged systems.
Competitors may develop new technologies or products in advance of us or establish [added: new] business [added: models, more flexible contracting] models or [added: new] technologies disruptive to us.
An increase in industry consolidation might result in stronger competitors that are better able to compete as [removed: full stack] [added: full-stack] vendors for customers and achieve increased economies of scale in the supply chain.
[removed: Also] [added: Also,] in April 2017, HP Enterprise completed their acquisition of Nimble Storage.
Continuing global economic uncertainty, political conditions and fiscal challenges in the United States (U.S.) and abroad have, among other things, limited our ability to forecast future demand for our products, contributed to increased periodic volatility in the computer, storage and networking industries at large, as well as the [removed: information technology (IT)] [added: IT] market, and could constrain future access to capital for our suppliers, customers and partners.
| | • | Linearity, such as our historical intra-quarter bookings and revenue pattern in which a disproportionate percentage of each quarter’s total bookings and related revenue occur in the last month of the [removed: quarter.] [added: quarter; and] |
Our gross margins reflect a variety of factors, including competitive pricing, component and product design, [added: and] the volume and relative mix of [added: revenues from] product, software maintenance, hardware maintenance and other services [removed: revenues.][added: offerings.]
Increased component costs, increased pricing and discounting pressures, the relative and varying rates of increases or decreases in component costs and product prices, [added: or] changes in [added: the mix of revenue or decreased volume from] product, software maintenance, hardware maintenance and other services [removed: revenue mix or decreased volume] [added: offerings] could harm our revenues, gross margins or earnings.
We base our expense levels in part on future revenue expectations and a significant percentage of our expenses [removed: is] [added: are] fixed.
A loss, cancellation or delay in purchases by any of these parties has negatively affected [removed: us] [added: our revenues] in the past, and [removed: in the future could,] [added: could] negatively affect our [removed: revenues.][added: revenues in the future.]
A significant portion of our net revenues are generated through sales to a limited number of [added: customers and] distributors.
We rely on a limited number of suppliers for drives and other components utilized in the assembly of our products, including certain single source suppliers, which has subjected us, and could in the future subject [removed: us] [added: us,] to price rigidity, periodic supply constraints, and the inability to produce our products with the quality and in the quantities demanded.
- The potential for binding price or purchase commitments with our suppliers [removed: that are] [added: at] higher than market rates;
Such risks have [removed: in the past] [added: subjected us,] and could [removed: again] in the future subject [removed: us] [added: us,] to supply constraints, price increases and minimum purchase requirements and our business, operating results and financial condition could be harmed.
The risks associated with our [removed: out-sourced] [added: outsourced] manufacturing model are particularly acute when we transition products to new facilities or manufacturers, introduce and increase volumes of new products or qualify new contract manufacturers or suppliers, at which times our ability to manage the relationships among us, our manufacturing partners and our component suppliers, becomes critical.
A significant portion of our operations [removed: is] [added: are] located, and a significant portion of our revenues [removed: is] [added: are] derived, outside of the U.S. In addition, most of our products are manufactured outside of the U.S., and we have research and development, sales and service centers overseas.
Accordingly, our business and [removed: our] future operating results could be adversely impacted by factors affecting our international operations including, among other things, local political or economic conditions, trade protection and export and import requirements, tariffs, local labor conditions, transportation costs, government spending patterns, acts of terrorism, international conflicts and natural [added: disasters in areas with limited infrastructure.]
[removed: We are also subject to the potential loss of proprietary information due to] piracy, misappropriation, or laws that may be less protective of our intellectual property rights than U.S. laws.
The [removed: recent] U.S. tax law changes enacted through the Tax Cuts and Jobs Act [added: effective in December 2017] are subject to further interpretations from the U.S. federal and state governments and regulatory organizations, such as the Treasury Department and/or [removed: IRS.][added: Internal Revenue Service.]
Changes to interpretations of the law could change the [removed: provisional tax expense] [added: amount] or accounting treatment of the [removed: $732 million] expense we have recorded in relation to the transition tax.
For example, in [removed: May 2015,] March [removed: 2016 and] [added: 2016,] November [removed: 2016] [added: 2016, May 2018, and April 2019] we executed restructuring events designed to streamline our business, reduce our cost structure and focus our resources on key strategic opportunities.
We also reorganized our sales resources to [removed: improve the alignment of those resources] [added: better align] with customer and market opportunities.
Any decision to take these actions may result in charges to earnings associated with, among other things, inventory or other fixed, intangible or goodwill asset reductions (including, without limitation, impairment charges), workforce and facility reductions and penalties and claims from [removed: third party] [added: third-party] resellers or users of discontinued products.
Such quality issues may be due to, for example, our own designs or processes, the designs or processes of our suppliers, and/or flaws in [removed: third party] [added: third-party] software used in our products.
If a cybersecurity or other security breach occurs on our systems or on our [removed: end user] [added: end-user] customer systems, or if stored data is improperly accessed, customers may reduce or cease using our solutions, our reputation may be harmed and we may incur significant liabilities.
[added: In addition, a cybersecurity incident or loss of personal information could result] in other negative consequences, including remediation costs, disruption of internal operations, increased cybersecurity protection costs and lost revenues.
have a dampening impact on overall demand for our on-premise hardware and software product and service offerings, which could reduce our revenues and profitability, at least in the near term.
| | • | Unpredictability associated with larger scale enterprise software license agreements which generally take longer to negotiate and occur less consistently than other types of contracts, and for which revenue attributable to the software license component is typically recognized in full upon delivery. |
| --- | --- | --- |
In particular, the current trade tensions between the U.S. and China, including newly imposed tariffs, and the United Kingdom’s pending withdrawal from the European Union, which is now scheduled to be effective on October 31, 2019, could impact our business and operating results.
For products we manufacture in Mexico, tensions between the U.S. and Mexico related to trade and border security issues could delay our shipments to customers, or impact pricing or our business and operating results.
We are also subject to the potential loss of proprietary information due to
The successful assertion of one or more large claims against us that exceeds available insurance coverage, or the occurrence of changes in our insurance policies,
Initiatives intended to make our cost structure, business processes and systems more efficient may not achieve the expected benefits and could inadvertently have an adverse effect on our business, operating results and financial condition.
Furthermore, if
We may not be able to
reduce our revenues and profitability, at least in the near term.
disasters in areas with limited infrastructure.
In particular, the current trade tensions with China could impact our business and operating results.
Additional risks inherent in our international business activities generally include, among others, longer accounts receivable payment cycles and difficulties in managing international operations.
In addition, a cybersecurity incident or other security breach could result
In addition, a security incident or loss of personal information could result in other negative consequences, including remediation costs, disruption of internal operations, increased cybersecurity protection costs and lost revenues.
We are continually seeking ways to make our cost structure, business processes and systems more efficient, including by moving activities from higher-cost to lower-cost locations, outsourcing certain business processes and functions, and implementing new business information systems.
Problems with the execution of these activities could have an adverse effect on our business, operating results and financial condition.
In addition, we may not achieve the expected benefits of these initiatives.
service or refinance our debt, our business, operating results and financial condition will be harmed.
conduct business.
An excerpt. Shown here: 40 of 61 rewritten, all 10 added and all 11 removed. The counts are complete. For every sentence, read Item 1A. Risk Factors in the FY2019 filing and the FY2018 filing.
Item 7. Management’s Discussion and Analysis of Financial Condition and Results of Operations
219 rewritten, 97 added, 106 removed, 321 unchanged
[removed: We are] [added: NetApp is] the data authority for [removed: the] hybrid cloud.
Together with our partners, we empower global organizations to unleash the full potential of their data to [removed: enable new] [added: expand] customer touchpoints, [removed: create innovative business opportunities] [added: foster greater innovation] and optimize [added: their] operations.
Our Data Fabric [removed: simplifies and integrates data management across clouds and on-premises to accelerate digital transformation, enabling] [added: approach enables] our customers to manage, secure and protect their data [added: from on-premises to public to hybrid clouds, all] at the scale needed to accommodate the exponential data growth of the digital world.
NetApp’s unique approach to [removed: managing] data [removed: holistically] [added: services] enables organizations to inspire innovation with the cloud, build clouds to accelerate new services, and modernize IT architecture with cloud-connected flash.
Customers can break free from the limits of first-generation HCI with NetApp HCI and attain guaranteed performance with high levels [added: of] flexibility, scale, automation, and integration with the Data Fabric.
Flash plays a key role in customers’ digital transformation efforts as they seek to gain advantage through greater speed, responsiveness and value from key business [removed: applications - all] [added: applications—all] while lowering total cost of ownership.
All-flash array technology is the de facto choice [removed: for primary application workloads] as customers seek performance and economic benefits from replacing hard disk installations.
To provide visibility into our transition from older products to our newer, higher growth products and clarity into the dynamics of our product revenue, we [removed: group] [added: have historically grouped] our products by “Strategic” and “Mature” solutions.
Strategic solutions include Clustered ONTAP, branded E-Series, SolidFire, converged and hyper-converged infrastructure, [added: enterprise software license agreements (ELAs)] and [added: other] optional add-on software products.
| | | April [removed: 27, 2018] [added: 26, 2019] | | | | April [removed: 28, 2017] [added: 27, 2018] | | | | April [removed: 29, 2016] [added: 28, 2017] | | |
| Gross profit | | [removed: $] | [removed: 3,699] [added: 64] | | | [removed: $] | [removed: 3,390] [added: 63] | | | [removed: $] | [removed: 3,373] [added: 61] | | [added: |]
| Gross profit margin percentage | | | [removed: 63] [added: 64] | % | | | [removed: 61] [added: 63] | % | | | 61 | % |
| Income from operations | | [removed: $] | [removed: 1,125] [added: 20] | | | [removed: $] | [removed: 665] [added: 20] | | | [removed: $] | [removed: 348] [added: 11] | | [added: |]
| Income from operations as a percentage of net revenues | | | [removed: 19] [added: 20] | % | | | [removed: 12] [added: 20] | % | | | [removed: 6] [added: 11] | % |
| Provision for income taxes | | [removed: $] | [removed: 1,090] [added: 2] | | | [removed: $] | [removed: 156] [added: 18] | | | [removed: $] | [removed: 116] [added: 3] | | [added: |]
| Net income | | [removed: $] | [removed: 76] [added: 19] | | [added: %] | [removed: $] | [removed: 509] [added: 2] | | [added: %] | [removed: $] | [removed: 229] [added: 9] | | [added: % |]
| Diluted net income per share | | $ | [removed: 0.28] [added: 4.51] | | | $ | [removed: 1.81] [added: 0.42] | | | $ | [removed: 0.77] [added: 1.71] | |
| Operating cash flows | | $ | [removed: 1,478] [added: 1,341] | | | $ | [removed: 986] [added: 1,478] | | | $ | [removed: 974] [added: 986] | |
| [added: (In days)] | | April [added: 26, 2019 | | | | April] 27, 2018 | | | | April 28, 2017 | | |
| Deferred revenue and financed unearned services revenue | | $ | [removed: 3,477] [added: 3,668] | | | $ | [removed: 3,342] [added: 3,363] | |
| Cash conversion cycle [added: (4)] | | | [removed: (15] [added: 3] | [added: | | | (14 |] ) | | | 15 | |
| | • | Net revenues: Our net revenues increased [removed: 7%] [added: 4%] in fiscal [removed: 2018] [added: 2019] compared to fiscal [removed: 2017.] [added: 2018.] This was primarily due to an increase of [removed: 15%] [added: 7%] in product revenues, partially offset by a 3% decrease in software and hardware maintenance and other services revenues. |
| | • | Gross profit margin percentage: Our gross profit margin as a percentage of net revenues increased by one percentage point in fiscal [removed: 2018] [added: 2019] compared to fiscal [removed: 2017,] [added: 2018,] reflecting an increase in gross profit margin on product revenues, and, to a lesser extent, an increase in gross profit margin on hardware maintenance and other services revenues. |
| | • | Provision for income taxes: Our provision for income taxes [removed: increased] [added: decreased] significantly in fiscal [removed: 2018] [added: 2019] compared to fiscal [removed: 2017] [added: 2018] as [removed: a result of] significant charges [added: were] recorded in [added: fiscal 2018 in] connection with U.S. tax [removed: reform enacted in fiscal 2018.] [added: reform.] |
| | • | Net income and Diluted income per share: The [removed: 85% decrease] [added: increase] in both net income and diluted net income per share in fiscal [removed: 2018] [added: 2019] compared to fiscal [removed: 2017] [added: 2018] reflect the factors discussed above. Diluted net income per share was favorably impacted by a [removed: 2%] [added: 6%] decrease in the annual weighted average number of dilutive shares, primarily due to share repurchases. |
| | • | Operating cash flows: Operating cash flows [removed: increased] [added: decreased] by [removed: 50%] [added: 9%] in fiscal [removed: 2018] [added: 2019] compared to fiscal [removed: 2017,] [added: 2018,] reflecting changes in operating assets and liabilities, partially offset by [removed: lower] [added: higher] net income. |
| | • | Deferred revenue and financed unearned services revenue: Total deferred revenue and financed unearned services revenue increased [removed: $135] [added: $305] million, or [removed: 4%,] [added: 9%,] as of fiscal [removed: 2018] [added: 2019] year end compared to fiscal [removed: 2017] [added: 2018] year end primarily due to increases in the installed base and aggregate contract values under software and hardware maintenance contracts. |
| | • | Cash Conversion Cycle: Our cash conversion cycle was [removed: (15)] [added: 3] days in the fourth quarter of fiscal [removed: 2018,] [added: 2019,] compared to [removed: 15] [added: (14)] days in the corresponding period of fiscal [removed: 2017,] [added: 2018,] reflecting [removed: higher] [added: lower] Days Payables [removed: Outstanding and lower] [added: Outstanding, higher] Days Inventory Outstanding, [removed: partially offset by] [added: and] higher Days Sales Outstanding. |
During fiscal [removed: 2018,] [added: 2019,] we repurchased [removed: 15] [added: 29] million shares of our common stock at an average price of [removed: $51.57] [added: $72.87] per share, for an aggregate purchase price of [removed: $794 million.][added: $2.1 billion.]
We also declared cash dividends of an aggregate of [removed: $0.80] [added: $1.60] per share in fiscal [removed: 2018,] [added: 2019,] for which we paid an aggregate of [removed: $214] [added: $403] million.
[removed: On] [added: In] September [removed: 8,] 2017, we entered into an agreement to sell certain [removed: land and buildings] [added: properties previously classified as assets held-for-sale] for a total of $306 million, through two separate and independent closings.
[removed: On December 7, 2017,] [added: During fiscal 2018,] the first closing [removed: date,] [added: occurred, and] we consummated the sale of properties with a net book value of $66 [removed: million] [added: million,] for cash proceeds of $210 million, resulting in a gain, net of direct selling costs, of $142 million.
On December 22, 2017, the [removed: 2017] Tax [removed: Reform Reconciliation Act, originally referred to as the Tax] Cuts and Jobs Act [removed: (TCJA),] [added: (TCJA)] was enacted into law.
Revenue [removed: Recognition, Reserves and Allowances][added: Recognition]
The following are the key estimates and assumptions and corresponding uncertainties for [removed: recognizing revenue:][added: estimating the value of our goodwill and]
We allocate the purchase price of acquisitions to identifiable assets acquired and liabilities assumed at their acquisition date fair [added: values based on established valuation techniques.]
For our annual goodwill impairment test in the fourth quarter of fiscal [removed: 2018,] [added: 2019,] we performed a quantitative test and determined the fair value of our reporting unit substantially exceeded its carrying amount, therefore, found no impairment of goodwill.
The following are the key estimates and assumptions and corresponding uncertainties [removed: for estimating the value of our goodwill and purchased intangible assets:][added: included in this approach:]
Fiscal year [added: 2019, which ended on April 26, 2019, fiscal year] 2018, which ended on April 27, 2018, and fiscal year 2017, which ended on April 28, 2017, were each 52-week years.
| | | [removed: 2018] [added: 2019] | | | | [removed: 2017] [added: 2018] | | | | [removed: 2016] [added: 2017] | | | |
We provide a full range of hybrid cloud data services that simplify management of applications and data across cloud and on-premises environments to accelerate digital transformation.
Our Data Fabric simplifies the integration and orchestration of data for applications and analytics in clouds, across clouds and on-premises to accelerate digital transformation.
We deliver a Data Fabric with consistent data services for data visibility and insights, data access and control, and data protection and security, that unleashes the power of data to achieve a new competitive advantage.
| Net revenues | | $ | 6,146 | | | $ | 5,919 | | | $ | 5,491 | |
| Net income | | $ | 1,169 | | | $ | 116 | | | $ | 481 | |
| | | April 26, 2019 | | | | April 27, 2018 | | |
| | • | Income from operations as a percentage of net revenues: Our income from operations as a percentage of net revenues remained relatively flat in fiscal 2019 compared to fiscal 2018. |
Adoption of Revenue Accounting Standard
As of the beginning of fiscal 2019, we adopted the new accounting standard Revenue from Contracts with Customers (ASC 606) using the full retrospective method of adoption.
Accordingly, our prior years consolidated financial statements and supplementary data, as presented herein, have been restated to conform to the new rules.
As illustrated in Note 7 – Revenue of the Notes to Consolidated Financial Statements, the overall impact of adoption was not significant to prior years.
However, application of the new rules to our ELAs resulted in over $100 million of product revenues for such arrangements in fiscal 2019, that are incremental to the amounts we would have recognized under the old standard.
Under ASC 606, we recognize the software license fee component of our ELAs up-front, whereas under the prior rules the software license fee was recognized over the term of the ELA.
Restructuring Events
During fiscal 2019, we announced two separate restructuring and reduction in workforce plans designed to reduce costs and redirect resources to our highest return activities.
In connection with these plans, we reduced our worldwide headcount by less than 3%, and incurred aggregate charges of approximately $35 million, consisting primarily of employee severance costs.
Joint Venture
During fiscal 2019, we formed a joint venture with Lenovo (Beijing) Information Technology Ltd. (“Lenovo”) in China and, in February 2019, contributed assets to the newly formed entity, Lenovo NetApp Technology Limited (“LNTL”), which began operations the same month, in exchange for a non-controlling 49% equity interest.
The assets we contributed had an aggregate book value of $7 million, while the fair value of our equity interest in LNTL was determined to be $80 million, resulting in a gain of $73 million.
LNTL will be integral to our sales channels strategy in China, acting as a distributor of our offerings to customers headquartered there, and involved in certain OEM sales to Lenovo.
It will also endeavor to localize our products and services, and to develop new joint offerings for the China market by leveraging NetApp and Lenovo technologies.
Our contracts with customers often include the transfer of multiple products and services to the customer.
In determining the amount and timing of revenue recognition, we assess which products and services are distinct performance obligations and allocate the transaction price, which may include fixed and/or variable amounts, among each performance obligation on a relative standalone selling price (SSP) basis.
| • | We evaluate whether products and services promised in our contracts with customers are distinct performance obligations that should be accounted for separately versus together. | | • | In certain contracts, the determination of our distinct performance obligations requires significant judgment. As our business and offerings to customers change over time, the products and services we determine to be distinct performance obligations may change. Such changes may adversely impact the amount of revenue and gross margin we report in a particular period. |
| • | In determining the transaction price of our contracts, we estimate variable consideration based on the expected value, primarily relying on our history. In certain situations, we may also use the most likely amount as the basis of our estimate. | | • | We may have insufficient relevant historical data or other information to arrive at an accurate estimate of variable consideration using either the “expected value” or “most likely amount” method. Additionally, changes in business practices, such as those related to sales returns or marketing programs, may introduce new forms of variable consideration, as well as more complexity and uncertainty in the estimation process. |
| • | In contracts with multiple performance obligations, we establish SSPs based on the price at which products and services are sold separately. If SSPs are not observable through past transactions, we estimate them using available information including, but not limited to, market data and other observable inputs. | | • | As our business and offerings evolve over time, modifications to our pricing and discounting methodologies, changes in the scope and nature of product and service offerings and/or changes in customer segmentation may result in a lack of consistency, making it difficult to establish and/or maintain SSPs. Changes in SSPs could result in different and unanticipated allocations of revenue in contracts with multiple performance obligations. These factors, among others, may adversely impact the amount of revenue and gross margin we report in a particular period. |
| | | | | |
Sales and marketing, research and development, and general and administrative expenses for fiscal 2019 totaled $2,762 million, or 45% of net revenues, representing a decrease of two percentage points compared to fiscal 2018, primarily due to higher net revenues in the current year.
| Net revenues | | | $ | 6,146 | | | $ | 5,919 | | | | 4 | % | | $ | 5,491 | | | | 8 | % |
| Product revenues | | | $ | 3,755 | | | $ | 3,525 | | | | 7 | % | | $ | 3,060 | | | | 15 | % |
This increase was primarily due to over $100 million of revenues from the software license component of several ELAs in fiscal 2019 which, under ASC 606, were recognized up-front.
Comparable ELA revenues were immaterial in fiscal 2018.
Revenues generated from the sale of optional add-on software unrelated to ELAs, and hyperconverged infrastructure solutions also increased in fiscal 2019, offset by a decrease in unit volume of Clustered ONTAP systems.
Total product revenue from mature solutions totaled $1,046 million in fiscal 2019 reflecting a slight decrease from $1,057 million in fiscal 2018 due to our discontinuation of 7-mode systems in fiscal 2019, reflecting the movement of customers to our newer products, partially offset by an increase in add-on hardware, and related OS software revenues.
| | | | 2019 | | | | 2018 | | | | % Change | | | | 2017 | | | | % Change | | |
| | | | 2019 | | | | 2018 | | | | % Change | | | | 2017 | | | | % Change | | |
| | | 2019 | | | | 2018 | | | | 2017 | | |
During fiscal 2019, Americas revenues as a percentage of net revenues increased, reflecting higher product revenues, while EMEA revenues decreased slightly, primarily reflecting the unfavorable impact of foreign exchange rate fluctuations.
Our geographic distribution of revenues as a percentage of net revenues was relatively consistent in fiscal 2018 and fiscal 2017.
| | | | 2019 | | | | 2018 | | | | % Change | | | | 2017 | | | | % Change | | |
Digital transformation remains top of mind for executives.
In order to successfully digitally transform, data must become the lifeblood of an organization and be used as a business accelerator.
Data-driven digital transformations accelerate business outcomes.
It delivers integrated data management services and applications for data visibility and insights, data access and control, and data protection and security.
| --- | --- | --- |
Whether an organization is targeting an all-cloud, hybrid cloud, or multi-cloud strategy, NetApp Cloud Data Services accelerate the time it takes to deploy or develop an application by making the data requirements seamless to the application layer.
| Net revenues | | $ | 5,911 | | | $ | 5,519 | | | $ | 5,546 | |
| | • | Income from operations as a percentage of net revenues: Our income from operations as a percentage of net revenues increased in fiscal 2018 compared to fiscal 2017 primarily due to higher product gross margin and lower operating expenses as a result of a gain on sale of certain of our properties. |
Senior Notes Issuance and Redemption
In September 2017, we issued $400 million aggregate principal amount of 2.00% Senior Notes due on September 27, 2019 and $400 million aggregate principal amount of 3.30% Senior Notes due on September 29, 2024, for which we received total proceeds of approximately $795 million, net of discount and issuance costs.
On November 3, 2017, we extinguished our 2.00% Senior Notes due December 2017 for an aggregate redemption price of $751 million, plus accrued and unpaid interest.
Real Estate Transactions
In fiscal 2016, we entered into a sale-leaseback arrangement of certain of our land and buildings.
The arrangement did not qualify for sale-leaseback accounting and instead was accounted for as a financing transaction.
In December 2017, we terminated the leases and recorded a non-cash sale of properties with a net book value of $54 million, the extinguishment of $130 million in financing obligations, and a gain of $76 million.
Tax Reform
This tax reform legislation contains several key tax provisions that affected us, including a one-time mandatory transition tax on accumulated foreign earnings and a reduction of the U.S. corporate income tax rate to 21% effective January 1, 2018, among others.
Our net income in fiscal 2018 includes a one-time tax reform-related provisional charge of $858 million.
We recognize revenue when persuasive evidence of an arrangement exists, delivery has occurred, the fee is fixed or determinable and collection is reasonably assured.
Revenue from the sale of hardware systems and software components essential to the functionality of the hardware systems is recognized in accordance with general revenue recognition accounting guidance.
Our product revenues also include revenues from the sale of non-essential software products, which generally includes a perpetual license to our software.
Non-essential software sales are subject to industry specific software revenue recognition accounting guidance.
Software maintenance and hardware maintenance services revenues are recognized ratably over their contractual terms, generally from one to five years.
For multiple element arrangements, we allocate revenue to the software deliverables and the non-software deliverables as a group based on the relative selling prices of all of the deliverables in the arrangement.
For our non-software deliverables, we allocate the arrangement consideration based on the relative selling price of the deliverables using estimated selling price (ESP).
For our software maintenance services, we generally use vendor-specific objective evidence of selling price (VSOE).
When we are unable to establish VSOE for our software maintenance services, we use ESP in our allocation of arrangement consideration.
The selling price for each element is based upon the following selling price hierarchy: VSOE if available, third party evidence (TPE) if VSOE is not available, or ESP if neither VSOE nor TPE are available.
Generally, we are not able to determine TPE because our go-to-market strategy differs from that of our peers and our offerings contain a significant level of differentiation such that the comparable pricing of products with similar functionality cannot be obtained.
We record reductions to revenue for estimated sales returns at the time of shipment.
We also maintain a separate allowance for doubtful accounts for estimated losses based on our assessment of the collectability of specific customer accounts.
| • | We establish VSOE of selling price using the price charged for a deliverable when sold separately and generally evidenced by a substantial majority of historical stand-alone transactions falling within a reasonably narrow range. In addition, we consider major service type, customer type, and other variables in determining VSOE. Our revenue estimates and assumptions are based on our ability to assert and maintain VSOE. ESP is generally evidenced by a majority of historical transactions falling within a reasonable price range. We also consider multiple factors, including, but not limited to, cost of products, gross margin objectives, historical pricing practices, customer type and distribution channels. Our revenue estimates and assumptions are based on our ability to maintain consistent ESP. | | • | As our business and offerings evolve over time, modifications to our pricing and discounting methodologies, changes in the scope and nature of service offerings and/or changes in customer segmentation may result in a lack of consistency required to establish and/or maintain key revenue estimates and assumptions. Additionally, technological changes resulting in variability in product costs and gross margins may require changes to certain estimates and assumptions. Such changes may result in a different allocation of revenue to the deliverables in multiple-element arrangements. These factors, among others, may adversely impact the amount of revenue and gross margin we report in a particular period. |
| • | Sales returns are estimated based on historical sales returns, current trends and our expectations regarding future experience. Additionally, distributors and partners participate in various marketing and other programs, and we maintain estimated accruals and allowances for these programs based on contractual terms and historical experience. | | • | If there is insufficient relevant historical data for determining our sales returns estimates, or if we experience changes in practices related to sales returns or changes in market or competitive conditions resulting in higher than expected return rates, or if actual credits received by our distributors and partners deviate significantly from our estimates, our revenues may be adversely impacted. |
values based on established valuation techniques.
Fiscal year 2016, which ended on April 29, 2016, was a 53-week year.
| Acquisition-related expense | | | — | | | | — | | | | — | | |
Sales and marketing, research and development, and general and administrative expenses for fiscal 2017 totaled $2,683 million, or 49% of net revenues, representing a decrease of 5 percentage points compared to fiscal 2016, primarily due to a lower average headcount as a result of our restructuring plans as well as other cost reduction initiatives, partially offset by additional operating expenses related to our acquisition of SolidFire, Inc. (SolidFire).
| --- | --- | --- | --- | --- | --- | --- | --- | --- | --- | --- | --- | --- | --- | --- | --- | --- | --- | --- | --- | --- | --- |
| Net revenues | | | $ | 5,911 | | | $ | 5,519 | | | | 7 | % | | $ | 5,546 | | | | — | % |
| Product revenues | | | $ | 3,461 | | | $ | 3,006 | | | | 15 | % | | $ | 2,986 | | | | 1 | % |
An excerpt. Shown here: 40 of 219 rewritten, 40 of 97 added and 40 of 106 removed. The counts are complete. For every sentence, read Item 7. Management’s Discussion and Analysis of Financial Condition and Results of Operations in the FY2019 filing and the FY2018 filing.
Item 7A. Quantitative and Qualitative Disclosures about Market Risk
6 rewritten, 2 added, 2 removed, 28 unchanged
Fixed Income Investments — As of April [removed: 27, 2018,] [added: 26, 2019,] we had fixed income debt investments of [removed: $2.7] [added: $1.7] billion.
These investments, which consist primarily of corporate bonds, U.S. Treasury and government debt securities, [removed: commercial paper,] and certificates of deposit, are subject to interest rate and interest income risk and will decrease in value if market interest rates increase.
A hypothetical 100 basis point increase in market interest rates from levels as of April [removed: 27, 2018] [added: 26, 2019] would have resulted in a decrease in the fair value of our fixed-income securities of approximately [removed: $57] [added: $40] million.
Debt — As of April [removed: 27, 2018,] [added: 26, 2019,] we have outstanding $1.6 billion aggregate principal amount of Senior Notes.
However, the fair value of these instruments [added: fluctuates when interest rates change.]
As of April [removed: 27, 2018,] [added: 26, 2019,] no amounts were outstanding under the credit facility.
We also use foreign currency exchange forward contracts to hedge foreign currency exposures related to forecasted sales transactions denominated in certain foreign currencies.
These derivatives are designated and qualify as cash flow hedges under accounting guidance for derivatives and hedging.
fluctuates when interest rates change.
Currently, sales transactions and expenditures denominated in foreign currencies are not hedged, and therefore are exposed to the impact of foreign currency fluctuations.
Item 1. Business
60 rewritten, 61 added, 64 removed, 180 unchanged
NetApp, Inc. (NetApp, we, or us) is the data authority for [removed: the] hybrid cloud.
We provide a full range of hybrid cloud data services that simplify management of applications and data across cloud and on-premises [removed: environments.][added: environments to accelerate digital transformation.]
Together with our partners, we empower global organizations to unleash the full potential of their [removed: data.][added: data to expand customer touchpoints, foster greater innovation and optimize their operations.]
In a world where technology is changing our everyday lives, digital transformation [removed: remains top of mind for executives.][added: tops the strategic agenda in most organizations.]
| [added: |] • | Distributed. Generated and consumed from multiple clouds and on-premises, from organic and partner sources |
| [added: |] • | Dynamic. Constantly changing and increasingly cloud-streamed from multiple clouds |
| [added: |] • | Diverse. Including analytics, artificial intelligence (AI), and machine learning capabilities from multiple clouds and on-premises |
[removed: Our] [added: The NetApp] Data Fabric [removed: simplifies and integrates data management across clouds and on-premises to accelerate digital transformation, enabling] [added: enables] our customers to manage, secure, and protect their data [added: from on-premises to public to hybrid clouds, all] at the scale needed to accommodate the exponential data growth of the digital world.
Our products, solutions, and services portfolio [removed: focuses] [added: focus] on customers’ top IT imperatives as they undertake digital transformations.
NetApp’s unique approach to [removed: managing] data [removed: holistically] [added: services] enables organizations to inspire innovation with the cloud, build clouds to accelerate new services, and modernize IT architecture with cloud-connected flash.
NetApp believes that [removed: the] hybrid [removed: cloud] [added: multicloud] will be the dominant model for enterprise IT.
Customers are attracted by the speed and scale benefits of the public cloud but [added: they] need new data management capabilities to keep control of data as it moves beyond the walls of the enterprise.
NetApp Cloud Sync [removed: Data Synchronization]
[removed: NetApp] Cloud Sync [removed: Data Synchronization provides secure, fast,] [added: is NetApp’s service for rapid] and [removed: automated] [added: secure] data synchronization.
Whether organizations need to transfer files between on-premises NFS or CIFS file shares, Amazon S3 object format, [removed: another cloud provider object store,] [added: Azure Blob, IBM Cloud Object Storage,] or [added: the] NetApp StorageGRID® [removed: Webscale appliances,] [added: appliance,] Cloud Sync [removed: Data Synchronization] moves the files where they are needed quickly and securely.
NetApp SaaS Backup [removed: for Microsoft Office 365]
SaaS Backup [removed: for Microsoft Office 365] service is a complete software-as-a-service (SaaS) offering that enables organizations to protect Office 365 [removed: data in the event of accidental deletion,] [added: and Salesforce] data [removed: corruption,] [added: against threats] or [removed: malicious intent.][added: accidental deletion with secure backup and restore.]
NetApp Cloud [removed: Backup][added: Secure]
NetApp Cloud Infrastructure is a portfolio of offerings that helps customers build cloud-architected data centers to [removed: deliver cloud services for innovative applications in either private or service provider models.][added: accelerate new services.]
To accelerate digital transformations, customers are [removed: building clouds to accelerate new services and] developing [removed: innovative,] [added: next-generation] cloud-architected infrastructures that manage data and services as one integrated [removed: resource,] [added: resource] supporting both public and private clouds.
[added: FlexPod® is a portfolio of prevalidated designs and integration that combine the] Cisco Unified Computing System integrated infrastructure and NetApp storage components to reduce risk and accelerate the deployment of data center infrastructure.
NetApp StorageGRID [removed: Webscale] Object Storage Software
NetApp [removed: StorageGRID Webscale] [added: StorageGRID®] is a software-defined object-based storage solution that provides intelligent policy-driven data management.
[removed: Our storage systems] [added: The NetApp Storage Systems] and [removed: software] [added: Software] portfolio enables customers to modernize their IT architectures with cloud-connected flash to free the resources necessary to fund transformation by deploying highly efficient flash storage that scales from the edge to the core to the cloud.
NetApp [removed: All Flash FAS (AFF)] [added: AFF] systems [removed: address] [added: help organizations meet] enterprise storage requirements with high performance, [removed: superior] flexibility, and best-in-class data [removed: management.][added: management and cloud integration.]
NetApp FlexArray® virtualization software [removed: enables FAS8000 systems to virtualize existing Dell/EMC,] [added: lets organizations use EMC,] HP, Hitachi, [added: IBM,] and NetApp E-Series [removed: arrays,] [added: arrays as storage capacity in an ONTAP environment] creating a single storage management architecture that overcomes the limitations of existing arrays, expands the capabilities of customers’ IT infrastructures, and delivers the benefits of software-defined storage.
[added: NetApp] SANtricity Storage Operating System
[removed: This capability enables] [added: These capabilities mean that] storage administrators [removed: to] [added: can] make configuration changes, perform maintenance, [removed: or] [added: and] expand storage capacity without disrupting I/O to attached hosts.
[removed: For application environments, including backup and recovery, technical computing, video surveillance, and big data analytics,] NetApp E-Series and EF-Series storage arrays with SANtricity software offer industry-leading performance, reliability, and ease of use.
NetApp [removed: SolidFire] Element Operating System
[removed: Our services organization also] [added: The NetApp Services team optimizes data storage system utilization, efficiency, and consistency and] delivers actionable intelligence for managing [removed: and optimizing] data [removed: management solutions] with proactive and predictive technology.
To increase visibility of NetApp [added: as the data authority] in the [removed: broader IT segment,] [added: hybrid cloud,] we continue to make investments in our multi-year branding and awareness campaigns.
NetApp focuses primarily on the [added: cloud] data [removed: management] [added: services, private cloud,] and storage markets.
We sell our [removed: products] [added: products, solutions] and services to end-user business customers and service providers through a direct sales force and an ecosystem of partners.
During fiscal [removed: 2018,] [added: 2019,] sales through our indirect channels represented [removed: 79%] [added: 76%] of our net revenues.
As of April [removed: 27, 2018,] [added: 26, 2019,] our worldwide sales and marketing functions consisted of approximately [removed: 5,100] [added: 5,000] managers, sales representatives and technical support personnel.
We have field sales offices in approximately [removed: 47] [added: 43] countries.
Sales to customers Arrow Electronics, Inc. and Tech Data Corporation, which are distributors, [removed: each] accounted for [removed: 17%] [added: 24% and 20%] of our net [removed: revenues] [added: revenues, respectively,] in fiscal [removed: 2018.][added: 2019.]
We have historically experienced a [added: sequential] decline in revenues in the first quarter of our fiscal year, as the sales organization spends time developing new business after higher close rates in the fourth quarter, and because sales to European customers are [removed: historically] [added: typically] weaker during the summer months.
We have outsourced manufacturing operations to third parties located in Memphis, Tennessee; [added: Fremont, California;] San Jose, California; San Antonio, Texas; Guadalajara, Mexico; Schiphol Airport, The Netherlands; Komarom and Tiszaujvaros, Hungary; Wuxi and Tianjin, China; Taoyuan City, Taiwan; and Singapore.
To be successful in their digital transformations, data must become the lifeblood of an organization, seamlessly flowing through it to optimize operations, create innovative business opportunities and enable new customer touchpoints through technology.
| --- | --- | --- |
| --- | --- | --- |
The Data Fabric is NetApp’s strategy for simplifying and integrating the orchestration of data services across a choice of hybrid, multicloud environments.
Customers can build their unique Data Fabric from a catalog of consistent data services that provide data visibility and insights, data access and control, and data protection and security.
The NetApp Cloud Data Services portfolio is focused on helping customers fuel business growth by delivering data-rich customer experiences through new application deployments that easily use data and services regardless of where they reside or in what form.
NetApp Cloud Volumes Service for AWS
Cloud Volumes Service for AWS delivers fully managed file services for NFS, SMB, or dual protocol support.
With consistently high performance, Cloud Volumes Service provides shared persistent storage with high throughput and low latency that meets the demands of large databases and HPC applications.
Cloud Volumes ONTAP delivers secure, proven storage management services for AWS and Azure cloud storage.
Cloud Volumes ONTAP combines data control with enterprise-class storage features for various use cases, including file shares and block-level storage serving NAS and SAN protocols, disaster recovery, backup and archive, DevOps, databases, or any other enterprise workload.
Cloud Secure operates on both cloud and on-premises storage systems to give organizations real-time alerts of malicious user behavior.
Cloud Secure uses advanced machine learning algorithms to automatically uncover unusual data activity.
It automatically updates protection policies and permissions to restrict access, stopping actual threats before they become breaches.
NetApp Cloud Tiering
Based on NetApp FabricPool technology, Cloud Tiering identifies infrequently used data in on-premises storage and automatically and seamlessly moves that data to lower-cost object storage in the cloud, leaving frequently used data on the high-performant, data center storage system.
When the infrequently used tiered data is needed again, the service will automatically and seamlessly move it back to the high-performance tier.
NetApp Kubernetes Service
NetApp Kubernetes Service simplifies multicloud management by enabling organizations to create and manage production-ready Kubernetes clusters at scale with our universal Kubernetes control plane.
Kubernetes clusters can be launched at any of the major cloud providers and managed from a single pane of glass.
NetApp Cloud Insights
NetApp Cloud Insights is an infrastructure monitoring tool that gives organizations visibility into their entire infrastructure.
Cloud Insights advanced data collection and analytics capabilities, monitor, troubleshoot, and optimize cost across all resources including public clouds and private data centers.
NetApp HCI is designed to deliver a public cloud consumption experience with simplicity, dynamic scale, and operational efficiency to hybrid multiclouds.
Organizations can move faster while reducing costs with NetApp HCI by managing and running multiple applications with the predictable performance that enterprises demand.
StorageGRID supports industry-standard object APIs such as Amazon Simple Storage Service (S3) API and OpenStack Swift API.
Organizations can optimize data availability, performance, geo-distribution, retention, protection, and storage cost with metadata-driven policies.
Combined with the industry’s first end-to-end NVMe technologies and NetApp ONTAP data management software, AFF systems accelerate, manage, and protect business-critical data.
AFF systems eliminate performance silos in the data center by seamlessly integrating into a cluster with hybrid FAS systems, enabling workloads to transparently move between high-performance tiers and low-cost capacity tiers.
NetApp SolidFire® all-flash storage systems are architected for rapidly transforming environments.
As the foundation for private cloud infrastructure, SolidFire allows independent scaling, consistent performance, and automation integrations, giving private cloud infrastructure the flexibility and consistency to scale as a service provider.
SolidFire enables organizations to get closer to the speed and simplicity of business in the cloud while exceeding the demands of keeping data on-premises.
NetApp OnCommand Unified Manager, which is included with ONTAP, provides a comprehensive data management solution for NetApp AFF, FAS and ONTAP Select storage.
ONTAP Select converts a server’s internal SSDs or HDDs, as well as HCI and external array storage into an agile, flexible storage platform with many of the same dedicated storage system benefits based on NetApp ONTAP.
ONTAP Select can be deployed on new servers or on existing server infrastructure for added flexibility.
NetApp MAX Data
Memory Accelerated Data (MAX Data) moves beyond caching to true memory tiering for next-generation Intel Optane DC persistent memory (Optane DC PMM)—providing application performance and enterprise data protection.
With MAX Data software, companies can realize the promise of real-time data analytics to deliver orders-of-magnitude faster transactions for business applications, such as Oracle, and for NoSQL databases, such as MongoDB.
NetApp OnCommand API Services
NetApp OnCommand API Services help IT organizations address today’s complex IT management challenges.
When successful in their digital transformation, organizations use technology to create new customer touchpoints, reinventing customer experiences and relationships through business-oriented approaches to data.
Additionally, organizations are able to create innovative business opportunities, taking advantage of emerging market opportunities by rapidly deploying new technologies, and to optimize operations, adopting an operating model that provides efficiencies and funds new innovation.
In order to successfully digitally transform, data must become the lifeblood of an organization and be used as a business accelerator.
Data-driven digital transformations accelerate business outcomes.
| --- | --- |
The Data Fabric delivers integrated data management services and applications for data visibility and insights, data access and control, and data protection and security.
The NetApp Data Fabric gives customers freedom of choice, enabling the movement of data between clouds and on-premises as business conditions dictate.
The NetApp Data Fabric enables our customers to manage, secure, and protect their data from on-premises to public to
hybrid clouds, all at the scale needed to accommodate the exponential data growth of the digital world.
The NetApp Cloud Data Services portfolio is focused on helping customers inspire innovation with public and multicloud solutions, enabling modern data management applications and services.
The Cloud Volumes ONTAP storage data management service is based on the familiar and reliable ONTAP data management software, bringing data protection and storage efficiency features to cloud-based storage.
Cloud Volumes ONTAP allows customers to build an enterprise storage service on Amazon Web Services (AWS) or Microsoft Azure with the flexibility to pay for only what a customer needs, when it needs it.
Whether customers want to move traditional database applications or legacy NAS applications to the cloud, Cloud Volumes ONTAP provides the data access, insights, and control along the way.
Using SaaS Backup for Microsoft Office 365, customers can back up, find, and recover email, calendars, contacts, tasks, site collections, sites, lists, and file data.
Cloud Backup is NetApp’s solution for backing up and archiving data to the public or private cloud of the customer’s choice.
Based on NetApp AltaVault™ technology, Cloud Backup streamlines backups while reducing cloud storage costs.
Supporting backup and archive to AWS, Microsoft Azure Blob Storage, Google Cloud Platform, StorageGRID Webscale, or another cloud, Cloud Backup protects data quickly and securely.
Cloud Backup ingests data from the customer’s backup software, deduplicates and compresses the data to save on transmission and cloud storage costs, caches the most recent backups for fast recoveries, and vaults all of the data to the cloud quickly and efficiently.
OnCommand Management Software and Management Integration Tools
The NetApp OnCommand® storage management software portfolio incorporates a broad range of data management tools for NetApp and multivendor storage.
These products enable customers to maintain control of their data regardless of where it resides in a hybrid cloud environment, to drive efficiency using software management tools designed to work together, and to gain flexibility.
NetApp OnCommand Insight management software delivers consistent insight across the data center, so organizations can monitor, manage, and optimize hybrid IT multivendor storage, compute, and switching infrastructures.
NetApp Private Storage for Cloud
NetApp Private Storage for Cloud is a family of enterprise storage solutions that lets customers use multiple industry-leading clouds and maintain complete control over their data on dedicated storage systems from NetApp while achieving the flexibility of the cloud for application and compute resources.
In this approach, customer data resides on NetApp storage “next to” rather than “in” the cloud provider’s environment.
The customer-owned NetApp system is co-located in data centers managed by our partner Equinix, which has data centers located next to major networks and in close proximity to major cloud providers, including AWS, Microsoft Azure, and IBM SoftLayer.
Backed by one of the most successful alliances in the industry, FlexPod® has become the converged infrastructure of choice for many of the largest enterprises around the globe.
FlexPod is a portfolio of pre-validated designs and integration that combine the
The portfolio is validated with leading hypervisors, operating systems, systems management tools, and cloud management platforms for major enterprise workloads such as Oracle, SAP, Microsoft, Openstack, and Docker.
NetApp Converged Systems Advisor
NetApp Converged Systems Advisor (CSA) targets key challenges in the data center operations lifecycle.
An on-premises agent combines with cloud analytics to validate, monitor, and optimize the deployment of FlexPod infrastructure.
This tool simplifies key tasks for administrative support with an automated review of over 100 best practices, component support updates, and resilient design requirements.
With continual remote monitoring and notifications, NetApp CSA helps administrators prevent gaps in system supportability and more easily protect their investment in mission-critical data center infrastructure.
These capabilities simplify lifecycle management, improve productivity with infrastructure support, and facilitate the management of infrastructure.
The NetApp HCI enterprise-scale hyper converged cloud infrastructure is the cornerstone of a private cloud strategy solution capable of transforming and empowering organizations so they can move faster, drive operational efficiency, and reduce costs.
It can easily run multiple applications with the predictable performance demanded by enterprise customers.
Compute and storage resources scale independently to avoid overprovisioning and can be deployed in minutes with a turnkey cloud infrastructure that eliminates the complex management of traditional three-tier architectures.
StorageGRID Webscale provides Amazon S3 API compatibility and acts as the foundation for global data availability anytime, anywhere to facilitate nonstop operations.
Configurations can be designed for resilience to one or multiple simultaneous failures and even for resilience to entire site losses and regional disasters.
An excerpt. Shown here: 40 of 60 rewritten, 40 of 61 added and 40 of 64 removed. The counts are complete. For every sentence, read Item 1. Business in the FY2019 filing and the FY2018 filing.
Cover and table of contents
35 rewritten, 1 added, 2 removed, 148 unchanged
10-K 1 [removed: ntap-10k_20180427.htm] [added: ntap-10k_20190426.htm] 10-K
| | For the fiscal year ended April [removed: 27, 2018] [added: 26, 2019] |
[removed: ][added: ]
| Title of each class | [added: Trading Symbol(s)] | [added: |] Name of exchange on which registered |
| Common Stock, $0.001 Par Value | [added: NTAP] | [added: |] The NASDAQ Stock Market LLC |
Indicate by check mark whether the registrant has submitted electronically [removed: and posted on its corporate Website, if any,] every Interactive Data File required to be submitted [removed: and posted] pursuant to Rule 405 of Regulation S-T (§232.405 of this chapter) during the preceding 12 months (or for such shorter period that the registrant was required to submit [removed: and post] such files).
| Non-accelerated filer | | ☐ | [removed: (Do not check if a smaller reporting company)] | Smaller reporting company | | ☐ |
The aggregate market value of voting stock held by non-affiliates of the registrant, as of October [removed: 27, 2017,] [added: 26, 2018,] the last business day of the registrant’s most recently completed second fiscal quarter, was [removed: $8,052,133,635] [added: $12,456,432,144] (based on the closing price for shares of the registrant’s common stock as reported by the NASDAQ Global Select Market on that date).
On June [removed: 8, 2018, 263,480,598] [added: 7, 2019, 240,022,187] shares of the registrant’s common stock, $0.001 par value, were outstanding.
The information called for by Part III of this Form 10-K is hereby incorporated by reference from the definitive Proxy Statement for our annual meeting of stockholders, which will be filed with the Securities and Exchange Commission not later than 120 days after April [removed: 27, 2018.][added: 26, 2019.]
| Item 1 | | [Business](#Item_1_Business) | | [removed: 6] [added: 5] |
| Item 1A | | [Risk Factors](#Item_1A_Risk_Factors) | | [removed: 15] [added: 14] |
| Item 1B | | [Unresolved Staff Comments](#Item_1B_Unresolved_Staff_Comments) | | [removed: 26] [added: 25] |
| Item 2 | | [Properties](#ITEM_2_PROPERTIES) | | [removed: 26] [added: 25] |
| Item 3 | | [Legal Proceedings](#Item_3_Legal_Proceedings) | | [removed: 26] [added: 25] |
| Item 4 | | [Mine Safety Disclosures](#Item_4_Mine_Safety_Disclosures) | | [removed: 26] [added: 25] |
| Item 5 | | [Market for Registrant’s Common Equity, Related Stockholder Matters and Issuer Purchases of Equity Securities](#Item_5_Market_for_Registrants_Common) | | [removed: 27] [added: 26] |
| Item 6 | | [Selected Financial Data](#Item_6_Selected_Financial_Data) | | [removed: 30] [added: 29] |
| Item 7 | | [Management’s Discussion and Analysis of Financial Condition and Results of Operations](#Item_7_MDA) | | [removed: 31] [added: 30] |
| Item 7A | | [Quantitative and Qualitative Disclosures About Market Risk](#Item_7A_Quantitative_and_Qualitative) | | [removed: 51] [added: 49] |
| Item 8 | | [Financial Statements and Supplementary Data](#Item_8_Financial_Statements) | | [removed: 53] [added: 51] |
| Item 9 | | [Changes in and Disagreements with Accountants on Accounting and Financial Disclosure](#Item_9_Changes_in_and_Disagreements) | | [removed: 90] [added: 91] |
| Item 9A | | [Controls and Procedures](#Item_9A_Controls_and_Procedures) | | [removed: 90] [added: 91] |
| Item 9B | | [Other Information](#Item_9B_Other_Information) | | [removed: 90] [added: 91] |
| Item 10 | | [Directors, Executive Officers and Corporate Governance](#Item_10_Directors_Executive_Officers) | | [removed: 91] [added: 92] |
| Item 11 | | [Executive Compensation](#Item_11_Executive_Compensation) | | [removed: 91] [added: 92] |
| Item 12 | | [Security Ownership of Certain Beneficial Owners and Management and Related Stockholder Matters](#Item_12_Security_Ownership) | | [removed: 91] [added: 92] |
| Item 13 | | [Certain Relationships and Related Transactions, and Director Independence](#Item_13_Certain_Relationships) | | [removed: 91] [added: 92] |
| Item 14 | | [Principal Accounting Fees and Services](#Item_14_Principal_Accountant_Fees) | | [removed: 91] [added: 92] |
| Item 15 | | [Exhibits, Financial Statement Schedules](#Item_15_Exhibits_Financial_Statement) | | [removed: 91] [added: 92] |
| [Signatures](#Signatures) | | | | [removed: 96] [added: 99] |
| | • | expected benefits from acquisitions, [removed: including our acquisition of SolidFire, Inc. and] joint ventures, growth opportunities and investments; |
| | • | our ability to expand our total available market and grow our portfolio of [removed: products;] [added: products and solutions;] |
| | • | our ability to introduce new and differentiated [removed: products] [added: products, solutions] and services without disruption; |
| | • | our ability to accurately forecast demand for our [removed: products] [added: products, solutions] and services, and future financial performance; |
| --- | --- | --- | --- |
| --- | --- | --- |
Indicate by a check mark if disclosure of delinquent filers pursuant to Item 405 of Regulation S-K (§229.405 of this chapter) is not contained herein, and will not be contained, to the best of registrant’s knowledge, in definitive proxy or information statements incorporated by reference in Part III of this Form 10-K or any amendment to this Form 10-K.
Item 2. Properties
1 rewritten, 0 added, 0 removed, 11 unchanged
We own approximately 0.7 million square feet of facilities in Bangalore, [removed: India.][added: India on 14 acres of land.]
Item 5. Market for Registrant’s Common Equity, Related Stockholder Matters and Issuer Purchases of Equity Securities
15 rewritten, 8 added, 8 removed, 28 unchanged
| | | Fiscal [removed: 2018] [added: 2019] | | | | | | | | Fiscal [removed: 2017] [added: 2018] | | | | | | |
| First Quarter | | $ | [removed: 45.24] [added: 83.14] | | | $ | [removed: 37.43] [added: 63.81] | | | $ | [removed: 26.95] [added: 45.24] | | | $ | [removed: 22.50] [added: 37.43] | |
| Second Quarter | | $ | [removed: 45.14] [added: 88.08] | | | $ | [removed: 37.55] [added: 70.26] | | | $ | [removed: 36.10] [added: 45.14] | | | $ | [removed: 25.82] [added: 37.55] | |
| Third Quarter | | $ | [removed: 64.06] [added: 83.95] | | | $ | [removed: 43.24] [added: 54.50] | | | $ | [removed: 39.00] [added: 64.06] | | | $ | [removed: 30.36] [added: 43.24] | |
| Fourth Quarter | | $ | [removed: 69.75] [added: 78.35] | | | $ | [removed: 52.00] [added: 61.00] | | | $ | [removed: 43.14] [added: 69.75] | | | $ | [removed: 37.48] [added: 52.00] | |
As of June [removed: 8, 2018] [added: 7, 2019] there were [removed: 431] [added: 413] holders of record of our common stock.
The Company paid cash dividends of [removed: $0.20] [added: $0.40] per outstanding common share in each quarter of fiscal [removed: 2018] [added: 2019] for an aggregate of [removed: $214] [added: $403] million, [removed: $0.19] [added: $0.20] per outstanding common share in each quarter of fiscal [removed: 2017] [added: 2018] for an aggregate of [removed: $208] [added: $214] million, and [removed: $0.18] [added: $0.19] per outstanding common share in each quarter of fiscal [removed: 2016] [added: 2017] for an aggregate of [removed: $210] [added: $208] million.
In the first quarter of fiscal [removed: 2019,] [added: 2020,] the Company declared a cash dividend of [removed: $0.40] [added: $0.48] per share of common stock, payable on July [removed: 25, 2018] [added: 24, 2019] to shareholders of record as of the close of business on July [removed: 6, 2018.][added: 5, 2019.]
The following graph shows a comparison of cumulative total shareholder return, calculated on a dividend reinvested basis, of an investment of $100 for the Company, the S&P 500 Index, the S&P Information Technology Index and the S&P 1500 Technology Hardware & Equipment Index for the five years ended April [removed: 27, 2018.][added: 26, 2019.]
[removed: 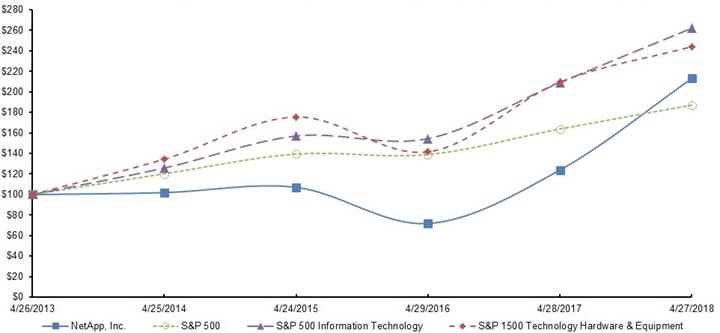][added: ]
*$100 invested on April [removed: 26, 2013] [added: 25, 2014] in stock or index, including reinvestment of dividends.
| | | April [removed: 2013 | | | | April] 2014 | | | | April 2015 | | | | April 2016 | | | | April 2017 | | | | April 2018 | | | [added: | April 2019 | | |]
The following table provides information with respect to the shares of common stock repurchased by us during the three months ended April [removed: 27, 2018:][added: 26, 2019:]
As of April [removed: 27, 2018,] [added: 26, 2019,] our Board of Directors has authorized the repurchase of up to $13.6 billion of our common stock, including a $4.0 billion increase approved by our Board of Directors in April 2018.
Since inception of the program through April [removed: 27, 2018,] [added: 26, 2019,] we repurchased a total of [removed: 284] [added: 313] million shares of our common stock for an aggregate purchase price of [removed: $9.6] [added: $11.7] billion.
| NetApp, Inc. | | $ | 100.00 | | | $ | 105.06 | | | $ | 70.54 | | | $ | 121.66 | | | $ | 209.11 | | | $ | 228.12 | |
| S&P 500 Index | | $ | 100.00 | | | $ | 115.98 | | | $ | 115.62 | | | $ | 136.33 | | | $ | 155.69 | | | $ | 174.89 | |
| S&P 500 Information Technology Index | | $ | 100.00 | | | $ | 124.83 | | | $ | 122.82 | | | $ | 166.24 | | | $ | 208.27 | | | $ | 253.85 | |
| S&P 1500 Technology Hardware & Equipment Index | | $ | 100.00 | | | $ | 130.63 | | | $ | 105.27 | | | $ | 155.92 | | | $ | 181.54 | | | $ | 222.38 | |
| January 26, 2019 - February 22, 2019 | | | 262 | | | $ | 64.77 | | | | 306,255 | | | $ | 2,372 | |
| February 23, 2019 - March 22, 2019 | | | 3,380 | | | $ | 65.53 | | | | 309,635 | | | $ | 2,150 | |
| March 23, 2019 - April 26, 2019 | | | 3,608 | | | $ | 72.49 | | | | 313,244 | | | $ | 1,889 | |
| Total | | | 7,250 | | | $ | 68.97 | | | | | | | | | |
| NetApp, Inc. | | $ | 100.00 | | | $ | 101.92 | | | $ | 107.07 | | | $ | 71.89 | | | $ | 123.99 | | | $ | 213.12 | |
| S&P 500 Index | | $ | 100.00 | | | $ | 120.27 | | | $ | 139.48 | | | $ | 139.05 | | | $ | 163.96 | | | $ | 187.24 | |
| S&P 500 Information Technology Index | | $ | 100.00 | | | $ | 125.84 | | | $ | 157.09 | | | $ | 154.56 | | | $ | 209.21 | | | $ | 262.10 | |
| S&P 1500 Technology Hardware & Equipment Index | | $ | 100.00 | | | $ | 134.47 | | | $ | 175.66 | | | $ | 141.56 | | | $ | 209.67 | | | $ | 244.12 | |
| January 27, 2018 - February 23, 2018 | | | 1,752 | | | $ | 58.13 | | | | 280,330 | | | $ | 242 | |
| February 24, 2018 - March 23, 2018 | | | 3,765 | | | $ | 61.52 | | | | 284,095 | | | $ | 10 | |
| March 24, 2018 - April 27, 2018 | | | 173 | | | $ | 60.38 | | | | 284,268 | | | $ | 4,000 | |
| Total | | | 5,690 | | | $ | 60.44 | | | | | | | | | |
Item 6. Selected Financial Data
16 rewritten, 3 added, 0 removed, 9 unchanged
| | | April [added: 26, 2019 | | | | April] 27, 2018 [added: (2)] | | | | April 28, 2017 [added: (2)] | | | | April 29, 2016 | | | | April 24, 2015 | | | [removed: | April 25, 2014 | | |]
| Net revenues | | $ | [removed: 5,911] [added: 6,146] | | | $ | [removed: 5,519] [added: 5,919] | | | $ | [removed: 5,546] [added: 5,491] | | | $ | [removed: 6,123] [added: 5,546] | | | $ | [removed: 6,325] [added: 6,123] | |
| Gross profit | | $ | [removed: 3,699] [added: 3,945] | | | $ | [removed: 3,390] [added: 3,709] | | | $ | [removed: 3,373] [added: 3,364] | | | $ | [removed: 3,833] [added: 3,373] | | | $ | [removed: 3,919] [added: 3,833] | |
| Provision for income taxes (1) | | $ | [removed: 1,090] [added: 99] | | | $ | [removed: 156] [added: 1,083] | | | $ | [removed: 116] [added: 140] | | | $ | [removed: 153] [added: 116] | | | $ | [removed: 103] [added: 153] | |
| Net income | | $ | [removed: 76] [added: 1,169] | | | $ | [removed: 509] [added: 116] | | | $ | [removed: 229] [added: 481] | | | $ | [removed: 560] [added: 229] | | | $ | [removed: 638] [added: 560] | |
| Net income per share, basic | | $ | [removed: 0.28] [added: 4.60] | | | $ | [removed: 1.85] [added: 0.43] | | | $ | [removed: 0.78] [added: 1.75] | | | $ | [removed: 1.77] [added: 0.78] | | | $ | [removed: 1.87] [added: 1.77] | |
| Net income per share, diluted | | $ | [removed: 0.28] [added: 4.51] | | | $ | [removed: 1.81] [added: 0.42] | | | $ | [removed: 0.77] [added: 1.71] | | | $ | [removed: 1.75] [added: 0.77] | | | $ | [removed: 1.83] [added: 1.75] | |
| Shares used in basic computation | | | [removed: 268] [added: 254] | | | | [removed: 275] [added: 268] | | | | [removed: 294] [added: 275] | | | | [removed: 316] [added: 294] | | | | [removed: 340] [added: 316] | |
| Shares used in diluted computation | | | [removed: 276] [added: 259] | | | | [removed: 281] [added: 276] | | | | [removed: 297] [added: 281] | | | | [removed: 321] [added: 297] | | | | [removed: 348] [added: 321] | |
| Cash dividends declared per share | | $ | [removed: 0.80] [added: 1.60] | | | $ | [removed: 0.76] [added: 0.80] | | | $ | [removed: 0.72] [added: 0.76] | | | $ | [removed: 0.66] [added: 0.72] | | | $ | [removed: 0.60] [added: 0.66] | |
| Cash, cash equivalents and short-term investments | | $ | [removed: 5,391] [added: 3,899] | | | $ | [removed: 4,921] [added: 5,391] | | | $ | [removed: 5,303] [added: 4,921] | | | $ | [removed: 5,326] [added: 5,303] | | | $ | [removed: 5,003] [added: 5,326] | |
| Working capital | | $ | [removed: 3,233] [added: 1,743] | | | $ | [removed: 2,076] [added: 3,421] | | | $ | [removed: 2,786] [added: 2,178] | | | $ | [removed: 4,064] [added: 2,786] | | | $ | [removed: 3,776] [added: 4,064] | |
| Total assets | | $ | [removed: 9,865] [added: 8,741] | | | $ | [removed: 9,493] [added: 9,991] | | | $ | [removed: 10,037] [added: 9,562] | | | $ | [removed: 9,401] [added: 10,037] | | | $ | [removed: 9,214] [added: 9,401] | |
| Total debt | | $ | [removed: 1,926] [added: 1,793] | | | $ | [removed: 1,993] [added: 1,926] | | | $ | [removed: 2,339] [added: 1,993] | | | $ | [removed: 1,487] [added: 2,339] | | | $ | [removed: 990] [added: 1,487] | |
| Total deferred revenue and financed unearned services revenue | | $ | [removed: 3,477] [added: 3,668] | | | $ | [removed: 3,342] [added: 3,363] | | | $ | [removed: 3,385] [added: 3,213] | | | $ | [removed: 3,197] [added: 3,385] | | | $ | [removed: 3,100] [added: 3,197] | |
| Total stockholders' equity | | $ | [removed: 2,067] [added: 1,090] | | | $ | [removed: 2,780] [added: 2,276] | | | $ | [removed: 2,881] [added: 2,949] | | | $ | [removed: 3,414] [added: 2,881] | | | $ | [removed: 3,787] [added: 3,414] | |
| | | April 26, 2019 | | | | April 27, 2018 (2) | | | | April 28, 2017 (2) | | | | April 29, 2016 | | | | April 24, 2015 | | |
(2) Fiscal 2018 and 2017 have been adjusted for our retrospective adoption of the new accounting standard Revenue from Contracts with Customers (ASC 606).
Refer to Note 7 – Revenue of the Notes to Consolidated Financial Statements for details.
Item 8. Financial Statements and Supplementary Data
454 rewritten, 383 added, 185 removed, 642 unchanged
| [Consolidated Balance Sheets as of April [removed: 27, 2018] [added: 26, 2019] and April [removed: 28, 2017](#CONSOLIDATED_BALANCE_SHEETS)] [added: 27, 2018](#CONSOLIDATED_BALANCE_SHEETS)] | [removed: 54] [added: 52] |
| [Consolidated Statements of Operations for the years ended April [removed: 27, 2018,] [added: 26, 2019,] April [removed: 28, 2017] [added: 27, 2018] and April [removed: 29, 2016](#CONSOLIDATED_STATEMENTS_OPERATIONS)] [added: 28, 2017](#CONSOLIDATED_STATEMENTS_OPERATIONS)] | [removed: 55] [added: 53] |
| [Consolidated Statements of Comprehensive Income for the years ended April [removed: 27, 2018,] [added: 26, 2019,] April [removed: 28, 2017] [added: 27, 2018] and April [removed: 29, 2016](#CONSOLIDATED_STATEMENTS_COMPREHENSIVE_IN)] [added: 28, 2017](#CONSOLIDATED_STATEMENTS_COMPREHENSIVE_IN)] | [removed: 56] [added: 54] |
| [Consolidated Statements of Cash Flows for the years ended April [removed: 27, 2018,] [added: 26, 2019,] April [removed: 28, 2017] [added: 27, 2018] and April [removed: 29, 2016](#CONSOLIDATED_STATEMENTS_CASH_FLOWS)] [added: 28, 2017](#CONSOLIDATED_STATEMENTS_CASH_FLOWS)] | [removed: 57] [added: 55] |
| [Consolidated Statements of Stockholders’ Equity for the years ended April [removed: 27, 2018,] [added: 26, 2019,] April [removed: 28, 2017] [added: 27, 2018] and April [removed: 29, 2016](#CONSOLIDATED_STATEMENTS_STOCKHOLDERS_EQU)] [added: 28, 2017](#CONSOLIDATED_STATEMENTS_STOCKHOLDERS_EQU)] | [removed: 58] [added: 56] |
| [Notes to Consolidated Financial Statements](#NOTES_TO_CONSOLIDATED_FINANCIAL_STATEMEN) | [removed: 59] [added: 57] |
| [Selected Quarterly Financial Data (Unaudited)](#SELECTED_QUARTERLY_FINANCIAL_DATA_UNAUDI) | [removed: 87] [added: 88] |
| [Reports of Independent Registered Public Accounting Firm](#REPORT_INDEPENDENT_REGISTERED_PUBLIC_ACC) | [removed: 88] [added: 89] |
| | | April [added: 26, 2019 | | | | April] 27, 2018 | | | | April 28, 2017 | | |
| Cash and cash equivalents | | $ | [removed: 2,941] [added: 2,325] | | | $ | [removed: 2,444] [added: 2,941] | |
| Short-term investments | | | [removed: 2,450] [added: 1,574] | | | | [removed: 2,477] [added: 2,450] | |
| Accounts receivable | | [added: $] | 1,009 | | | [added: $] | [removed: 731] [added: 38] | | [added: | (1 | ) | $ | 1,047 | |]
| Inventories | | [added: $] | 126 | | | [added: $] | [removed: 163] [added: (4] | [added: )] | [added: | | | $ | 122 | |]
| Other current assets | | [added: $] | 330 | | | [added: $] | [removed: 383] [added: 62] | | [added: | (2 | ) | $ | 392 | |]
| Total current assets | | | [removed: 6,856] [added: 5,610] | | | | [removed: 6,198] [added: 6,952] | |
| Property and equipment, net | | | [removed: 756] [added: 759] | | | | [removed: 799] [added: 756] | |
| Goodwill | | | [removed: 1,739] [added: 1,735] | | | | [removed: 1,684] [added: 1,739] | |
| Other intangible assets, net | | | [removed: 94] [added: 47] | | | | [removed: 131] [added: 94] | |
| Other non-current assets | | [added: $] | 420 | | | [added: $] | [removed: 681] [added: 30] | | [added: | (2 | ) | $ | 450 | |]
| Accounts payable | | $ | [removed: 609] [added: 542] | | | $ | [removed: 347] [added: 609] | |
| Accrued expenses | | | [removed: 825] [added: 851] | | | | [removed: 782] [added: 825] | |
| Commercial paper notes | | | [removed: 385] [added: 249] | | | | [removed: 500] [added: 385] | |
| Current portion of long-term debt | | | [removed: —] [added: 400] | | | | [removed: 749] [added: —] | |
| Short-term deferred revenue and financed unearned services revenue | | [added: $] | 1,804 | | | [added: $] | [removed: 1,744] [added: (92] | [added: )] | [added: | (3 | ) | $ | 1,712 | |]
| Total current liabilities | | | [removed: 3,623] [added: 3,867] | | | | [removed: 4,122] [added: 3,531] | |
| Long-term debt | | | [removed: 1,541] [added: 1,144] | | | | [removed: 744] [added: 1,541] | |
| Other long-term liabilities | | [added: $] | 961 | | | [added: $] | [removed: 249] [added: 31] | | [added: | (4 | ) | $ | 992 | |]
| Long-term deferred revenue and financed unearned services revenue | | [added: $] | 1,673 | | | [added: $] | [removed: 1,598] [added: (22] | [added: )] | [added: | (3 | ) | $ | 1,651 | |]
| Total [added: warranty] liabilities | | [added: $] | [removed: 7,798] [added: 40] | | | [added: $] | [removed: 6,713] [added: 40] | |
| Preferred stock, $0.001 par value, 5 shares authorized; no shares issued or outstanding as of April [removed: 27, 2018] [added: 26, 2019] or April [removed: 28, 2017] [added: 27, 2018] | | | — | | | | — | |
| Common stock and additional paid-in capital, $0.001 par value, 885 shares authorized; [removed: 263] [added: 240] and [removed: 269] [added: 263] shares issued and outstanding as of April [removed: 27, 2018] [added: 26, 2019] and April [removed: 28, 2017,] [added: 27, 2018,] respectively | | | [removed: 2,355] [added: 1,133] | | | | [removed: 2,769] [added: 2,355] | |
| Retained earnings (accumulated deficit) | | | [removed: (218] [added: —] | [removed: )] | | | [removed: 40] [added: (9] | [added: )] |
| Accumulated other comprehensive loss | | | [removed: (70] [added: (43] | ) | | | [removed: (29] [added: (70] | ) |
| Total stockholders' equity | | | [removed: 2,067] [added: 1,090] | | | | [removed: 2,780] [added: 2,276] | |
| [removed: Total liabilities and stockholders' equity] [added: LIABILITIES AND STOCKHOLDERS' EQUITY] | | [removed: $] | [removed: 9,865] | | | [removed: $] | [removed: 9,493] | | [added: | | | | | |]
| | | April [removed: 27, 2018] [added: 26, 2019] | | | | April [removed: 28, 2017] [added: 27, 2018] | | | | April [removed: 29, 2016] [added: 28, 2017] | | |
| Product | [removed: |] $ | 3,461 | | | $ | [removed: 3,006] [added: 64] | | | $ | [removed: 2,986] [added: 3,525] | |
| Software maintenance | | [removed: |] 958 | | | | [removed: 965] [added: (56] | [added: )] | | | [removed: 949] [added: 902] | |
| Hardware maintenance and other services | | [removed: |] 1,492 | | | | [removed: 1,548] [added: —] | | | | [removed: 1,611] [added: 1,492] | |
| Net revenues | | [removed: |] 5,911 | | | | [removed: 5,519] [added: 8] | | | | [removed: 5,546] [added: 5,919] | |
| Inventories | | | 131 | | | | 122 | |
| Other current assets | | | 364 | | | | 392 | |
| Other non-current assets | | | 590 | | | | 450 | |
| Total assets | | $ | 8,741 | | | $ | 9,991 | |
| Short-term deferred revenue and financed unearned services revenue | | | 1,825 | | | | 1,712 | |
| Long-term deferred revenue and financed unearned services revenue | | | 1,843 | | | | 1,651 | |
| Total liabilities | | | 7,651 | | | | 7,715 | |
| Total liabilities and stockholders' equity | | $ | 8,741 | | | $ | 9,991 | |
| Product | | $ | 3,755 | | | $ | 3,525 | | | $ | 3,060 | |
| Software maintenance | | | 946 | | | | 902 | | | | 905 | |
| Hardware maintenance and other services | | | 1,445 | | | | 1,492 | | | | 1,526 | |
| Net revenues | | | 6,146 | | | | 5,919 | | | | 5,491 | |
| Cost of product | | | 1,752 | | | | 1,738 | | | | 1,612 | |
| Cost of hardware maintenance and other services | | | 414 | | | | 447 | | | | 487 | |
| Total cost of revenues | | | 2,201 | | | | 2,210 | | | | 2,127 | |
| Gross profit | | | 3,945 | | | | 3,709 | | | | 3,364 | |
| Sales and marketing | | | 1,657 | | | | 1,706 | | | | 1,651 | |
| Gain on sale or derecognition of assets | | | (73 | ) | | | (218 | ) | | | (10 | ) |
| Total operating expenses | | | 2,724 | | | | 2,551 | | | | 2,743 | |
| Income from operations | | | 1,221 | | | | 1,158 | | | | 621 | |
| Income before income taxes | | | 1,268 | | | | 1,199 | | | | 621 | |
| Provision for income taxes | | | 99 | | | | 1,083 | | | | 140 | |
| Net income | | $ | 1,169 | | | $ | 116 | | | $ | 481 | |
| Basic | | $ | 4.60 | | | $ | 0.43 | | | $ | 1.75 | |
| Diluted | | $ | 4.51 | | | $ | 0.42 | | | $ | 1.71 | |
| Net income | | $ | 1,169 | | | $ | 116 | | | $ | 481 | |
| Comprehensive income | | $ | 1,196 | | | $ | 75 | | | $ | 483 | |
| Net income | | $ | 1,169 | | | $ | 116 | | | $ | 481 | |
| Gain on sale or derecognition of assets | | | (73 | ) | | | (218 | ) | | | (10 | ) |
| Accounts receivable | | | (185 | ) | | | (289 | ) | | | 90 | |
| Beginning of period | | | 2,947 | | | | 2,450 | | | | 2,877 | |
| End of period | | $ | 2,331 | | | $ | 2,947 | | | $ | 2,450 | |
| Cumulative-effect of adoption of ASC 606 | | | — | | | | — | | | | 197 | | | | — | | | | 197 | |
| Cumulative-effect of new accounting principle | | | — | | | | — | | | | (51 | ) | | | — | | | | (51 | ) |
| Repurchase of common stock | | | (29 | ) | | | (1,002 | ) | | | (1,109 | ) | | | — | | | | (2,111 | ) |
| Balances, April 26, 2019 | | | 240 | | | $ | 1,133 | | | $ | — | | | $ | (43 | ) | | $ | 1,090 | |
Accounting Changes
Accordingly, our prior periods consolidated financial statements and information, as presented herein, have been restated to conform to the new rules.
Refer to Note 7 – Revenue for a summary of the impacts of adopting this standard.
As a result, tax expense from the sale of an asset in the seller’s tax jurisdiction is recognized when the transfer occurs, even though the pre-tax effects of that transaction are eliminated in consolidation.
| Total assets | | $ | 9,865 | | | $ | 9,493 | |
| Acquisition-related expense | | | — | | | | — | | | | 8 | |
| Basic | | $ | 0.28 | | | $ | 1.85 | | | $ | 0.78 | |
| Diluted | | $ | 0.28 | | | $ | 1.81 | | | $ | 0.77 | |
| Reclassification adjustments for (gains) losses included in net income | | | — | | | | (6 | ) | | | 1 | |
| Proceeds from sale-leaseback financing transactions | | | — | | | | — | | | | 148 | |
| Proceeds from short-term loan | | | — | | | | — | | | | 870 | |
| Beginning of period | | | 2,444 | | | | 2,868 | | | | 1,922 | |
| End of period | | $ | 2,941 | | | $ | 2,444 | | | $ | 2,868 | |
| Balances, April 24, 2015 | | | 306 | | | $ | 3,385 | | | $ | 53 | | | $ | (24 | ) | | $ | 3,414 | |
| Other comprehensive loss | | | — | | | | — | | | | — | | | | (7 | ) | | | (7 | ) |
| Repurchase of common stock | | | (33 | ) | | | (763 | ) | | | (197 | ) | | | — | | | | (960 | ) |
| Income tax adjustments on other equity transactions | | | — | | | | 26 | | | | — | | | | — | | | | 26 | |
Revenue Recognition — We recognize revenue when:
- Persuasive evidence of an arrangement exists.
Customarily we have a purchase order and/or contract prior to recognizing revenue on an arrangement from our end users, customers, value-added resellers or distributors.
- Delivery has occurred.
Our product is physically delivered to our customers.
We typically do not allow for restocking rights with any of our value-added resellers or distributors.
Products shipped with acceptance criteria or return rights are not recognized as revenue until all criteria are achieved.
We do not recognize revenue if undelivered products or services exist that are essential to the functionality of the delivered product in an arrangement.
- The fee is fixed or determinable.
Arrangements with payment terms extending beyond our standard terms, conditions and practices are not considered to be fixed or determinable.
Revenue from such arrangements is recognized at the earlier of customer payment or when the fees become due and payable.
We typically do not allow for price-protection rights with any of our value-added resellers or distributors.
- Collection is reasonably assured.
If there is considerable doubt surrounding the creditworthiness of a customer at the outset of an arrangement, the associated revenue is deferred and recognized upon cash receipt.
The hardware systems and software components essential to the functionality of the hardware systems are considered non-software deliverables and therefore are not subject to industry-specific software revenue recognition guidance.
Our product revenues also include revenues from the sale of non-essential software products.
Non-essential software sales generally include a perpetual license to our software.
Non-essential software sales are subject to the industry-specific software revenue recognition guidance.
Revenues from software maintenance and hardware maintenance services are recognized ratably over the contractual term, generally from one to five years.
We also offer extended warranty contracts (which extend our standard parts warranty and may include premium hardware maintenance) at the end of the original warranty term; revenues from these contracts are recognized ratably over their respective contract term.
For multiple element arrangements, we allocate revenue to the software deliverables and the non-software deliverables as a group based on the relative selling prices of all of the deliverables in the arrangement.
The selling price for each element is based upon the following selling price hierarchy: vendor specific objective evidence of selling price (VSOE) if available, third party evidence (TPE) if VSOE is not available, or estimated selling price (ESP) if neither VSOE nor TPE are available.
ESP is generally evidenced by a majority of historical transactions falling within a reasonable price range.
We also consider multiple factors, including, but not limited
to, cost of products, gross margin objectives, historical pricing practices, type of customer and distribution channels.
For our non-software deliverables, we generally allocate the arrangement consideration based on the relative selling price of the deliverables using ESP.
For our software maintenance services, we generally use VSOE.
An excerpt. Shown here: 40 of 454 rewritten, 40 of 383 added and 40 of 185 removed. The counts are complete. For every sentence, read Item 8. Financial Statements and Supplementary Data in the FY2019 filing and the FY2018 filing.
Item 9A. Controls and Procedures
4 rewritten, 0 added, 0 removed, 12 unchanged
Under the supervision and with the participation of our management, including our CEO and CFO, we carried out an evaluation of the effectiveness of the design and operation of our disclosure controls and procedures, as defined in Rules 13a-15(e) and 15d-15(e) under the Exchange Act, as of April [removed: 27, 2018,] [added: 26, 2019,] the end of the fiscal period covered by this Annual Report on Form 10-K (the Evaluation Date).
Based on this assessment, our management concluded that, as of April [removed: 27, 2018,] [added: 26, 2019,] our internal control over financial reporting was effective at the reasonable assurance level based on those criteria.
The effectiveness of our internal control over financial reporting as of April [removed: 27, 2018] [added: 26, 2019] has been audited by Deloitte & Touche LLP, an independent registered public accounting firm, as stated in their report, which is included in Part II, Item 8 of this Annual Report on Form 10-K.
There has been no change in our internal control over financial reporting identified in connection with our evaluation required by paragraph (d) of rules 13a-15 and 15d-15 under the Exchange Act that occurred during the fourth quarter of fiscal [removed: 2018] [added: 2019] that has materially affected, or is reasonably likely to materially affect, our internal control over financial reporting.
Item 10. Directors, Executive Officers and Corporate Governance
2 rewritten, 0 added, 0 removed, 4 unchanged
The information required by Item 10 with respect to our executive officers is incorporated herein by reference from the information under Item 1 – Business of Part I of this Annual Report on Form 10-K under the section entitled “Executive Officers.” The information required by Item 10 with respect to the Company’s directors and corporate governance is incorporated herein by reference from the information provided under the headings “Election of Directors” and “Corporate Governance,” respectively, in the Proxy Statement for the [removed: 2018] [added: 2019] Annual Meeting of Stockholders, which will be filed with the Securities and Exchange Commission within 120 days of our year ended April [removed: 27, 2018.][added: 26, 2019.]
The information required by Item 405 of Regulation S-K is incorporated herein by reference from the information provided under the heading “Section 16(a) Beneficial Ownership Reporting Compliance” in the Proxy Statement for the [removed: 2018] [added: 2019] Annual Meeting of Stockholders.
Item 11. Executive Compensation
1 rewritten, 0 added, 0 removed, 1 unchanged
Information regarding the compensation of executive officers and directors of the Company is incorporated by reference from the information under the headings “Executive Compensation and Related Information” and “Director Compensation,” respectively, in our Proxy Statement for the [removed: 2018] [added: 2019] Annual Meeting of Stockholders.
Item 12. Security Ownership of Certain Beneficial Owners and Management and Related Stockholder Matters
1 rewritten, 0 added, 0 removed, 1 unchanged
Information regarding security ownership of certain beneficial owners and management and related stockholder matters is incorporated by reference from the information under the heading “Security Ownership of Certain Beneficial Owners and Management” in our Proxy Statement for the [removed: 2018] [added: 2019] Annual Meeting of Stockholders.
Item 13. Certain Relationships and Related Transactions, and Director Independence
1 rewritten, 0 added, 0 removed, 1 unchanged
Information regarding certain relationships and related transactions and director independence is incorporated by reference from the information under the headings “Corporate Governance” and “Certain Transactions with Related Parties” in our Proxy Statement for the [removed: 2018] [added: 2019] Annual Meeting of Stockholders.
Item 14. Principal Accountant Fees and Services
1 rewritten, 0 added, 0 removed, 3 unchanged
The information required by this item is incorporated by reference from the information under the caption “Audit Fees” in our Proxy Statement for the [removed: 2018] [added: 2019] Annual Meeting of Stockholders.
Item 15. Exhibits, Financial Statement Schedules
56 rewritten, 24 added, 6 removed, 139 unchanged
| [removed: 10.3*] [added: 10.6*] | | [The Company’s Amended and Restated [removed: Executive Compensation] [added: Employee Stock Purchase] Plan, as amended effective July [removed: 23, 2014.](http://www.sec.gov/Archives/edgar/data/1002047/000119312514280484/d691163ddef14a.htm)] [added: 19, 2018.](http://www.sec.gov/Archives/edgar/data/1002047/000119312518234919/d502295ddef14a.htm#toc502295_113)] | | DEF 14A | | 000-27130 | | Appendix [removed: C] [added: B] | | [removed: July 25, 2014] [added: August 1, 2018] |
| [removed: 10.4*] [added: 10.5*] | | [The Company’s Deferred Compensation Plan.](http://www.sec.gov/Archives/edgar/data/1002047/000129993305003338/exhibit1.htm) | | 8-K | | 000-27130 | | 2.1 | | July 7, 2005 |
| [removed: 10.5*] [added: 10.11*] | | [The Company’s Amended and Restated [removed: Employee] [added: 1999] Stock [removed: Purchase] [added: Option] Plan, as amended effective July [removed: 17, 2017.](http://www.sec.gov/Archives/edgar/data/1002047/000119312517244241/d420710ddef14a.htm)] [added: 19, 2018.](http://www.sec.gov/Archives/edgar/data/1002047/000119312518234919/d502295ddef14a.htm#toc502295_112)] | | DEF 14A | | 000-27130 | | Appendix [removed: B] [added: A] | | August 1, [removed: 2017] [added: 2018] |
| [removed: 10.6*] [added: 10.7*] | | [removed: [The] [added: The] Company’s Amended and Restated 1995 Stock Incentive [removed: Plan.](http://www.sec.gov/Archives/edgar/data/1002047/0000891618-98-004020.txt)] [added: Plan. (P)] | | DEF 14A | | 000-27130 | | | | August 21, 1998 |
| [removed: 10.7*] [added: 10.8*] | | [Form of Stock Option Agreement approved for use under the Company’s amended and restated 1995 Stock Option Plan.](http://www.sec.gov/Archives/edgar/data/1002047/000095013405013074/f10166exv10w21.htm) | | 10-K | | 000-27130 | | 10.21 | | July 8, 2005 |
| [removed: 10.8*] [added: 10.9*] | | [Form of Stock Issuance Agreement approved for use under the Company’s amended and restated 1995 Stock Option Plan (Restricted Stock).](http://www.sec.gov/Archives/edgar/data/1002047/000095013405013074/f10166exv10w23.htm) | | 10-K | | 000-27130 | | 10.23 | | July 8, 2005 |
| [removed: 10.9*] [added: 10.10*] | | [Form of Stock Option Agreement approved for use under the Company’s amended and restated 1995 Stock Option Plan (Chairman of the Board or any Board Committee Chairperson).](http://www.sec.gov/Archives/edgar/data/1002047/000095013405013074/f10166exv10w22.htm) | | 10-K | | 000-27130 | | 10.22 | | July 8, 2005 |
| [removed: 10.10*] [added: 10.28*] | | [removed: [The] [added: [Form of Stock Option Agreement approved for use under the] Company’s [removed: Amended] [added: amended] and [removed: Restated] [added: restated] 1999 Stock Option [removed: Plan, as amended effective July 20, 2017.](http://www.sec.gov/Archives/edgar/data/1002047/000119312517244241/d420710ddef14a.htm)] [added: Plan (China).](http://www.sec.gov/Archives/edgar/data/1002047/000095013405013074/f10166exv10w27.htm)] | | [removed: DEF 14A] [added: 10-K] | | 000-27130 | | [removed: Appendix A] [added: 10.27] | | [removed: August 1, 2017] [added: July 8, 2005] |
| [removed: 10.11*] [added: 10.12*] | | [Form of Stock Option Agreement approved for use under the Company’s amended and restated 1999 Stock Option Plan.](http://www.sec.gov/Archives/edgar/data/1002047/000119312513454984/d594786dex103.htm) | | 10-Q | | 000-27130 | | 10.3 | | November 26, 2013 |
| [removed: 10.12*] [added: 10.13*] | | [Form of Restricted Stock Unit Agreement approved for use under the Company’s amended and restated 1999 Stock Option Plan (Employees).](http://www.sec.gov/Archives/edgar/data/1002047/000119312513454984/d594786dex104.htm) | | 10-Q | | 000-27130 | | 10.4 | | November 26, 2013 |
| [removed: 10.13*] [added: 10.15*] | | [Form of Stock Option Agreement approved for use under the Company’s amended and restated 1999 Stock Option Plan (Non-Employee Director Automatic Stock Option — Initial).](http://www.sec.gov/Archives/edgar/data/1002047/000095013405013074/f10166exv10w29.htm) | | 10-K | | 000-27130 | | 10.29 | | July 8, 2005 |
| [removed: 10.14*] [added: 10.16*] | | [Form of Stock Option Agreement approved for use under the Company’s amended and restated 1999 Stock Option Plan (Non-Employee Director Automatic Stock Option — Annual).](http://www.sec.gov/Archives/edgar/data/1002047/000095013405013074/f10166exv10w28.htm) | | 10-K | | 000-27130 | | 10.28 | | July 8, 2005 |
| [removed: 10.15*] [added: 10.17*] | | [Form of Restricted Stock Unit Agreement approved for use under the Company’s amended and restated 1999 Stock Option Plan (Non-Employees Directors).](http://www.sec.gov/Archives/edgar/data/1002047/000095012310059271/f56118exv10w17.htm) | | 10-K | | 000-27130 | | 10.17 | | June 18, 2010 |
| [removed: 10.16*] [added: 10.20*] | | [Form of Restricted Stock Unit Agreement (Performance Based) under the NetApp, Inc. 1999 Stock Option Plan.](http://www.sec.gov/Archives/edgar/data/1002047/000119312515237314/d948233dex101.htm) | | 8-K | | 000-27130 | | 10.1 | | June 26, 2015 |
| [removed: 10.17*] [added: 10.29*] | | [Form of Stock Option Agreement approved for use under the Company’s amended and restated 1999 Stock Option Plan [removed: (China).](http://www.sec.gov/Archives/edgar/data/1002047/000095013405013074/f10166exv10w27.htm)] [added: (France).](http://www.sec.gov/Archives/edgar/data/1002047/000095013405013074/f10166exv10w30.htm)] | | 10-K | | 000-27130 | | [removed: 10.27] [added: 10.30] | | July 8, 2005 |
| [removed: 10.18*] [added: 10.30*] | | [Form of Stock Option Agreement approved for use under the Company’s amended and restated 1999 Stock Option Plan [removed: (France).](http://www.sec.gov/Archives/edgar/data/1002047/000095013405013074/f10166exv10w30.htm)] [added: (India).](http://www.sec.gov/Archives/edgar/data/1002047/000095013405013074/f10166exv10w31.htm)] | | 10-K | | 000-27130 | | [removed: 10.30] [added: 10.31] | | July 8, 2005 |
| [removed: 10.19*] [added: 10.31*] | | [Form of Stock Option Agreement approved for use under the Company’s amended and restated 1999 Stock Option Plan [removed: (India).](http://www.sec.gov/Archives/edgar/data/1002047/000095013405013074/f10166exv10w31.htm)] [added: (United Kingdom).](http://www.sec.gov/Archives/edgar/data/1002047/000095013405013074/f10166exv10w32.htm)] | | 10-K | | 000-27130 | | [removed: 10.31] [added: 10.32] | | July 8, 2005 |
| [removed: 10.20*] [added: 10.32*] | | [Form of Stock Option Agreement approved for use under the Company’s amended and restated 1999 Stock Option Plan [removed: (United Kingdom).](http://www.sec.gov/Archives/edgar/data/1002047/000095013405013074/f10166exv10w32.htm)] [added: (Israel).](http://www.sec.gov/Archives/edgar/data/1002047/000095013408011751/f38790exv10w81.htm)] | | 10-K | | 000-27130 | | [removed: 10.32] [added: 10.81] | | [removed: July 8, 2005] [added: June 24, 2008] |
| 10.21* | | [Form of [added: Restricted] Stock [removed: Option] [added: Unit] Agreement [added: (Performance-Based) Total Stockholder Return] approved for use under the Company’s [removed: amended and restated] 1999 Stock Option [removed: Plan (Israel).](http://www.sec.gov/Archives/edgar/data/1002047/000095013408011751/f38790exv10w81.htm)] [added: Plan.](http://www.sec.gov/Archives/edgar/data/1002047/000156459018022123/ntap-ex102_60.htm)] | | [removed: 10-K] [added: 10-Q] | | 000-27130 | | [removed: 10.81] [added: 10.2] | | [removed: June 24, 2008] [added: August 21, 2018] |
| [removed: 10.23*] [added: 10.33*] | | [Bycast Inc. 2010 Equity Incentive Plan.](http://www.sec.gov/Archives/edgar/data/1002047/000095012310059322/f56136exv99w1.htm) | | S-8 | | 333-167619 | | 99.1 | | June 18, 2010 |
| [removed: 10.24*] [added: 10.34*] | | [Incentive Stock Option Plan of Bycast Inc.](http://www.sec.gov/Archives/edgar/data/1002047/000095012310059322/f56136exv99w2.htm) | | S-8 | | 333-167619 | | 99.2 | | June 18, 2010 |
| [removed: 10.25*] [added: 10.35*] | | [SolidFire, Inc. 2010 Stock Incentive Plan.](http://www.sec.gov/Archives/edgar/data/1002047/000119312516467124/d129742dex991.htm) | | S-8 | | 333-209570 | | 99.1 | | February 17, 2016 |
| [removed: 10.26*] [added: 10.36*] | | [SolidFire, Inc. 2016 Equity Incentive Plan.](http://www.sec.gov/Archives/edgar/data/1002047/000119312516467124/d129742dex992.htm) | | S-8 | | 333-209570 | | 99.2 | | February 17, 2016 |
| [removed: 10.28*] [added: 10.38*] | | [Offer Letter for employment at the Company to Ronald Pasek, dated March 22, 2016.](http://www.sec.gov/Archives/edgar/data/1002047/000156459016020754/ntap-ex1035_261.htm) | | 10-K | | 000-27130 | | 10.35 | | June 22, 2016 |
| [removed: 10.29*] [added: 10.39] | | [NetApp, Inc. Executive Retiree Health Plan, as amended and restated.](http://www.sec.gov/Archives/edgar/data/1002047/000119312516773699/d298977dex101.htm) | | 8-K | | 000-27130 | | 10.1 | | November 21, 2016 |
| [removed: 10.30] [added: 10.40] | | [Credit Agreement, dated as of December 12, 2016, by and among the Company, the lenders from time to time party thereto, JPMorgan Chase Bank, N.A., as administrative agent, Bank of America, N.A. and Wells Fargo Bank, National Association, as co-syndication agents, and The Bank of Tokyo-Mitsubishi UFJ, Ltd. and Citibank, N.A., as co-documentation agents.](http://www.sec.gov/Archives/edgar/data/1002047/000119312516790334/d311449dex101.htm) | | 8-K | | 000-27130 | | 10.1 | | December 12, 2016 |
| [removed: 10.31] [added: 10.41] | | [Amendment No. 1 to Credit Agreement, dated as of July 17, 2017, by and among the Company, the financial institutions listed on the signature pages and JPMorgan Chase Bank, N.A., as administrative agent.](http://www.sec.gov/Archives/edgar/data/1002047/000119312517229002/d423129dex101.htm) | | 8-K | | 000-27130 | | 10.1 | | July 17, 2017 |
| [removed: 10.32] [added: 10.42] | | [Form of Dealer Agreement between the Company, as issuer, and each Dealer.](http://www.sec.gov/Archives/edgar/data/1002047/000119312516790334/d311449dex102.htm) | | 8-K | | 000-27130 | | 10.2 | | December 12, 2016 |
| [removed: 10.33] [added: 10.43] | | [Collared Accelerated Share Repurchase Transaction dated as of June 5, 2013, by and between the Company and Goldman, Sachs & Co.](http://www.sec.gov/Archives/edgar/data/1002047/000119312513352036/d562384dex101.htm) | | 10-Q | | 000-27130 | | 10.1 | | August 29, 2013 |
| [removed: 10.34] [added: 10.44] | | [Agreement of Purchase and Sale and Joint Escrow Instructions dated as of March 9, 2016 by and between the Company and Google Inc.](http://www.sec.gov/Archives/edgar/data/1002047/000156459016020754/ntap-ex1041_262.htm) | | 10-K | | 000-27130 | | 10.41 | | June 22, 2016 |
| [removed: 10.35] [added: 10.45] | | [First Amendment to Agreement of Purchase and Sale and Joint Escrow Instructions dated as of March 11, 2016, by and between the Company and Google Inc.](http://www.sec.gov/Archives/edgar/data/1002047/000156459016020754/ntap-ex1042_263.htm) | | 10-K | | 000-27130 | | 10.42 | | June 22, 2016 |
| [removed: 10.36] [added: 10.46] | | [Second Amendment to Agreement of Purchase and Sale and Joint Escrow Instructions dated as of April 8, 2016, by and between the Company and Google Inc.](http://www.sec.gov/Archives/edgar/data/1002047/000156459016020754/ntap-ex1043_264.htm) | | 10-K | | 000-27130 | | 10.43 | | June 22, 2016 |
| [removed: 10.37] [added: 10.47] | | [Agreement of Purchase and Sale and Joint Escrow Instructions dated as of September 11, 2017 by and between the Company and Google Inc.](http://www.sec.gov/Archives/edgar/data/1002047/000156459017024351/ntap-ex102_97.htm) | | 10-Q | | 000-27130 | | 10.2 | | November 29, 2017 |
| [removed: 10.38] [added: 10.48] | | [First Amendment to Agreement of Purchase and Sale and Joint Escrow Instructions dated as of October 2, 2017, by and between the Company and Google LLC.](http://www.sec.gov/Archives/edgar/data/1002047/000156459017024351/ntap-ex103_149.htm) | | 10-Q | | 000-27130 | | 10.3 | | November 29, 2017 |
| [removed: 10.39] [added: 10.49] | | [Second Amendment to Agreement of Purchase and Sale and Joint Escrow Instructions dated as of October 25, 2017, by and between the Company and Google LLC.](http://www.sec.gov/Archives/edgar/data/1002047/000156459017024351/ntap-ex104_150.htm) | | 10-Q | | 000-27130 | | 10.4 | | November 29, 2017 |
| [removed: 10.40] [added: 10.50] | | [Third Amendment to Agreement of Purchase and Sale and Joint Escrow Instructions dated as of October 31, 2017, by and between the Company and Google LLC.](http://www.sec.gov/Archives/edgar/data/1002047/000156459018002876/ntap-ex101_69.htm) | | 10-Q | | 000-27130 | | 10.1 | | February 22, 2018 |
| [removed: 10.41] [added: 10.51] | | [Fourth Amendment to Agreement of Purchase and Sale and Joint Escrow Instructions dated as of November 2, 2017, by and between the Company and Google LLC.](http://www.sec.gov/Archives/edgar/data/1002047/000156459018002876/ntap-ex102_68.htm) | | 10-Q | | 000-27130 | | 10.2 | | February 22, 2018 |
| [removed: 10.42] [added: 10.52] | | [Fifth Amendment to Agreement of Purchase and Sale and Joint Escrow Instructions dated as of November 8, 2017, by and between the Company and Google LLC.](http://www.sec.gov/Archives/edgar/data/1002047/000156459018002876/ntap-ex103_66.htm) | | 10-Q | | 000-27130 | | 10.3 | | February 22, 2018 |
| [removed: 10.43] [added: 10.53] | | [Sixth Amendment to Agreement of Purchase and Sale and Joint Escrow Instructions dated as of November 10, 2017, by and between the Company and Google LLC.](http://www.sec.gov/Archives/edgar/data/1002047/000156459018002876/ntap-ex104_67.htm) | | 10-Q | | 000-27130 | | 10.4 | | February 22, 2018 |
| 21.1 | | [Subsidiaries of the [removed: Company.](https://www.sec.gov/Archives/edgar/data/1002047/000156459018015820/ntap-ex211_8.htm)] [added: Company.](https://www.sec.gov/Archives/edgar/data/1002047/000156459019022779/ntap-ex211_76.htm)] | | — | | — | | — | | — |
| 10.3* | | [Form of Change of Control Severance Agreement.](http://www.sec.gov/Archives/edgar/data/1002047/000156459019020164/ntap-ex101_40.htm) | | 8-K | | 000-27130 | | 10.1 | | May 22, 2019 |
| 10.4* | | [The Company’s Amended and Restated Executive Compensation Plan, as amended effective June 20, 2018.](http://www.sec.gov/Archives/edgar/data/1002047/000156459018022123/ntap-ex101_59.htm) | | 10-Q | | 000-27130 | | 10.1 | | August 21, 2018 |
| 10.14* | | [Form of Restricted Stock Unit Agreement (Employees) approved for use under the Company’s 1999 Stock option Plan, effective June 2019.](https://www.sec.gov/Archives/edgar/data/1002047/000156459019022779/ntap-ex1014_240.htm) | | — | | — | | — | | — |
| 10.18* | | [Form of Restricted Stock Unit Agreement (Non-Employee Directors) approved for use under the Company’s 1999 Stock Option Plan.](http://www.sec.gov/Archives/edgar/data/1002047/000156459018029831/ntap-ex102_7.htm) | | 10-Q | | 000-27130 | | 10.2 | | February 11, 2019 |
| 10.19* | | [Form of Restricted Stock Unit Agreement (Non-Employee Directors) approved for use under the Company’s 1999 Stock Option Plan, effective June 2019.](https://www.sec.gov/Archives/edgar/data/1002047/000156459019022779/ntap-ex1019_72.htm) | | — | | — | | — | | — |
| 10.22* | | [Form of Restricted Stock Unit Agreement (Performance-Based) – Adjusted Operating Income approved for use under the Company’s 1999 Stock Option Plan.](http://www.sec.gov/Archives/edgar/data/1002047/000156459018022123/ntap-ex102_60.htm) | | 10-Q | | 000-27130 | | 10.3 | | August 21, 2018 |
| 10.23* | | [Form of Restricted Stock Unit Agreement (Performance-Based) Total Stockholder Return approved for use under the Company’s 1999 Stock Option Plan, effective June 2019.](https://www.sec.gov/Archives/edgar/data/1002047/000156459019022779/ntap-ex1023_241.htm) | | — | | — | | — | | — |
| 10.24* | | [Form of Restricted Stock Unit Agreement (Performance-Based) – Adjusted Operating Income approved for use under the Company’s 1999 Stock Option Plan, effective June 2019.](https://www.sec.gov/Archives/edgar/data/1002047/000156459019022779/ntap-ex1024_242.htm) | | — | | — | | — | | — |
| 10.37* | | [Outside Director Compensation Policy (effective September 1, 2018) of the Company.](http://www.sec.gov/Archives/edgar/data/1002047/000156459018029831/ntap-ex101_6.htm) | | 10-Q | | 000-27130 | | 10.1 | | February 11, 2019 |
| | | | | Incorporation by Reference | | | | | | |
| --- | --- | --- | --- | --- | --- | --- | --- | --- | --- | --- |
| Exhibit No | | Description | | Form | | File No. | | Exhibit | | Filing Date |
| 10.54 | | [Seventh Amendment to the Agreement of Purchase and Sale and Joint Escrow Instructions dated as of March 15, 2019 by and between the Company and Google LLC.](https://www.sec.gov/Archives/edgar/data/1002047/000156459019022779/ntap-ex1054_74.htm) | | — | | — | | — | | — |
| | | | | Incorporation by Reference | | | | | | |
| --- | --- | --- | --- | --- | --- | --- | --- | --- | --- | --- |
| Exhibit No | | Description | | Form | | File No. | | Exhibit | | Filing Date |
| | | | | | | | | | | |
| | | | | | | | | | | |
| | | | | | | | | | | |
| | | | | | | | | | | |
| | | | | | | | | | | |
| | | | | | | | | | | |
| | | | | | | | | | | |
(p)Identifies paper format filed exhibit.
| --- | --- |
| 10.22* | | [Onaro, Inc. Amended and Restated 2002 Stock Option and Incentive Plan (including Appendix — Israeli Taxpayers).](http://www.sec.gov/Archives/edgar/data/1002047/000089161808000116/f38137exv4w1.htm) | | S-8 | | 333-149375 | | 4.1 | | February 25, 2008 |
| 10.27* | | [Outside Director Compensation Policy.](http://www.sec.gov/Archives/edgar/data/1002047/000119312512275547/d328654dex1065.htm) | | 10-K | | 000-27130 | | 10.65 | | June 19, 2012 |
| | | | | |
| /s/ ALAN L. EARHART | | Director | | June 19, 2018 |
| Alan L. Earhart | | | | |
An excerpt. Shown here: 40 of 56 rewritten, all 24 added and all 6 removed. The counts are complete. For every sentence, read Item 15. Exhibits, Financial Statement Schedules in the FY2019 filing and the FY2018 filing.