 filings.tools
NetApp 2025 10-K Annual Report
NTAP · CIK 1002047 · Form 10-K · Fiscal year ended April 25, 2025 · Filed June 9, 2025
23 sections, 411K characters. Original on sec.gov · Markdown · JSON
Risk FactorsBusinessMD&AFinancial StatementsWhat changed vs 2024
Cover and table of contents
UNITED STATES
SECURITIES AND EXCHANGE COMMISSION
Washington, D.C. 20549
Form 10-K
(Mark One)
☑ ANNUAL REPORT PURSUANT TO SECTION 13 OR 15(d) OF THE SECURITIES EXCHANGE ACT OF 1934
For the fiscal year ended April 25, 2025
or
☐ TRANSITION REPORT PURSUANT TO SECTION 13 OR 15(d) OF THE SECURITIES EXCHANGE ACT OF 1934
For the transition period from to
Commission File Number 000-27130
NetApp, Inc.
(Exact name of registrant as specified in its charter)
| Delaware | 77-0307520 | |
| (State or other jurisdiction of | (I.R.S. Employer | |
| incorporation or organization) | Identification No.) |
3060 Olsen Drive**,**
San Jose**,** California 95128
(Address of principal executive offices, including zip code)
(408) 822-6000
(Registrant’s telephone number, including area code)
Securities registered pursuant to Section 12(b) of the Act:
| Title of each class | Trading Symbol(s) | Name of exchange on which registered | |
| Common Stock, $0.001 Par Value | NTAP | The NASDAQ Stock Market LLC |
Securities registered pursuant to Section 12(g) of the Act:
None
Indicate by check mark if the registrant is a well-known seasoned issuer, as defined in Rule 405 of the Securities Act. Yes ☑ No ☐
Indicate by check mark if the registrant is not required to file reports pursuant to Section 13 or Section 15(d) of the Act. Yes ☐ No ☑
Indicate by check mark whether the registrant (1) has filed all reports required to be filed by Section 13 or 15(d) of the Securities Exchange Act of 1934 during the preceding 12 months (or for such shorter period that the registrant was required to file such reports), and (2) has been subject to such filing requirements for the past 90 days. Yes ☑ No ☐
Indicate by check mark whether the registrant has submitted electronically every Interactive Data File required to be submitted pursuant to Rule 405 of Regulation S-T (§232.405 of this chapter) during the preceding 12 months (or for such shorter period that the registrant was required to submit such files). Yes ☑ No ☐
Indicate by check mark whether the registrant is a large accelerated filer, an accelerated filer, a non-accelerated filer, a smaller reporting company, or an emerging growth company. See the definitions of “large accelerated filer,” “accelerated filer,” “smaller reporting company,” and “emerging growth company” in Rule 12b-2 of the Exchange Act.
| Large accelerated filer | ☑ | Accelerated filer | ☐ | |||
| Non-accelerated filer | ☐ | Smaller reporting company | ☐ | |||
| Emerging growth company | ☐ |
If an emerging growth company, indicate by check mark if the registrant has elected not to use the extended transition period for complying with any new or revised financial accounting standards provided pursuant to Section 13(a) of the Exchange Act. ☐
Indicate by check mark whether the registrant has filed a report on and attestation to its management’s assessment of the effectiveness of its internal control over financial reporting under Section 404(b) of the Sarbanes-Oxley Act (15 U.S.C. 7262(b)) by the registered public accounting firm that prepared or issued its audit report.☑
If securities are registered pursuant to Section 12(b) of the Act, indicate by check mark whether the financial statements of the registrant included in the filing reflect the correction of an error to previously issued financial statements. ☐
Indicate by check mark whether any of those error corrections are restatements that required a recovery analysis of incentive-based compensation received by any of the registrant's executive officers during the relevant recovery period pursuant to §240.10D-1(b). ☐
Indicate by check mark whether the registrant is a shell company (as defined in Rule 12b-2 of the Exchange Act). Yes ☐ No ☑
The aggregate market value of voting stock held by non-affiliates of the registrant, as of October 25, 2024, the last business day of the registrant’s most recently completed second fiscal quarter, was approximately $16.6 billion (based on the closing price for shares of the registrant’s common stock as reported by the NASDAQ Global Select Market on that date). Shares of common stock held by each executive officer, director, and holder of 5% or more of the outstanding common stock have been excluded in that such persons may be deemed to be affiliates. This determination of possible affiliate status is not a conclusive determination for other purposes.
On May 29, 2025, 200,366,162 shares of the registrant’s common stock, $0.001 par value, were outstanding.
DOCUMENTS INCORPORATED BY REFERENCE
The information called for by Part III of this Form 10-K is hereby incorporated by reference from the definitive Proxy Statement for our annual meeting of stockholders, which will be filed with the Securities and Exchange Commission not later than 120 days after April 25, 2025.
TABLE OF CONTENTS
Cautionary Note on Forward-Looking Statements
This Annual Report on Form 10-K contains forward-looking statements within the meaning of Section 27A of the Securities Act of 1933, as amended, and Section 21E of the Securities Exchange Act of 1934, as amended (the Exchange Act). Forward-looking statements are all statements (and their underlying assumptions) included in this document that refer, directly or indirectly, to future events or outcomes and, as such, are inherently not factual, but rather reflect only our current projections for the future. Consequently, forward-looking statements usually include words such as “committed,” “estimate,” “intend,” “plan,” “positions,” “predict,” “seek,” “strive,” “may,” “will,” “should,” “would,” “could,” “anticipate,” “expect,” “believe,” or similar words, in each case, intended to refer to future events or circumstances. A non-comprehensive list of the topics including forward-looking statements in this document includes:
our future financial and operating results;
our strategy;
our beliefs and objectives for future operations, research and development;
expectations regarding future product releases, growth and performance;
global political, economic and industry conditions and trends;
expected timing of, customer acceptance of and benefits from, product introductions, developments and enhancements;
expected benefits from acquisitions, joint ventures, growth opportunities and investments;
expected outcomes from legal, regulatory and administrative proceedings;
our competitive position;
our short-term and long-term cash requirements, including, without limitation, anticipated capital expenditures;
our anticipated tax rate;
the repayment of our indebtedness; and
future uses of our cash, including, without limitation, the continuation of our stock repurchase and cash dividend programs.
All forward-looking statements included in this document are inherently uncertain as they are based on management’s current expectations and assumptions concerning future events and are subject to numerous known and unknown risks and uncertainties. Therefore, actual events and results may differ materially from these forward-looking statements. Factors that could cause actual results to differ materially from those described herein include, but are not limited to:
the overall growth, technological trends and market changes in the storage and data management solutions market;
our ability to develop, introduce and gain market acceptance for new and differentiated offerings without disruption;
our ability to accurately forecast demand for our products, solutions and services, and future financial performance;
the actions of our competitors including, without limitation, their ability to introduce competitive technologies, products or services, and to acquire businesses and technologies that negatively impact our strategy, operations or customer demand for our products or services;
our ability to maintain our gross margins;
general global political, macroeconomic, social, health and market conditions;
our ability to effectively plan and manage our resources and restructure our business in response to changing market conditions and market demand;
our ability to anticipate trends related to the development and use of artificial intelligence (AI), including generative AI, which impacts the adoption of intelligent data infrastructure;
disruptions in our supply chain, which could limit our ability to ship products to our customers in the amounts and at the prices forecasted;
our ability to maintain our customer, partner, supplier, reseller, distributor and contract manufacturer relationships, including with public cloud providers, on favorable terms and conditions;
the impact of industry consolidation affecting our suppliers, competitors, partners and customers;
our ability to anticipate techniques used to obtain unauthorized access or to sabotage systems and to implement adequate preventative measures against cybersecurity and other security breaches on our or third parties' systems, products and services;
our ability to successfully recruit and retain qualified personnel and to manage our investment in people, processes and systems;
our ability to effectively integrate acquired businesses, products, services and technologies;
failure of our products and services to meet our customers’ quality requirements, including, without limitation, any epidemic failure event relating to our systems installed by our customers in their IT infrastructures;
changes and uncertainty in U.S. government spending and demand for our products;
changes and uncertainty in global trade controls, including tariffs and economic sanctions;
our ability to resolve ongoing litigation, tax audits, government audits, inquiries and investigations in line with our expectations;
our ability to comply with evolving regulatory and contractual requirements, including certifications;
the availability of acceptable financing to support our future cash requirements;
valuation and liquidity of our investment portfolio;
foreign exchange rate impacts;
interest rate and inflationary pressure impacts;
our ability to achieve our goals related to sustainability and corporate responsibility matters; and
those factors discussed under the heading “Risk Factors” elsewhere in this Annual Report on Form 10-K.
Readers are cautioned not to place undue reliance on these forward-looking statements, which speak only as of the date of this document and are based upon information available to us at this time. These statements are not guarantees of future performance. Except as required by law, we disclaim any obligation to update information in any forward-looking statement. Actual results could vary from our forward-looking statements due to the foregoing factors as well as other important factors.
PA****RT I
Item 1. Business
Overview
NetApp, Inc. (NetApp, we, us, or the Company) helps customers make their data infrastructure more seamless, more dynamic, and higher performing. We were incorporated in 1992, are headquartered in San Jose, California, and provide a full range of enterprise-class software, systems and services that customers use to transform their data infrastructures across data types, workloads, and environments to realize business possibilities.
We leverage over thirty years of innovation to make data infrastructure intelligent. Our unified data storage solutions deliver flexible, simplified, and silo-free infrastructure. Our active data management capabilities focus on security, compliance, and sustainability, while our adaptive operations enhance performance, efficiency, and productivity. Our extensive portfolio integrates hybrid and multi-cloud environments, addressing key customer priorities such as modernizing legacy systems, enhancing resilience against ransomware, and developing scalable, high-performance data pipelines for artificial intelligence (AI) workloads.
NetApp empowers customers to harness their data for accelerated innovation, improved operations, and competitive advantage. Our unified data storage solutions provide the flexibility to consistently and easily store any data type and support any workload. As the only enterprise-grade storage service natively embedded in the world’s largest clouds, we power data across Amazon AWS, Microsoft Azure, and Google Cloud. Our integrated data services enable active data management, security, protection, governance, and sustainability. Additionally, our operational services support adaptive operations across infrastructure, applications, and teams. Together with our Hybrid Cloud products, these services enable customers to construct a seamless, intelligent data infrastructure across hybrid multi-cloud environments.
Together, these capabilities comprise an intelligent data infrastructure that delivers:
Operational simplicity, so customers can manage complex workloads and eliminate infrastructure silos across apps, data, and clouds.
Cyber resilience and security, so businesses stay up and running with built-in ransomware protection, rapid recovery, and infrastructure observability.
AI innovation, embedding intelligence into data infrastructure to enable AI workloads that deliver new levels of productivity and innovation.
Infrastructure savings, so on-premises and cloud infrastructure spend go further with high-efficiency data storage and automated capacity and cloud cost management.
Sustainability, achieved via energy-efficient technologies, tiering, and analytics.
Scalability and agility to maximize infrastructure and application extensibility and team responsiveness.
Our strategy revolves around serving the world's most critical organizations by addressing their complex data management challenges in the age of data. We emphasize the importance of an intelligent data infrastructure that provides flexibility, security, and simplicity at scale. This infrastructure integrates seamlessly with hybrid cloud environments, modernizes application portfolios, and enhances security while ensuring efficiency and performance. NetApp’s unified storage and data management platform, along with embedded data and operational services, enables customers to unify their data for AI, recover from malicious attacks, and achieve significant productivity gains through autonomous, self-healing capabilities.
Our unique approach is built on a unified platform that combines intelligent storage and data architecture with software, AI, and APIs, creating an intelligent data fabric. This platform, exemplified by the ONTAP operating system and BlueXP control plane, provides consistent data experiences and optimized storage operations across on-premises, cloud, and edge environments. Our long history of disciplined execution and architectural excellence has positioned us as a market leader, with a strong presence in the world's leading public clouds and the ability to deliver transformative flexibility and simplicity at scale.
Our market strategy targets large and growing markets, including hybrid cloud, public cloud, flash storage, block storage, and AI. We are expanding our strong position in the unstructured data market and disrupting the mature block storage market with block-optimized flash storage. Our integration with major public cloud providers like Amazon AWS, Microsoft Azure, and Google Cloud positions us to capitalize on cloud migrations and enterprise workloads. In the AI space, we leverage our expertise in unstructured data management to support the entire AI lifecycle, from data foundations to deploying hybrid cloud architectures, ensuring rapid time-to-market and responsible AI deployment.
Product, Solutions and Services Portfolio
Our operations are organized into two segments: Hybrid Cloud and Public Cloud.
Hybrid Cloud
Hybrid Cloud provides a unified data storage portfolio of storage management and infrastructure solutions that helps customers modernize their data centers. By leveraging on-premises, private cloud and public cloud capabilities, we enable customers to modernize applications with a single solution that supports file, block, and object storage. We deliver a versatile data infrastructure solution suitable for all environments and workloads, including the strategic enterprise AI market. Our Hybrid Cloud portfolio accommodates both structured and unstructured data with unified storage optimized for flash, disk, and cloud storage, capable of handling data-intensive workloads and applications. Hybrid Cloud includes software, hardware, and related support, along with professional and other services.
Data management software
NetApp ONTAP software is our foundational technology that underpins NetApp’s critical storage solutions in the on-premises data center and in private and public clouds. ONTAP includes various data management and protection features and capabilities, including automatic ransomware protection against cyber-attacks, built-in data transport features, and storage efficiency capabilities. ONTAP provides the flexibility to design and deploy a storage environment across the broadest range of architectures – from on-premises to hybrid, private, and public clouds. It can be used in NAS, SAN, object, and container environments, as well as software-defined storage (SDS) situations.
Data integrity, security, and business continuity are at the heart of any company’s data center. With the extensive software tools and utilities delivered in ONTAP One, our all-in-one software license, customers can realize their business continuity goals with time, costs, and personnel savings. With NetApp Snapshot, customers can create and manage point-in-time file system copies with no performance impact and minimal storage consumption. This is important for continuous data protection of information in read-only, static, and immutable form. NetApp SnapCenter Backup Management software is designed to deliver high-performance backup and recovery for database and application workloads hosted on ONTAP storage. NetApp SnapMirror Data Replication software can replicate data at high speeds across environments. SnapMirror delivers robust data management capabilities for virtualization, protecting critical data while providing the flexibility to move data between locations and storage tiers, including cloud service providers. NetApp SnapLock Data Compliance software delivers high-performance disk-based data permanence for HDD and SSD deployments.
ONTAP also includes industry-leading cyber resilience solutions that are designed to maximize data protection and security and increase data governance and compliance. NetApp keeps data protected and secured by aligning with the National Institute of Standards and Technology cybersecurity framework, working to block cybersecurity threats and mitigate the high cost of downtime. The built-in, AI-powered Autonomous Ransomware Protection operates natively in the storage layer, combating evolving threats with real-time detection for rapid response and recovery.
Storage infrastructure
NetApp All-Flash FAS (AFF A-Series) is a scale-out platform built for virtualized and containerized environments, combining low-latency performance via performance-optimized flash solid state drives with best-in-class data management, built-in efficiencies, integrated data protection, multiprotocol support, and nondisruptive operations. AFF A-Series, powered by ONTAP, allows customers to connect to clouds for more data services, data tiering, caching, and disaster recovery. The AFF A-Series has a portfolio of products designed for multiple markets and price/performance considerations, from smaller channel commercial market offerings to large-scale, global enterprises.
NetApp All-Flash FAS with capacity flash (AFF C-Series) provides customers with capacity-optimized flash solid state drives which balance performance and affordability. AFF C-Series arrays, powered by ONTAP, are sustainable, scalable, and secure solutions for Tier 1 and Tier 2 applications. The AFF C-Series is ideal for transitioning from hybrid/HDD to all-flash storage; running non-latency sensitive VMware database applications and file environments; and providing a solution for secondary storage targets for disaster recovery, backup, and tiering.
NetApp All-Flash SAN Array (ASA A-Series & C-Series) is NetApp’s modern block storage with best-in-class speed, efficiency, security, sustainability, and cloud integration to accelerate virtual machines and databases. ASA arrays are also powered by NetApp ONTAP but optimized and simplified for SAN workloads. The ASA includes a 99.9999% guaranteed uptime and guaranteed 4:1 storage efficiency.
NetApp Fabric Attached Storage (FAS) series are high-capacity data storage devices powered by NetApp ONTAP. NetApp FAS Storage Arrays provide customers with a balance of performance and capacity running disk drives or hybrid-flash configurations. FAS systems are suitable for secondary storage targets for disaster recovery, backup, and tiering.
NetApp E/EF series is built for dedicated, high-bandwidth applications that need simple, fast SAN storage with enterprise-grade reliability. The E-Series is available as a hybrid-flash platform, while the EF-Series is all-flash. Built on the SANtricity storage operating system, the E/EF-Series storage appliances are designed for performance-sensitive workloads like real-time analytics, high-performance computing, and databases.
NetApp StorageGRID is a software-defined object storage solution for large archives, media repositories, and web data stores. Using the industry-standard object APIs like the Amazon Simple Storage Service (S3), StorageGRID is provided as a NetApp-branded storage solution and as a software-defined solution on third-party hardware.
Public Cloud
Public Cloud offers a portfolio of products delivered primarily as-a-service, including related support. This portfolio includes cloud storage, data services and operational services. As the only provider of enterprise-grade storage services natively embedded in the world’s largest public cloud providers, NetApp helps organizations harness the power of their data and applications. NetApp’s services leverage AI to maximize productivity across infrastructure and applications, boost team productivity, and reduce operations costs. These solutions and services are generally available on the leading public clouds, including Amazon AWS, Microsoft Azure, and Google Cloud.
Cloud storage
Fully managed cloud storage offerings are available natively on Microsoft Azure as Azure NetApp Files, on Amazon AWS as Amazon FSx for NetApp ONTAP, and on Google Cloud as Google Cloud NetApp Volumes.
In addition, NetApp offers NetApp Cloud Volumes ONTAP on Amazon AWS, Google Cloud, and Microsoft Azure, a cloud-based software for customers who wish to manage their own cloud storage infrastructure.
Our cloud storage services are based on the same ONTAP data management software that underpins our on-premises ONTAP storage infrastructure offerings.
Manageability
At the center of our hybrid multi-cloud storage and data service offerings is NetApp BlueXP. BlueXP is a unified control plane that enables customers to manage their entire data landscape through one single, web-based Software-as-a-Service (SaaS)-delivered control point. NetApp BlueXP combines storage and data services via its unified control plane to change how hybrid, multicloud environments are managed, optimized, and controlled. An intuitive interface and powerful automation help decrease resource waste, complexity, and the risk of managing diverse environments. It brings customers operational simplicity in a complex world. Within BlueXP are standard and optional capabilities (services) that allow customers to control their data and operations.
With BlueXP Copy and Sync, customers can migrate data to the cloud securely and efficiently. Customers can choose where to deploy primary workloads without re-architecting applications or databases. BlueXP Backup and Recovery delivers seamless and cost-effective backup and restore capabilities for protecting and archiving cloud and on-premises data managed by ONTAP. BlueXP Classification service provides data discovery, mapping, and classification driven by AI algorithms with automated controls and reporting for data privacy regulations such as the General Data Protection Regulation (GDPR), California Consumer Privacy Act (CCPA), and more. Lastly, BlueXP Ransomware Protection provides AI-driven protection of workloads, with integrated real-time detection and ability to respond quickly to threats and recover in minutes.
Operational services
NetApp Data Infrastructure Insights (formally called “Cloud Insights”) is an infrastructure monitoring tool that gives organizations visibility into their entire infrastructure. It can monitor, troubleshoot, and optimize costs across all resources, including public clouds and private data centers. Working in conjunction with the BlueXP manageability and control plane services, customers can have deep insights into their data operations.
Instaclustr provides fully managed open-source databases, pipelines, and workflow applications delivered as a service. Instaclustr helps organizations deliver cloud-native applications at scale by operating and supporting the data infrastructure through its SaaS platform for those designing and building around open-source technologies while not wanting to maintain that infrastructure themselves.
Professional and Support Services
NetApp and our certified services partners offer a comprehensive portfolio of assessment, design, implementation, migration, and proactive support services to help customers optimize the performance and efficiency of their on-premises and hybrid multicloud
storage environments. Our offerings include storage-as-a-service (STaaS), strategic consulting, professional, managed, and support services.
NetApp Keystone is our pay-as-you-grow, STaaS offering that delivers a seamless hybrid cloud experience for those preferring operating expense consumption models to upfront capital expense or leasing. With a unified management console and monthly bill for both on-premises and cloud data storage services, Keystone lets organizations provision, monitor, and even move storage spending across their hybrid cloud environment for financial and operational flexibility.
NetApp strategic consulting services provide executive-level, high-touch consulting engagements to help organizations facilitate the alignment of their business and technology goals. Our proven expertise can help organizations define long-term data fabric strategies and operations models to drive IT initiatives for digital transformation.
NetApp’s Professional Services offer specialized expertise to minimize risks and simplify designing, implementing, migrating, and integrating NetApp hybrid cloud solutions. This enables businesses to reap the benefits of new technology investments more quickly. Our highly skilled service experts help ensure secure and optimized environments, delivering consistent, high-quality outcomes that meet customers' expectations.
NetApp Managed Services can optimize the performance and efficiency of your IT infrastructure, whether you have a hybrid cloud or on-premises environment. Our experienced NetApp experts follow a proven methodology and industry best practices to monitor, administer, operate, and optimize your IT environment. This allows your organization's IT staff to focus on driving business initiatives forward, without worrying about the day-to-day management of your IT infrastructure.
NetApp Global Support offers a wide range of solutions, including systems, processes, and personnel, to support uninterrupted operation in complex and critical environments. Our focus is on providing proactive and preemptive technology support to help ensure operational continuity across the NetApp hybrid cloud. We offer personalized support options that provide actionable intelligence to resolve problems faster, minimize downtime, and optimize the performance of the entire NetApp ecosystem.
Sales, Principal Markets, and Distribution Channels
We market and sell our products and services in numerous countries throughout the world. Our sales efforts are organized around the evolving needs of our current and targeted customers, and our marketing initiatives reflect this focus. NetApp uses a multichannel distribution strategy. We sell our products, solutions and services to end-user business customers and service providers through a direct sales force and an ecosystem of partners, including the leading cloud providers. Our marketing is focused on building our brand reputation, creating market awareness, communicating customer advantages and generating demand for our sales force and channel partners.
Our diversified customer base spans industry segments and vertical markets such as energy, financial services, government, technology, internet, life sciences, healthcare services, manufacturing, media, entertainment, animation, video postproduction and telecommunications. NetApp focuses primarily on the enterprise storage and data management, cloud storage and cloud operations markets. We design our products to meet the evolving requirements of a hybrid, multicloud world, driven by digital transformation and cloud initiatives.
Our partnerships with the industry’s leading cloud, infrastructure, consulting, application, and reseller partners are created with one goal in mind: the success of our customers. Global enterprises, local businesses, and government agencies look to NetApp and our ecosystem of partners to help maximize the business value of their IT and cloud investments.
We work with a wide range of partners for our customers, including technology partners, value-added resellers, system integrators, OEMs, service providers and distributors. During fiscal 2025, sales through our indirect channels represented 78% of our net revenues. Our global partner ecosystem is critical to NetApp’s growth and success. We are continually strengthening existing partnerships and investing in new ones to ensure we are meeting the evolving needs of our customers.
As of April 25, 2025, our worldwide sales and marketing functions consisted of approximately 5,100 managers, sales representatives and technical support personnel. We have offices in approximately 26 countries. Sales to customers Arrow Electronics, Inc. and TD Synnex Corporation accounted for 21% and 24% of our net revenues, respectively, in fiscal 2025. Information about sales to and accounts receivables from our major customers, segment disclosures, foreign operations and net sales attributable to our geographic regions is included in Note 15 – Segment, Geographic, and Significant Customer Information of the Notes to Consolidated Financial Statements included in Part II, Item 8.
Seasonality
We have historically experienced a sequential decline in revenues in the first quarter of our fiscal year, as the sales organization spends time developing new business after higher close rates in the fourth quarter, and because sales to European customers are typically weaker during the summer months. We derive a substantial amount of our revenue in any given quarter from customer orders booked in the same quarter. Customer orders and revenues typically follow intra-quarter seasonality patterns weighted toward the end of the quarter. If recurring services and cloud revenue continue to increase as a percentage of our total revenues, historical seasonal patterns may become less pronounced.
Backlog
We manufacture products based on a combination of specific order requirements and forecasts of our customers’ demand. Orders are generally placed by customers on an as-needed basis. A substantial portion of our products is sold on the basis of standard purchase orders that are cancelable prior to shipment without penalty. In certain circumstances, purchase orders are subject to change with respect to quantity of product or timing of delivery resulting from changes in customer requirements. Our business is characterized by seasonal and intra-quarter variability in demand, as well as short lead times and product delivery schedules. Accordingly, backlog at any given time may not be a meaningful indicator of future revenue.
Manufacturing and Supply Chain
We have outsourced manufacturing operations to third parties located in Fremont, California; San Jose, California; Guadalajara, Mexico; Schiphol Airport, The Netherlands; Helmond, The Netherlands; Tiszaujvaros, Hungary; Taoyuan City, Taiwan; and Singapore. These operations include materials procurement, commodity management, component engineering, test engineering, manufacturing engineering, product assembly, product assurance, quality control, final test, and global logistics. We rely on a limited number of suppliers for materials, as well as several key subcontractors for the production of certain subassemblies and finished systems. We strive to have multiple suppliers qualified to provide critical components where possible and have our products manufactured in a number of locations to mitigate our supply chain risk. Our strategy has been to develop close relationships with our suppliers, maximizing the exchange of critical information and facilitating the implementation of joint quality programs. We use contract manufacturers for the production of major subassemblies and final system configuration. This manufacturing strategy minimizes capital investments and overhead expenditures while creating flexibility for rapid expansion.
We are certified to the International Organization for Standardization (ISO) 9001:2015 and ISO 14001:2015 certification standards. We have been Tier 2 certified under the U.S. Customs and Border Protection’s (CBP) Customs Trade Partnership Against Terrorism (CTPAT) program since January 2015.
Research and Development
Our research and development team delivers innovation to help customers create an evolved cloud experience. Our R&D structure allows us to align and accelerate the execution of our strategies and roadmaps across product groups. We leverage our talent and shared IP for cloud- and hybrid-cloud solutions to remain agile to changing market conditions. Our R&D priorities are defined by how we can help customers realize operational simplicity, cyber resilience and security, AI innovation, infrastructure savings and agility, and sustainability. We design our products and services from the ground up with cloud connectivity in mind, including our capabilities for cyber resiliency, tiering, disaster recovery, replication, bursting, and migration.
We conduct research and development activities in various locations throughout the world. Total research and development expenses were $1,012 million in fiscal 2025, $1,029 million in fiscal 2024 and $956 million in fiscal 2023. These costs consist primarily of personnel and related expenses incurred to conduct product development activities. Although we develop many of our products internally, we also acquire technology through business combinations or through third party licensing when appropriate. We believe that technical leadership is essential to our success, and we expect to continue to commit substantial resources to research and development.
Competition
We operate in an industry with rapid technological advances in hardware, software, and related service offerings. Cloud, digital transformation, and AI initiatives are driving customer and solution requirements changes.
We compete with many companies in the storage and data management markets. Our hybrid cloud solutions primarily compete with legacy IT and storage vendors. Some offer a broad spectrum of products, solutions and services and others offer a more limited set of storage and data-management products, solutions or services. In the emerging AI market, we encounter both our traditional competitive set, as well as newer entrants, focused primarily on the AI model training space. Additionally, public cloud providers offer customers storage as an operating expense which competes with more traditional storage offerings that customers acquire
through capital expenditures. We both partner with and compete against cloud providers with our public cloud software and services. Legacy vendors are not often encountered as competitors in the cloud storage services market.
We compete with many companies in the cloud operations marketplace, including new companies (startups) and larger software companies who target developers, and operations engineering (DevOps). Some companies have single point solutions that compete with one of our services and others are building platforms. Additionally, public cloud providers offer similar services on their own cloud.
We face ongoing product and price competition in all areas of our business, including from both branded- and generic-product competitors.
Our current and potential competitors may establish cooperative relationships among themselves or with third-parties, including some of our partners. New competitors or alliances among competitors might emerge and further increase competitive pressures.
We consider our hardware, software innovation, cloud integration, and technology partnerships key to our competitive differentiation. We believe our competitive advantage also includes the nature of the relationships we form with our customers and partners worldwide. We strive to deliver an outstanding experience in every interaction we have with our customers and partners through our product, service, and support offerings, which enables us to provide our customers with a full range of expertise before, during and after their purchases.
Proprietary Rights
We generally rely on patent, copyright, trademark, trade secret and contract laws to establish and maintain our proprietary rights in our technology, products and services. While our intellectual property rights are important to our success, we believe that our business is not materially dependent on any particular patent, trademark, copyright, license or other individual intellectual property right. We have been granted, or own by assignment, well over two thousand U.S. patents, hundreds of pending U.S. patent applications, and many corresponding patents and patent applications in other countries. From time to time, we may make certain intellectual property available under an open source license. Our primary trademarks are NetApp and the NetApp design logo, which are registered trademarks in the U.S. and in many other countries. In addition, we have trademarks and trademark registrations in the U.S. and other countries covering our various product or service names.
We generally enter into confidentiality agreements with our employees, resellers, distributors, customers, and suppliers. In addition, through various licensing arrangements, we receive certain rights to the intellectual property of others. We expect to maintain current licensing arrangements and to secure additional licensing arrangements in the future, as needed and to the extent available on reasonable terms and conditions, to support continued development and sales of our products and services. Some of these licensing arrangements require or may require royalty payments and other licensing fees. The amount of these payments and fees may depend on various factors, including but not limited to the structure of royalty payments; offsetting considerations, if any; and the degree of use of the licensed technology.
The industry in which we compete is characterized by rapidly changing technology, a large number of patents, and frequent claims and related litigation regarding intellectual property rights, and we may be exposed to various risks related to such claims or legal proceedings. If we are unable to protect our intellectual property, we may be subject to increased competition that could materially and adversely affect our business operations, financial condition, results of operations and/or cash flows.
Environmental Disclosure
We believe that our commitment to helping our customers and partners succeed and to positively affecting the communities where our employees work and live supports our efforts to deliver value to our stockholders. We are committed to the reduction of greenhouse gas emissions; the efficient use of resources; and reducing, relative to the growth of the Company, the environmental impacts from our operations, products, and services, as well as complying with laws and regulations related to these areas.
We voluntarily measure, monitor, and publicly report our scope 1, scope 2, and scope 3 (partial) greenhouse gas emissions and water impacts. We seek to optimize the energy efficiency of our buildings, labs, and data centers; and we have increased our use of renewable energy, especially at our facilities in Bangalore, India (95% of the total energy consumed is renewable); Cork, Ireland (100% of electricity consumed is from renewable energy) and Wichita, Kansas (100% of the electricity consumed is produced by renewable wind energy).
At the global, regional and state levels, various laws and regulations have been implemented or are under consideration to mitigate or report on the effects of climate change. Environmental laws are complex and have tended to become more stringent over time. However, it is difficult to anticipate future regulations pertaining to environmental matters and to estimate their impacts on our operations. Additionally, we have implemented disaster recovery and business resiliency measures to mitigate the physical risks our
facilities, business, and supply chain might face as a consequence of natural disasters, earthquakes, floods, droughts, and other such occurrences or severe weather/climate-related phenomena.
We are subject to international, federal, state, and local regulations regarding workplace safety and protection of the environment. Various international, federal, state, and local provisions regulate the use and discharge of certain hazardous materials used in the manufacture of our products. Failure to comply with environmental regulations in the future could cause us to incur substantial costs, subject us to business interruptions or cause customers to cease purchasing from us. We strive to comply with all applicable environmental laws. All of our products meet the applicable requirements of the following European Union (EU) directives: Registration, Evaluation, Authorisation and Restriction of Chemicals (REACH); Energy Related Products (ErP); and Restriction of Hazardous Substances (RoHS). We also comply with the China RoHS directive. We have a global product take-back program and an e-waste scheme to comply with the EU directive on Waste Electrical and Electronic Equipment (WEEE), and Extended Producer Responsibility (EPR) regulations in India, Singapore and California.
We have maintained an environmental management system since December 2004 that provides the framework for setting, monitoring, and continuously improving our environmental goals and objectives. As part of ISO 14001 requirements, we set local environmental performance goals, such as reducing energy use per square foot and minimizing waste generated on site, that are aligned with our overall corporate strategy. We also conduct periodic reviews and are subject to third-party audits of our operations, and we monitor environmental legislation and requirements to help make sure we are taking necessary measures to remain in compliance with applicable laws, not only in our operations but also for our products.
Human Capital
We take pride in, and believe our success depends on, attracting and retaining leading talent in the industry based on a culture-fit approach. From our inception, NetApp has worked to build a model company and has embraced a culture of openness and trust. Our employees are supported and encouraged to be innovative, and we communicate openly and transparently so that employees can focus on critical and impactful work that ties directly to our business strategy. We continue to invest in our global workforce to support inclusion and belonging and our employees’ well-being and development.
Belonging
We believe inclusion and belonging lead to more innovation, better access to talent and improved business outcomes. Our strategies are intended to promote a team-based culture, inclusiveness, and to achieve sustained business results.
Benefits, Wellbeing and Engagement
Our healthcare options offer competitive, comprehensive coverage for our employees and their families, including:
National medical plans;
Regional medical plans;
Expert advice from world-renowned doctors through our medical second opinion program;
National dental plans;
National vision plans; and
A robust wellness program.
Insurance and income protection. We provide life, accidental death and dismemberment and disability insurance programs. For additional peace of mind, we also offer supplemental insurance for our employees and their dependents.
Financial and savings programs. We offer flexible spending accounts, an employee stock purchase plan and competitive retirement plans, including options to maximize retirement savings.
Flexible Work. We offer a flexible hybrid work program that allows employees, in consultation with their managers and teams, flexibility around where, when and how work is performed to deliver business outcomes, understanding that certain roles may be tied to specific locations or require an in-office presence due to business needs and job responsibilities, and to collaborate and connect most effectively. We are leaning into digital-first workflows, tools, and resources and programs to continuously promote flexibility, while enabling us to be productive, wherever we are. We also believe in the value of people being together, building relationships, fostering trust, collaboration and innovation. We have evolved into a hybrid model, in which employees who are assigned to an office can divide their work between the office and other locations about half the time. We continue to pilot, test and iterate our approach to support new ways of working and evolving the employee experience.
Employee Wellbeing. We provide a wide range of wellbeing programs and tools to ensure employees and their families have the resources they need when they need them. We offer emotional wellbeing resources and programs such as back-up child and elder care, student debt repayment, educational assistance, and legal services for employees and their dependents. NetApp also offers a variety of time-off programs to help support our employees who need time-off. Employees also have access to discounts and fitness centers.
Engagement. We help employees grow, develop and succeed at NetApp by encouraging an open and interactive culture, where individual needs are recognized and met, and Company goals are supported. For employees, growth goals are tied to corporate objectives and key results to ensure that employees are progressing and are supported by management teams. Managers are encouraged to set aside time at least each quarter to conduct a two-way conversation with each team member to offer feedback, guidance and support on goals, priorities and career development. The Company also conducts surveys that gauge employee sentiment in areas like cross-functional collaboration, manager performance and inclusivity and create action plans to address concerns and amplify opportunities.
Giving Back. The NetApp Cares programs support our employees' efforts to make a positive difference in our communities. In fiscal 2025, NetApp employees donated over 20,900 hours to serve their communities and make an impact around the world. The NetApp Cares programs encourage employees to volunteer through individual, team or company efforts.
Board Oversight of Human Capital Management
Our Board of Directors plays an active role in overseeing the Company's human capital management strategy and programs. Our Talent and Compensation Committee provides oversight of our talent strategy and key programs related to corporate culture, workforce inclusion, talent acquisition, engagement, development and retention.
Employees
As of April 25, 2025, we had approximately 11,700 employees worldwide. None of our employees are represented by a labor union and we consider relations with our employees to be good.
Please visit our website for more detailed information regarding our human capital programs and initiatives. Nothing on our website shall be deemed incorporated by reference into this Annual Report on Form 10-K.
Information About Our Executive Officers
Our executive officers and their ages as of June 9, 2025, were as follows:
| Name | Age | Position |
| George Kurian | 58 | Chief Executive Officer |
| César Cernuda | 53 | President |
| Wissam Jabre | 55 | Executive Vice President and Chief Financial Officer |
| Harvinder S. Bhela | 53 | Executive Vice President and Chief Product Officer |
| Elizabeth M. O'Callahan | 56 | Executive Vice President, Chief Administrative Officer, and Secretary |
George Kurian is the chief executive officer of NetApp, a position he has held since June 1, 2015. He joined our Board of Directors in June 2015. From September 2013 to May 2015, he was executive vice president of product operations, overseeing all aspects of technology strategy, product and solutions development across our portfolio. Mr. Kurian joined NetApp in April 2011 as the senior vice president of the storage solutions group and was appointed to senior vice president of the Data ONTAP group in December 2011. Prior to joining NetApp, Mr. Kurian held several positions with Cisco Systems from 2002 to 2011, including vice president and general manager of the application networking and switching technology group. Additional roles include vice president of product management and strategy at Akamai Technologies from 1999 to 2002, as well as a management consultant at McKinsey and Company and a leader on the software engineering and product management teams at Oracle Corporation. Mr. Kurian is a board member at Cigna Corporation, a global health services company, where he serves on the compliance committee and people resources committee, and holds a BS degree in electrical engineering from Princeton University and an MBA degree from Stanford University.
César Cernuda came to NetApp in July 2020 as president and is responsible for leading the Company’s global go-to-market organization spanning sales, marketing, services, support, and customer success. Mr. Cernuda joined NetApp after a long career at Microsoft that included various leadership roles. Mr. Cernuda is non-executive director and chairman of the ESG committee at Gestamp, an international group dedicated to automotive components. He is also on the advisory boards of Georgetown University’s McDonough School of Business and the IESE Business School – University of Navarra. Mr. Cernuda is a graduate of the Harvard Business School Executive Leadership Program and the Program for Management Development at IESE Business School – University
of Navarra, and he also completed the Leading Sustainable Corporations Programme at Oxford University’s Saïd Business School. He earned his bachelor’s degree in Business Administration from ESIC Business & Marketing School.
Wissam Jabre joined NetApp in March 2025 as executive vice president and chief financial officer, overseeing the worldwide finance and investor relations organizations. Mr. Jabre is an accomplished finance executive with over 20 years of experience leading finance organizations and driving value creation through disciplined operational management. Prior to joining NetApp, Mr. Jabre served as the executive vice president and CFO at Western Digital Corporation from February 2022 to February 2025, where he led the global finance organization and oversaw various critical functions. Prior to joining Western Digital, he served as the CFO of Dialog Semiconductor from March 2016 to August 2021. He has also held senior finance positions at prominent technology companies, including Advanced Micro Devices, Freescale Semiconductor (since acquired by NXP Semiconductors), and Motorola. Mr. Jabre's career began at Schlumberger, where he gained valuable experience in both engineering and finance roles. Mr. Jabre holds a B.E. in Electrical Engineering from the American University of Beirut and an MBA from Columbia Business School. He also serves on the board of directors of MKS, Inc. where he serves as a member of the audit committee.
Harvinder S. Bhela joined NetApp in January 2022 as executive vice president and chief product officer. He is responsible for leading NetApp’s product and engineering teams and building our multi-cloud, storage and data services products and solutions. Before joining NetApp, Mr. Bhela spent 25 years at Microsoft where he held multiple executive leadership positions. Most recently he served as corporate vice president of the Microsoft 365 Security, Compliance and Management business. Mr. Bhela holds a Bachelor of Engineering from the University of Mumbai and a Master of Science in Computer Science from the University of Minnesota.
Elizabeth M. O’Callahan joined NetApp in 2013 and has served as NetApp’s executive vice president, chief administrative officer, and secretary since March 2025. Prior to her appointment as chief administrative officer, Ms. O’Callahan served as executive vice president, chief legal officer, and secretary from January 2022 to February 2025, senior vice president and general counsel from May 2021 to December 2021, as vice president and deputy general counsel from May 2020 to April 2021, and as vice president, corporate legal from October 2013 to April 2020. Ms. O’Callahan has over 20 years of experience advising technology companies on a variety of matters, including corporate governance, executive compensation, securities law, employment law, mergers and acquisitions, capital markets transactions, corporate compliance and ethics, data privacy, intellectual property, crisis management, real estate, litigation and government relations. Before joining NetApp, Ms. O’Callahan served in a senior legal role at Xilinx (since acquired by AMD). She began her legal career in private practice in Silicon Valley specializing in corporate law and business litigation. Ms. O’Callahan holds a bachelor’s degree from the University of California at Los Angeles and a J.D. from Santa Clara University.
Additional Information
Our internet address is www.netapp.com. We make available through our internet website our annual reports on Form 10-K, quarterly reports on Form 10-Q, current reports on Form 8-K, including exhibits, amendments to those reports and other documents filed or furnished pursuant to the Exchange Act of 1934, as soon as reasonably practicable after we electronically file such materials with, or furnish them to, the SEC.
The SEC maintains an internet site (www.sec.gov) that contains reports, proxy and information statements, and other information regarding issuers that file electronically with the SEC.
Item 1A. Risk Factors
The following discussion and the sections entitled “Management’s Discussion and Analysis of Financial Condition and Results of Operations,” “Quantitative and Qualitative Disclosures About Market Risk” and “Management's Report on Internal Control Over Financial Reporting” reflect our current judgment regarding the most significant risks we face. These risks can and will change in the future.
Risks Related to Our Business and Industry
Global economic and geopolitical conditions have adversely affected and may in the future continue to adversely affect our industry, business operations, and financial performance, including our revenue growth, profitability, financial condition and cash flows.
As a global company, our business is influenced by worldwide economic and market conditions, including, among others, inflation, slower growth, economic downturn or recession, changes in fiscal and monetary policies, higher interest and tax rates, economic uncertainty, political instability, regional conflicts, military warfare, extreme weather events and effects from climate change, natural disasters and pandemics, supply chain interruptions and shortages, changes in laws, reduced consumer confidence and spending, international trade protection measures and disputes (including economic and trade barriers, tariffs, sanctions and export controls), and the threat and potential of retaliatory trade control policies (including retaliatory tariffs). These factors, as well as the fear or anticipation of such conditions, may influence decisions and actions by our key stakeholders and the market generally, and can lead to increased volatility in the IT industry, making it difficult to predict future demand for our products and services. They can also negatively impact the availability of supplies and limit access to capital for our suppliers, customers and partners.
Any of these factors above, as well as other adverse macroeconomic conditions can significantly reduce demand for our products and negatively affect our operating results due to customer concerns about declining demand for their products, reduced asset values, fluctuating energy costs, geopolitical issues, the cost and availability of credit, and the stability of financial institutions, markets, businesses, and governments. These conditions may be widespread, and their resolution could be uncertain. If we are not able to efficiently and effectively resolve such issues in a timely manner, or if our chosen strategies are not successful, then our business, operations and financial condition could be materially adversely impacted. Consequently, these risks and conditions could materially adversely affect our future sales and operating results.
Our business may be negatively impacted by technological trends in our market or our inability to keep pace with rapid industry, technological, and market changes.
The growth in our industry and the markets we compete in is driven by the increasing demand for data, which in turn drives the need for storage and data management solutions. However, our markets could face challenges due to technology transitions, increased storage efficiency, competitive pricing dynamics, changing consumption models, and uncertain macroeconomic conditions. Additionally, the impact of generative artificial intelligence (GenAI) on the storage and data management markets and regulation thereof is still unfolding and could evolve unpredictably.
As customers undergo their information technology (IT) transformations, leveraging modern architectures and hybrid cloud environments, they seek simpler solutions and new consumption models. This shift is directing spending towards transformational projects and architectures like flash storage, hybrid cloud, cloud storage, and IT as a service. The future impact of these trends on both short- and long-term demand for our products is uncertain, and we may struggle to meet customer demand with the expected level of quality and support for new products or services.
Our business may suffer if we fail to keep pace with rapid industry, technological, or market changes, or if our products and services are not well-received in the marketplace. These factors, along with other considerations discussed in this Annual Report on Form 10-K, could lead to a decline in customer demand for our products and services, resulting in decreased revenue on a year-over-year basis, as seen in fiscal 2017, 2020, and 2024. If the overall growth rate of industry declines, if specific markets we compete in experience reduced growth, if storage consumption models change, if our new and existing products and services do not gain customer acceptance, or if we do not adapt our sales programs to market changes, our business, operating results, financial condition, and cash flows could be adversely affected.
The global nature of our business exposes us to risks that could materially harm our operations, revenues, and financial results.
A significant portion of our operations and revenues are derived from outside of the U.S., and most of our products are sourced and manufactured outside of the U.S. We also have research and development, sales, and service centers internationally. Consequently, our international operations and future financial results could be adversely affected by various economic, business, regulatory, social and political factors in foreign countries. These factors include government controls, local political or economic conditions such as recessions, economic downturns, inflation and political uncertainty, economic sanctions, trade protections and regulations, export and import requirements (including but not limited to government and regulatory authorizations), tariffs, investment restrictions, tax
policies, treaties or laws, local labor conditions, transportation costs, government spending patterns, geopolitical tensions and uncertainties, acts of terrorism, international conflicts, natural disasters, and adverse public health developments.
Changes in laws or policies governing the terms of foreign trade, and in particular increased trade restrictions, tariffs or taxes on imports from countries where we source and/or manufacture products, including the impact on our suppliers and contract manufacturers who may look to pass through additional costs imposed on them, could have a material adverse effect on our business and financial results. The U.S. government has recently enacted changes to U.S. trade policy and has signaled plans for possible additional changes. For example, the U.S. government has imposed sweeping tariffs on certain products and countries and has signaled that further tariffs may be imposed in the future. The U.S. government's tariffs policy remains fluid, with tariffs on certain countries delayed or reduced in scope, and additional tariffs likely to be forthcoming on other countries or specified products. Additional tariffs and restrictive policies, particularly with respect to the tariffs on Mexico, could have a significant impact on our business and results of operations. The exact magnitude of any potential impact remains uncertain given possible further changes in tariffs and increased tensions with U.S. trading partners targeted by tariffs or other restrictive trade policies. Our risk exposure may increase further if any countries levy retaliatory tariffs, taxes, or other trade restrictions or penalties against the United States or U.S. companies.
Additionally, ongoing trade tensions between the U.S. and China and recent investment restrictions, such as the U.S. Outbound Investment Security Program, could impact our business and operating results. Any increase in tensions between China and Taiwan, including threats of military actions or escalation of military activities, could adversely affect our or our contract manufacturers’ ability to source key supply chain components included in our products. As a result of Russi
Showing the first 8K of 89K characters. Open the full section
Item 1B. Unresolved Staff Comments
Not applicable.
Item 1C. Cybersecurity
Risk Management and Strategy
The Company regularly assesses risks from cybersecurity threats, monitors its information systems for potential vulnerabilities, and tests those systems pursuant to the Company’s cybersecurity policies, standards, processes and practices, which are integrated into the Company’s overall risk management system. To protect the Company’s information systems from cybersecurity threats, the Company uses various security technologies and tools that help the Company identify, escalate, investigate, manage, resolve and recover from security incidents in a timely manner. These efforts include:
ongoing collection of threat intelligence and environment awareness through monitoring,
data protection management and vulnerability monitoring through data loss prevention and exfiltration tools,
cybersecurity risk management processes and practices,
control assurance,
secure development of new products,
identity and access management,
incident response, auditing and monitoring, and
maintaining a 24x7 security operations center to allow for always available incident response.
The Company takes a risk-based approach to cybersecurity and has implemented cybersecurity policies throughout its operations that are designed to address cybersecurity threats and incidents. In particular, the Company follows an incident escalation process that is incorporated into its incident and risk management processes. In the event the Company identifies a cybersecurity incident, its senior management, consisting of the Chief Financial Officer, Chief Information Security Officer (CISO), Chief Administrative Officer, and Executive Vice President of Business Technology and Operations review the facts and circumstances involved in such cybersecurity incident, or series of related cybersecurity incidents.
The Company partners with third parties to assess the effectiveness of its cybersecurity prevention and response systems and processes, including third-party review of the Company’s Information Security Management System for ISO 27001 controls, assessment of the Company’s cloud products and managed services according to the American Institute of CPAs (AICPA) Service Organization Control (SOC) Audit Type II, and new product validation as part of the Company’s secure development lifecycle. The Company additionally engages third-party providers in support of endpoint detection and responses, data loss prevention efforts, and incident management efforts.
To date, the Company is not aware of cybersecurity threats, including as a result of any previous cybersecurity incidents, that have materially affected or are reasonably likely to materially affect the Company, including its business strategy, results of operations or financial condition. For additional discussion of cybersecurity risks and potential related impacts on the Company, refer to the risk factors in Part I, Item 1A. “Risk Factors,” including “If a material cybersecurity or other security breach impacts our services, systems, supply chain, or end-user customer systems, or if stored data is improperly accessed, our business could suffer significant harm.”
Governance
NetApp's Board of Directors oversees the Company’s risk management process, including cybersecurity risks, directly and through its committees. The Audit Committee of the Board of Directors oversees the Company’s risk management program, which focuses on the most significant risks the Company faces in the short-, intermediate-, and long-term timeframes. The Company’s CISO regularly updates each of the Board of Directors and the Audit Committee at least twice a year. Such updates include a review of cybersecurity risks affecting the Company, related metrics, and any incidents or issues that require attention from the Board of Directors.
The CISO provides leadership, strategic direction, and oversight for NetApp’s Global Security Risk and Compliance functions and security program. Global Security executives oversee management of risks and track projects progress, remediations, and any issues related to cybersecurity risks.
NetApp’s CISO is responsible for leading the assessment and management of cybersecurity risks. The current CISO has over 30 years of experience in IT and information security, including over 16 years with NetApp in roles of increasing seniority, and is a
Certified Information Security Auditor, Certified Information Security Manager with ISACA and a Certified Information Systems Security Professional with ISC2. The CISO stays informed on information security risks through regular meetings on key cybersecurity projects and KPIs. Updates are communicated to the Global Security Steering Committee, which provides quarterly reports to the Board of Directors and to the Audit Committee.
Item 2. Properties
We owned or leased, domestically and internationally, the following properties as of April 25, 2025.
We own approximately 0.8 million square feet of facilities in Research Triangle Park (RTP), North Carolina. In addition, we own 65 acres of undeveloped land. The RTP site supports research and development, global services and sales and marketing.
We own approximately 0.7 million square feet of facilities in Bangalore, India on 14 acres of land. The Bangalore site supports research and development, finance and global services.
We lease approximately 0.3 million square feet of office space for our corporate headquarters located in San Jose, California. The San Jose site supports research and development, corporate general administration, sales and marketing, global services and operations.
We lease approximately 0.7 million square feet in other sales offices and research and development facilities throughout the U.S. and internationally. We expect that our existing facilities and those being developed worldwide are suitable and adequate for our requirements over at least the next two years.
Item 3. Legal Proceedings
For a discussion of legal proceedings, see Note 17 – Commitments and Contingencies of the Notes to Consolidated Financial Statements included in Part II, Item 8 of this Annual Report on Form 10-K, which is incorporated herein by reference.
Item 4. Mine Safety Disclosures
Not applicable.
PA****RT II
Item 5. Market for Registrant’s Common Equity, Related Stockholder Matters and Issuer Purchases of Equity Securities
The Company’s common stock is traded on the NASDAQ Stock Market LLC (NASDAQ) under the symbol NTAP.
Price Range of Common Stock
The price range per share of common stock presented below represents the highest and lowest intraday sales prices for the Company’s common stock on the NASDAQ during each quarter of our two most recent fiscal years.
| Fiscal 2025 | Fiscal 2024 | |||||||||||||||
| High | Low | High | Low | |||||||||||||
| First Quarter | $ | 135.01 | $ | 100.24 | $ | 80.53 | $ | 61.54 | ||||||||
| Second Quarter | $ | 134.37 | $ | 112.87 | $ | 80.02 | $ | 71.25 | ||||||||
| Third Quarter | $ | 135.45 | $ | 112.86 | $ | 91.76 | $ | 70.82 | ||||||||
| Fourth Quarter | $ | 127.78 | $ | 71.84 | $ | 112.48 | $ | 83.80 |
Holders
As of May 29, 2025 there were 403 holders of record of our common stock.
Dividends
The Company paid cash dividends of $0.52 per outstanding common share in each quarter of fiscal 2025 for an aggregate of $424 million and $0.50 per outstanding common share in each quarter of fiscal 2024 and fiscal 2023 for an aggregate of $416 million and $432 million, respectively. In the first quarter of fiscal 2026, the Company declared a cash dividend of $0.52 per share of common stock, payable on July 23, 2025 to shareholders of record as of the close of business on July 3, 2025.
Performance Graph
The following graph shows a comparison of cumulative total shareholder return, calculated on a dividend reinvested basis, of an investment of $100 for the Company, the S&P 500 Index, the S&P 500 Information Technology Index and the S&P 1500 Technology Hardware & Equipment Index for the five years ended April 25, 2025. The comparisons in the graphs below are based upon historical data and are not indicative of, nor intended to forecast, future performance of our common stock. The graph and related information shall not be deemed “soliciting material” or be deemed to be “filed” with the SEC, nor shall such information be incorporated by reference into any past or future filing with the SEC, except to the extent that such filing specifically states that such graph and related information are incorporated by reference into such filing.
COMPARISON OF FIVE YEAR CUMULATIVE TOTAL RETURN
Among NetApp, Inc., the S&P 500 Index, the S&P 500 Information Technology Index and the S&P 1500 Technology Hardware & Equipment Index*
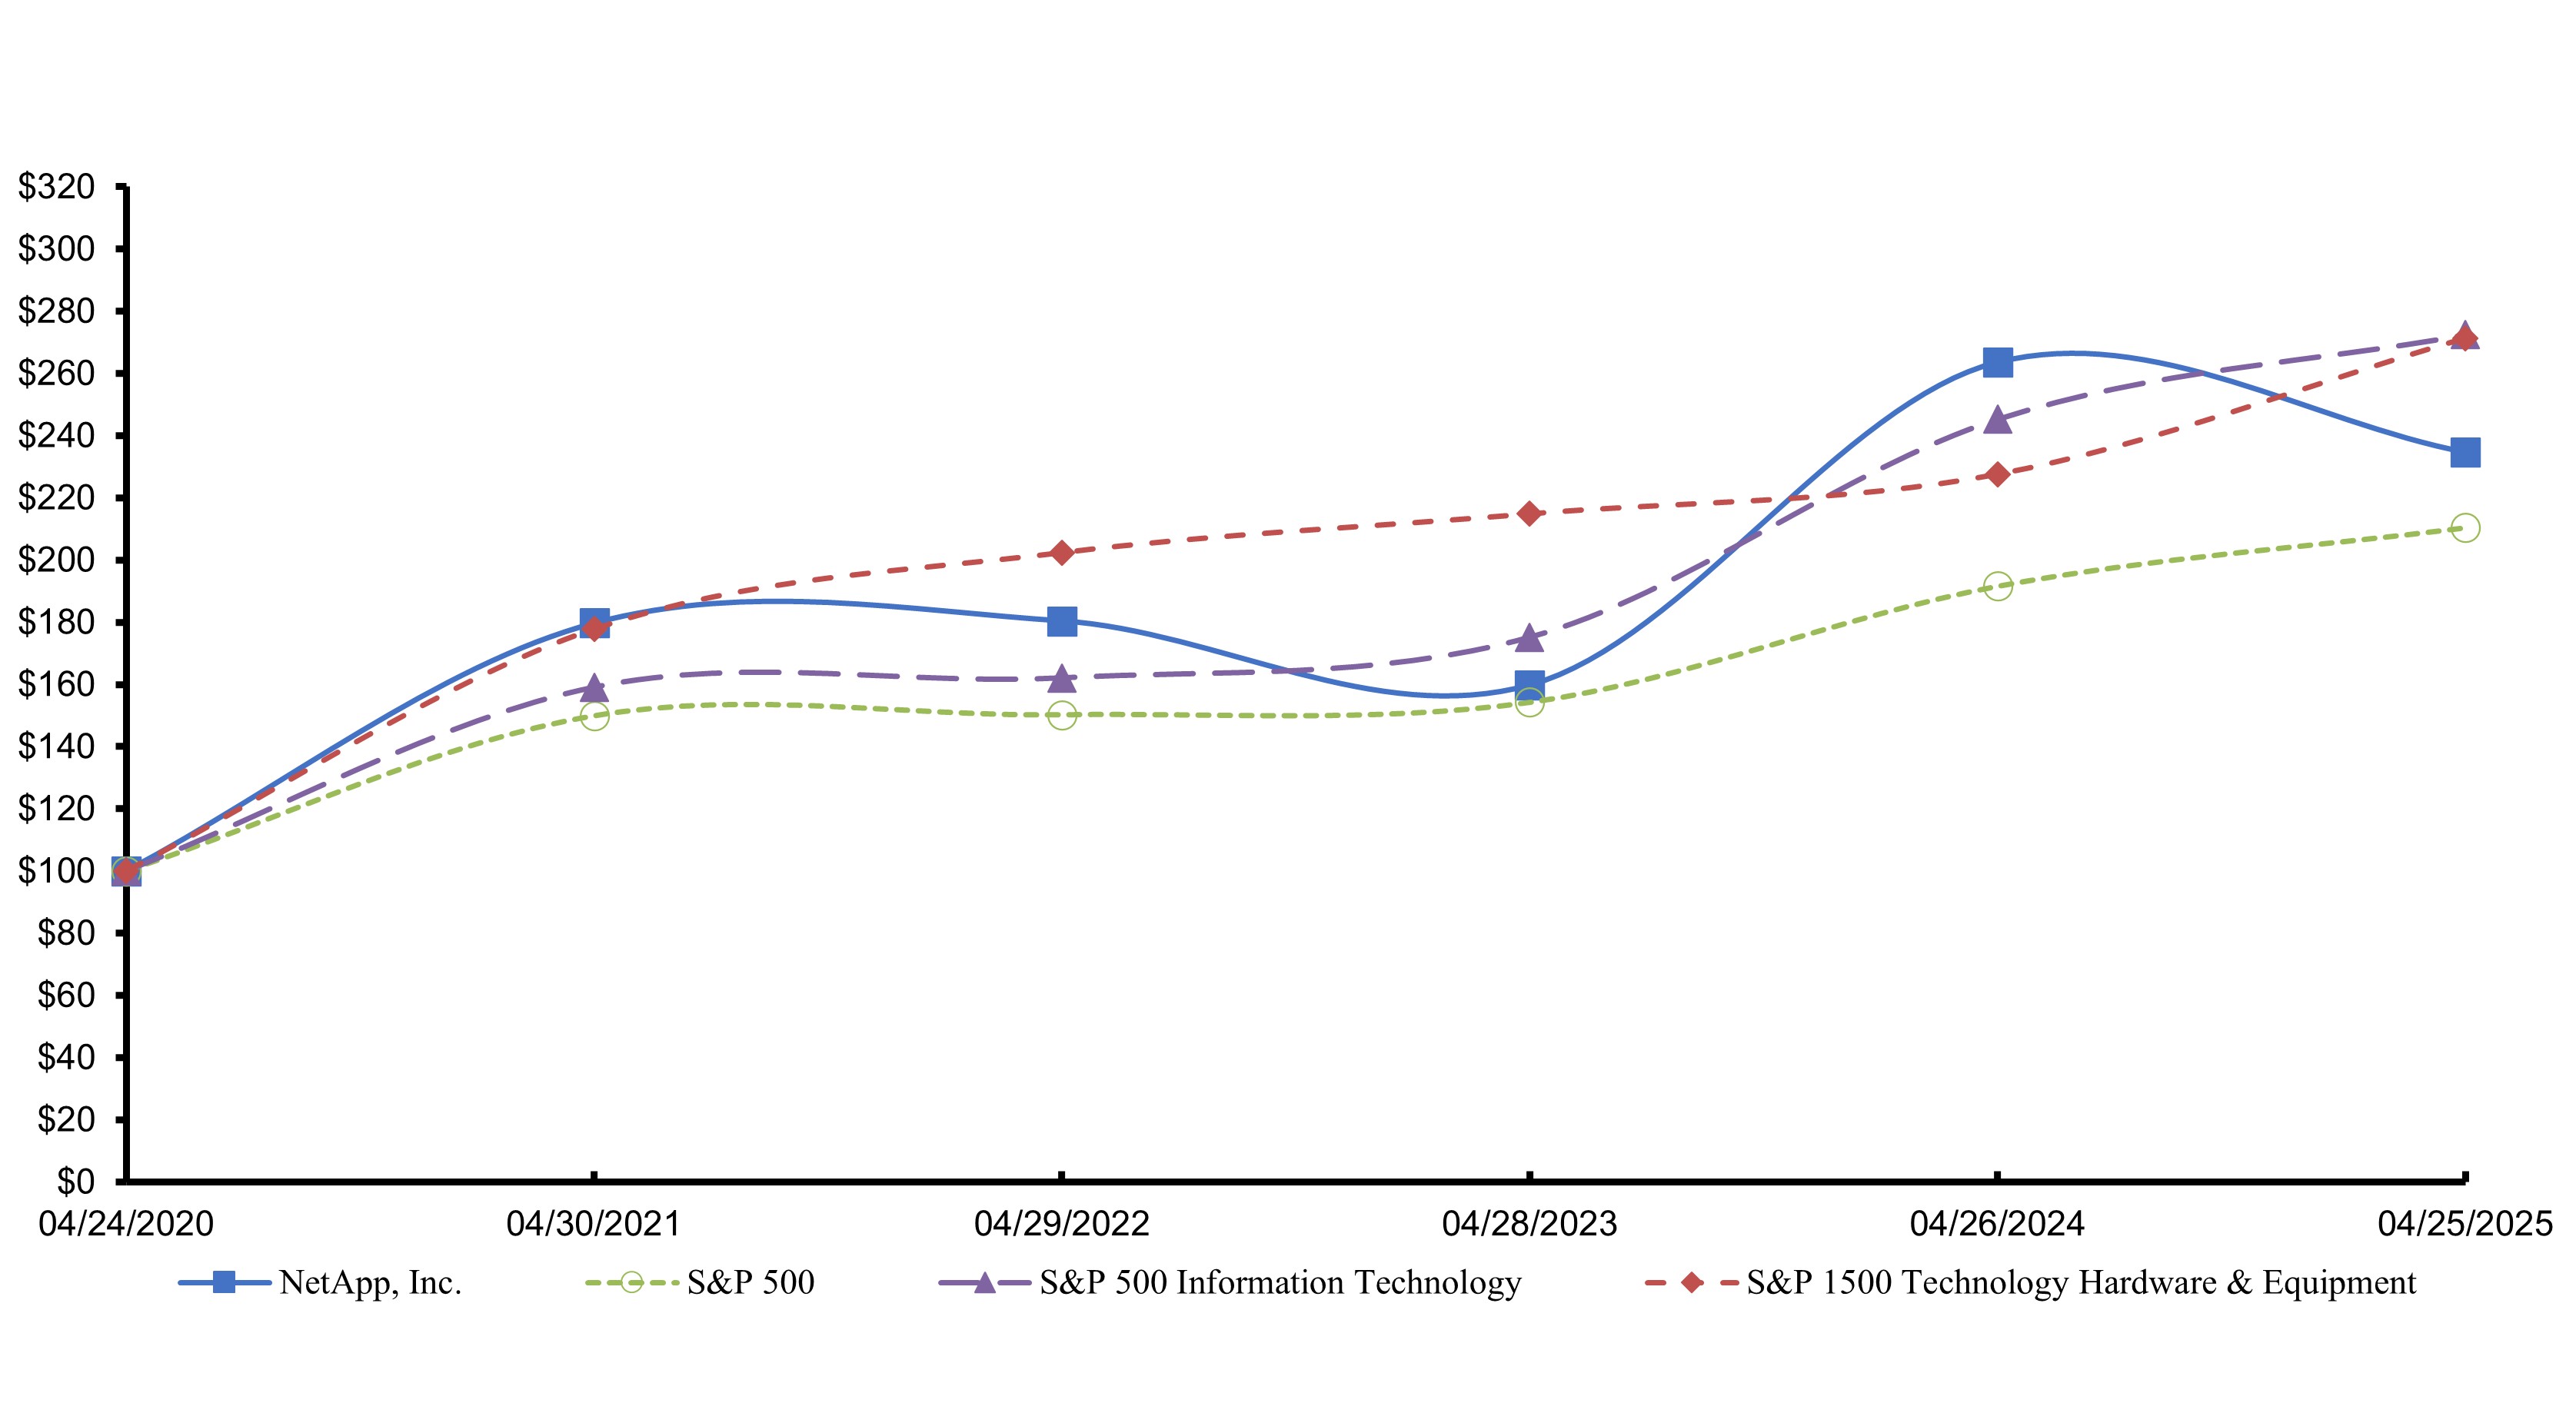
*$100 invested on April 24, 2020 in stock or index, including reinvestment of dividends. Data points are the last day of each fiscal year for the Company’s common stock and each of the indexes.
| April 2020 | April 2021 | April 2022 | April 2023 | April 2024 | April 2025 | |||||||||||||||||||
| NetApp, Inc. | $ | 100.00 | $ | 179.71 | $ | 180.39 | $ | 159.78 | $ | 263.63 | $ | 234.64 | ||||||||||||
| S&P 500 Index | $ | 100.00 | $ | 149.89 | $ | 150.21 | $ | 154.21 | $ | 191.56 | $ | 210.35 | ||||||||||||
| S&P 500 Information Technology Index | $ | 100.00 | $ | 159.07 | $ | 162.08 | $ | 175.17 | $ | 245.24 | $ | 272.40 | ||||||||||||
| S&P 1500 Technology Hardware & Equipment Index | $ | 100.00 | $ | 177.82 | $ | 202.33 | $ | 214.81 | $ | 227.56 | $ | 271.36 |
We believe that a number of factors may cause the market price of our common stock to fluctuate significantly. See Item 1A. – Risk Factors.
Purchases of Equity Securities by the Issuer and Affiliated Purchasers
The following table provides information with respect to the shares of common stock repurchased by us during the three months ended April 25, 2025:
| Total Number of Shares | Approximate Dollar Value | |||||||||||||||
| Total Number | Average | Purchased as Part of | of Shares That May Yet | |||||||||||||
| of Shares | Price Paid | Publicly Announced | Be Purchased Under The | |||||||||||||
| Period | Purchased | per Share | Program | Repurchase Program | ||||||||||||
| (Shares in thousands) | (Shares in thousands) | (Dollars in millions) | ||||||||||||||
| January 25, 2025 - February 21, 2025 | 248 | $ | 121.03 | 379,256 | $ | 572 | ||||||||||
| February 22, 2025 - March 21, 2025 | 246 | $ | 101.53 | 379,502 | $ | 547 | ||||||||||
| March 22, 2025 - April 25, 2025 | 2,314 | $ | 84.28 | 381,816 | $ | 352 | ||||||||||
| Total | 2,808 | $ | 89.03 |
In May 2003, our Board of Directors approved a stock repurchase program. As of April 25, 2025, our Board of Directors had authorized the repurchase of up to $17.1 billion of our common stock, and on May 22, 2025, authorized an additional $1.1 billion. Since inception of the program through April 25, 2025, we repurchased a total of 382 million shares of our common stock for an aggregate purchase price of $16.8 billion. Under this program, we may purchase shares of our outstanding common stock through solicited or unsolicited transactions in the open market, in privately negotiated transactions, through accelerated share repurchase programs, pursuant to a Rule 10b5-1 plan or in such other manner as deemed appropriate by our management. The stock repurchase program may be suspended or discontinued at any time.
Item 6. [Reserved]
Item 7. Management’s Discussion and Analysis of Financial Condition and Results of Operations
The following discussion of our financial condition and results of operations should be read together with the financial statements and the accompanying notes set forth under Part II, Item 8. – Financial Statements and Supplementary Data. The following discussion also contains trend information and other forward-looking statements that involve a number of risks and uncertainties. The Risk Factors set forth in Part I, Item 1A. – Risk Factors are hereby incorporated into the discussion by reference.
Executive Overview
Our Company
NetApp helps customers make their data infrastructure more seamless, more dynamic, and higher performing. We were incorporated in 1992, are headquartered in San Jose, California, and provide a full range of enterprise-class software, systems and services that customers use to transform their data infrastructures across data types, workloads, and environments to realize business possibilities.
We leverage over thirty years of innovation to make data infrastructure intelligent. Our unified data storage solutions deliver flexible, simplified, and silo-free infrastructure. Our active data management capabilities focus on security, compliance, and sustainability, while our adaptive operations enhance performance, efficiency, and productivity. Our extensive portfolio integrates hybrid and multi-cloud environments, addressing key customer priorities such as modernizing legacy systems, enhancing resilience against ransomware, and developing scalable, high-performance data pipelines for artificial intelligence (AI) workloads.
NetApp empowers customers to harness their data for accelerated innovation, improved operations, and competitive advantage. Our unified data storage solutions provide the flexibility to consistently and easily store any data type and support any workload. As the only enterprise-grade storage service natively embedded in the world’s largest clouds, we power data across Amazon AWS, Microsoft Azure, and Google Cloud. Our integrated data services enable active data management, security, protection, governance, and sustainability. Additionally, our operational services support adaptive operations across infrastructure, applications, and teams. Together with our Hybrid Cloud products, these services enable customers to construct a seamless, intelligent data infrastructure across hybrid multi-cloud environments.
Our operations are organized into two segments: Hybrid Cloud and Public Cloud.
Hybrid Cloud offers a unified data storage portfolio of storage management and infrastructure solutions that helps customers modernize their data centers. Our Hybrid Cloud portfolio accommodates both structured and unstructured data with unified storage optimized for flash, disk, and cloud storage, capable of handling data-intensive workloads and applications. Hybrid Cloud includes software, hardware, and related support, along with professional and other services.
Public Cloud offers a portfolio of products delivered primarily as-a-service, including related support. This portfolio includes cloud storage, data services, and operational services. These services are generally available on the leading public clouds, including Amazon AWS, Microsoft Azure, and Google Cloud.
Financial Results and Key Performance Metrics Overview
The following table provides an overview of key financial metrics for each of the last three fiscal years (in millions, except per share amounts and percentages):
| Year Ended | ||||||||||||
| April 25, 2025 | April 26, 2024 | April 28, 2023 | ||||||||||
| Net revenues | $ | 6,572 | $ | 6,268 | $ | 6,362 | ||||||
| Gross profit | $ | 4,613 | $ | 4,433 | $ | 4,209 | ||||||
| Gross margin | 70 | % | 71 | % | 66 | % | ||||||
| Income from operations | $ | 1,337 | $ | 1,214 | $ | 1,018 | ||||||
| Income from operations as a percentage of net revenues | 20 | % | 19 | % | 16 | % | ||||||
| Provision (benefit) for income taxes | $ | 197 | $ | 277 | $ | (208 | ) | |||||
| Net income | $ | 1,186 | $ | 986 | $ | 1,274 | ||||||
| Diluted net income per share | $ | 5.67 | $ | 4.63 | $ | 5.79 | ||||||
| Net cash provided by operating activities | $ | 1,506 | $ | 1,685 | $ | 1,107 |
| April 25, 2025 | April 26, 2024 | |||||||
| Deferred revenue and financed unearned services revenue | $ | 4,536 | $ | 4,234 |
Net revenues: Our net revenues increased approximately 5% in fiscal 2025 compared to fiscal 2024, due to increases in both product revenues and services revenues.
Gross margin: Our gross margin decreased less than one percentage point in fiscal 2025 compared to fiscal 2024, due to the decrease in gross margins on product revenues.
Income from operations as a percentage of net revenues: Our income from operations as a percentage of net revenues increased by one percentage point in fiscal 2025 compared to fiscal 2024, primarily due to higher net revenues.
Provision (benefit) for income taxes: Our provision for income taxes decreased in fiscal 2025 compared to fiscal 2024 primarily as a result of differences in discrete tax impacts in each year.
Net income and Diluted net income per share: The increase in both net income and diluted net income per share in fiscal 2025 compared to fiscal 2024 reflect the factors discussed above.
Stock Repurchase Program and Dividend Activity
During fiscal 2025, we repurchased 10.2 million shares of our common stock at an average price of $112.55 per share, for an aggregate purchase price of $1.2 billion. We also declared aggregate cash dividends of $2.08 per share in fiscal 2025, for which we paid a total of $424 million.
Restructuring Events
During fiscal 2025, we executed several restructuring plans and recognized expenses totaling $83 million consisting primarily of employee severance-related costs.
Senior Notes Issuance
In March 2025, we issued $625 million aggregate principal amount of 5.50% Senior Notes due 2032 and $625 million aggregate principal amount of 5.70% Senior Notes due 2035, for which we received total proceeds of $1.24 billion, net of discount and issuance costs.
Results of Operations
Our fiscal year is reported on a 52- or 53-week year that ends on the last Friday in April. An additional week is included in the first fiscal quarter approximately every six years to realign fiscal months with calendar months. Fiscal years 2025, 2024 and 2023, which ended on April 25, 2025, April 26, 2024 and April 28, 2023, respectively, are all 52-week years, with 13 weeks in each of their quarters. Unless otherwise stated, references to particular years, quarters, months and periods refer to our fiscal years ended in April and the associated quarters, months and periods of those fiscal years.
The following table sets forth certain Consolidated Statements of Income data as a percentage of net revenues for the periods indicated:
| Fiscal Year | ||||||||||||
| 2025 | 2024 | 2023 | ||||||||||
| Revenues: | ||||||||||||
| Product | 46 | % | 45 | % | 48 | % | ||||||
| Services | 54 | 55 | 52 | |||||||||
| Net revenues | 100 | 100 | 100 | |||||||||
| Cost of revenues: | ||||||||||||
| Cost of product | 20 | 18 | 24 | |||||||||
| Cost of services | 10 | 11 | 10 | |||||||||
| Gross profit | 70 |
Showing the first 8K of 68K characters. Open the full section
Item 7A. Quantitative and Qualitative Disclosures about Market Risk
We are exposed to market risk related to fluctuations in interest rates and foreign currency exchange rates. We use certain derivative financial instruments to manage foreign currency exchange risks. We do not use derivative financial instruments for speculative or trading purposes. All financial instruments are used in accordance with management-approved policies.
Interest Rate Risk
Fixed Income Investments — As of April 25, 2025, we had fixed income debt investments of $2.0 billion and certificates of deposit of $24 million. Our fixed income debt investment portfolio primarily consists of investments with original maturities greater than three months at the date of purchase, which are classified as available-for-sale investments. These fixed income debt investments, which consist primarily of U.S. Treasury and government debt securities, and our certificates of deposit are subject to interest rate and interest income risk and will decrease in value if market interest rates increase. Conversely, declines in interest rates, including the impact from lower credit spreads, could have a material adverse impact on interest income for our investment portfolio. A hypothetical 100 basis point increase in market interest rates from levels as of April 25, 2025 would have resulted in a decrease in the fair value of our fixed-income securities of $3 million. Volatility in market interest rates over time will cause variability in our interest income. We do not use derivative financial instruments in our investment portfolio.
Our investment policy is to limit credit exposure through diversification and investment in highly rated securities. We further mitigate concentrations of credit risk in our investments by limiting our investments in the debt securities of a single issuer and by diversifying risk across geographies and type of issuer. We actively review, along with our investment advisors, current investment ratings, company-specific events and general economic conditions in managing our investments and in determining whether there is a significant decline in fair value. We monitor and evaluate our investment portfolio on a quarterly basis for any impairments.
Debt — As of April 25, 2025 we have outstanding $3.3 billion aggregate principal amount of Senior Notes. We carry these instruments at face value less unamortized discount and issuance costs on our consolidated balance sheets. Since these instruments bear interest at fixed rates, we have no financial statement risk associated with changes in interest rates. However, the fair value of these instruments fluctuates when interest rates change. See Note 8 – Financing Arrangements of the Notes to Consolidated Financial Statements included in Part II, Item 8 for more information.
Credit Facility — We are exposed to the impact of changes in interest rates in connection with our $1.0 billion five-year revolving credit facility. Borrowings under the facility accrue interest at rates that vary based on certain market rates and our credit rating on our Senior Notes. Consequently, our interest expense would fluctuate with any changes in these market interest rates or in our credit rating if we were to borrow any amounts under the credit facility. As of April 25, 2025, no amounts were outstanding under the credit facility.
Foreign Currency Exchange Rate Risk
We hedge risks associated with certain foreign currency transactions to minimize the impact of changes in foreign currency exchange rates on earnings. We utilize foreign currency exchange forward contracts to hedge against the short-term impact of foreign currency fluctuations on certain foreign currency denominated monetary assets and liabilities. We also use foreign currency exchange forward contracts to hedge foreign currency exposures related to forecasted sales transactions denominated in certain foreign currencies. These derivatives are designated and qualify as cash flow hedges under accounting guidance for derivatives and hedging.
We do not enter into foreign currency exchange contracts for speculative or trading purposes. In entering into foreign currency exchange forward contracts, we have assumed the risk that might arise from the possible inability of counterparties to meet the terms of the contracts. We attempt to limit our exposure to credit risk by executing foreign currency exchange contracts with creditworthy multinational commercial banks. All contracts have a maturity of 12 months or less. See Note 11 – Derivatives and Hedging Activities of the Notes to Consolidated Financial Statements included in Part II, Item 8 for more information regarding our derivatives and hedging activities.
Item 8. Financial Statements and Supplementary Data
INDEX TO CONSOLIDATED FINANCIAL STATEMENTS AND SUPPLEMENTARY DATA
NETAPP, INC.
CONSOLIDATED B****ALANCE SHEETS
(In millions, except par value)
| April 25, 2025 | April 26, 2024 | |||||||
| ASSETS | ||||||||
| Current assets: | ||||||||
| Cash and cash equivalents | $ | 2,742 | $ | 1,903 | ||||
| Short-term investments | 1,104 | 1,349 | ||||||
| Accounts receivable | 1,246 | 1,007 | ||||||
| Inventories | 186 | 186 | ||||||
| Other current assets | 573 | 452 | ||||||
| Total current assets | 5,851 | 4,897 | ||||||
| Property and equipment, net | 563 | 604 | ||||||
| Goodwill | 2,723 | 2,759 | ||||||
| Purchased intangible assets, net | 43 | 124 | ||||||
| Other non-current assets | 1,643 | 1,503 | ||||||
| Total assets | $ | 10,823 | $ | 9,887 | ||||
| LIABILITIES AND STOCKHOLDERS' EQUITY | ||||||||
| Current liabilities: | ||||||||
| Accounts payable | $ | 511 | $ | 517 | ||||
| Accrued expenses | 1,122 | 1,013 | ||||||
| Current portion of long-term debt | 750 | 400 | ||||||
| Short-term deferred revenue and financed unearned services revenue | 2,279 | 2,176 | ||||||
| Total current liabilities | 4,662 | 4,106 | ||||||
| Long-term debt | 2,485 | 1,992 | ||||||
| Other long-term liabilities | 379 | 585 | ||||||
| Long-term deferred revenue and financed unearned services revenue | 2,257 | 2,058 | ||||||
| Total liabilities | 9,783 | 8,741 | ||||||
| Commitments and contingencies (Note 17) | ||||||||
| Stockholders' equity: | ||||||||
| Preferred stock, $0.001 par value, 5 shares authorized; no shares issued or outstanding as of April 25, 2025 or April 26, 2024 | — | — | ||||||
| Common stock and additional paid-in capital, $0.001 par value, 885 shares authorized; 201 and 206 shares issued and outstanding as of April 25, 2025 and April 26, 2024, respectively | 1,106 | 997 | ||||||
| Retained earnings | — | 208 | ||||||
| Accumulated other comprehensive loss | (66 | ) | (59 | ) | ||||
| Total stockholders' equity | 1,040 | 1,146 | ||||||
| Total liabilities and stockholders' equity | $ | 10,823 | $ | 9,887 |
See accompanying notes to consolidated financial statements.
NETAPP, INC.
CONSOLIDATED STATEM****ENTS OF INCOME
(In millions, except per share amounts)
| Year Ended | ||||||||||||
| April 25, 2025 | April 26, 2024 | April 28, 2023 | ||||||||||
| Revenues: | ||||||||||||
| Product | $ | 3,040 | $ | 2,849 | $ | 3,049 | ||||||
| Services | 3,532 | 3,419 | 3,313 | |||||||||
| Net revenues | 6,572 | 6,268 | 6,362 | |||||||||
| Cost of revenues: | ||||||||||||
| Cost of product | 1,284 | 1,137 | 1,517 | |||||||||
| Cost of services | 675 | 698 | 636 | |||||||||
| Total cost of revenues | 1,959 | 1,835 | 2,153 | |||||||||
| Gross profit | 4,613 | 4,433 | 4,209 | |||||||||
| Operating expenses: | ||||||||||||
| Sales and marketing | 1,865 | 1,828 | 1,829 | |||||||||
| Research and development | 1,012 | 1,029 | 956 | |||||||||
| General and administrative | 311 | 308 | 265 | |||||||||
| Restructuring charges | 83 | 44 | 120 | |||||||||
| Acquisition-related expense | 5 | 10 | 21 | |||||||||
| Total operating expenses | 3,276 | 3,219 | 3,191 | |||||||||
| Income from operations | 1,337 | 1,214 | 1,018 | |||||||||
| Other income, net | 46 | 49 | 48 | |||||||||
| Income before income taxes | 1,383 | 1,263 | 1,066 | |||||||||
| Provision (benefit) for income taxes | 197 | 277 | (208 | ) | ||||||||
| Net income | $ | 1,186 | $ | 986 | $ | 1,274 | ||||||
| Net income per share: | ||||||||||||
| Basic | $ | 5.81 | $ | 4.74 | $ | 5.87 | ||||||
| Diluted | $ | 5.67 | $ | 4.63 | $ | 5.79 | ||||||
| Shares used in net income per share calculations: | ||||||||||||
| Basic | 204 | 208 | 217 | |||||||||
| Diluted | 209 | 213 | 220 |
See accompanying notes to consolidated financial statements.
NETAPP, INC.
CONSOLIDATED STATEMENTS O****F COMPREHENSIVE INCOME
(In millions)
| Year Ended | ||||||||||||
| April 25, 2025 | April 26, 2024 | April 28, 2023 | ||||||||||
| Net income | $ | 1,186 | $ | 986 | $ | 1,274 | ||||||
| Other comprehensive loss | ||||||||||||
| Foreign currency translation adjustments | (3 | ) | (5 | ) | (4 | ) | ||||||
| Defined benefit obligations: | ||||||||||||
| Defined benefit obligation adjustments | (2 | ) | (4 | ) | (2 | ) | ||||||
| Unrealized gains on available-for-sale securities: | ||||||||||||
| Unrealized holding gains arising during the period | 1 | — | — | |||||||||
| Unrealized gains (losses) on cash flow hedges: | ||||||||||||
| Unrealized holding gains (losses) arising during the period | (2 | ) | 2 | (6 | ) | |||||||
| Reclassification adjustments for (gains) losses included in net income | (1 | ) | (1 | ) | 5 | |||||||
| Other comprehensive loss | (7 | ) | (8 | ) | (7 | ) | ||||||
| Comprehensive income | $ | 1,179 | $ | 978 | $ | 1,267 |
See accompanying notes to consolidated financial statements.
NETAPP, INC.
CONSOLIDATED STATEMENTS OF CASH FLOWS
(In millions)
| Year Ended | ||||||||||||
| April 25, 2025 | April 26, 2024 | April 28, 2023 | ||||||||||
| Cash flows from operating activities: | ||||||||||||
| Net income | $ | 1,186 | $ | 986 | $ | 1,274 | ||||||
| Adjustments to reconcile net income to net cash provided by operating activities: | ||||||||||||
| Depreciation and amortization | 243 | 255 | 248 | |||||||||
| Non-cash operating l |
Showing the first 8K of 147K characters. Open the full section
Item 9. Changes in and Disagreements with Accountants on Accounting and Financial Disclosure
None.
Item 9A. Controls and Procedures
(a) Evaluation of Disclosure Controls and Procedures
The phrase “disclosure controls and procedures” refers to controls and procedures designed to ensure that information required to be disclosed in our reports filed or submitted under the Securities Exchange Act of 1934, as amended (the Exchange Act), such as this Annual Report on Form 10-K, is recorded, processed, summarized and reported within the time periods specified in the rules and forms of the U.S. Securities and Exchange Commission (SEC). Disclosure controls and procedures are also designed to ensure that such information is accumulated and communicated to our management, including our Chief Executive Officer (CEO) and our Chief Financial Officer (CFO), as appropriate to allow timely decisions regarding required disclosure.
Under the supervision and with the participation of our management, including our CEO and CFO, we carried out an evaluation of the effectiveness of the design and operation of our disclosure controls and procedures, as defined in Rules 13a-15(e) and 15d-15(e) under the Exchange Act, as of April 25, 2025, the end of the fiscal period covered by this Annual Report on Form 10-K (the Evaluation Date). Based on this evaluation, our CEO and CFO concluded as of the Evaluation Date that our disclosure controls and procedures were effective such that the information required to be disclosed in our SEC reports (i) is recorded, processed, summarized and reported within the time periods specified in SEC rules and forms and (ii) is accumulated and communicated to our management, including our CEO and CFO, as appropriate to allow timely decisions regarding required disclosure.
(b) Management’s Report on Internal Control Over Financial Reporting
Our management is responsible for establishing and maintaining adequate internal control over financial reporting, as such term is defined in Exchange Act Rule 13a-15(f). Our internal control over financial reporting is a process designed to provide reasonable assurance regarding the reliability of financial reporting and the preparation of financial statements for external purposes in accordance with generally accepted accounting principles. Because of its inherent limitations, internal control over financial reporting may not prevent or detect misstatements. Also, projections of any evaluation of effectiveness to future periods are subject to the risk that controls may become inadequate because of changes in conditions, or that the degree of compliance with the policies or procedures may deteriorate.
Under the supervision and with the participation of our management, including our principal executive officer and principal financial officer, we conducted an evaluation of the effectiveness of our internal control over financial reporting based on the criteria established in Internal Control — Integrated Framework (2013) issued by the Committee of Sponsoring Organizations of the Treadway Commission. Based on this assessment, our management concluded that, as of April 25, 2025, our internal control over financial reporting was effective at the reasonable assurance level based on those criteria.
The effectiveness of our internal control over financial reporting as of April 25, 2025 has been audited by Deloitte & Touche LLP, an independent registered public accounting firm, as stated in their report, which is included in Part II, Item 8 of this Annual Report on Form 10-K.
(c) Changes in Internal Control Over Financial Reporting
There has been no change in our internal control over financial reporting identified in connection with our evaluation required by paragraph (d) of rules 13a-15 and 15d-15 under the Exchange Act that occurred during the fourth quarter of fiscal 2025 that has materially affected, or is reasonably likely to materially affect, our internal control over financial reporting.
Item 9B. Other Information
Insider Adoption or Termination of Trading Arrangements
No directors or executive officers of the Company adopted, modified or terminated any contract, instruction or written plan for the purchase or sale of the Company's securities that was intended to satisfy the affirmative defense conditions of Rule 10b5-1(c) or any non-Rule 10b5-1 trading arrangement (as defined in Item 408(c) of Regulation S-K) during the fourth quarter of fiscal 2025.
Item 9C. Disclosure Regarding Foreign Jurisdictions that Prevent Inspections
Not Applicable.
PA****RT III
Item 10. Directors, Executive Officers and Corporate Governance
The information required by Item 10 with respect to our executive officers is incorporated herein by reference from the information under Item 1 – Business of Part I of this Annual Report on Form 10-K under the section entitled “Information About Our Executive Officers.” The information required by Item 10 with respect to the Company’s directors and corporate governance is incorporated herein by reference from the information provided under the headings “Election of Directors” and “Corporate Governance,” respectively, in the Proxy Statement for the 2025 Annual Meeting of Stockholders, which will be filed with the Securities and Exchange Commission within 120 days of our year ended April 25, 2025. The information required by Item 405 of Regulation S-K is incorporated herein by reference from the information provided under the heading “Delinquent Section 16(a) Reports” in the Proxy Statement for the 2025 Annual Meeting of Stockholders, to the extent applicable.
We have adopted a written code of ethics that applies to our Board of Directors and all of our employees, including our principal executive officer and principal financial and accounting officer. A copy of the code of ethics, which we refer to as our “Code of Conduct,” is available on our website at http://netapp.com/us/media/code-of-conduct.pdf. We will post any amendments to or waivers from the provisions of our Code of Conduct on our website.
We have adopted our Insider Trading Policy governing the purchase, sale, and/or other dispositions of our securities by our directors, officers, and employees that we believe is reasonably designed to promote compliance with insider trading laws, rules and regulations, and the exchange listing standards applicable to us. A copy of our Insider Trading Policy is filed as Exhibit 19.1 to this Annual Report on Form 10-K. In addition, with regards to the Company’s trading in its own securities, it is the Company’s policy to comply with the federal securities laws and the applicable exchange listing requirements.
Item 11. Executive Compensation
Information regarding the compensation of executive officers and directors of the Company is incorporated by reference from the information under the headings “Executive Compensation and Related Information” and “Director Compensation,” respectively, in our Proxy Statement for the 2025 Annual Meeting of Stockholders (provided that the information under the heading "Pay Versus Performance" shall not be deemed to be incorporated by reference herein).
Item 12. Security Ownership of Certain Beneficial Owners and Management and Related Stockholder Matters
Information regarding security ownership of certain beneficial owners and management and related stockholder matters is incorporated by reference from the information under the heading “Security Ownership of Certain Beneficial Owners and Management” in our Proxy Statement for the 2025 Annual Meeting of Stockholders.
Item 13. Certain Relationships and Related Transactions, and Director Independence
Information regarding certain relationships and related transactions and director independence is incorporated by reference from the information under the headings “Corporate Governance” and “Certain Transactions with Related Parties” in our Proxy Statement for the 2025 Annual Meeting of Stockholders.
Item 14. Principal Accountant Fees and Services
The information required by this item is incorporated by reference from the information under the caption “Audit Fees” in our Proxy Statement for the 2025 Annual Meeting of Stockholders.
With the exception of the information incorporated in Items 10, 11, 12, 13 and 14 of this Annual Report on Form 10-K, NetApp’s Proxy Statement is not deemed “filed” as part of this Annual Report on Form 10-K.
PA****RT IV
Item 15. Exhibits, Financial Statement Schedules
(a) Documents filed as part of this report
(1) All Financial Statements
See index to Consolidated Financial Statements in Part II, Item 8 of this Form 10-K.
(2) Financial Statement Schedules
All financial statement schedules have been omitted, since the required information is not applicable or is not present in amounts sufficient to require submission of the schedule, or because the information required is included in the consolidated financial statements and notes thereto included in this Form 10-K.
(3) Exhibits required by Item 601 of Regulation S-K
The information required by this Section (a)(3) of Item 15 is as follows:
EXHIBIT INDEX
| 97.1 | Compensation Recovery Policy of the Company. | 10-K | 000-27130 | 97.1 | June 10, 2024 | |||||
| 101.INS | Inline XBRL Instance Document – the instance document does not appear in the Interactive Data File because its XBRL tags are embedded within the Inline XBRL document | — | — | — | — | |||||
| 101.SCH | Inline XBRL Taxonomy Extension Schema With Embedded Linkbase Document | — | — | — | — | |||||
| 104 | Cover Page Interactive Data File (formatted as inline XBRL and contained in Exhibit 101) |
- Identifies management plan or compensatory plan or arrangement.
SIGNATURES
Pursuant to the requirements of Section 13 or 15(d) of the Securities Exchange Act of 1934, as amended, the registrant has duly caused this report to be signed on its behalf by the undersigned, thereunto duly authorized.
| NETAPP, INC. | ||
| By: | /s/ GEORGE KURIAN | |
| George Kurian | ||
| Chief Executive Officer and Director (Principal Executive Officer and Principal Operating Officer) | ||
| Date: June 9, 2025 |
POWER OF ATTORNEY
KNOW ALL PERSONS BY THESE PRESENTS, that each person whose signature appears below constitutes and appoints George Kurian and Wissam Jabre, and each of them, as his true and lawful attorneys-in-fact and agents, with full power of substitution and resubstitution, for him and in his name, place and stead, in any and all capacities, to sign any and all amendments (including post-effective amendments) to this Annual Report on Form 10-K, and to file the same, with all exhibits thereto, and other documents in connection therewith, with the Securities and Exchange Commission, granting unto said attorneys-in-fact and agents, and each of them, full power and authority to do and perform each and every act and thing requisite and necessary to be done in connection therewith, as fully to all intents and purposes as he might or could do in person, hereby ratifying and confirming all that said attorneys-in-fact and agents, or any of them, or their or his substitutes, may lawfully do or cause to be done by virtue thereof.
Pursuant to the requirements of the Securities Exchange Act of 1934, as amended, this report has been signed below by the following persons on behalf of the registrant and in the capacities and on the dates indicated.
| Signature | Title | Date | ||
| /s/ GEORGE KURIAN | Chief Executive Officer and Director (Principal Executive Officer and Principal Operating Officer) | June 9, 2025 | ||
| George Kurian | ||||
| /s/ WISSAM JABRE | Executive Vice President and Chief Financial Officer (Principal Financial Officer) | June 9, 2025 | ||
| Wissam Jabre | ||||
| /s/ DANIEL DE LORENZO | Vice President and Chief Accounting Officer (Principal Accounting Officer) | June 9, 2025 | ||
| Daniel De Lorenzo | ||||
| /s/ T. MICHAEL NEVENS | Chairman of the Board | June 9, 2025 | ||
| T. Michael Nevens | ||||
| /s/ DEEPAK AHUJA | Director | June 9, 2025 | ||
| Deepak Ahuja | ||||
| /s/ ANDERS GUSTAFSSON | Director | June 9, 2025 | ||
| Anders Gustafsson | ||||
| /s/ GERALD HELD | Director | June 9, 2025 | ||
| Gerald Held | ||||
| /s/ DEBORAH KERR | Director | June 9, 2025 | ||
| Deborah Kerr | ||||
| /s/ CARRIE PALIN | Director | June 9, 2025 | ||
| Carrie Palin | ||||
| /s/ FRANK PELZER | Director | June 9, 2025 | ||
| Frank Pelzer | ||||
| /s/ SCOTT SCHENKEL | Director | June 9, 2025 | ||
| Scott Schenkel | ||||
| /s/ JUNE YANG | Director | June 9, 2025 | ||
| June Yang | ||||