 filings.tools
Item 5. Market for Registrant’s Common Equity, Related Stockholder Matters and Issuer Purchases of Equity Securities.
4K characters. Original on sec.gov · Markdown
Item 5. Market for Registrant’s Common Equity, Related Stockholder Matters and Issuer Purchases of Equity Securities.
| --- | --- |
Our shares of common stock are listed and principally traded on the New York Stock Exchange. The following table sets forth the high and low prices per share for our common stock for each fiscal quarter during the years ended December 31, 2011 and 2010:
| HIGH | LOW | |||||||
| Prices per Share: | ||||||||
| 2011 | ||||||||
| Fourth Quarter | $ | 692.19 | $ | 554.71 | ||||
| Third Quarter | $ | 760.37 | $ | 555.58 | ||||
| Second Quarter | $ | 788.79 | $ | 701.00 | ||||
| First Quarter | $ | 804.32 | $ | 674.07 | ||||
| 2010 | ||||||||
| Fourth Quarter | $ | 699.28 | $ | 611.50 | ||||
| Third Quarter | $ | 680.05 | $ | 595.00 | ||||
| Second Quarter | $ | 769.50 | $ | 627.43 | ||||
| First Quarter | $ | 759.27 | $ | 655.00 |
Table of Contents
As of the close of business on February 17, 2012, there were 351 shareholders of record.
We have never paid a cash dividend on our shares of common stock and have no current intentions to do so in the future.
We had two repurchase authorizations outstanding during the quarter ended December 31, 2011. On July 28, 2011 (“July Authorization”) and on December 14, 2011 (“December Authorization”), we publicly announced the Board of Directors’ approval for us to repurchase up to an aggregate of $300 million per authorization, of our common stock in one or more open market and/or privately negotiated transactions. The repurchase authorizations do not have expiration dates. The following table provides information regarding common stock repurchases for the quarter ended December 31, 2011:
| Maximum Number (or | ||||||||||||||||
| Total Number of | Approximate Dollar | |||||||||||||||
| Shares Purchased | Value) of Shares that | |||||||||||||||
| Total Number | Average | as Part of Publicly | May Yet Be | |||||||||||||
| of Shares | Price Paid | Announced Plans | Purchased Under the | |||||||||||||
| Period | Purchased | per Share | or Programs | Plans or Programs | ||||||||||||
| October 1 - 31, 2011 | 38,323 | $ | 591.65 | 38,323 | $ | 19,897,000 | ||||||||||
| November 1 - 30, 2011 | — | $ | — | — | $ | 19,897,000 | ||||||||||
| December 1 - 31, 2011 | — | $ | — | — | $ | 319,897,000 | ||||||||||
| Total | 38,323 | $ | 591.65 | 38,323 | ||||||||||||
Table of Contents
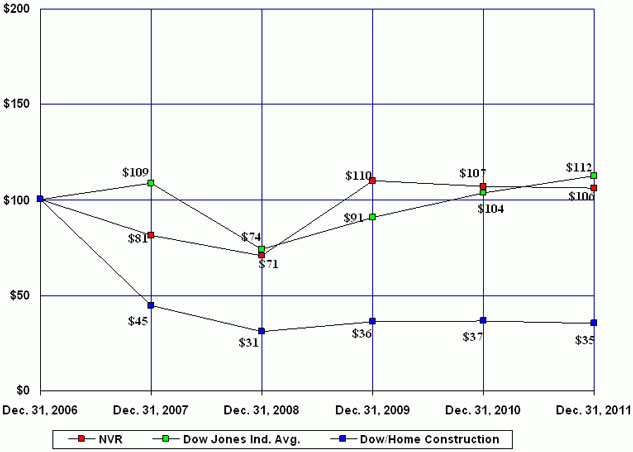
STOCK PERFORMANCE GRAPH
COMPARISON OF CUMULATIVE TOTAL EQUITYHOLDER RETURN ON EQUITY
The following chart graphs our performance in the form of cumulative total return to holders of our Common Stock since December 31, 2006 in comparison to the Dow/Home Construction Index and the Dow Jones Industrial Index for that same period, assuming that $100 was invested in NVR stock and the indices on December 31, 2006.
Previous: Item 4. Mine Safety Disclosures. · Next: Item 6. Selected Financial Data.