 filings.tools
NXP Semiconductors 10-K 2019-12-31
Filed 2020-02-27. 22 sections, 448K characters. Original on sec.gov · Markdown · JSON
Cover and table of contents
UNITED STATES
SECURITIES AND EXCHANGE COMMISSION
Washington, D.C. 20549
FORM 10-K
(Mark One)
☒ ANNUAL REPORT PURSUANT TO SECTION 13 OR 15(d) OF THE SECURITIES EXCHANGE ACT OF 1934
For the fiscal year ended December 31, 2019
or
☐ TRANSITION REPORT PURSUANT TO SECTION 13 OR 15(d) OF THE SECURITIES EXCHANGE ACT OF 1934
For the transition period from to .
Commission File Number: 001-34841
NXP Semiconductors N.V.
(Exact name of registrant as specified in its charter)
| Netherlands | 98-1144352 | |
| (State or other jurisdiction of incorporation or organization) | (I.R.S. employer identification number) | |
| 60 High Tech Campus | ||
| Eindhoven | ||
| Netherlands | 5656 AG | |
| (Address of principal executive offices) | (Zip Code) |
| +31 | 40 | 2729999 | |
| (Registrant’s telephone number, including area code) |
Securities registered pursuant to Section 12(b) of the Act:
| Title of each class | Trading symbol(s) | Name of each exchange on which registered |
| Common shares, EUR 0.20 par value | NXPI | The Nasdaq Global Select Market |
Securities registered pursuant to Section 12(g) of the Act: None
Indicate by check mark if the Registrant is a well-known seasoned issuer, as defined in Rule 405 of the Securities Act.
Yes ☒ No ☐
Indicate by check mark if the Registrant is not required to file reports pursuant to Section 13 or Section 15(d) of the Act.
Yes ☐ No ☒
Indicate by check mark whether the Registrant (1) has filed all reports required to be filed by Section 13 or 15(d) of the Securities Exchange Act of 1934 during the preceding 12 months (or for such shorter period that the Registrant was required to file such reports), and (2) has been subject to such filing requirements for the past 90 days.
Yes ☒ No ☐
Indicate by check mark whether the Registrant has submitted electronically every interactive data file required to be submitted pursuant to Rule 405 of Regulation S-T (§ 232.405 of this chapter) during the preceding 12 months (or for such shorter period that the Registrant was required to submit such files).
Yes ☒ No ☐
Indicate by check mark whether the Registrant is a large accelerated filer, an accelerated filer, a non-accelerated filer, a smaller reporting company, or an emerging growth company. See the definitions of "large accelerated filer," "accelerated filer," "smaller reporting company," and "emerging growth company" in Rule 12b-2 of the Exchange Act.
| Large accelerated filer | ☒ | Accelerated filer | ☐ |
| Non-accelerated filer | ☐ | Smaller reporting company | ☐ |
| Emerging growth company | ☐ |
If an emerging growth company, indicate by check mark if the Registrant has elected not to use the extended transition period for complying with any new or revised financial accounting standards provided pursuant to Section 13(a) of the Exchange Act. ☐
Indicate by check mark whether the Registrant is a shell company (as defined in Rule 12b-2 of the Exchange Act).
Yes ☐ No ☒
The aggregate market value of the voting stock held by non-affiliates of the Registrant, based upon the closing sale price of our ordinary shares on June 28, 2019 as reported on the Nasdaq Global Select Market, was $27.2 billion. As of February 21, 2020, the Registrant had 279,750,659 outstanding ordinary shares, excluding shares held in treasury.
DOCUMENTS INCORPORATED BY REFERENCE
Portions of the Registrant’s definitive proxy statement relating to its 2020 Annual General Meeting of shareholders (the “2020 Proxy Statement”) are incorporated by reference into Part III of this Annual Report on Form 10-K where indicated. The 2020 Proxy Statement will be filed with the U.S. Securities and Exchange Commission within 120 days after the end of the fiscal year to which this report relates.
Table of Contents
Introduction and Forward Looking Statements
This Annual Report on Form 10-K for the fiscal year ended December 31, 2019 (the “Annual Report”) and certain information incorporated herein by reference contains forward-looking statements, which are provided under the “safe harbor” protection of the Private Securities Litigation Reform Act of 1995. When used in this Annual Report, the words “anticipate”, “believe”, “estimate”, “forecast”, “expect”, “intend”, “plan” and “project” and similar expressions, as they relate to us, our management or third parties, identify forward-looking statements. Forward-looking statements include statements regarding our business strategy, financial condition, results of operations and market data, as well as any other statements that are not historical facts. These statements reflect beliefs of our management, as well as assumptions made by our management and information currently available to us. Although we believe that these beliefs and assumptions are reasonable, these statements are subject to numerous factors, risks and uncertainties that could cause actual outcomes and results to be materially different from those projected. These factors, risks and uncertainties expressly qualify all subsequent oral and written forward-looking statements attributable to us or persons acting on our behalf and include, in addition to those listed under Part I, Item 1A. Risk Factors and elsewhere in this Annual Report, the following:
| • | market demand and semiconductor industry conditions; |
| • | our ability to successfully introduce new technologies and products; |
| • | the demand for the goods into which our products are incorporated; |
| • | trade disputes between the U.S. and China, potential increase of barriers to international trade and resulting disruptions to our established supply chains; |
| • | our ability to generate sufficient cash, raise sufficient capital or refinance our debt at or before maturity to meet both our debt service and research and development and capital investment requirements; |
| • | our ability to accurately estimate demand and match our production capacity accordingly or obtain supplies from third-party producers; |
| • | our access to production from third-party outsourcing partners, and any events that might affect their business or our relationship with them; |
| • | our ability to secure adequate and timely supply of equipment and materials from suppliers; |
| • | our ability to avoid operational problems and product defects and, if such issues were to arise, to rectify them quickly; |
| • | our ability to form strategic partnerships and joint ventures and successfully cooperate with our alliance partners; |
| • | our ability to win competitive bid selection processes; |
| • | our ability to develop products for use in our customers’ equipment and products; |
| • | our ability to successfully hire and retain key management and senior product engineers; and |
| • | our ability to maintain good relationships with our suppliers. |
We do not assume any obligation to update any forward-looking statements and disclaim any obligation to update our view of any risks or uncertainties described herein or to publicly announce the result of any revisions to the forward-looking statements made in this Annual Report, except as required by law.
In addition, this Annual Report contains information concerning the semiconductor industry and business segments generally, which is forward-looking in nature and is based on a variety of assumptions regarding the ways in which the semiconductor industry, our market and business segments will develop. We have based these assumptions on information currently available to us, including through the market research and industry reports referred to in this Annual Report. If any one or more of these assumptions turn out to be incorrect, actual market results may differ from those predicted. While we do not know what impact any such differences may have on our business, if there are such differences, they could have a material adverse effect on our future results of operations and financial condition, and the trading price of our common stock.
The financial information included in this Annual Report is based on United States Generally Accepted Accounting Principles (U.S. GAAP), unless otherwise indicated.
In presenting and discussing our financial position, operating results and cash flows, management uses certain non-U.S. GAAP financial measures. These non-U.S. GAAP financial measures should not be viewed in isolation or as alternatives to the equivalent U.S. GAAP measures and should be used in conjunction with the most directly comparable U.S. GAAP measures. A discussion of non-U.S. GAAP measures included in this Annual Report and a reconciliation of such measures to the most directly comparable U.S. GAAP measures are set forth under “Use of Certain Non-U.S. GAAP Financial Measures” contained in this Annual Report under Part II, Item 7. Management’s Discussion and Analysis of Financial Condition and Results of Operations.
Unless otherwise required, all references herein to “we”, “our”, “us”, “NXP” and the “Company” are to NXP Semiconductors N.V. and its consolidated subsidiaries.
This Annual Report includes market data and certain other statistical information and estimates that are based on reports and other publications from industry analysts, market research firms, and other independent sources, as well as management’s own good faith estimates and analyses. NXP believes these third-party reports to be reputable, but has not independently verified the underlying data sources, methodologies or assumptions. The reports and other publications referenced are generally available to the public and were not commissioned by NXP. Information that is based on estimates, forecasts, projections, market research or similar methodologies is inherently subject to uncertainties and actual events or circumstances may differ materially from events and circumstances reflected in this information.
Part I
Item 1. Business
Company Overview
NXP Semiconductors N.V. is a global semiconductor company and a long-standing supplier in the industry, with over 50 years of innovation and operating history. For the year ended December 31, 2019, we generated revenue of $8,877 million, compared to $9,407 million for the year ended December 31, 2018.
We provide leading solutions that leverage our combined portfolio of intellectual property, deep application knowledge, process technology and manufacturing expertise in the domains of cryptography-security, high-speed interface, radio frequency (RF), mixed-signal analog-digital (mixed A/D), power management, digital signal processing and embedded system design.
Our product solutions are used in a wide range of end-market applications including: automotive, industrial & Internet of Things (IoT), mobile, and communication infrastructure. We engage with leading global original equipment manufacturers (OEM) and sell products in all major geographic regions.
Our legal name is NXP Semiconductors N.V. and our commercial name is “NXP” or “NXP Semiconductors.”
We were incorporated in the Netherlands in 2006 as a Dutch public company with limited liability (naamloze vennootschap).
On August 5, 2010, we made an initial public offering of 34 million shares of our common stock and listed our common stock on Nasdaq.
We are a holding company (the “Holding Company”) whose only material assets are the direct ownership of 100% of the shares of NXP B.V., a Dutch private company with limited liability (besloten vennootschap met beperkte aansprakelijkheid).
Our corporate seat is in Eindhoven, the Netherlands. Our principal executive office is at High Tech Campus 60, 5656 AG Eindhoven, the Netherlands, and our telephone number is +31 40 2729999. Our registered agent in the United States is NXP USA, Inc., 6501 William Cannon Dr. West, Austin, Texas 78735, United States of America, phone number +1 512 9338214.
Semiconductor Market Overview
Semiconductors perform a broad variety of functions within electronic products and systems, including processing data, sensing, storing information and converting or controlling electronic signals. Semiconductors vary significantly depending upon the specific function or application of the end product in which the semiconductor is used and the customer who is deploying it. Semiconductors also vary on a number of technical characteristics including the degree of integration, level of customization, programmability and the process technology utilized to manufacture the semiconductor. Advances in semiconductor technology have increased the functionality and performance of semiconductors, improving their features and power consumption characteristics while reducing their size and cost. These advances have resulted in growth of semiconductors and electronic content across a diverse array of products. The semiconductor market totaled $412 billion in 2019.
Business Combinations
On December 6, 2019, NXP acquired Marvell Technology Group Ltd.'s ("Marvell") Wireless WiFi Connectivity Business Unit, Bluetooth technology portfolio and related assets, for total consideration of $1.7 billion, net of closing adjustments. The financial results from the acquisition date through December 31, 2019, are included in NXP’s Consolidated Statement of Operations, as discussed herein. NXP accounted for the acquisition under the acquisition method of accounting in accordance with Financial Accounting Standards
Board Accounting Standards Topic 805, Business Combinations, with NXP treated as the accounting acquirer, see further discussion below.
On October 27, 2016, NXP entered into a purchase agreement (the “Purchase Agreement”) with Qualcomm River Holdings B.V. (“Buyer”), a wholly-owned, indirect subsidiary of QUALCOMM Incorporated (“Qualcomm”). Pursuant to the Purchase Agreement, Buyer commenced a tender offer to acquire all of the issued and outstanding common shares of NXP for $110 per share in cash, for estimated total cash consideration of $38 billion. On February 20, 2018, NXP entered into an amendment (the “Purchase Agreement Amendment”) to the Purchase Agreement with Buyer. Pursuant to the Purchase Agreement Amendment, Buyer agreed to revise the terms of its tender offer to acquire all of the issued and outstanding common shares of NXP and increase the offer price from $110 per share to $127.50 per share, for estimated total cash consideration of $44 billion. On April 19, 2018, NXP and Buyer further amended the Purchase Agreement to extend the date that either Buyer or NXP would have the right to terminate the Purchase Agreement to July 25, 2018, subject to the terms of the Purchase Agreement.
On July 26, 2018, NXP received notice from Qualcomm that it had terminated, effective immediately, the Purchase Agreement, as amended, between NXP and Buyer following the inability to obtain the required approval for the transaction from the State Administration for Market Regulation (SAMR) of the People’s Republic of China prior to the end date stipulated by the parties under the Purchase Agreement. On July 26, 2018, NXP received $2 billion termination compensation per the terms of the Purchase Agreement.
Other Significant Transactions
On August 16, 2019, NXP reached a definitive agreement with Shenzhen Goodix Technology Co., Ltd. from China, under which it will acquire all assets related to our Voice and Audio Solutions (VAS) activities for an amount of $165 million. These assets have met the held for sale criteria as of December 31, 2019.
On July 10, 2018, NXP completed the sale of its 40% equity interest of Suzhou ASEN Semiconductors Co., Ltd. to J&R Holding Limited, receiving $127 million in cash proceeds.
In June 2018, NXP completed the sale of 24% of its equity interest in WeEn to Tianjin Ruixin Semiconductor Industry Investment Centre LLP, receiving $32 million in cash proceeds. At December 31, 2018, due to the intended sale of the remaining interest in WeEn, NXP transferred the remaining holding to other current assets. On March 27, 2019, we sold our remaining equity interest in WeEn, receiving net cash proceeds of $37 million.
Reporting Segments
Prior to January 1, 2019, High Performance Mixed Signal (HPMS) was our sole reportable segment. Corporate and Other represented the remaining portion to reconcile to the Consolidated Financial Statements. Effective January 1, 2019, NXP removed the reference to HPMS in its organizational structure in acknowledgement of the one reportable segment representing the entity as a whole and reflects the way in which our chief operating decision maker executes operating decisions, allocates resources, and manages the growth and profitability of the Company.
End-market Exposure
Our product groups are focused on four primary end-markets that we believe are characterized by long-term, attractive growth opportunities and where we enjoy sustained, competitive differentiation through our technology leadership. The four end-markets are Automotive, Industrial & IoT, Mobile, and Communication Infrastructure & Others.
| Automotive | Industrial & IoT | Mobile | Comm Infra & Others | ||
| Key Applications | ADAS/Radar Connected Infotainment Vehicle Networks Electrification Secure Car Access eCockpit Body Comfort & Convenience Powertrain | Factory and Building Automation Smart Home and Building Control Home Entertainment Power and Energy Medical Smart Retail Smart Appliances | Smartphones Wearables Tablets Mobile Accessories | Wireless Basestations Enterprise Data Center Network & Security Wired and Wireless Service Provider Infrastructure Banking Cards eGovernment Transit Cards RFID Tagging | |
| Growth Drivers | Vehicle electrification and automation Government requirements & consumer demands for increased safety, reliability, comfort and efficiency Increase need o |
Showing the first 8K of 60K characters. Open the full section
Item 1A. Risk Factors
Risks related to our business
The semiconductor industry is highly cyclical.
Historically, the relationship between supply and demand in the semiconductor industry has caused a high degree of cyclicality in the semiconductor market. Semiconductor supply is partly driven by manufacturing capacity, which in the past has demonstrated alternating periods of substantial capacity additions and periods in which no or limited capacity was added. As a general matter, semiconductor companies are more likely to add
capacity in periods when current or expected future demand is strong and margins are, or are expected to be, high. Investments in new capacity can result in overcapacity, which can lead to a reduction in prices and margins. In response, companies typically limit further capacity additions, eventually causing the market to be relatively undersupplied. In addition, demand for semiconductors varies, which can exacerbate the effect of supply fluctuations. As a result of this cyclicality, the semiconductor industry has in the past experienced significant downturns, such as in 1997/1998, 2001/2002 and in 2008/2009, often in connection with, or in anticipation of, maturing life cycles of semiconductor companies’ products and declines in general economic conditions. These downturns have been characterized by diminishing demand for end-user products, high inventory levels, under-utilization of manufacturing capacity and accelerated erosion of average selling prices. The foregoing risks have historically had, and may continue to have, a material adverse effect on our business, financial condition and results of operations.
Significantly increased volatility and instability and unfavorable economic conditions may adversely affect our business.
In 2008 and 2009, Europe, the United States and international markets experienced increased volatility and instability. In 2015, volatility and instability in financial markets continued following renewed investor concerns related to the economic situation in parts of the world, a decline in the growth rate of the Chinese economy, increased hostilities in the Middle East, and other world events. These, or other events, could further adversely affect the economies of the European Union, the United States and those of other countries and may exacerbate the cyclicality of our business. Among other factors, we face risks attendant to unfavorable changes related to interest rates, rates of economic growth, fiscal, monetary and trade policies of governments, tax rates and policy and changes in demand for end-user products and changes in interest rates.
There is a significant risk that the global economy could fall into recession again. If economic conditions remain uncertain or deteriorate, our business, financial condition and results of operations could be materially adversely affected.
It is difficult for us, our customers and suppliers to forecast demand trends. We may be unable to accurately predict the extent or duration of cycles or their effect on our financial condition or result of operations and can give no assurance as to the timing, extent or duration of the current or future business cycles. A recurrent decline in demand or the failure of demand to return to prior levels could place pressure on our results of operations. The timing and extent of any changes to currently prevailing market conditions is uncertain and supply and demand may be unbalanced at any time.
The semiconductor industry is highly competitive. If we fail to introduce new technologies and products in a timely manner, this could adversely affect our business.
The semiconductor industry is highly competitive and characterized by constant and rapid technological change, short product lifecycles, significant price erosion and evolving standards. Accordingly, the success of our business depends to a significant extent on our ability to develop new technologies and products that are ultimately successful in the market. The costs related to the research and development necessary to develop new technologies and products are significant and any reduction of our research and development budget could harm our competitiveness. Meeting evolving industry requirements and introducing new products to the market in a timely manner and at prices that are acceptable to our customers are significant factors in determining our competitiveness and success. Commitments to develop new products must be made well in advance of any resulting sales, and technologies and standards may change during development, potentially rendering our products outdated or uncompetitive before their introduction. If we are unable to successfully develop new products, our revenue may decline substantially. Moreover, some of our competitors are well-established entities, are larger than us and have greater resources than we do. If these competitors increase the resources they devote to developing and marketing their products, we may not be able to compete effectively. Any consolidation among our competitors could enhance their product offerings and financial resources, further strengthening their competitive position. In addition, some of our competitors operate in narrow business areas relative to us, allowing them to concentrate their research and development efforts directly on products and services for those areas, which may give them a competitive advantage. As a result of these competitive pressures, we may face declining sales volumes or lower prevailing prices for our products, and we may not be able to reduce our total
costs in line with this declining revenue. If any of these risks materialize, they could have a material adverse effect on our business, financial condition and results of operations.
In many of the market segments in which we compete, we depend on winning selection processes, and failure to be selected could adversely affect our business in those market segments.
One of our business strategies is to participate in and win competitive bid selection processes to develop products for use in our customers’ equipment and products. These selection processes can be lengthy and require us to incur significant design and development expenditures, with no guarantee of winning a contract or generating revenue. Failure to win new design projects and delays in developing new products with anticipated technological advances or in commencing volume shipments of these products may have an adverse effect on our business. This risk is particularly pronounced in markets where there are only a few potential customers and in the automotive market, where, due to the longer design cycles involved, failure to win a design-in could prevent access to a customer for several years. Our failure to win a sufficient number of these bids could result in reduced revenue and hurt our competitive position in future selection processes because we may not be perceived as being a technology or industry leader, each of which could have a material adverse effect on our business, financial condition and results of operations.
The demand for our products depends to a significant degree on the demand for our customers’ end products.
The vast majority of our revenue is derived from sales to manufacturers in the automotive, industrial & IoT, mobile, and communication infrastructure. Demand in these markets fluctuates significantly, driven by consumer spending, consumer preferences, the development of new technologies and prevailing economic conditions. In addition, the specific products in which our semiconductors are incorporated may not be successful, or may experience price erosion or other competitive factors that affect the price manufacturers are willing to pay us. Such customers have in the past, and may in the future, vary order levels significantly from period to period, request postponements to scheduled delivery dates, modify their orders or reduce lead times. T
Showing the first 8K of 78K characters. Open the full section
Item 1B. Unresolved Staff Comments
Not applicable.
Item 2. Properties
NXP uses 100 sites in 32 countries with 11.2 million square feet of total owned and leased building space of which 9.7 million square feet is owned property. The following table sets out our principal real property holdings as of December 31, 2019:
| Location | Use | Owned/leased | Building space (square feet) | |||
| Eindhoven, the Netherlands | Headquarters | Leased | 163,188 | |||
| Nijmegen, the Netherlands | Manufacturing | Owned | 1,515,550 | |||
| Singapore (SSMC) * | Manufacturing | Owned | 971,936 | |||
| Bangkok, Thailand | Manufacturing | Owned | 547,882 | |||
| Kaohsiung, Taiwan | Manufacturing | Owned | 636,400 | |||
| Tianjin, China | Manufacturing | Owned | 447,624 | |||
| Kuala Lumpur, Malaysia | Manufacturing | Owned | 828,858 | |||
| Chandler, United States | Manufacturing | Owned | 1,173,196 | |||
| Austin (Oak Hill), United States | Manufacturing | Owned | 1,511,861 | |||
| Austin (Ed Bluestein), United States | Manufacturing | Owned | 1,158,731 |
| * | Joint venture between TSMC and NXP. |
Item 3. Legal Proceedings
The information set forth under the “Litigation” and “Environmental Remediation” captions of Note 16 to the Consolidated Financial Statements included in Part II, Item 8 of this Annual Report is incorporated herein by reference. For additional discussion of certain risks associated with legal proceedings, see Part I, Item 1A. Risk Factors.
Item 4. Mine Safety Disclosures
Not applicable.
Part II
Item 5. Market for Registrant’s Common Equity, Related Stockholder Matters and Issuer Purchases of Equity Securities
The shares of common stock of the Company are listed on the stock market of Nasdaq in New York under the ticker symbol “NXPI”. On February 20, 2020 there were 12 shareholders of record and 393,191 beneficial shareholders of our common stock.
Dividends Per Common Share
The following table presents the quarterly dividends on our common stock for the periods indicated:
| 2019 | 2018 | ||||
| First Quarter | 0.250 | - | |||
| Second Quarter | 0.250 | - | |||
| Third Quarter | 0.375 | 0.250 | |||
| Fourth Quarter | 0.375 | 0.250 |
Equity Compensation Plan Information
Information regarding our equity compensation plans, including both stockholder approved plans and non-stockholder approved plans, will be contained in our Proxy Statement for our 2020 Annual Meeting of Stockholders under the caption “Equity Compensation Plan Information” and is incorporated by reference into this report.
Issuer Purchases of Equity Securities
Effective July 26, 2018, the board of directors of NXP (the “Board”), as authorized by the 2018 annual general meeting of shareholders, authorized the repurchase of $5 billion of the Company’s ordinary shares over a period of 18 months (the “2018 Share Repurchase Program”). In October 2018, the board of directors of NXP increased the repurchase authorization under the 2018 Share Repurchase Program up to a maximum of 20% of issued share capital (approximately 69 million shares). The 2018 Share Repurchase Program was completed in July 2019, and a total of 69 million shares were repurchased under this program. In November 2019, the Board, as authorized by the 2019 annual general meeting of shareholders, authorized the repurchase of $2 billion of shares (the “2019 Share Repurchase Program”). In addition, the Board approved the purchase of shares from participants in the Company's equity programs who trade shares as trade for tax. This authorization will remain in effect until terminated by the Board. During the fiscal year-ended December 31, 2019, NXP repurchased no shares under the 2019 Share Repurchase Program. Under Dutch tax law, the repurchase of a company’s shares by an entity domiciled in the Netherlands results in a taxable event. The tax on the repurchased shares is attributed to the shareholders, with NXP making the payment on the shareholders’ behalf. As such, the tax on the repurchased shares is accounted for within stockholders’ equity. The following table provides a summary of shares repurchased by the Company in 2019:
| Period | Total Number of Shares Purchased | Average Price Paid per Share | Number of Shares Purchased as Part of Publicly Announced Plans or Programs | Maximum Number of Shares That May Yet Be Purchased Under the Plans or Program | Number of Shares Purchased as Trade for Tax (1) | |||||||||
| January 1, 2019 – February 3, 2019 | 5,323,164 | $80.18 | 5,254,300 | 9,776,779 | 68,864 | |||||||||
| February 4, 2019 – March 3, 2019 | 3,158,779 | $91.28 | 3,134,759 | 6,618,000 | 24,020 | |||||||||
| March 4, 2019 – March 31, 2019 | 454 | $93.30 | — | 6,617,546 | 454 | |||||||||
| April 1, 2019 – May 5, 2019 | 3,099,582 | $100.35 | 3,096,600 | 3,517,964 | 2,982 | |||||||||
| May 6, 2019 – June 2, 2019 | 3,516,432 | $94.98 | 3,500,000 | 1,532 | 16,432 | |||||||||
| June 3, 2019 – June 30, 2019 | — | $0.00 | — | 1,532 | — | |||||||||
| July 1, 2019 – August 4, 2019 | 84,865 | $101.81 | — | — | 84,865 | |||||||||
| August 5, 2019 – September 1, 2019 | 3,829 | $100.78 | — | — | 3,829 | |||||||||
| September 2, 2019 – September 29, 2019 | 200 | $106.00 | — | — | 200 | |||||||||
| September 30, 2019 – November 3, 2019 | 678,473 | $108.56 | — | — | 678,473 | |||||||||
| November 4, 2019 – December 1, 2019 | (60 | ) | $108.27 | — | 17,304,032 | (60 | ) | |||||||
| December 2, 2019 – December 31, 2019 | — | $0.00 | — | 15,715,857 | — | |||||||||
| Total | 15,865,718 | 14,985,659 | 880,059 |
| (1) | Reflects shares surrendered by participants to satisfy tax withholding obligations in connection with the Company's equity programs. |
Company Performance
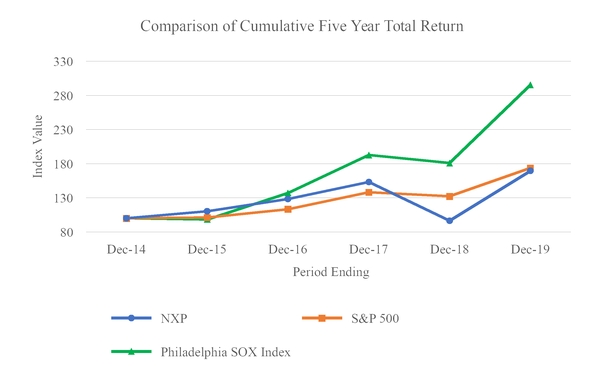
The following graph shows a comparison, since December 31, 2014 of cumulative total return for NXP, the Standard & Poor's 500 Index, and the Philadelphia Stock Exchange Semiconductor Index. The graph assumes $100 (not in millions) invested on December 31, 2014 in our common stock and each of the indices.
Item 6. Selected Financial Data
The following table presents a summary of our selected historical consolidated financial data. We prepare our financial statements in accordance with U.S. GAAP.
The results of operations for prior years are not necessarily indicative of the results to be expected for any future period.
On December 6, 2019, we acquired Marvell Technology Group Ltd.'s ("Marvell") Wireless WiFi Connectivity Business Unit, Bluetooth technology portfolio and related assets, for total consideration of $1.7 billion, net of closing adjustments. The results of their operations and the estimated fair value of the assets acquired and liabilities assumed in the business combination are included in our financial statements from the date of acquisition forward.
On July 26, 2018, we received $2 billion in termination compensation from Qualcomm per the terms of the purchase contract.
On February 6, 2017, we divested our Standard Products (“SP”) business, receiving $2.6 billion in cash proceeds, net of cash divested. Prior to February 6, 2017, the results of the SP business were included in the reportable segment SP.
On December 7, 2015, we acquired Freescale Semiconductor, Ltd. (“Freescale”) for a total consideration of $11.6 billion (the “Merger”). The results of their operations and the estimated fair value of the assets acquired and liabilities assumed in the business combination are included in our financial statements from the date of acquisition forward.
The information set forth below for the five years ended December 31, 2019, is not necessarily indicative of results of future operations, and should be read in conjunction with Part II, Item 7, “Management’s Discussion and Analysis of Financial Condition and Results of Operations” and the consolidated financial statements and accompanying notes thereto included in Part II, Item 8 of this Form 10-K to fully understand factors that may affect the comparability of the information presented below.
| As of and for the years ended December 31, | ||||||||||||||
| ($ in millions unless otherwise stated) | 2019 | 2018 | 2017⁽¹⁾ | 2016 | 2015 | |||||||||
| Consolidated statements of operations data: | ||||||||||||||
| Revenue(2) | 8,877 | 9,407 | 9,256 | 9,498 | 6,101 | |||||||||
| Gross profit(3) | 4,618 | 4,851 | 4,619 | 4,069 | 2,787 | |||||||||
| Total operating expenses(4) | (4,002 | ) | (4,142 | ) | (4,092 | ) | (4,228 | ) | (2,035 | ) | ||||
| Other income (expense)(5) | 25 | 2,001 | 1,575 | 9 | 1,263 | |||||||||
| Operating income (loss) | 641 | 2,710 | 2,102 | (150 | ) | 2,015 | ||||||||
| Financial income (expense) | (350 | ) | (335 | ) | (366 | ) | (453 | ) | (529 | ) | ||||
| Net income (loss) attributable to stockholders | 243 | 2,208 | 2,215 | 200 | 1,526 | |||||||||
| Earnings per share data: | ||||||||||||||
| Net income per common share attributable to stockholders in $ | ||||||||||||||
| • Basic | 0.86 | 6.78 | 6.54 | 0.59 | 6.36 | |||||||||
| • Diluted | 0.85 | 6.72 | 6.41 | 0.58 | 6.10 | |||||||||
| Weighted average number of shares of common stock outstanding during the year (in thousands) | ||||||||||||||
| • Basic | 282,056 | 325,781 | 338,646 | 338,477 | 239,764 | |||||||||
| • Diluted | 285,911 | 328,606 | 345,802 | 347,607 | 250,116 | |||||||||
| Cash dividends declared per share(6) | 1.25 | 0.50 | — | — | — | |||||||||
| Cash dividends declared per share in EUR(6) | 1.12 | 0.43 | — | — | — | |||||||||
| Consolidated balance sheet data**(7)****:** | ||||||||||||||
| Cash and cash equivalents | 1,045 | 2,789 | 3,547 | 1,894 | 1,614 | |||||||||
| Total assets | 20,016 | 21,530 | 24,049 | 24,898 | 26,354 | |||||||||
| Net assets | 9,655 | 10,690 | 13,716 | 11,156 | 11,803 | |||||||||
| Working capital(8) | 1,476 | 2,947 | 4,077 | 3,386 | 2,820 | |||||||||
| Total debt(9), (10) | 7,365 | 7,354 | 6,565 | 9,187 | 9,212 | |||||||||
| Total stockholders’ equity | 9,441 | 10,505 | 13,527 | 10,935 | 11,515 | |||||||||
| Common stock | 64 | 67 | 71 | 71 | 68 | |||||||||
| Other operating data: | ||||||||||||||
| Capital expenditures | (526 | ) | (611 | ) | (552 | ) | (389 | ) | (341 | ) | ||||
| Depreciation and amortization(11) | 2,047 | 1,987 | 2,173 | 2,205 | 517 | |||||||||
| Consolidated statements of cash flows data: | ||||||||||||||
| Net cash provided by (used for): | ||||||||||||||
| Operating activities | 2,373 | 4,369 | 2,447 | 2,303 | 1,330 | |||||||||
| Investing activities | (2,284 | ) | (522 | ) | 2,072 | (627 | ) | (430 | ) | |||||
| Financing activities(12) | (1,831 | ) | (4,597 | ) | (2,886 | ) | (1,392 | ) | (449 | ) | ||||
| Increase (decrease) in cash and cash equivalents | (1,742 | ) | (750 | ) | 1,633 | 284 | 451 |
| (1) | Reflects the results of the SP business up to the February 6, 2017 divestment. |
| (2) | Under the modified retrospective method, revenue amounts before January 1, 2018 have not been adjusted for the impact of adopting ASC 606. |
| (3) | Gross profit in 2019 includes a charge of $8 million resulting from the purchase accounting effect on the inventory acquired from Marvell. In 2016 gross profit includes a charge of $448 million (2015: $149 million), resulting from the purchase accounting effect on the inventory acquired from Freescale. |
| (4) | In 2019, total operating expenses include charges related to the acquisition of Marvell as follows - $7 million for the amortization of acquisition-related intangibles and $5 million of acquisition related costs. Total operating expenses in 2016 include charges related to the acquisition of Freescale as follows - $1,430 million for the amortization of acquisition-related intangibles, which includes an impairment charge of $89 million relative to in-process research and development (IPR&D) that was acquired from Freescale, and $53 million of merger and integration related costs. In 2015, total operating expenses include charges related to the acquisition of Freescale as follows - $226 million in restructuring charges, $105 million for the amortization of acquisition-related intangibles, $49 million of share-based compensation charges related to employees terminated as a result of the Merger and $42 million of merger related costs. |
| (5) | Other income (expense) in 2018 includes the termination compensation received from Qualcomm ($2 billion). Other income (expense) in 2017 includes the recognition of the gain on the sale of our SP business ($1,597 million). Other income (expense) in 2015 includes the recognition of the gains from the sale of our Bipolar business on November 9, 2015 and the sale of our RF Power business on December 7, 2015. See the section on Other Significant Transactions in Part I, Item 1. Business. |
| (6) | Reflects the interim dividends declared under the previously announced Quarterly Dividend Program. |
| (7) | Consolidated balance sheet data as of 2019 includes the impact of purchase accounting on the assets acquired and liabilities assumed in connection with our acquisition of Marvell and as of 2015 includes the impact of purchase accounting on the assets acquired and liabilities assumed in connection with our acquisition of Freescale. |
| (8) | Working capital is calculated as current assets less current liabilities (excluding short-term debt). |
| (9) | On June 18, 2019, NXP entered into two new senior unsecured notes, which are due in 2026 ($750 million) and 2029 ($1 billion). NXP used the net proceeds for general corporate purposes as well as the repayment of the $600 million outstanding aggregate principal amount of 2020 senior notes. In addition, in December 2019 NXP fully repaid the $1.15 billion 2019 cash convertible senior notes. On December 6, 2018, NXP entered into 3 new senior unsecured notes, which are due in 2024 ($1 billion), 2026 ($500 million) and 2028 ($500 million). NXP used the net proceeds for general corporate purposes as well as the repayment of the $1 billion senior unsecured bridge term credit facility agreement (the “Bridge Loan”), which was entered into on September 19, 2018 for general corporate purposes as well as to finance parts of the announced equity buy-back program. In April 2018, NXP fully repaid the $750 million senior unsecured notes on the due date. In addition, NXP fully repaid the $500 million senior unsecured notes due in 2023. In February 2017, NXP repaid all term loans, including Term Loan B (defined below), with the funds from the proceeds of the divestment of the SP business. Additionally, $500 million was repaid on the 2021 unsecured senior notes in March 2017. On December 7, 2015, in connection with the Merger, NXP entered into a $2.7 billion secured term loan (“Term Loan B”). Proceeds from Term Loan B, among others, were used to (i) pay the cash consideration in connection with the Merger, (ii) effect the repayment of certain amounts under Freescale’s outstanding credit facility and (iii) pay certain transaction costs. |
| (10) | The following is a reconciliation of net debt to the most directly comparable GAAP measure, total debt, as adjusted for our cash and cash equivalents our net debt was calculated as follows: |
| ($ in millions) | 2019 | 2018 | 2017 | 2016 | 2015 | |||||||||
| Long-term debt | 7,365 | 6,247 | 5,814 | 8,766 | 8,656 | |||||||||
| Short-term debt | — | 1,107 | 751 | 421 | 556 | |||||||||
| Total debt | 7,365 | 7,354 | 6,565 | 9,187 | 9,212 | |||||||||
| Less: cash and cash equivalents | (1,045 | ) | (2,789 | ) | (3,547 | ) | (1,894 | ) | (1,614 | ) | ||||
| Net debt | 6,320 | 4,565 | 3,018 | 7,293 | 7,598 |
Net debt is a non-GAAP financial measure. See “Use of Certain Non-GAAP Financial Measures” under Part II, Item 7. Management’s Discussion and Analysis of Financial Condition and Results of Operations.
| (11) | Depreciation and amortization includes the effect of purchase accounting related to acquisitions in certain years. The effect of purchase accounting in depreciation and amortization was $1,528 million in 2019, $1,535 million in 2018, $1,741 million in 2017, $1,782 million (which includes an impairment charge of $89 million relative to IPR&D that was acquired from Freescale) in 2016 and $252 million in 2015. |
| (12) | Financing activities includes the repurchases of NXP common stock in 2019 ($1,443 million) and in 2018 ($5,006 million) and the distribution of cash dividends in 2019 ($319 million) and in 2018 ($74 million). |
As used in this Annual Report, “euro”, or “€” means the single unified currency of the European Monetary Union. “U.S. dollar”, “USD”, “U.S. $” or “$” means the lawful currency of the United States of America. As used in this Annual Report, the term “noon buying rate” refers to the exchange rate for euro, expressed in U.S. dollars per euro, as announced by the Federal Reserve Bank of New York for customs purposes as the rate in the city of New York for cable transfers in foreign currencies.
The table below shows the average noon buying rates for U.S. dollars per euro for the five years ended December 31, 2019. The averages set forth in the table below have been computed using the noon buying rate on the next to last business day of each fiscal month during the periods indicated.
| Year ended December 31, | ||||||||||||||
| 2019 | 2018 | 2017 | 2016 | 2015 | ||||||||||
| Average $ per € | 1.1210 | 1.1794 | 1.1310 | 1.1065 | 1.1150 |
Fluctuations in the value of the euro relative to the U.S. dollar have had a significant effect on the translation into U.S. dollar of our euro-denominated assets, liabilities, revenue and expenses, and may continue to do so in the future. For further information on the impact of fluctuations in exchange rates on our operations, see the “Fluctuations in Foreign Rates May Have An Adverse Effect On Our Financial Results” section in Part I, Item 1A. Risk Factors and the “Foreign Currency Risks” section in Part II, Item 7A. Quantitative and Qualitative Disclosures About Market Risk.
Item 7. Management’s Discussion and Analysis of Financial Condition and Results of Operations
Management’s discussion and analysis of financial condition and results of operations (MD&A) should be read in conjunction with the financial statements and the related notes that appear elsewhere in this document. This section of this Form 10-K generally discusses 2019 and 2018 items and year-to-year comparisons between 2019 and 2018*. Discussions of* 2017 items and year-to-year comparisons between 2018 and 2017 that are not included in this Form 10-K can be found in Part I, Item 5.A. "Operating Results" of our Form 20-F for the fiscal year ended December 31, 2018 as filed with the SEC on March 1, 2019.
Our MD&A is provided in addition to the accompanying consolidated financial statements and notes to assist readers in understanding our results of operations, financial condition and cash flows. MD&A is organized as follows:
| • | Overview - Overall analysis of financial and other highlights to provide context for the MD&A |
| • | Results of Operations - An analysis of our financial results |
| • | Financial Condition, Liquidity and Capital Resources - An analysis of changes in our balance sheets and cash flows and a discussion of our financial condition and potential sources of liquidity |
| • | Critical Accounting Estimates - Accounting estimates that management believes are the most important to understanding the assumptions and judgments incorporated in our financial results and forecasts |
| • | Use of Certain Non-GAAP Financial Measures - A discussion of the non-GAAP measures used |
Effective January 1, 2019, NXP removed the reference to HPMS in its organizational structure in acknowledgment of the one reportable segment representing the entity as a whole. Our segment represents groups of similar products that are combined on the basis of similar design and development requirements, product characteristics, manufacturing processes and distribution channels, and how management allocates resources and measures results. See Note 1 to the financial statements for more information regarding our segment.
Overview
| ($ in millions, unless otherwise stated) | Three Months Ended | Years Ended | |||||||||||||||
| December 31, 2019 | September 29, 2019 | Increase/(decrease) | December 31, 2019 | December 31, 2018 | Increase/(decrease) | ||||||||||||
| Revenue | 2,301 | 2,265 | 36 | 8,877 | 9,407 | (530 | ) | ||||||||||
| Gross profit | 1,209 | 1,186 | 23 | 4,618 | 4,851 | (233 | ) | ||||||||||
| Operating income (loss) | 197 | 233 | (36 | ) | 641 | 2,710 | (2,069 | ) | |||||||||
| Cash flow from operating activities | 814 | 746 | 68 | 2,373 | 4,369 | (1,996 | ) | ||||||||||
| Total debt | 7,365 | 8,505 | (1,140 | ) | 7,365 | 7,354 | 11 | ||||||||||
| Net debt | 6,320 | 4,968 | 1,352 | 6,320 | 4,565 | 1,755 | |||||||||||
| Diluted weighted average number of shares outstanding | 285,518 | 283,518 | 2,000 | 285,911 | 328,606 | (42,695 | ) | ||||||||||
| Diluted net income per share | 0.40 | 0.38 | 0.02 | 0.85 | 6.72 | (5.87 | ) | ||||||||||
| Dividends per common share | 0.375 | 0.375 | — | 1.25 | 0.50 | 0.75 |
Revenue for 2019 was down 5.6% from 2018 against a very challenging semiconductor industry backdrop. Revenues decreased by 7% in our largest end market, Automotive, and 12% in our Industrial and IOT end market which were slightly offset by an increase of 5% in the Communications & Infrastructure end market and a 2% increase in the Mobile end market. When aggregating all end markets, the decrease in revenue was mostly related to lower sales to distributors due to lower end customer demand, in particular in Greater China (including Asia Pacific).
Notwithstanding the challenging operating environment, we continue to successfully execute our strategy within our target markets and focus on driving profitability. Our gross profit percentage for 2019 increased from 51.6% to 52.0%, due to a slightly more favorable end-market and customer mix and also due to the benefit of certain manufacturing cost controls.
NXP’s fourth quarter revenue of $2,301 million increased 1.6% sequentially from the third quarter of 2019. This was driven primarily by an increase of 5% in the Automotive end-market and a 3% increase in the mobile end-market, these increases were offset by a 3% decline in each of the other two end markets. We continue to believe that the demand trends within our end markets are beginning to improve.
Over the course of 2019, we significantly enhanced our product portfolio. At the end of the year, we announced the completion of the acquisition of the Marvell wireless connectivity assets and with that introduced new product solutions. Our customers have already begun to adopt many of the new solutions which we anticipate will help to underpin NXP's long-term growth.
We continue to generate strong operating cash flows, with $2,373 million in cash flows from operations for 2019. We returned $1,762 million to our shareholders during the year in dividends and repurchases of common stock. On August 29, 2019, we announced an increase in our quarterly dividend by $0.125, or 50%, to $0.375 per common share. Our cash position at the end of 2019 was $1,045 million. On November 19, 2019, the NXP Board of Directors approved a cash dividend of $0.375 per common share for the fourth quarter of 2019.
Results of Operations
The following table presents the composition of operating income for the years ended December 31, 2019 and December 31, 2018.
| ($ in millions, unless otherwise stated) | 2019 | 2018 | |||
| Revenue | 8,877 | 9,407 | |||
| % nominal growth | (5.6 | ) | 1.6 | ||
| Gross profit | 4,618 | 4,851 | |||
| Research and development | (1,643 | ) | (1,700 | ) | |
| Selling, general and administrative (SG&A) | (924 | ) | (993 | ) | |
| Amortization of acquisition-related intangible assets | (1,435 | ) | (1,449 | ) | |
| Other income (expense) | 25 | 2,001 | |||
| Operating income (loss) | 641 | 2,710 |
Revenue
Revenue for the year-ended December 31, 2019 was $8,877 million compared to $9,407 million for the year-ended December 31, 2018, a decrease of $530 million or 5.6%. As of January 1, 2019, income and expenses derived from manufacturing service arrangements (“MSA”) and transitional service arrangements (“TSA”) that are put into
place when we divest a business or activity, are included in other income (expense). In 2018, revenue related to these divested activities was $136 million The remaining decrease is essentially related to lower sales in our Automotive and in our Industrial & IOT end markets, which were in particular impacted by the trade tensions between the United States and China.
Revenue by end-market was as follows:
| ($ in millions, unless otherwise stated) | 2019 | 2018 | Increase/(decrease) | % | |||||||
| Automotive | 4,212 | 4,507 | (295 | ) | (6.5 | )% | |||||
| Industrial & IoT | 1,599 | 1,813 | (214 | ) | (11.8 | )% | |||||
| Mobile | 1,191 | 1,164 | 27 | 2.3 | % | ||||||
| Communication Infrastructure & Other | 1,875 | 1,787 | 88 |
Showing the first 8K of 64K characters. Open the full section
Item 7A. Quantitative and Qualitative Disclosures About Market Risk
We are exposed to changes in interest rates and foreign currency exchange rates because we finance certain operations through fixed and variable rate debt instruments and denominate our transactions in a variety of foreign currencies. Changes in these rates may have an impact on future cash flow and earnings. We manage these risks through normal operating and financing activities and, when deemed appropriate, through the use of derivative financial instruments. We do not enter into financial instruments for trading or speculative purposes.
By using derivative instruments, we are subject to credit and market risk. The fair market value of the derivative instruments is determined by using valuation models whose inputs are derived using market observable inputs, including interest rate yield curves, as well as foreign exchange and commodity spot and forward rates, and reflects the asset or liability position as of the end of each reporting period. When the fair value of a derivative contract is positive, the counterparty owes us, thus creating a receivable risk for us. We are exposed to counterparty credit risk in the event of non-performance by counterparties to our derivative agreements. We minimize counterparty credit (or repayment) risk by entering into transactions with major financial institutions of investment grade credit rating. Our exposure to market risk is not hedged in a manner that completely eliminates the effects of changing market conditions on earnings or cash flow.
Interest Rate Risk
Our RCF Agreement has a $1,500 million borrowing capacity with a floating rate interest. As there are currently no borrowings under this facility, a hypothetical increase in LIBOR based interest rates would not have caused any change to our interest expense on our floating rate debt.
Additional information regarding our notes is provided in Note 2 - Significant Accounting Policies, and Note 14 - Debt, of our notes to the Consolidated Financial Statements included in Item 8. of this Annual Report is incorporated herein by reference.
Foreign Currency Risks
We are also exposed to market risk from changes in foreign currency exchange rates, which could affect operating results as well as our financial position and cash flows. We monitor our exposures to these market risks and generally employ operating and financing activities to offset these exposures where appropriate. If we do not have operating or financing activities to sufficiently offset these exposures, from time to time, we may employ derivative financial instruments such as swaps, collars, forwards, options or other instruments to limit the volatility to earnings and cash flows generated by these exposures. Derivative financial instruments are only used for hedging purposes and not for trading or speculative purposes. Counterparties to our derivatives
contracts are all major banking institutions. In the event of financial insolvency or distress of a counterparty to our derivative financial instruments, we may be unable to settle transactions if the counterparty does not provide us with sufficient collateral to secure its net settlement obligation to us, which could have a negative impact on our results. The Company measures all derivative financial instruments based on fair values derived from market prices of the instruments or from option pricing models, as appropriate and record these as assets or liabilities in the balance sheet. Changes in the fair values are recognized in the statement of operations immediately unless cash flow hedge accounting is applied. A summary of our foreign currency accounting policies is provided in Note 2 - Significant Accounting Policies, of our notes to the Consolidated Financial Statements included in Item 8. of this Annual Report is incorporated herein by reference.
At December 31, 2019 our net asset related to foreign currency forward contracts designated as hedges of foreign currency risk on certain operating expenditure transactions was $9 million. If our forecasted operating expenditures for currencies in which we hedge were to decline by 20% and foreign exchange rates were to change unfavorably by 20% in our hedged foreign currency, we would incur a negligible loss.
Financial assets and liabilities held by consolidated subsidiaries that are not denominated in the functional currency of those entities are subject to the effects of currency fluctuations and may affect reported earnings. As a global company, we face exposure to adverse movements in foreign currency exchange rates. We may hedge currency exposures associated with certain assets and liabilities denominated in nonfunctional currencies and certain anticipated nonfunctional currency transactions. As a result, we could experience unanticipated gains or losses on anticipated foreign currency cash flows, as well as economic loss with respect to the recoverability of investments.
Our primary foreign currency exposure relates to the U.S. dollar to euro exchange rate. However, our foreign currency exposures also relate, but are not limited, to the Chinese Yuan, the Japanese Yen, the Pound Sterling, the Malaysian Ringgit, the Singapore Dollar, the Taiwan Dollar and the Thailand Baht.
Item 8. Financial Statements and Supplementary Data
List of Financial Statements
| Report of independent registered public accounting firm | 57 |
| Consolidated Statements of Operations | 60 |
| Consolidated Statements of Comprehensive Income | 61 |
| Consolidated Balance Sheets | 62 |
| Consolidated Statements of Cash Flows | 63 |
| Consolidated Statements of Changes in Equity | 65 |
| Notes to the Consolidated Financial Statements | 66 |
| Supplementary Financial Data (unaudited) | 110 |
Report of Independent Registered Public Accounting Firm
To the Stockholders and Board of Directors
NXP Semiconductors N.V.
Opinions on the Consolidated Financial Statements and Internal Control over Financial Reporting
We have audited the accompanying consolidated balance sheets of NXP Semiconductors N.V. and subsidiaries (the Company) as of December 31, 2019 and 2018, the related consolidated statements of operations, comprehensive income, cash flows and changes in equity for each of the years in the three-year period ended December 31, 2019, and the related notes (collectively, the consolidated financial statements). We also have audited the Company’s internal control over financial reporting as of December 31, 2019, based on criteria established in Internal Control - Integrated Framework (2013) issued by the Committee of Sponsoring Organizations of the Treadway Commission.
In our opinion, the consolidated financial statements referred to above present fairly, in all material respects, the financial position of the Company as of December 31, 2019 and 2018, and the results of its operations and its cash flows for each of the years in the three-year period ended December 31, 2019, in conformity with U.S. generally accepted accounting principles. Also in our opinion, the Company maintained, in all material respects, effective internal control over financial reporting as of December 31, 2019 based on criteria established in Internal Control - Integrated Framework (2013) issued by the Committee of Sponsoring Organizations of the Treadway Commission.
Basis for Opinions
The Company’s management is responsible for these consolidated financial statements, for maintaining effective internal control over financial reporting, and for its assessment of the effectiveness of internal control over financial reporting, included in the accompanying Management’s Report on Internal Control over Financial Reporting. Our responsibility is to express an opinion on the Company’s consolidated financial statements and an opinion on the Company’s internal control over financial reporting based on our audits. We are a public accounting firm registered with the Public Company Accounting Oversight Board (United States) (PCAOB) and are required to be independent with respect to the Company in accordance with the U.S. federal securities laws and the applicable rules and regulations of the Securities and Exchange Commission and the PCAOB.
We conducted our audits in accordance with the standards of the PCAOB. Those standards require that we plan and perform the audits to obtain reasonable assurance about whether the consolidated financial statements are free of material misstatement, whether due to error or fraud, and whether effective internal control over financial reporting was maintained in all material respects.
Our audits of the consolidated financial statements included performing procedures to assess the risks of material misstatement of the consolidated financial statements, whether due to error or fraud, and performing procedures that respond to those risks. Such procedures included examining, on a test basis, evidence regarding the amounts and disclosures in the consolidated financial statements. Our audits also included evaluating the accounting
principles used and significant estimates made by management, as well as evaluating the overall presentation of the consolidated financial statements. Our audit of internal control over financial reporting included obtaining an understanding of internal control over financial reporting, assessing the risk that a material weakness exists, and testing and evaluating the design and operating effectiveness of internal control based on the assessed risk. Our audits also included performing such other procedures as we considered necessary in the circumstances. We believe that our audits provide a reasonable basis for our opinions.
Definition and Limitations of Internal Control over Financial Reporting
A company’s internal control over financial reporting is a process designed to provide reasonable assurance regarding the reliability of financial reporting and the preparation of financial statements for external purposes in accordance with U.S. generally accepted accounting principles. A company’s internal control over financial reporting includes those policies and procedures that (1) pertain to the maintenance of records that, in reasonable detail, accurately and fairly reflect the transactions and dispositions of the assets of the company; (2) provide reasonable assurance that transactions are recorded as necessary to permit preparation of financial statements in accordance with generally accepted accounting principles, and that receipts and expenditures of the company are being made only in accordance with authorizations of management and directors of the company; and (3) provide reasonable assurance regarding prevention or timely detection of unauthorized acquisition, use, or disposition of the company’s assets that could have a material effect on the financial statements.
Because of its inherent limitations, internal control over financial reporting may not prevent or detect misstatements. Also, projections of any evaluation of effectiveness to future periods are subject to the risk that controls may become inadequate because of changes in conditions, or that the degree of compliance with the policies or procedures may deteriorate.
Critical Audit Matters
The critical audit matters communicated below are matters arising from the current period audit of the consolidated financial statements that were communicated or required to be communicated to the audit committee and that: (1) relate to accounts or disclosures that are material to the consolidated financial statements and (2) involved our especially challenging, subjective, or complex judgments. The communication of critical audit matters does not alter in any way our opinion on the consolidated financial statements, taken as a whole, and we are not, by communicating the critical audit matters below, providing separate opinions on the critical audit matters or on the accounts or disclosures to which they relate.
Evaluation of fair value of certain intangible assets acquired in Marvell business acquisition
As discussed in Note 3 to the consolidated financial statements, on December 6, 2019, the Company acquired Marvell’s Wireless WiFi Connectivity Business Unit, Bluetooth technology portfolio and related assets (“Marvell”) in a business combination for net consideration of $1,705 million. The assets acquired included amongst others $324 million of developed technology and $170 million of in-process R&D. Management valued these intangible assets on a preliminary basis using the multi-period excess earnings method under the income approach. This method reflects the present values of the projected cash flows that are expected to be generated by the developed technology and in-process R&D less charges representing the contribution of other assets to those cash flows.
We identified the evaluation of the preliminary acquisition date fair values of the developed technology and in
Showing the first 8K of 183K characters. Open the full section
Item 9. Changes in and Disagreements With Accountants on Accounting and Financial Disclosure
Not applicable.
Item 9A. Controls and Procedures
Disclosure Controls and Procedures
As of the end of the period covered by this Annual Report, our management, with the participation of our chief executive officer and chief financial officer, conducted an evaluation pursuant to Rule 13a-15(e) and 15d-15(e) of the Exchange Act of the effectiveness of the design and operation of our disclosure controls and procedures. Based on this evaluation, our chief executive officer and chief financial officer concluded that as of the end of the period covered by this Annual Report such disclosure controls and procedures were effective to provide reasonable assurance that information required to be disclosed in reports we filed or submitted under the Exchange Act was recorded, processed, summarized and reported within the time periods specified in the rules and forms of the SEC, and included controls and procedures designed to ensure that information required to be disclosed in such reports was accumulated and communicated to our management, including our chief executive officer and chief financial officer, as appropriate to allow timely decisions regarding required disclosure.
Management’s Report on Internal Control over Financial Reporting
The Company’s management is responsible for establishing and maintaining adequate internal control over financial reporting as defined in Rules 13a-15(f) and 15(d)-15(f) of the Exchange Act. The Company’s internal control over financial reporting is designed to provide reasonable assurance, not absolute assurance, regarding the reliability of financial reporting and the preparation of financial statements for external purposes in accordance with U.S. generally accepted accounting principles.
Because of its inherent limitations, internal control over financial reporting may not prevent or detect all misstatements. Moreover, projections of any evaluation of effectiveness to future periods are subject to the risk that controls may become inadequate because of changes in conditions, or that the degree of compliance with the policies or procedures may deteriorate.
Our management assessed the effectiveness of the Company’s internal control over financial reporting as of December 31, 2019 based on the criteria established in “Internal Control - Integrated Framework (2013)” by the Committee of Sponsoring Organizations of the Treadway Commission (COSO). Based on that assessment our management concluded that our internal control over financial reporting was effective as of December 31, 2019.
It should be noted that any control system, regardless of how well it is designed and operated, can provide only reasonable, not absolute, assurance that its objectives will be met. Control systems can be circumvented by the individual acts of some persons, by collusion of two or more people, or by management override of the control. In addition, controls may become inadequate because of changes in conditions, or the degree of compliance with the policies or procedures may deteriorate. Because of these and other inherent limitations of control systems, there can be no assurance that any design will succeed in achieving its stated goals under all potential future conditions, regardless of how remote.
The Company’s independent registered public accounting firm, KPMG Accountants N.V., has issued an audit report on the Company’s internal control over financial reporting, which appears in Part II, Item 8 of this Form 10-K.
Changes in Internal Control Over Financial Reporting
There were no changes in the Company's internal control over financial reporting during the three and twelve month periods ended December 31, 2019, which were identified in connection with management's evaluation required by paragraph (d) of Rules 13a-15 and 15d-15 under the Exchange Act that have materially affected, or are reasonably likely to materially affect, our internal control over financial reporting.
Item 9B. Other Information
Not applicable.
PART III
Item 10. Directors, Executive Officers and Corporate Governance
Information regarding our directors and executive officers appears under the captions "Board of Directors" and "Executive Officers," respectively, in Part I, Item 1 of this report.
Information regarding certain corporate governance and other matters appearing under the captions "Corporate Governance," "How our Board Governs and Is Governed" and "Proposal 3: (Re-)appointment of Directors," in the 2020 Proxy Statement to be filed with the SEC within 120 days after December 31, 2019 in connection with the solicitation of proxies for the Company’s 2020 annual meeting of shareholders, are incorporated herein by reference.
The Rules Governing the Board adopted by our Board of Directors, as well as the charters of each of the Audit Committee, the Governance and Nominating Committee and the Compensation Committee and the Code of Ethics are posted on the "Investors—Corporate Governance" section of our website at www.nxp.com.
Item 11. Executive Compensation
The sections entitled “Executive Compensation” and “Non-Employee Director Compensation” in our 2020 Proxy Statement to be filed with the SEC within 120 days after December 31, 2019, are incorporated herein by reference.
Item 12. Security Ownership of Certain Beneficial Owners and Management and Related Stockholder Matters
The sections entitled “Security Ownership of Certain Beneficial Owners and Management” and “Equity Compensation Plan Information” in our 2020 Proxy Statement to be filed with the SEC within 120 days after December 31, 2019, are incorporated herein by reference.
Item 13. Certain Relationships and Related Transactions, and Director Independence
The information under the caption "Information About the Board of Directors and Corporate Governance Matters—Independent Directors" and "Information About the Board of Directors and Corporate Governance Matters—Certain Relationships and Related Party Transactions" in the 2020 Proxy Statement to be filed with the SEC within 120 days after December 31, 2019, are incorporated herein by reference.
Item 14. Principal Accounting Fees and Services
The information under the captions "Independent Registered Public Accounting Firm," “Auditors' fees,” "Audit Committee Pre-Approval Policies" and "Proposal 8: Appointment of Ernst and Young, LLP as the Company's Independent Auditors for a three-year period starting with the 2020 Fiscal Year" in the 2020 Proxy Statement to be filed with the SEC within 120 days after December 31, 2019, are incorporated herein by reference.
Part IV
Item 15. Exhibits and Financial Statement Schedules
(a) 1. Financial Statements:
See "List of Financial Statements" within the Consolidated Financial Statements
(a) 2. Financial Statement Schedules:
Not applicable or the required information is otherwise included in the Consolidated Financial Statements and accompanying notes.
(a) 3. Exhibits:
The exhibits listed on the index below are filed as part of, or hereby incorporated by reference into, this Form 10-K.
| 101 | The following financial information from the Company’s Annual Report on Form 10-K for the year ended December 31, 2019, formatted in iXBRL (Inline eXtensible Business Reporting Language): (i) Consolidated Statements of Operations; (ii) Consolidated Statements of Comprehensive Income; (iii) Consolidated Balance Sheets; (iv) Consolidated Statements of Cash Flows; (v) Consolidated Statements of Changes in Equity; and (vi) Notes to the Consolidated Financial Statements | |
| 104 | Cover Page Interactive Data File (formatted as Inline XBRL and contained in Exhibit 101) | |
| * | Filed or furnished herewith. | |
| + | Indicates management contract or compensatory plan or arrangements. |
Item 16. Form 10-K Summary
Not applicable.
SIGNATURES
Pursuant to the requirements of Section 13 or 15(d) of the Securities Exchange Act of 1934, the registrant has duly caused this report to be signed on its behalf by the undersigned, thereunto duly authorized.
| Date: February 27, 2020 | ||
| NXP Semiconductors N.V. | ||
| By: | /s/ PETER KELLY | |
| Peter Kelly, Executive Vice President and Chief Financial Officer | ||
Power of Attorney
KNOW ALL PERSONS BY THESE PRESENTS, that each person whose signature appears below hereby constitutes and appoints each of Jennifer Wuamett and Jean A.W. Schreurs, as his or her true and lawful attorney-in-fact and agent, with full power of substitution and re-substitution, for him or her and in his or her name, place and stead, in any and all capacities, in connection with this Annual Report on Form 10-K, to sign any and all amendments to the Form 10-K, and to file the same, with all exhibits thereto, and other documents in connection therewith, with the Securities and Exchange Commission, granting unto said attorneys-in-fact and agents, each acting alone, full power and authority to do and perform each and every act and thing requisite and necessary to be done in and about the premises, as fully to all intents and purposes as he or she might or could do in person, hereby ratifying and confirming all that said attorneys-in-fact and agents, or their substitutes or substitute, may lawfully do or cause to be done by virtue hereof.
Pursuant to the requirements of the Securities Exchange Act of 1934, this report has been signed below by the following persons in the capacities indicated on February 27, 2020.
| /s/RICHARD L. CLEMMER | /s/PETER KELLY | |
| Richard L. Clemmer | Peter Kelly | |
| Executive Director and Chief Executive Officer | Executive Vice President and Chief Financial Officer | |
| (Principal Executive Officer) | (Principal Financial Officer, Principal Accounting Officer) | |
| /s/SIR PETER BONFIELD | /s/KENNETH A. GOLDMAN | |
| Sir Peter Bonfield | Kenneth A. Goldman | |
| Non-executive Director and Chairman of the Board | Non-executive Director | |
| /s/JOSEF KAESER | /s/LENA OLVING | |
| Josef Kaeser | Lena Olving | |
| Non-executive Director | Non-executive Director | |
| /s/PETER SMITHAM | /s/JULIE SOUTHERN | |
| Peter Smitham | Julie Southern | |
| Non-executive Director | Non-executive Director | |
| /s/JASMIN STAIBLIN | /s/GREGORY L. SUMME | |
| Jasmin Staiblin | Gregory L. Summe | |
| Non-executive Director | Non-executive Director | |
| /s/KARL-HENRIK SUNDSTRÖM | ||
| Karl-Henrik Sundström | ||
| Non-executive Director | ||